Abstract
Accurately predicting changes in the potential distribution of crops resulting from climate change has great significance for adapting to and mitigating the impacts of climate change and ensuring food security. After understanding the spatial and temporal suitability of wheat (Triticum aestivum), rice (Oryza sativa), and maize (Zea mays), as well as the main bioclimatic variables affecting crop growth, we used the MaxEnt model. The accuracy of the MaxEnt was extremely significant, with mean AUC (area under curve) values ranging from 0.876 to 0.916 for all models evaluated. The results showed that for wheat, annual mean temperature (Bio-1) and mean temperature of the coldest quarter (Bio-11) contributed 39.2% and 13.4%, respctively; for rice, precipitation of the warmest quarter (Bio-18) and elevation contributed 34.9% and 19.9%, respectively; and for maize, Bio-1 and precipitation of the driest quarter (Bio-17) contributed 36.3% and 14.3%, respectively. The map drawn indicates that the suitability of wheat, rice, and corn in South Asia may change in the future. Understanding the future distribution of crops can help develop transformative climate change adaptation strategies that consider future crop suitability. The study showed an average significant improvement in high-suitable areas of 8.7%, 30.9%, and 13.1%, for wheat, rice, and maize, respectively; moderate-suitable area increases of 3.9% and 8.6% for wheat and rice, respectively; and a decrease of −8.3% for maize as compared with the current values. The change in the unsuitable areas significantly decreases by −2.5%, −13.5%, and −1.7% for wheat, rice, and maize, respectively, compared to current land suitability. The results of this study are crucial for South Asia as they provide policy-makers with an opportunity to develop appropriate adaptation and mitigation strategies to sustain wheat, rice, and corn production in future climate scenarios.
1. Introduction
Global climate change, rising global temperatures, uneven rainfall distribution, and extreme weather, is considered one of the main factors that is affecting global socio-economic development and nature conservation [1,2]. Several studies have revealed that global warming will reduce the crop production of wheat and rice in South Asia, which is a serious threat to food security and sustainable development [3,4]. Climate change is likely to affect the crop distributions [5], which is likely to have a significant influence on global food production. In rural agricultural communities, climate change will greatly affect food and nutritional security [6]. Climate change will alter the existing suitability of regions for specific crops and affect their development, growth, and production [7,8]. Predicting the potential land suitability of crops is a key issue for accurately assessing the impact of climate change on crop distribution. However, there is relatively little research on the impact of climate change on potential land suitability dynamics.
Land distribution is often seen as a combination of land characteristics and crop demand [9]. The climate conditions, soil quality, water availability, and land characteristics of a region are the most essential factors for a crop land suitability assessment [10]. To assess the potential land suitability of wheat, rice, and corn, it is essential to establish a function to analyze the relationship between land suitability and these factors. In recent years, the latest advances in remote sensing and geographic information technology have made it possible for multiple modeling programs to analyze crop land suitability under climate change [11]. The species distribution model is considered an empirical tool in ecology and natural resource management, and its use in predicting species existence based on the correlation between ecological variables and geographically located species data has been considered important [12]. MaxEnt is one of the most popular niche-based methods for modeling geographical crop distribution [12]. Based on detailed occurrence records and consideration of ecological variables that may affect the target species, the relationship between them can be assessed by using the MaxEnt model [13]. Furthermore, MaxEnt also predicts the spatial and temporal potential species distribution [14,15]. The MaxEnt model has been used to categorize hotspots of potential hazards of invasive species, assess threatened species, predict biodiversity, and identify potential regions for species cultivation in response to climate change [16].
However, global climate change may have considerable influence on future wheat and rice production. For example, it has been proven that rising temperatures can reduce the grain yield of rice and wheat [17]. Furthermore, the intensification of meteorological droughts caused by global warming has had a negative impact on the yield of corn and many other crops [18,19]. In order to meet the global food demand, finding potential suitable areas for wheat, rice, and corn cultivation in the future has become a problem that needs to be addressed [20]. The MaxEnt model involves organizing crops occurrence data, linking these occurrences to land and bioclimatic variables and creating maps that forecast past, present, and future distributions of species [21,22]. They link environmental variables with phylogenetic records to gain a deeper understanding of ecological drivers and help to forecast large-scale agricultural and ecological suitability [23]. The MaxEnt model can handle sparse, irregularly sampled data and small positional errors well. Zheng et al. [24] successfully utilized the MaxEnt model to identify corn-suitable regions in Kenya. Additionally, Bunn et al. [25] drew a land suitability map for rice. Akpoti et al. (2020) [1] drew a recommendation area map to expand wheat crop under the climate change adaptation strategies.
Wheat and rice are important food crops. From the perspective of South Asia, there is an urgent need to narrow the supply–demand gap in order to maintain the supply of wheat and rice in the South Asian market. So far, research on wheat and rice has mainly focused on growth and development [26], production [27], physiological responses [28,29], and farming and management [30]. Thus, it is essential to balance the suitability of wheat and rice, as well as the current and future suitable distribution ranges. This study attempts to address this issue using the MaxEnt model, which uses bioclimatic variables to predict potential planting areas for different crops with occurrence data [31]. This model is the most widely used for predicting land suitability, with a high accuracy [32]. The goal is to optimize the planting layout of wheat, corn, and rice in areas with limited land resources, in order to efficiently generate social, ecological, and economic profits.
Wheat, rice, and corn play important roles in maintaining global food security [33]. Although studies have revealed that the production of these crops can be affected by climate change [34,35], the dynamic changes in the potential land suitability of wheat, rice, and corn caused by climate change have not been studied in South Asia. The purpose of this research is to study the following: (1) What are the main climatic factors that affect the geographical range of wheat, rice, and corn? (2) Which regions are more appropriate for the growth of wheat, rice, and corn under the current climate conditions? (3) How will the future climate (2020–2100) affect habitats, thereby affecting the potential distribution of wheat, rice, and corn? (4) Determination of the spatial climate suitability changes for wheat, rice, and corn production in South Asia. This research will help decision-makers determine the magnitude of area expansion for wheat, rice, and corn to maintain future regional food security.
2. Materials and Methods
2.1. Study Site and Species Occurrence Record
South Asia includes 8 countries (Figure 1), with a geographic range of 114°09′–122°43′ E and 34°22′–38°23′ N. Areas of study include eight countries such as Afghanistan, Pakistan, India, Nepal, Sri-Lanka, Bangladesh, the Maldives, and Bhutan. This region has a variety of geographic and climatic types, namely dry-land, desert, subtropical and tropical, mountain, alpine, and humid climates. South Asia includes tropical and subtropical regions, with various climate zones in the west, temperate zones in northern India and Nepal, and arid regions in eastern India, Pakistan, and Afghanistan. In this study, we estimated distribution models using public databases collecting current distribution data for wheat, rice, and maize. Global distribution data for wheat, rice, and maize were collected from the GBIF database (GBIF, 2021). In addition, we subsequently reviewed this data set critically from records on the GBIF database and manually removed unreliable and ambiguous records through the “Description of Occurrence” column for unconfirmed species identification. Afterwards, we excluded duplicate records and records with imprecise geographical location definitions (uncertainty greater than 104 m) for a more reliable evaluation. After this screening, we obtained a total of 924 records of wheat existence, 1996 records of rice existence, and 332 records of corn existence. Figure 1 shows the general distribution of crop occurrence records. The occurrence records were used to produce present and future distribution models for wheat, rice, and maize species.
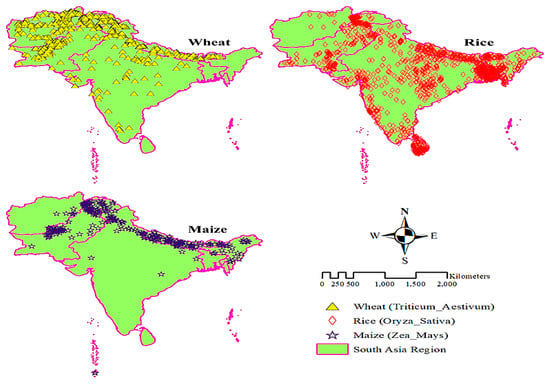
Figure 1.
Occurrence points of wheat, rice, and maize in South Asia region. Occurrence points Data were accessed from GBIF.org (https://www.gbif.org/occurrence/search, accessed on 18 May 2024) database. GBIF = Global Biodiversity Information Facility.
2.2. Current Bioclimatic Variables
Climate data for the study area was downloaded from the Worldclim database (version 2.1, www.worldclim.org, accessed on 18 May 2024), which comprises 19 bioclimatic variables, including solar radiation, elevation, wind speed, and water vapor pressure, with global coverage. These variables are derived from the monthly temperature and precipitation values and are frequently used in numerous ecological and biogeographic studies for modeling species distribution [36]. The layers were downloaded at a spatial resolution of 30 s, an equivalence of 1 km2 (Table 1). With the help of ArcGIS 10.7.1 Esri, all bioclim layers were trimmed to make maps of South Asia. The trimmed layers were then set to the same resolution, extent, and projection and converted to ASCII (asc) to meet the MaxEnt requirements. Additionally, a correlation test was carried out using the SDM toolbox v 2.5 with the Pearson correlation coefficient. To identify highly correlated variables and minimize the effects of multi-collinearity and model overfitting, the person correlation coefficient method was used [36]. The flowchart and processing methodology of the research are shown in Figure 2.

Table 1.
Bioclimatic environmental variables used in MaxEnt model.
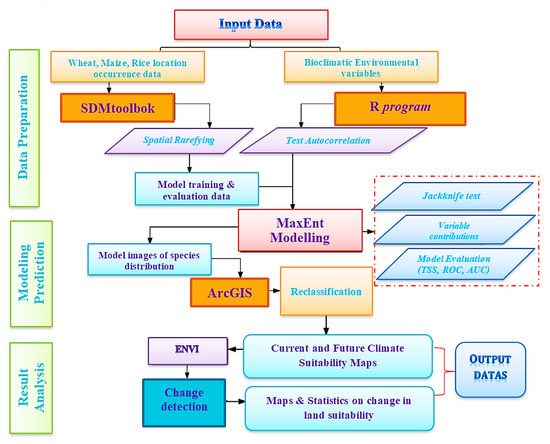
Figure 2.
Flowchart summarizing the processing methodology used in this study.
2.3. Future Climate Change Scenarios
The climate layers for the current projection are representatives of averages for the years 1970–2000. We modeled the future distributions of wheat, rice, and maize to examine differences in their potential habitats under different climate scenarios. This data was derived from the CMIP6. Two global general circulation models (GCMs) namely, HadCM3 and IPSL-CM6A-LR, were used. Global climate model projections portray the future climatic conditions. Hence, making it is possible to understand whether crop suitability in an area will remain the same or not. Each GCM was tested under the shared socioeconomic pathways (SSPs) consisting of five main ACCESS-CM2-SPPs (SSP119, SSP126, SSP245, SSP370, and SSP585). Among them, we use the intermediate shared SSP (SSP585) for four steps: 2021–2040, 2041–2060, 2061–2080, and 2081–2100. The SSPs scenarios belong to the “SSPs socioeconomic family”, which stands for “sustainability” [37].
2.4. MaxEnt Model Description
The MaxEnt model version 3.4.4 was used to make the current and future prediction models. The MaxEnt model was selected because it is a widely used SDM that exhibits greater accuracy than other models. The maximum entropy principle does not make any assumptions about the unknown information; it only takes into consideration the known data, and that is, it models species distribution from the information of present species [38]. During the modeling, most of the settings were left at default. The random test percentage was set at 30. This means that 30% of the data was withheld and used for testing, while the remaining 70% was used for model training. It has also been defined as a presence only model that uses predictive data sets to discriminate crop occurrence records [39,40]. Although the underlying prediction of those areas has been systematically sampled from most existing lands, the MaxEnt model is often constructed from spatially based occurrence records [41]. MaxEnt is one of the most popular niche-based methods for modeling geographical crop distributions [42]. This model also offers valuable tools such as jackknife tests, species environment curves, and area under the AUC and ROC curves [43].
2.5. MaxEnt Model Validation and Application
The ROC curve was used to validate the performance of the MaxEnt model. The ROC curves are a standard way to evaluate the MaxEnt model’s predictive accuracy [44]. The area of the ROC curve is a threshold independent measure of model performance, called (AUC) area under the ROC curve [45]. The closer the value is to 1, the greater the probability of a species presence [46,47]. The AUC values greater than 0.9 show very high accuracy, values 0.7–0.9 show high accuracy, and values less than 0.7 show low accuracy [48]. The MaxEnt model predicts 2021–2040, 2041–2060, 2061–2080, and 2081–2100 land suitability for maize, wheat, and rice distribution under different future bioclimatic conditions. During the modeling, most of the settings were left at default, which include auto features, a regularization multiplier of 1, and maximum number of background points of 10,000 [49]. 10 replicates were simulated under the default cross validate run type and used to calculate the mean relative suitability probabilities. The options for response curves and jackknife were also selected. The output from the MaxEnt model is a continuous, unitless scale of environmental suitability ranging from 0 to 1. In order to compare the suitable area, the output models were reclassified using the natural breaks (Jenks) classification method in ArcGIS 10.7.1 Esri. The classification was divided into four classes, which represent areas of 0.0–0.05, not suitable; 0.05–0.33, low suitability; 0.33–0.66, moderate suitability; and 0.66–1.00, high suitable, respectively [50]. The response curves were also used to understand the relationship between crop land suitability and bioclimatic variables in determining the land suitability for wheat, rice, and maize.
3. Results and Discussion
3.1. MaxEnt Model Performance and Jackknife Tests
This study developed a MaxEnt bioclimatic model to examine which bioclimatic variables are more explanatory in the distribution of wheat, rice, and corn species. In this study, the performance of the MaxEnt model was examined based on receiver operating characteristic (ROC) curves and AUC values (Figure 3). The MaxEnt model is an excellent tool for understanding the factors that influence the potential distribution of several crops at different scales [51]. The average AUC values of wheat, rice, and corn after 10 repeated runs were 0.876, 0.882, and 0.916, respectively, which were higher than the 0.70 of the random models, verifying the good simulation results using the test and training datasets of the repeated model. The representativeness of the training samples used in the MaxEnt model may considerably affect the accuracy of land suitability prediction. Firstly, it was selected as the training sample data source [52]. This discovery indicates that the climatic variables selected for the current suitability characteristics of wheat, rice, and corn are excellent. The ROC curve and AUC results indicate that the MaxEnt is highly consistent and can reveal the distribution of wheat, rice, and corn in South Asia. The MaxEnt model performs well in predicting the suitability of wheat, rice, and corn species. A previous study suggested that comparing the performance between different training datasets is appropriate [53].
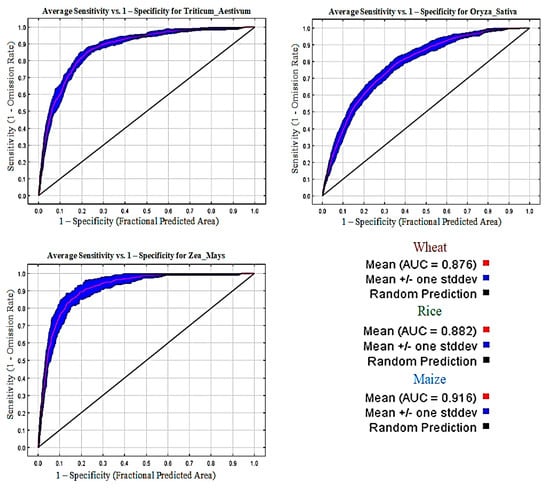
Figure 3.
Receiver operating characteristic (ROC) curve and AUC value under the current (1970–2000) period (10 replicated runs).
The impact of each environmental variable on the geographical suitability of wheat, rice, and corn species cultivation was analyzed in the jackknife AUC test. Using fifth percentile proportional sampling [54] and custom interval grouping methods, the AUC values were 0.750 and 0.747, respectively. The jackknife AUC test results showed that the distribution of wheat species is largely controlled by Bio-1, Bio-10, and Bio-11, with altitude and water vapor pressure providing the highest wheat AUC test results (Figure 4). MaxEnt software predicts the potential range of species based on their distribution and environmental variables [55,56]. The precipitation in the driest region (Bio-17) and the warmest region (Bio-18) also contributes more to the wheat model. Based on the jackknife AUC test results, it is worth noting that Bio-2, Bio-7, Bio-12, and altitude contributed to the highest AUC test and provided the determination of rice cultivation (Figure 4). In addition to the precipitation in the driest season (Bio-17) and the warmest season (Bio-18), the contribution to the MaxEnt model of rice is also greater. The suitability of wheat and rice is most important based on precipitation factors, which is consistent with other studies that have identified precipitation as a key determinant of marginal production systems [57,58].
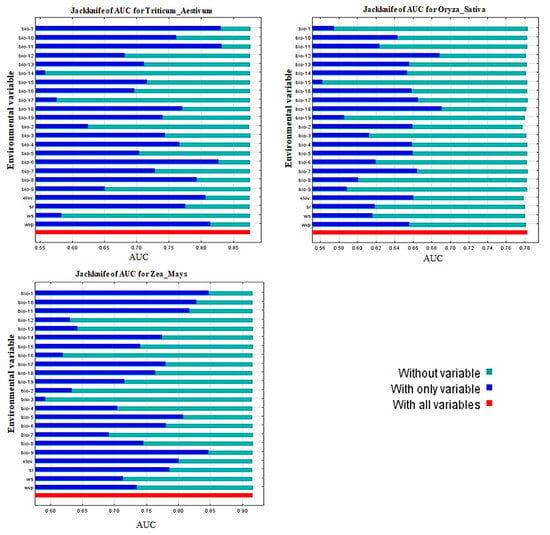
Figure 4.
Results of the jackknife AUC test of the MaxEnt model for evaluating the relative importance of bioclimatic environmental variables for wheat, rice, and maize occurrence.
These environmental bioclimatic variables, acting alone with altitude and water vapor pressure, have a considerable impact on the potential land suitability dynamics of wheat, rice, and corn and indicate that these aspects themselves contain more valuable information than other environmental bioclimatic parameters. The MaxEnt model is an effective tool for generating valuable information related to agricultural plantation management and planting decisions in special areas [59,60]. Jackknife AUC testing showed that the suitability of maize species is largely controlled by Bio-1, Bio-5, Bio-9, and Bio-10, with altitude providing the highest maize AUC test results (Figure 4). The AUC and ROC curves in MaxEnt generally measure the overall model performance at all threshold levels [61].
3.2. Contribution and Importance of the Bioclimatic Variables under Different Scenarios
The climate factors that affect the suitability of wheat, rice, and corn production in the region come from six bioclimatic variables selected from each group of highly correlated predictive factors. The jackknife test of this model shows that there are six current (1970–2000) bioclimatic variables, Bio-1, Bio-10, Bio-11, and Bio-18, namely altitude and water vapor pressure, which contribute 39.2%, 5.1%, 13.4%, 6.4%, 5.8%, and 6.3% to the distribution of wheat species (Table 2). In the future, ACCESS-CM2-SPP SSP585 (2021–2040), Bio-1, Bio-11, and Bio-18 contributed 48.5%, 13.8%, and 10.0%, respectively; during the period of 2041–2060, the contribution rates of Bio-1, Bio-11, and Bio-18 were 46.1%, 15.1%, and 8.7%, respectively; during the period of 2061–2080, the contributions of Bio-1, Bio-6, and Bio-18 to the MaxEnt model were 24.2%, 11.7%, and 33.3%, respectively; and during the period of 2081–2100, Bio-1, Bio-11, and Bio-18 were 9.9%, 48.2%, and 8.3%, respectively. It is crucial to determine the main bioclimatic variables that have a considerable impact on crop land distribution in order to predict land suitability [62]. The performance of the MaxEnt model indicates that it is a good model, with an AUC of 0.80 [63].

Table 2.
Primary contribution percent and permutation importance of the bioclimatic environmental variables impacting wheat distribution (%). Simulation results of the MaxEnt model.
It is expected that surface temperatures will rise throughout the 21st century [64], resulting in a negative impact on global wheat production [65,66]. Under current and future bioclimatic variables, Bio-1, Bio-11, and Bio-18 have the highest ranking importance percentage analysis. For rice, there are currently (1970–2000) six bioclimatic variables Bio-2, Bio-6, Bio-12, Bio-14, Bio-18, and altitude contributing 4.3%, 3.0%, 4.2%, 8.7%, 34.9%, and 19.9% (Table 3). In the future, ACCESS-CM2-SPP SSP585 (2021–2040), Bio-2, Bio-12, and Bio-18 contributed 8.3%, 12.3%, and 47.5%, respectively; during the period of 2041–2060, the contribution rates of Bio-7, Bio-12, and Bio-18 were 7.4%, 10.6%, and 50.6%, respectively; during the period of (2061–2080), the contributions of Bio-4, Bio-12, and Bio-18 to the MaxEnt model were 7.8%, 12.0%, and 49.6%, respectively; and during the period of (2081–2100), Bio-12, Bio-14, and Bio-18 were 22.3%, 6.5%, and 37.6%, respectively. In addition, the temperature and altitude range for rice growth are 20–35 °C and below 1450 m [67], which is consistent with our study results. Under current and future bioclimatic variables, the importance percentage analysis of Bio-2, Bio-12, and Bio-18 rank highest.

Table 3.
Primary contribution percent and permutation importance of the bioclimatic environmental variables impacting rice distribution (%) in the MaxEnt model.
We also need to know the influences of climate change to predict the potential suitability of current and future invasive areas in order to develop better prevention strategies. For corn, current bioclimatic variables such as Bio-1, Bio-14, and altitude contribute 36.3%, 14.3%, and 7.1%, respectively (Table 4). The highest percentile importance analysis of corn under current and future bioclimatic variables is Bio-1, Bio-11, and Bio-17, respectively. This result is consistent with previous research findings, which have shown that changes in temperature and day–night range can lead to changes in the distribution of maize plants [68]. The distribution of maize habitats is significantly influenced by temperature [69].

Table 4.
Primary contribution percent and permutation importance of the bioclimatic environmental variables impacting maize distribution (%) in the MaxEnt model.
3.3. Potential Land Suitability under Current and Future Climate
There is little research on the suitability of crops in South Asia by using regional climate models, but the MaxEnt model is an effective model for potential crop land distribution [70]. The potential geographically suitable habitat distribution of wheat, rice, and corn under current and future conditions is shown in Figure 5. Habitat is divided into four levels on the map. The green-marked areas in Figure 5 represent areas where wheat, rice, and corn are highly suitable for cultivation, as well as areas where crops are currently being grown. The yellow area is expected to be moderately suitable for planting, while the red area is not suitable for planting crops. In addition, for wheat, high suitability land in northern Afghanistan, northwestern Pakistan, northern India, Nepal, and Bhutan is on the rise, while land suitability in Bangladesh, Sri Lanka, and the Maldives is on the decline. A previous study revealed that the global wheat planting area will considerably improve by 2035 [71]. Our findings suggest that environmental changes will considerably alter the overall suitability of wheat planting land. For rice, the northeast of Pakistan and India are highly suitable lands, while Nepal, Bhutan, Bangladesh, and Sri Lanka are highly suitable areas, and rice cultivation is showing an increasing trend. The suitability of rice fields in Afghanistan is decreasing. In addition, India, Thailand, Philippines and Pakistan domestic rice production is insufficient to meet their needs [72]. For corn, the land suitability in northwestern Pakistan, northeastern India, northern Nepal, and Bhutan is higher and showing an increasing trend, while corn cultivation in Afghanistan, Bangladesh, Sri Lanka, the Maldives, and eastern and western India is decreasing. The future climate scenario used in this study has identified the potential changes in suitable habitats for wheat, rice, and corn between current and future climate change (Table 2). Meanwhile, many studies claim that with climate change, drought events will become more frequent and severe [71,73], which may also extremely affect corn suitability [36]. There are significant variances in the potential land suitability of highly and moderately habitats under diverse climate change.
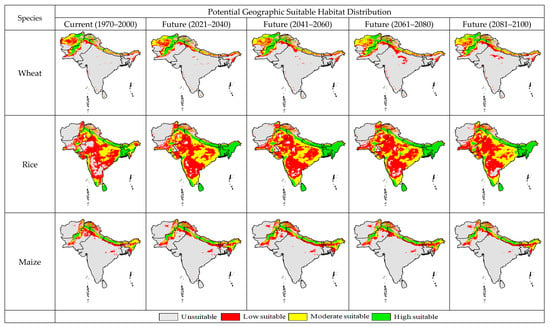
Figure 5.
Potential geographic suitable habitat distribution for wheat, rice, and maize production under current (1970–2000) and future (ACCESS_CM2_ssp585, 2021–2040; 2041–2060; 2061–2080; 2081–2100) climate condition scenarios in South Asia.
We calculated the suitable habitat area and proportion for each climate scenario in four different periods to further analyze the impact of climate change on the land suitability of wheat, rice, and corn under different scenarios (Table 5). A prerequisite understanding of species distribution is important for species utilization and restoration in ecosystems [38,41]. Under the SSP585 climate scenarios for the study area in 2040, 2060, 2080, and 2100, the suitable high, medium, and low habitats for wheat will significantly increase, while the unsuitable area will significantly decrease. Climate change will raise wheat production in high latitudes, while warm regions may suffer greater [61,65]. It is expected that in the future, the total unsuitable and low-suitable rice area will be significantly reduced compared to the current situation. In the SSP5852040, 2060, 2080, and 2100 scenarios, the high land suitability for rice is expected to significantly rise by 32.3%, 31.8%, 30.2%, and 29.4%, respectively, compared to the current situation. These habitats mainly include the major corn and rice suitability areas in South Asia and provide important commercial food bases [37,74]. For corn, it is expected that in the future, the total area that is not suitable and moderately suitable will be significantly reduced compared to the current situation. In the SSP585 2040, 2060, 2080, and 2100 scenarios, the area of high distribution corn is expected to significantly improve by 12.5%, 11.8%, 15.3%, and 12.8% compared to the current situation, respectively (Figure 6).

Table 5.
Changes in land suitability for wheat, rice, and maize under the current and future climatic conditions.
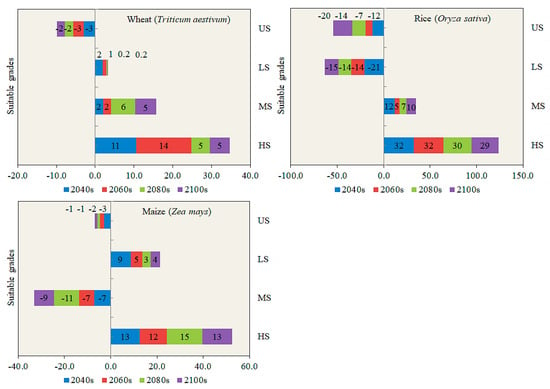
Figure 6.
Proportion changes in the potential distribution of wheat, rice, and maize under future (ACCESS_CM2_ssp585, 2021–2040; 2041–2060; 2061–2080; 2081–2100) climate scenarios.
Climate is one of the most significant factors affecting the geographical suitability, vegetation pattern, and community structure of plant species [16]. There is a considerable variance between the climate scenario and the predicted results for the next four periods, which means that the suitable habitats for wheat, rice, and corn will undergo significant changes during the climate scenario and prediction period. The impact of land use transformation will increase the spatial range of unsuitable habitats beyond people’s predicted range [23].
3.4. Dominant Environmental Variables
In order to predict land suitability, it is significant to identify the key bioclimatic variables that have an important impact on farmland suitability [33]. The contribution rate of these six bioclimatic variables is as high as 76.2%, indicating that these six factors play an important role in the potential land suitability of wheat. From the response curve, we obtained Bio-01 with the main bioclimatic variables of −20 to 20 °C; Bio-10, −5 to 35 °C; Bio-11, −30 to −5 °C; Bio-18, 0 to 500 mm; altitude, 100 to 2500 km; the water vapor pressure ranges from 0 to 1 kPa (Figure 7). Annual rainfall is the most significant climatic factor affecting plant development, as well as a significant factor affecting seedling survival and growth [39]. In the future, annual rainfall is related to many climatic factors that affect plant physiological and biochemical processes, such as soil moisture, which has been proven to be the main factor affecting plant assimilation rate [44]. The rice curve shows the correlation between bioclimatic variables and the probability of rice existence. According to the response curve of rice, rice prefers Bio-01, 6 to 14 °C; Bio-06, −35 to −5 °C; Bio 12100 to 1200 mm; Bio-14, 0 to 160 mm; Bio-18, 0 to 5000 mm; the altitude ranges from 400 to 7000 km (Figure 7). Temperature and rainfall have the most considerable ecological impact on potential land distribution [30,31]. According to the obtained rice response curve, rice prefers Bio-2 at 4–14 °C; Bio-9, −5 to 25 °C; Bio-12, 600 to 4200 mm; Bio-14, 20 to 220 mm; Bio-17, 80 to 700 mm; and Bio-18, 500 to 2100 mm (Figure 8). These six bioclimatic variables contribute up to 77.5% to maize and play an important role in its potential distribution. A study suggests that in summer, for every degree of warming in the future, corn production may decrease by 16% [26]. From the response curve of corn, we obtained Bio-01 with the main bioclimatic variables ranging from −20 to 20 °C; Bio-05, −5 to 37 °C; Bio-14, 0 to 42 mm; Bio-17, 0 to 200 mm; altitude, 0 to 3000 km; the wind speed ranges from 1 to 1.5 m s−1 (Figure 9). Huang et al. [27] study that, compared with rainfall, temperature may have a more considerable impact on species distribution.
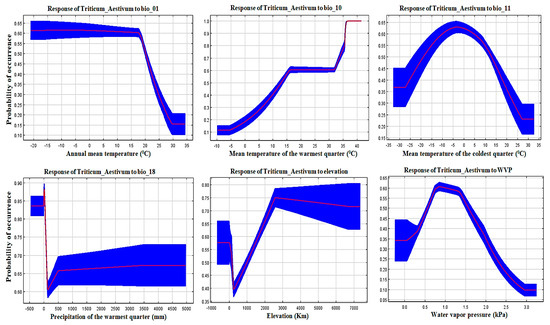
Figure 7.
Wheat (Triticum_Aestivum) response curves derived from MaxEnt Model showing the influence of bioclimatic environmental variables; Bio_01, Bio_10, Bio_11, Bio_18, elevation, and water vapor pressure in South Asia.
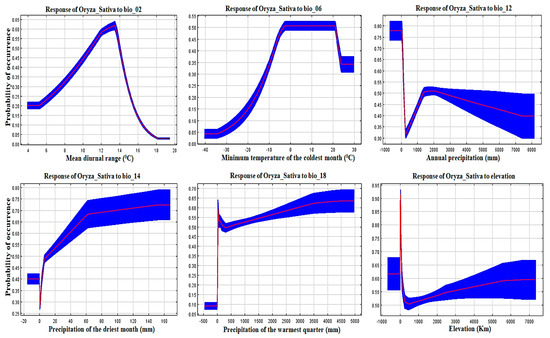
Figure 8.
Rice (Oryza_Sativa) response curves derived from MaxEnt Model showing the influence of bioclimatic environmental variables; Bio_02, Bio_06, Bio_12, Bio_14, Bio_18, and elevation in South Asia.
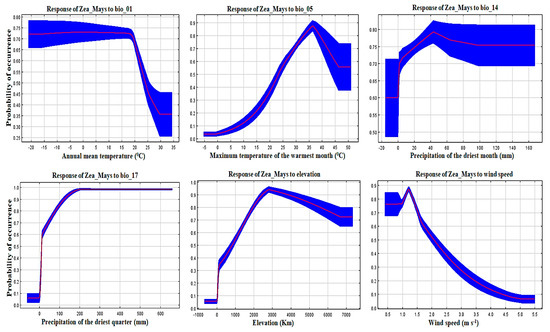
Figure 9.
Maize (Zea_Mays) response curves derived from MaxEnt Model showing the influence of bioclimatic environmental variables; Bio_01, Bio_05, Bio_14, Bio_17, elevation, and wind speed in South Asia.
3.5. Pearson Correlation Analysis
Bioclimatic variables are based on precipitation and temperature data [19]. Due to these reasons, there is a high correlation between bioclimatic variables. Using highly correlated environmental data for distribution modeling can affect the prediction and distribution process [27,48]. Pearson correlation analyses for wheat, rice, and maize are presented in Table 6, Table 7 and Table 8. In our study, we identify the highly correlated variables and minimize the effects of model overfitting. For the 19 variables with correlation coefficient values of p < 0.05, the Pearson correlation analysis of wheat, rice, and maize showed strong correlations between paired variables. To define which variable has a weaker predictive ability, we pre-ran the model for each variable and calculate the AUC value. In addition, the jackknife tests constructed throughout the MaxEnt model indicate that these variables have little impact on species land suitability.

Table 6.
Wheat correlation analysis results of the bioclimatic environmental variables.

Table 7.
Rice correlation analysis results of the bioclimatic environmental variables.

Table 8.
Maize correlation analysis results of the bioclimatic environmental variables.
4. Conclusions
This research is the first step towards better understanding the current and future potential land distribution of wheat, rice, and corn production in South Asia. The results showed that for wheat, annual mean temperature (Bio-1) and mean temperature of the coldest quarter (Bio-11) contributed 39.2% and 13.4%, for rice, precipitation of the warmest quarter (Bio-18) and elevation contributed 34.9% and 19.9%, and for maize, Bio-1 and precipitation of the driest quarter (Bio-17) contributed 36.3% and 14.3%, respectively. The map drawn indicates that the suitability of wheat, rice, and corn in South Asia may change in the future. The research revealed, on average, a significant improvement in high suitable area of 8.7%, 30.9%, and 13.1%, for wheat, rice, and maize, respectively; a moderate suitable area increase of 3.9% and 8.6% for wheat and rice, respectively; and a decrease by −8.3% for maize as compared with current values. The change in the unsuitable areas significantly decreased by −2.5%, −13.5%, and −1.7% for wheat, rice, and maize, respectively, compared to the current land suitability. These results indicate that there is a huge potential to increase the present potential planting areas of wheat, rice, and corn to increase crop production in South Asia. In light of our findings, it is our recommendation that further analysis is needed to identify land use changes and determine the effective area of suitable lands that can be targeted for wheat, rice, and corn cultivation in order to ensure sustainable production and mitigate food insecurity. This research can be used as evidence supporting the use of the MaxEnt model for defining potential species distribution areas under current and future climate change and establish policies specific to South Asia’s geography and climate.
Author Contributions
Conceptualization, S.A. and J.N.; methodology, S.A., T.A.M. and M.U.; software, T.A.M. and S.A.H.; data curation and validation, S.A.; formal analysis, S.A. and S.S.; field investigation, S.A. and J.N.; writing—original draft, S.A.; writing—review and editing, S.A., S.A.H., S.S., M.U. and J.N.; project administration, S.A. and J.N.; supervision, J.N.; funding acquisition, S.A. and S.A.H. All authors contributed equally. All authors have read and agreed to the published version of the manuscript.
Funding
The authors extend their appreciation to the Researchers Supporting Project number (RSP2024R371), King Saud University, Riyadh, Saudi Arabia; Zhejiang Normal University (ZC304022952), and Shandong Natural Science Youth Project (ZR2020QF281), China.
Data Availability Statement
The data that support the findings of this study are available from the corresponding author upon reasonable request.
Acknowledgments
The authors would like to acknowledge the funding support by the Researchers Supporting Project number (RSP2024R371), King Saud University, Riyadh, Saudi Arabia.
Conflicts of Interest
The authors declare no conflicts of interest.
References
- Akpoti, K.; Kabo-bah, A.T.; Dossou-Yovo, E.R.; Groen, T.A.; Zwart, S.J. Mapping suitability for rice production in inland valley landscapes in Benin and Togo using environmental niche modeling. Sci. Total Environ. 2020, 709, 136165. [Google Scholar] [CrossRef]
- Angelieri, C.C.; Adams-Hosking, C.; Ferraz, K.M.; de Souza, M.P.; McAlpine, C.A. Using species distribution models to predict potential landscape restoration effects on Puma conservation. PLoS ONE 2016, 11, e0145232. [Google Scholar] [CrossRef] [PubMed]
- Ashoori, A.; Kafash, A.; Varasteh Moradi, H.; Yousefi, M.; Kamyab, H.; Behdarvand, N.; Mohammadi, S. Habitat modeling of the common pheasant Phasianus colchicus (Galliformes: Phasianidae) in a highly modified landscape: Application of species distribution models in the study of a poorly documented bird in Iran. Eur. Zool. J. 2018, 85, 372–380. [Google Scholar] [CrossRef]
- Asseng, S.; Ewert, F.; Martre, P.; Rötter, R.P.; Lobell, D.B.; Cammarano, D.; Kimball, B.A.; Ottman, M.J.; Wall, G.W.; White, J.W. Rising temperatures reduce global wheat production. Nat. Clim. Chang. 2014, 5, 143–147. [Google Scholar] [CrossRef]
- Asseng, S.; Foster, I.A.N.; Turner, N.C. The impact of temperature variability on wheat yields. Glob. Chang. Biol. 2011, 17, 997–1012. [Google Scholar] [CrossRef]
- Booth, T.H.; Nix, H.A.; Busby, J.R.; Hutchinson, M.F. BIOCLIM: The first species distribution modelling package, its early applications and relevance to most current MAXENT studies. Divers. Distrib. 2014, 20, 1–9. [Google Scholar] [CrossRef]
- Brown, J.L.; Bennett, J.R.; French, C.M. SDMtoolbox 2.0: The next generation Python-based GIS toolkit for landscape genetic, biogeographic and species distribution model analyses. PeerJ 2017, 5, e4095. [Google Scholar] [CrossRef]
- Bu, K.; Wang, Z.; Zhang, S.; Yang, J. Evaluation of agricultural land suitability for soybean cultivation in the Sanjiang Plain. Chin. J. Eco-Agric. 2017, 25, 419–428. [Google Scholar] [CrossRef]
- Carpenter, G.; Gillison, A.N.; Winter, J. DOMAIN: A flexible modelling procedure for mapping potential distributions of plants and animals. Biodivers. Conserv. 1993, 2, 667–680. [Google Scholar] [CrossRef]
- Chemura, A.; Mudereri, B.T.; Yalew, A.W.; Gornott, C. Climate change and specialty coffee potential in Ethiopia. Sci. Rep. 2021, 11, 8097. [Google Scholar] [CrossRef]
- Chersich, M.F.; Wright, C.Y. Climate change adaptation in South Africa: A case study on the role of the health sector. Glob. Health 2019, 15, 22. [Google Scholar] [CrossRef] [PubMed]
- Duan, J.Q.; Zhou, G.S. Climatic suitability of double rice planting region in China. Chin. Acad. Meteorol. Sci. 2012, 45, 218–227, (In Chinese with English Abstract). [Google Scholar] [CrossRef]
- Elith, J.; Phillips, S.J.; Hastie, T.; Dudík, M.; Chee, Y.E.; Yates, C.J. A statistical explanation of MaxEnt for ecologists. Divers. Distrib. 2011, 17, 43–57. [Google Scholar] [CrossRef]
- Fischer, G.; Shah, M.; Tubiello, F.N.; van Velhuizen, H. Socio-economic and climate change impacts on agriculture: An integrated assessment, 1990–2080. Philos. Trans. R. Soc. Lond. Ser. B Biol. Sci. 2005, 360, 2067–2083. [Google Scholar] [CrossRef]
- Fodor, N.; Challinor, A.; Droutsas, I.; Ramirez-Villegas, J.; Zabel, F.; Koehler, A.-K.; Foyer, C.H. Integrating plant science and crop modeling: Assessment of the impact of climate change on soybean and maize production. Plant Cell Physiol. 2017, 58, 1833–1847. [Google Scholar]
- Fourcade, Y.; Engler, J.O.; Rodder, D.; Secondi, J. Mapping species distributions with MAXENT using a geographically biased sample of presence data: A performance assessment of methods for correcting sampling bias. PLoS ONE 2014, 9, e97122. [Google Scholar] [CrossRef]
- Franklin, J. Species distribution models in conservation biogeography: Developments and challenges. Divers. Distrib. 2013, 19, 1217–1223. [Google Scholar] [CrossRef]
- Gao, Y.; Zhang, A.; Yue, Y.; Wang, J.; Su, P. Predicting shifts in land suitability for maize cultivation worldwide due to climate change: A modeling approach. Land 2021, 10, 295. [Google Scholar] [CrossRef]
- GBIF. 2021. Available online: https://doi.org/10.15468/dl.cjnj2p (accessed on 6 May 2021).
- Gong, L.; Tian, B.; Li, Y.; Wu, S. Phenological changes of soybean in response to climate conditions in frigid region in China over the past decades. Int. J. Plant Prod. 2021, 15, 363–375. [Google Scholar] [CrossRef]
- Habtemariam, L.T.; Kassa, G.A.; Gandorfer, M. Impact of climate change on farms in smallholder farming systems: Yield impacts, economic implications and distributional effects. Agric. Syst. 2017, 152, 58–66. [Google Scholar]
- He, Q.; Zhou, G. Climatic suitability of potential spring maize cultivation distribution in China. Acta Ecol. Sin. 2012, 32, 3931–3939. [Google Scholar] [CrossRef]
- Hong, D.Y.; Zhou, S.L.; He, X.J.; Yuan, J.H.; Zhang, Y.L.; Cheng, F.Y.; Zeng, X.L.; Wang, Y.; Zhang, X.X. Current status of wild tree peony species with special reference to conservation. Biodivers. Sci. 2017, 25, 781–793. [Google Scholar] [CrossRef]
- Zheng, C.; Wang, Y.C.; Yuan, S.; Xiao, S.; Sun, Y.T.; Huang, J.L.; Peng, S.B. Heavy soil drying during mid-to-late grain filling stage of the main crop to reduce yield loss of the ratoon crop in a mechanized rice ratooning system. Crop J. 2022, 10, 280–285. [Google Scholar] [CrossRef]
- Bunn, C.; Peter, L.; Quaye, A.; Muilerman, S.; Noponen, M.R.A.; Lundy, M. Recommendation domains to scale out climate change adaptation in cocoa production in Ghana. Clim. Serv. 2019, 16, 100123. [Google Scholar] [CrossRef]
- Hou, J.; Geng, T.; Chen, Q.; Chen, C. Impacts of climate warming on growht period and yield of rice in Northeast China during recent two decades. Chin. J. Appl. Ecol. 2015, 26, 249–259. [Google Scholar]
- Huang, C.; Zhang, M.; Zou, J.; Zhu, A.-X.; Chen, X.; Mi, Y.; Wang, Y.; Yang, H.; Li, Y. Changes in land use, climate and the environment during a period of rapid economic development in Jiangsu Province. China Sci. Total Environ. 2015, 536, 173–181. [Google Scholar] [PubMed]
- Ihlow, F.; Dambach, J.; Engler, J.O.; Flecks, M.; Hartmann, T.; Nekum, S.; Rajaei, H.; Rödder, D. On the brink of extinction? How climate change may affect global chelonian species richness and distribution. Glob. Chang. Biol. 2012, 18, 1520–1530. [Google Scholar] [CrossRef]
- Intergovernmental Panel on Climate Change (IPCC). 2023: Sections. In Climate Change 2023: Synthesis Report. Contribution of Working Groups I, II and III to the Sixth Assessment Report of the Intergovernmental Panel on Climate Change; Core Writing Team, Lee, H., Romero, J., Eds.; Intergovernmental Panel on Climate Change (IPCC): Geneva, Switzerland, 2023; pp. 35–115. [Google Scholar] [CrossRef]
- Kogo, B.K.; Kumar, L.; Koech, R.; Kariyawasam, C.S. Modelling climate suitability for rainfed maize cultivation in Kenya using a maximum entropy (MAXENT) approach. Agronomy 2019, 9, 727. [Google Scholar] [CrossRef]
- Kramer-Schadt, S.; Niedballa, J.; Pilgrim, J.D.; Schroder, B.; Lindenborn, J.; Reinfelder, V.; Stillfried, M.; Heckmann, I.; Scharf, A.K.; Augeri, D.M.; et al. The importance of correcting for sampling bias in MaxEnt species distribution models. Divers. Distrib. 2013, 19, 1366–1379. [Google Scholar] [CrossRef]
- Kulhanek, S.A.; Leung, B.; Ricciardi, A. Using ecological niche models to predict the abundance and impact of invasive species: Application to the common carp. Ecol. Appl. 2011, 21, 203–213. [Google Scholar]
- Li, Y.; Li, M.; Li, C.; Liu, Z. Optimized Maxent Model Predictions of Climate Change Impacts on the Suitable Distribution of Cunninghamia lanceolata in China. Forests 2020, 11, 302. [Google Scholar] [CrossRef]
- Liu, B.; Gao, X.; Zheng, K.; Ma, J.; Jiao, Z.; Xiao, J.; Wang, H. The potential distribution and dynamics of important vectors Culex pipiens pallens and Culex pipiens quinquefasciatus in China under climate change scenarios: An ecological niche modelling approach. Pest Manag. Sci. 2020, 76, 3096–3107. [Google Scholar] [PubMed]
- Liu, B.; Gao, X.; Ma, J.; Jiao, Z.; Xiao, J.; Hayat, M.A.; Wang, H. Modeling the present and future distribution of arbovirus vectors Aedes aegypti and Aedes albopictus under climate change scenarios in Mainland China. Sci. Total Environ. 2019, 664, 203–214. [Google Scholar] [CrossRef]
- Liu, Z.; Yang, X.; Lv, S.; Wang, J.; Lin, X. Spatio-temporal variations of yield gaps of spring Maize in Northeast China. Sci. Agric. Sin. 2017, 50, 1606–1616. [Google Scholar]
- Lu, F.; Wang, H.; Ma, X.; Peng, H.; Shan, J. Modeling the current land suitability and future dynamics of global soybean cultivation under climate change scenarios. Field Crops Res. 2021, 263, 108069. [Google Scholar] [CrossRef]
- Luo, M.; Wang, H.; Lv, Z. Evaluating the performance of species distribution models Biomod2 and MaxEnt using the giant panda distribution data. Chin. J. Appl. Ecol. 2017, 28, 4001–4006. [Google Scholar] [CrossRef]
- Mabhaudhi, T.; Chimonyo, V.G.P.; Hlahla, S.; Massawe, F.; Mayes, S.; Nhamo, L.; Modi, A.T. Prospects of orphan crops in climate change. Planta 2019, 250, 695–708. [Google Scholar] [CrossRef]
- Mall, R.; Lal, M.; Bhatia, V.; Rathore, L.; Singh, R. Mitigating climate change impact on soybean productivity in India: A simulation study. Agric. For. Meteorol. 2004, 121, 113–125. [Google Scholar] [CrossRef]
- Marcer, A.; Saez, L.; Molowny-Horas, R.; Pons, X.; Pino, J. Using species distribution modelling to disentangle realised versus potential distributions for rare species conservation. Biol. Conserv. 2013, 166, 221–230. [Google Scholar] [CrossRef]
- Massimo, F.; Ma, P.M. Impact on human health of climate changes. Eur. J. Int. Med. 2015, 26, 1–5. [Google Scholar]
- Fan, M.; Shibata, H.; Chen, L. Environmental and economic risks assessment under climate changes for three land uses scenarios analysis across Teshio watershed, northernmost of Japan. Sci. Total Environ. 2017, 599–600, 451–463. [Google Scholar]
- Mohammadi, S.; Ebrahimi, E.; Shahriari Moghadam, M.; Bosso, L. Modelling current and future potential distributions of two desert jerboas under climate change in Iran. Ecol. Inform. 2019, 52, 7–13. [Google Scholar] [CrossRef]
- Montoya, F.; García, C.; Pintos, F.; Otero, A. Effects of irrigation regime on the growth and yield of irrigated soybean in temperate humid climatic conditions. Agric. Water Manag. 2017, 193, 30–45. [Google Scholar]
- Motuma, M.; Suryabhagavan, K.V.; Balakrishnan, M. Land suitability analysis for wheat and sorghum crops in Wogdie District, South Wollo, Ethiopia, using geospatial tools. Appl. Geomat. 2016, 8, 57–66. [Google Scholar] [CrossRef]
- Mustafa, A.; Singh, M.; Sahoo, R.; Ahmed, N.; Khanna, M.; Sarangi, A.; Mishra, A. Land Suitability Analysis for Different Crops: A Multi Criteria Decision Making Approach Using Remote Sensing and GIS. Researcher 2011, 3, 61–84. [Google Scholar]
- Nam, J.; Cho, H.; Kim, J. Effect of plant life cycle on plant settlement in diverse water level. J. Wetl. Res. 2015, 17, 19–25. [Google Scholar] [CrossRef][Green Version]
- Ncube, B.; Shekede, M.D.; Gwitira, I.; Dube, T. Spatial modelling the effects of climate change on the distribution of Lantana camara in Southern Zimbabwe. Appl. Geogr. 2020, 117, 102172. [Google Scholar]
- Nyathi, M.K.; van Halsema, G.E.; Annandale, J.G.; Struik, P.C. Calibration and validation of the AquaCrop model for repeatedly harvested leafy vegetables grown under different irrigation regimes. Agric. Water Manag. 2018, 208, 107–119. [Google Scholar] [CrossRef]
- Ohta, S.; Kimura, A. Impacts of climate changes on the temperature of paddy waters and suitable land for rice cultivation in Japan. Agric. For. Meteorol. 2007, 147, 186–198. [Google Scholar] [CrossRef]
- Ortiz, R.; Sayre, K.D.; Govaerts, B.; Gupta, R.; Subbarao, G.V.; Ban, T.; Hodson, D.; Dixon, J.M.; Iván Ortiz-Monasterio, J.; Reynolds, M. Climate change: Can wheat beat the heat? Agric. Ecosyst. Environ. 2008, 126, 46–58. [Google Scholar] [CrossRef]
- Peterson, A.T.; Soberón, J.; Pearson, R.G.; Anderson, R.P.; Martínez-Meyer, E.; Nakamura, M.; Araújo, M.B. Ecological Niches and Geographic Distributions (MPB-49); Princeton University Press: Princeton, NJ, USA, 2011. [Google Scholar]
- Phillips, S.J.; Anderson, R.P.; Schapire, R.E. Maximum entropy modeling of species geographic distributions. Ecol. Model. 2006, 190, 231–259. [Google Scholar] [CrossRef]
- Phillips, S.; Anderson, R.; Dudík, M.; Schapire, R.; Blair, M. Opening the black box: An open-source release of Maxent. Ecography 2017, 40, 887–893. [Google Scholar] [CrossRef]
- Phillips, S.; Dudìk, M. Modeling of species distributions with Maxent: New extensions and a comprehensive evaluation. Ecography 2008, 31, 161–175. [Google Scholar] [CrossRef]
- Qin, A.; Jin, K.; Batsaikhan, M.-E.; Nyamjav, J.; Li, G.; Li, J.; Xue, Y.; Sun, G.; Wu, L.; Indree, T.; et al. Predicting the current and future suitable habitats of the main dietary plants of the Gobi Bear using MaxEnt modeling. Glob. Ecol. Conserv. 2020, 22, e01032. [Google Scholar] [CrossRef]
- Shabani, F.; Kotey, B. Future distribution of cotton and wheat in Australia under potential climate change. J. Agric. Sci. 2015, 154, 175–185. [Google Scholar] [CrossRef]
- Shabani, F.; Kumar, L.; Ahmadi, M. A comparison of absolute performance of different correlative and mechanistic species distribution models in an independent area. Ecol. Evol. 2016, 6, 5973–5986. [Google Scholar] [PubMed]
- Slater, H.; Michael, E. Predicting the current and future potential distributions of lymphatic filariasis in Africa using maximum entropy ecological niche modelling. PLoS ONE 2012, 7, e32202. [Google Scholar] [CrossRef]
- Su, P.; Zhang, A.; Wang, R.; Wang, J.; Gao, Y.; Liu, F. Prediction of future natural suitable areas for rice under representative concentration pathways (Rcps). Sustainability 2021, 13, 1580. [Google Scholar] [CrossRef]
- Swets, J.A. Measuring the accuracy of diagnostic systems. Science 1988, 240, 1285–1293. [Google Scholar] [CrossRef]
- Teichmann, C.; Jacob, D.; Remedio, A.R.; Remke, T.; Buntemeyer, L.; Hoffmann, P.; Kriegsmann, A.; Lierhammer, L.; Bülow, K.; Weber, T.; et al. Assessing mean climate change signals in the global CORDEX-CORE ensemble. Clim. Dyn. 2021, 57, 1269–1292. [Google Scholar] [CrossRef]
- Trenberth, K.E.; Dai, A.; Van Der Schrier, G.; Jones, P.D.; Barichivich, J.; Briffa, K.R.; Sheffield, J. Global warming and changes in drought. Nat. Clim. Chang. 2014, 4, 17–22. [Google Scholar] [CrossRef]
- Walke, N.; Obi Reddy, G.P.; Maji, A.K.; Thayalan, S. GIS-based multicriteria overlay analysis in soil-suitability evaluation for cotton (Gossypium spp.): A case study in the black soil region of Central India. Comput. Geosci. 2012, 41, 108–118. [Google Scholar] [CrossRef]
- Wang, L.; Li, Y.; Wang, P.; Wang, X.; Luo, Y.; Wu, H. Assessment of ecological suitability of winter wheat in Jiangsu Province based on the niche—Fitness theory and fuzzy mathematics. Acta Ecol. Sin. 2016, 36, 4465–4474. [Google Scholar] [CrossRef]
- Wang, W.; He, A.; Jiang, G.; Sun, H.; Jiang, M.; Man, J.; Ling, X.; Cui, K.; Huang, J.; Peng, S.; et al. Chapter Four—Ratoon rice technology: A green and resource-efficient way for rice production. Adv. Agron. 2020, 159, 135–167. [Google Scholar] [CrossRef]
- Wisz, M.S.; Hijmans, R.; Li, J.; Peterson, A.T.; Graham, C.; Guisan, A.; NCEAS Predicting Species Distributions Working Group. Effects of sample size on the performance of species distribution models. Divers. Distrib. 2008, 14, 763–773. [Google Scholar] [CrossRef]
- Xu, L.L.; Ren, Z. Relationships between rice growth and climatic factors. Mod. Agric. Sci. Technol. 2017, 18, 183–185. [Google Scholar]
- Yao, H.; Zuo, X.; Zuo, D.; Lin, H.; Huang, X.; Zang, C. Study on soybean potential productivity and food security assessment in China under the influence of the COVID-19 outbreak. Geogr. Sustain. 2020, 1, 163–171. [Google Scholar] [CrossRef]
- Yin, X.; Chen, F. Temporal and spatial changes of global soybean production in 1961–2017. World Agric. 2019, 11, 65–71. [Google Scholar]
- Yue, Y.; Zhang, P.; Shang, Y. The potential global distribution and dynamics of wheat under multiple climate change scenarios. Sci. Total Environ. 2019, 688, 1308–1318. [Google Scholar] [CrossRef]
- Zhang, K.L.; Yao, L.J.; Meng, J.S.; Tao, J. Maxent modeling for predicting the potential geographical distribution of two peony species under climate change. Sci. Total Environ. 2018, 634, 1326–1334. [Google Scholar] [CrossRef]
- Zipper, S.C.; Qiu, J.; Kucharik, C.J. Drought effects on US maize and soybean production: Spatiotemporal patterns and historical changes. Environ. Res. Lett. 2016, 11, 094021. [Google Scholar]
Disclaimer/Publisher’s Note: The statements, opinions and data contained in all publications are solely those of the individual author(s) and contributor(s) and not of MDPI and/or the editor(s). MDPI and/or the editor(s) disclaim responsibility for any injury to people or property resulting from any ideas, methods, instructions or products referred to in the content. |
© 2024 by the authors. Licensee MDPI, Basel, Switzerland. This article is an open access article distributed under the terms and conditions of the Creative Commons Attribution (CC BY) license (https://creativecommons.org/licenses/by/4.0/).