
Spatial Development and Coupling Coordination of Society–Physics–Informational Smart Cities: A Case Study on Thirty Capitals in China

Abstract
1. Introduction
2. Materials and Review
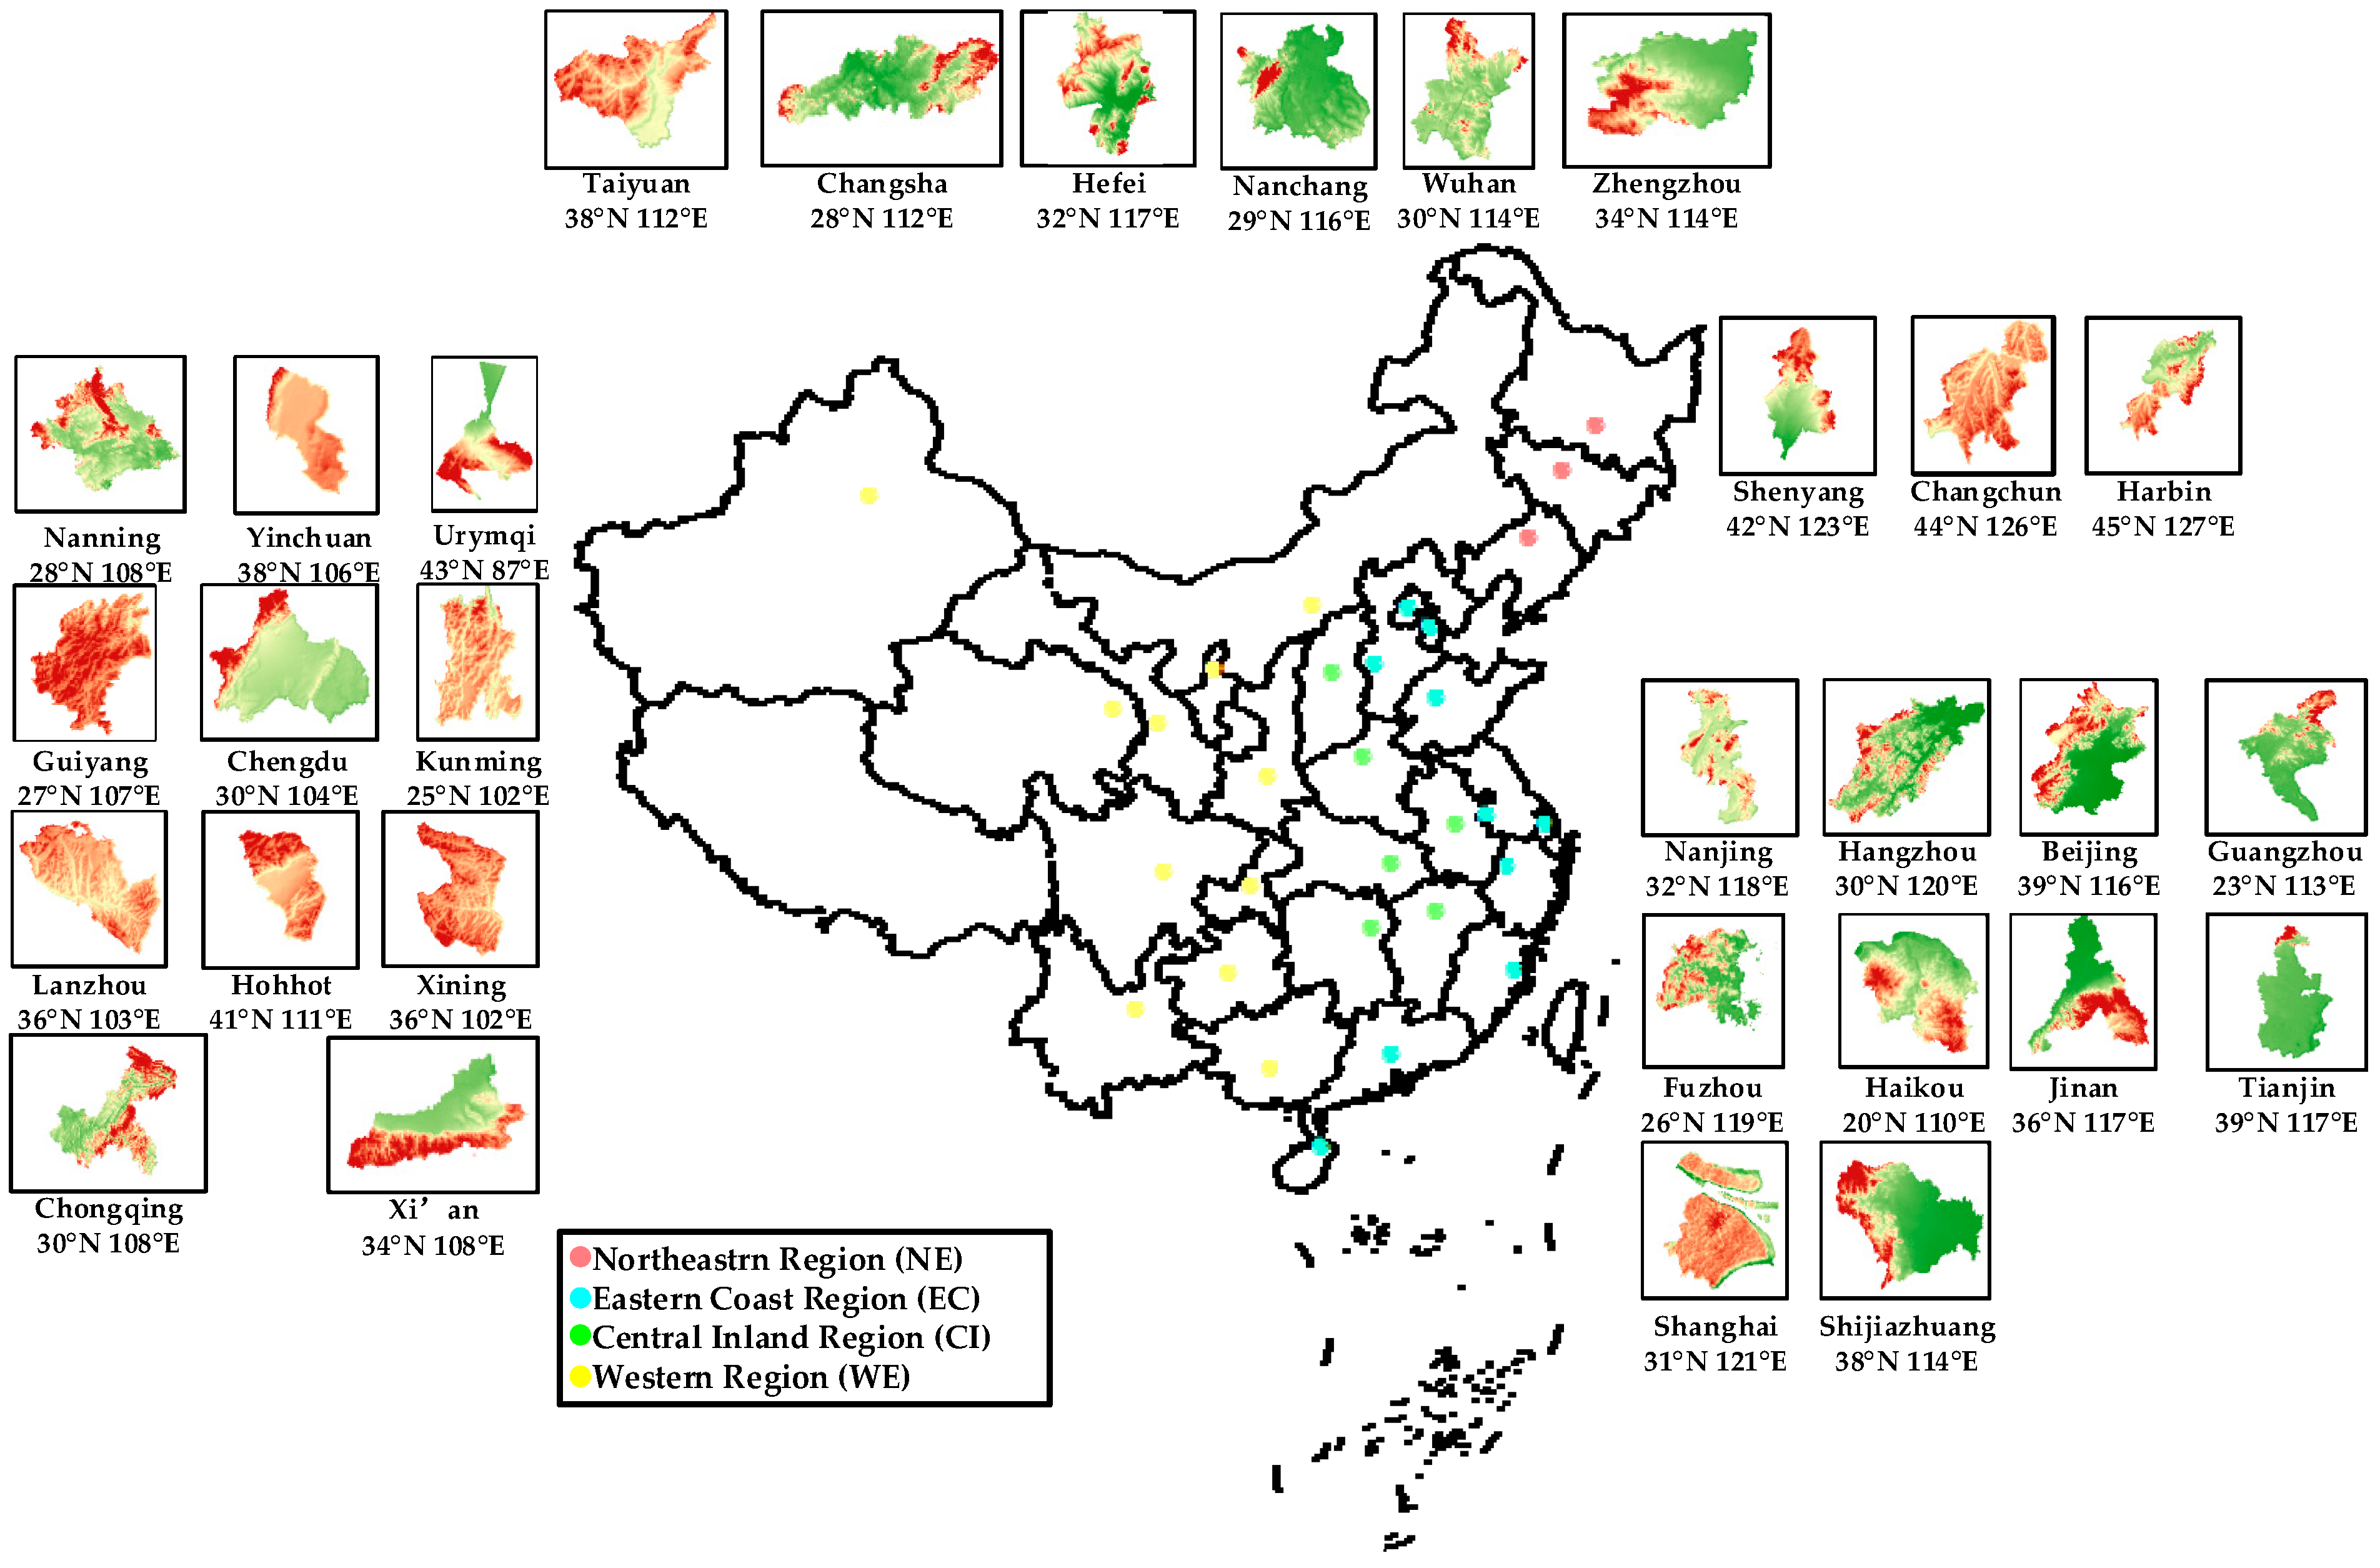
2.1. Study Area
2.2. Literature Review
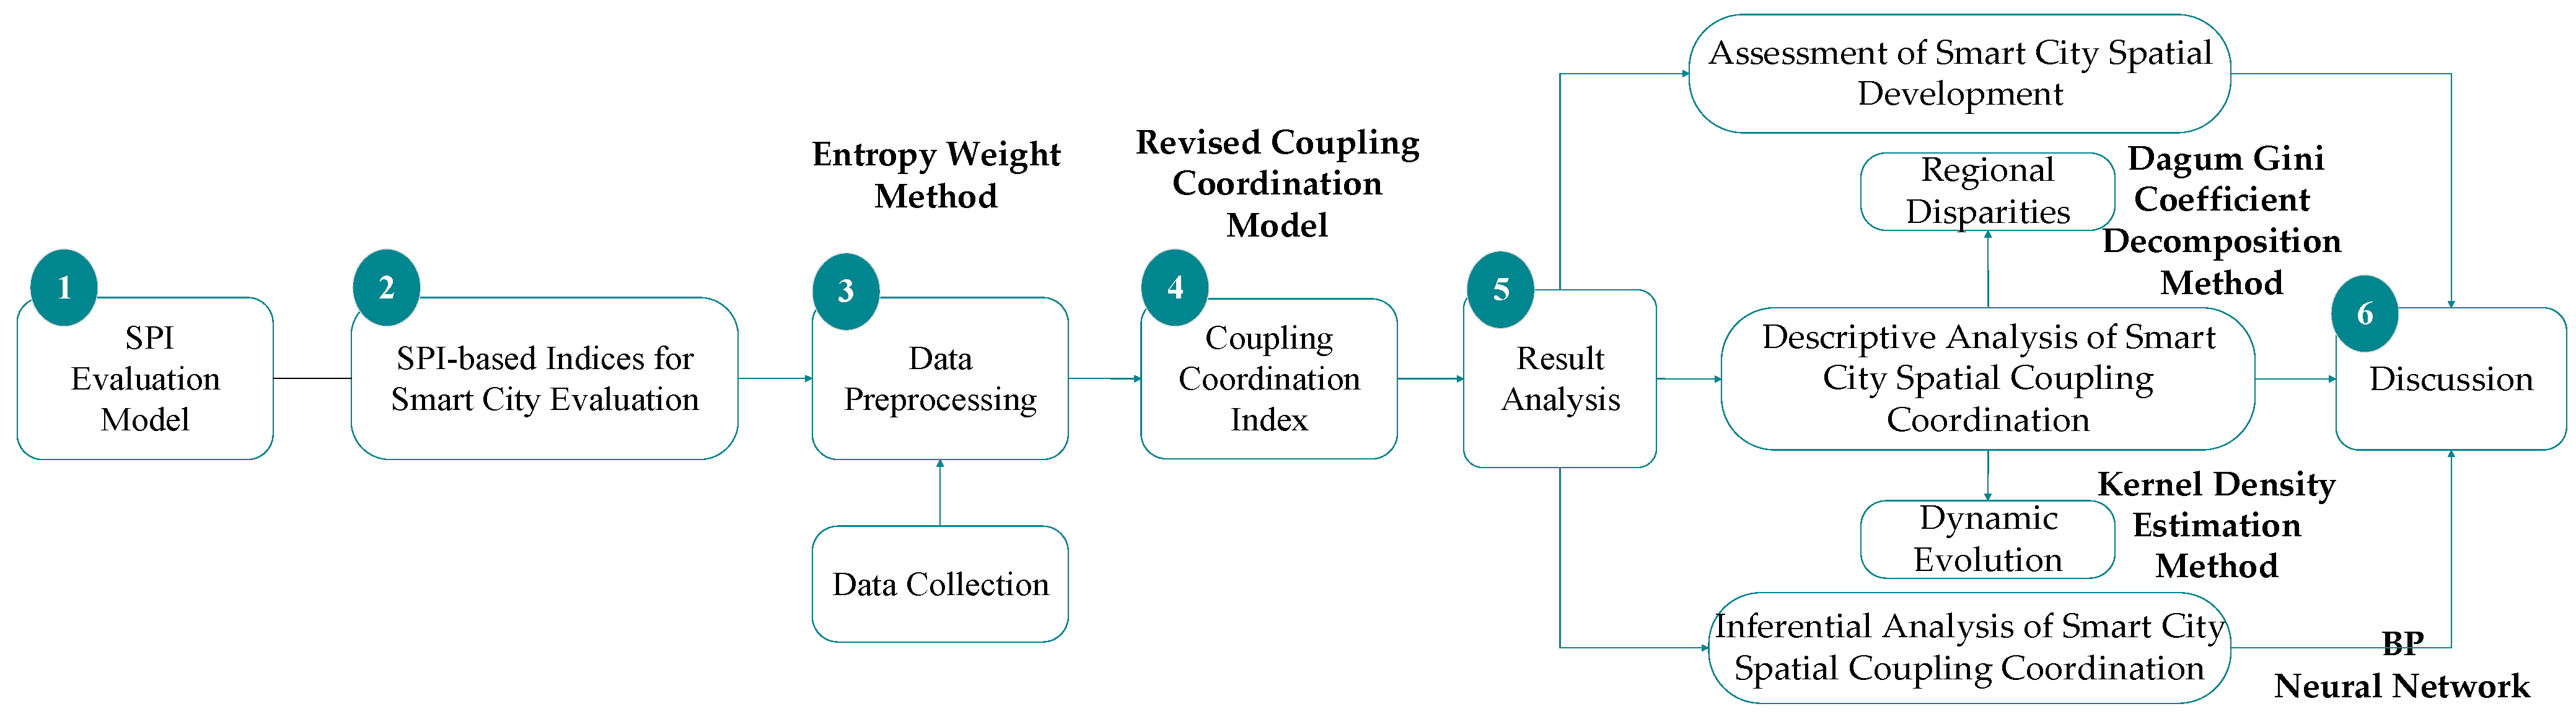
3. Methods and Data Sources
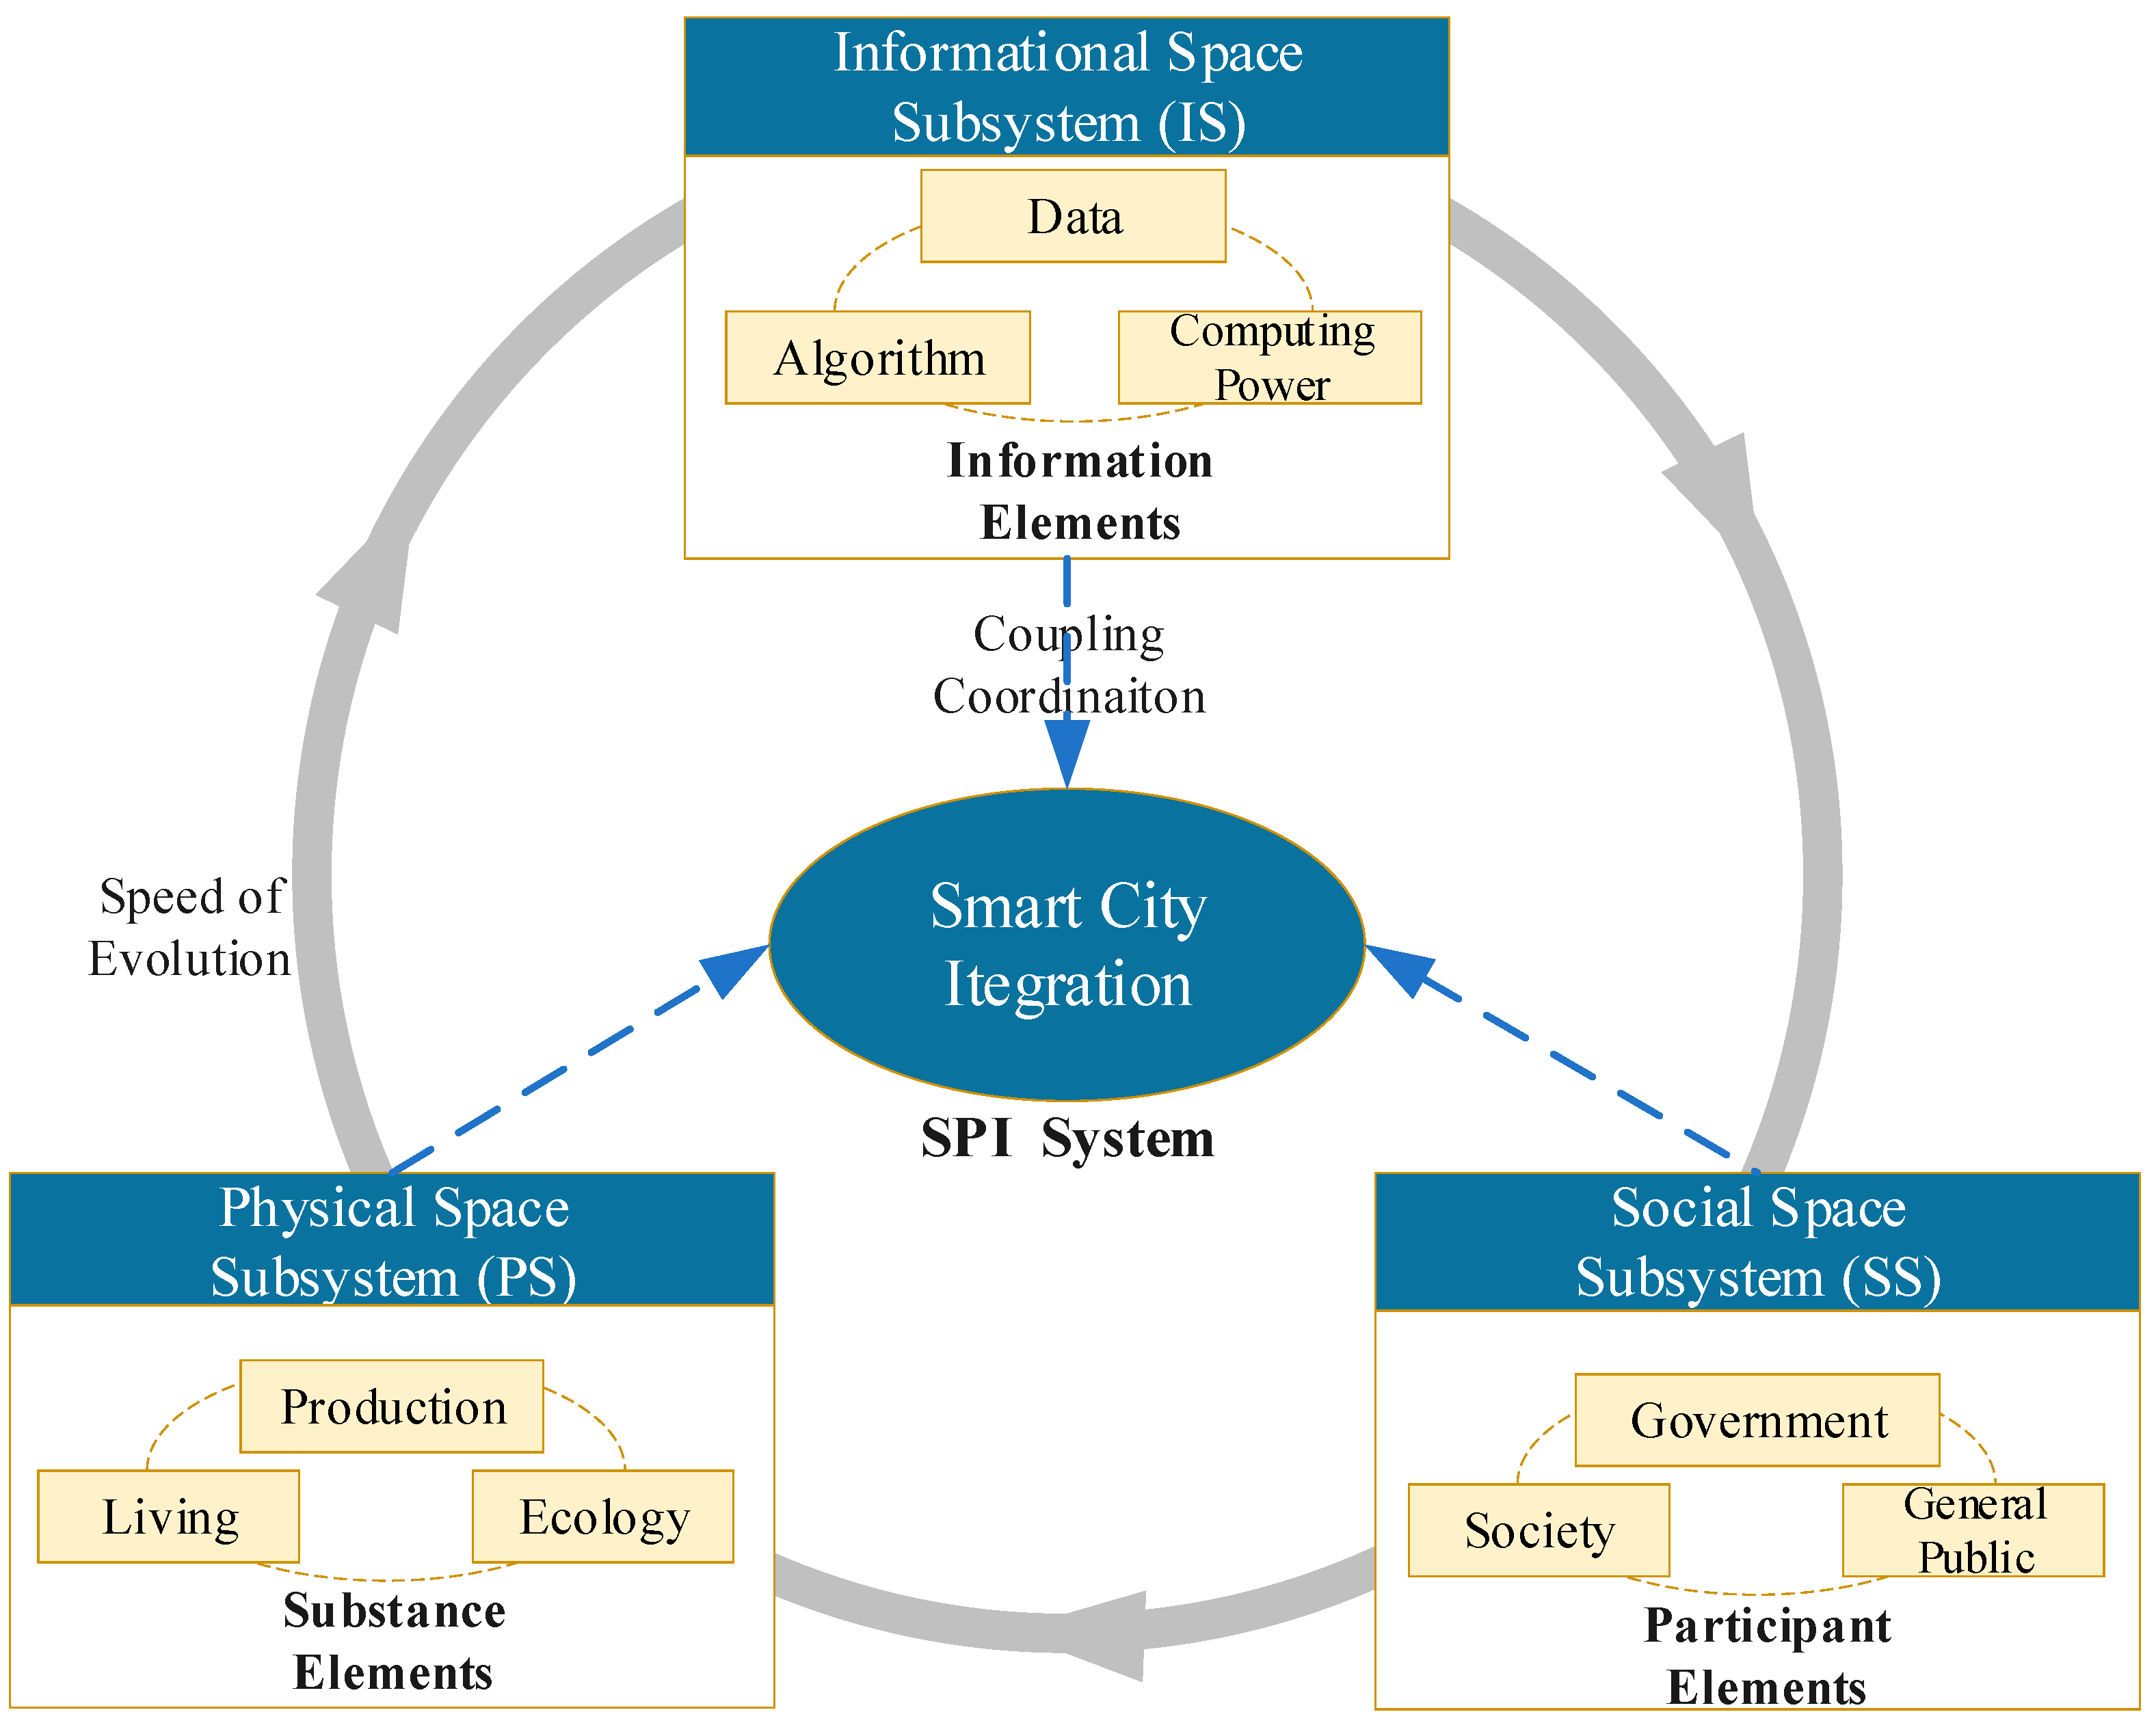
3.1. Modeling
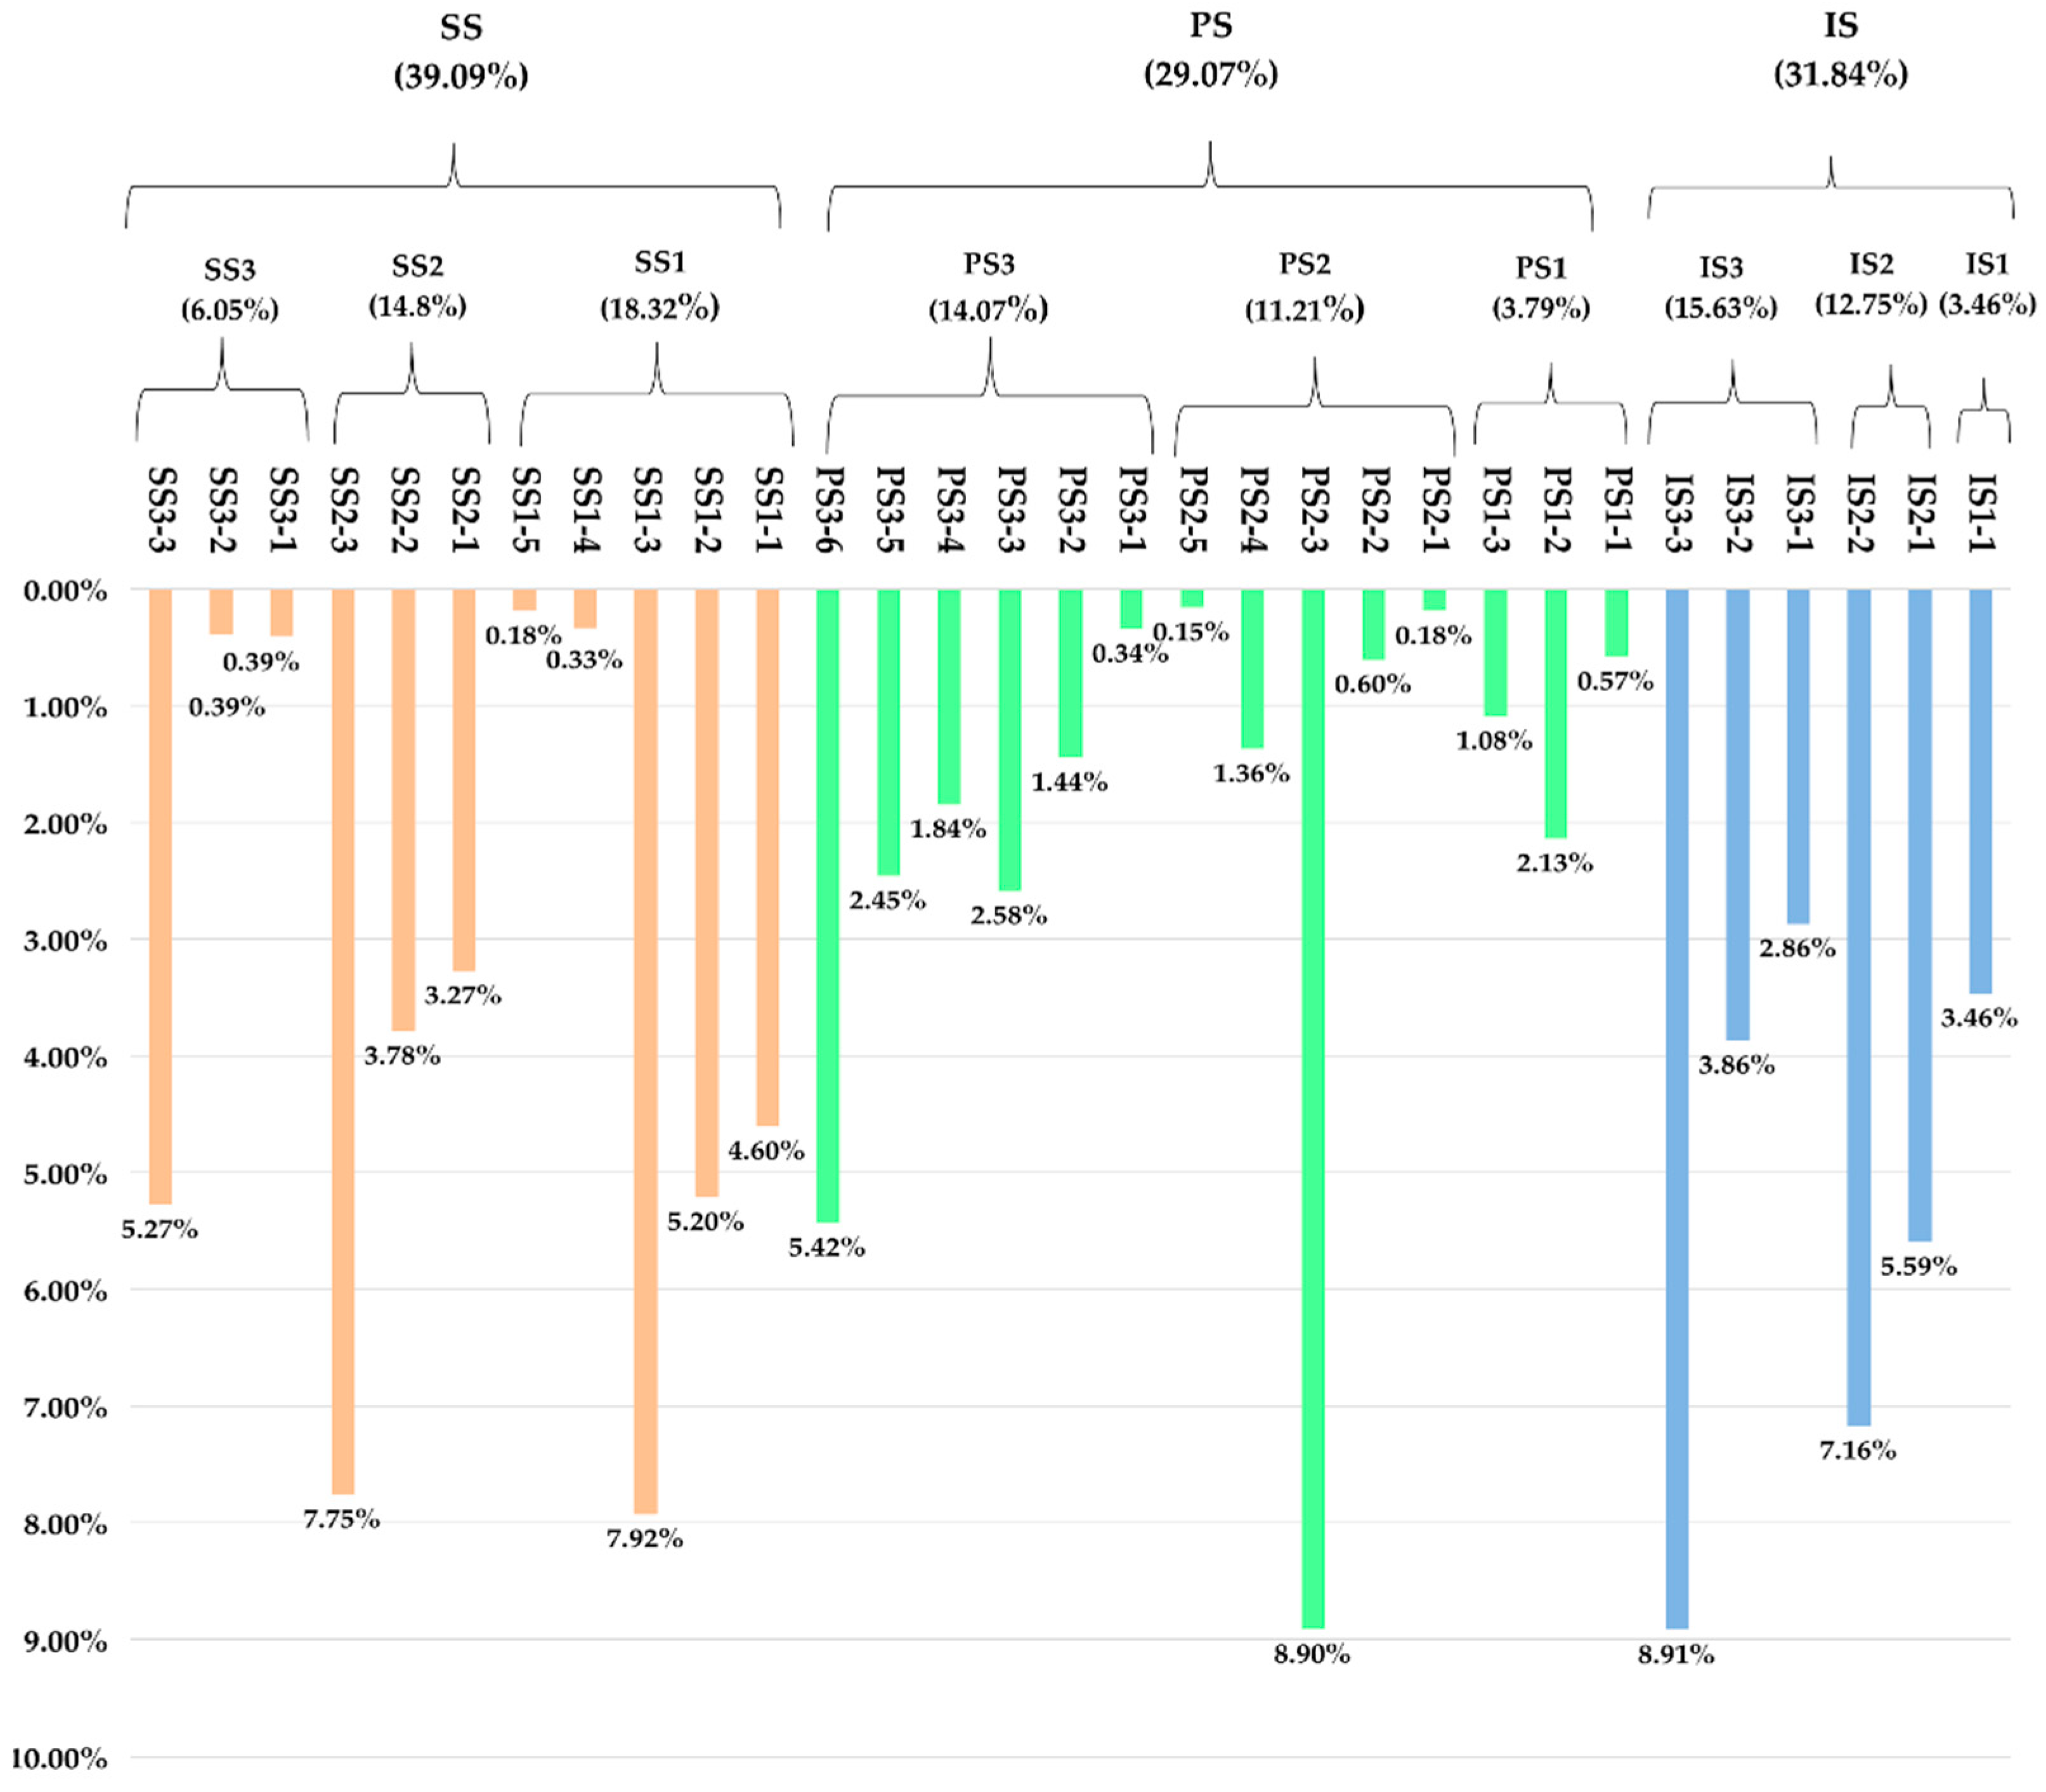
3.2. Construction of the Evaluation Index System
3.2.1. Construction of Evaluation Index System for Informational Space
3.2.2. Construction of Evaluation Index System for Physical Space
3.2.3. Construction of Evaluation Index System for Social Space
3.3. Methods
3.3.1. Entropy Weight Method
3.3.2. Revised Coupling Coordination
- , , and represent the comprehensive evaluation indices of the dimensions of information space, physical space, and social space, respectively.
- represents the coupling degree of the tri-dimensional space in smart city governance.
- represents the fusion coordination index of the tri-dimensional space in smart city governance, with a value range of [0, 1].
- represents the comprehensive development index of the coupling system in smart city governance, reflecting the synergistic effects among the tri-dimensional space in smart city governance.
- , and refer to the contribution degrees of information space, physical space, and social space in the coupling system, respectively.
- . The closer the value is to 1, the greater the contribution degree. This study considers the equal importance of the tri-dimensional space, hence .
3.3.3. Dagum Gini Coefficient Decomposition
- represents the number of cities;
- represents the number of subgroups, representing the eastern, central, western, and northeastern regions in this study;
- ( represents the number of cities in the -th subgroup;
- represents the number of divisions in the subgroup, and i and r represent the number of cities within the subgroup;
- G represents the overall Gini coefficient;
- represents the coordination level of any city in the -th subgroup;
- represents the average coordination level of the tri-dimensional space for all cities, calculated by ;
- represents the Gini coefficient between the -th subgroup and the -th subgroup;
- represents the average coordination level of the -th subgroup’s tri-dimensional space;
- represents the relative influence between region and region .
3.3.4. Kernel Density Estimation
- represents the number of study objects, representing the number of smart cities in the observed area in this study;
- represents the observation value of each smart city’s spatial coupling coordination in the observed area;
- represents the mean value of observation;
- is the kernel function;
- represents the bandwidth which determines the precision of the kernel density and the smoothness of the density graph; is usually adopted ( is the sample size, is the sample standard deviation).
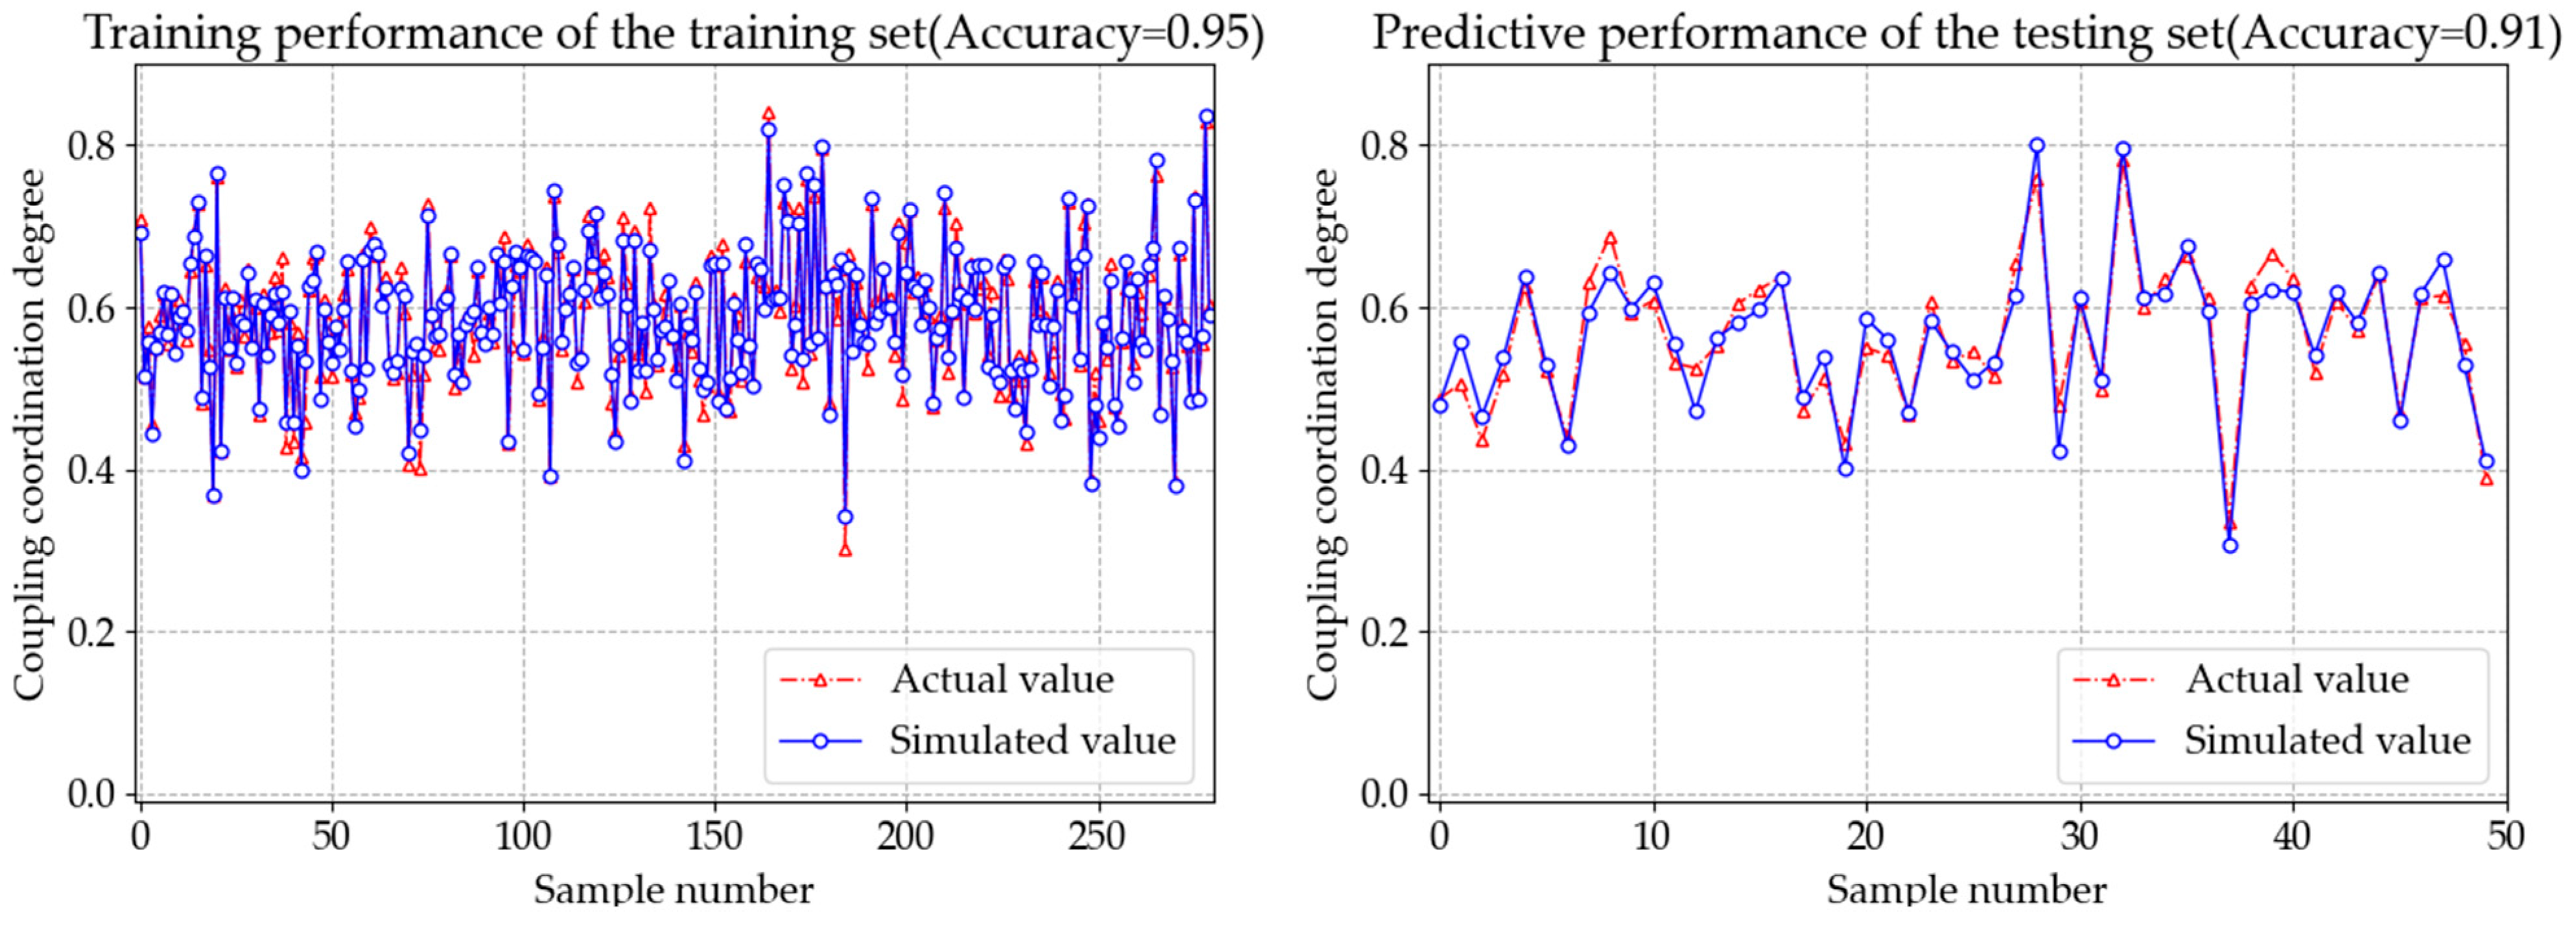
3.3.5. BP Neural Network
- represents the number of input layer nodes;
- represents the number of output layer nodes;
- represents a constant between 0 and 10;
- represents the number of hidden layer nodes.
3.4. Architecture of Methods
4. Results
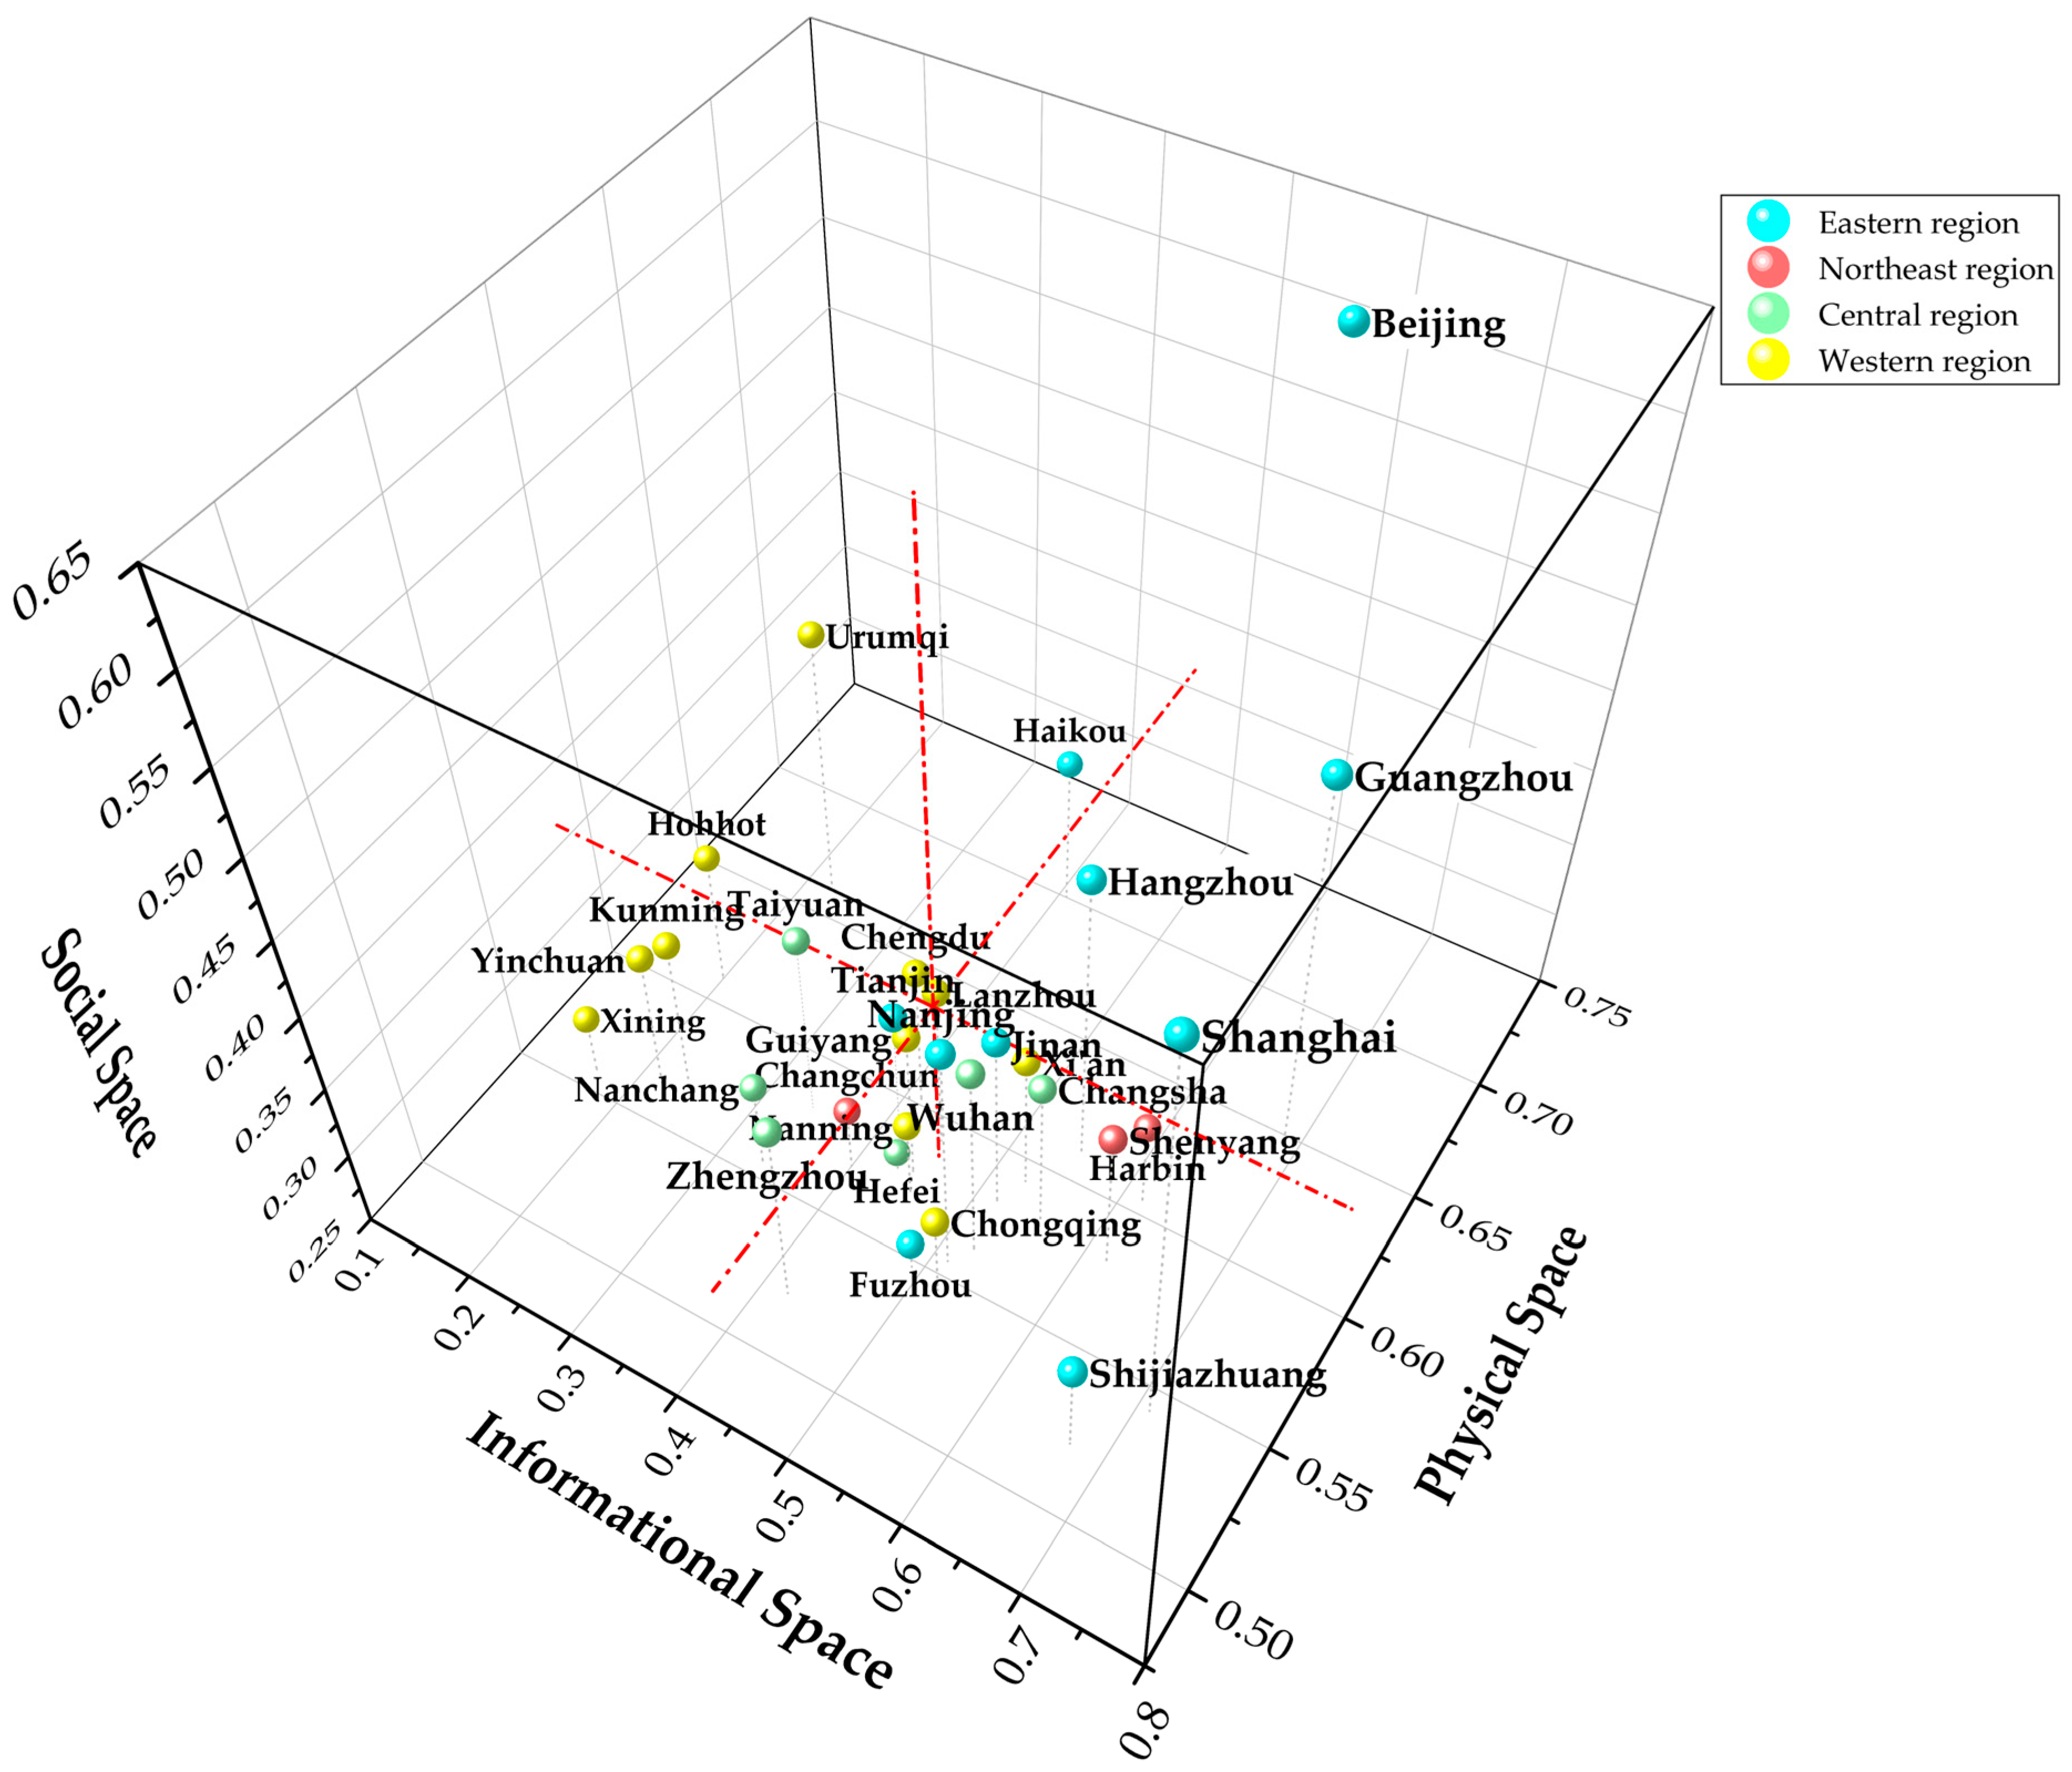
4.1. Assessment of Smart City Spatial Development
4.1.1. Comprehensive Assessment of Smart City Spatial Development
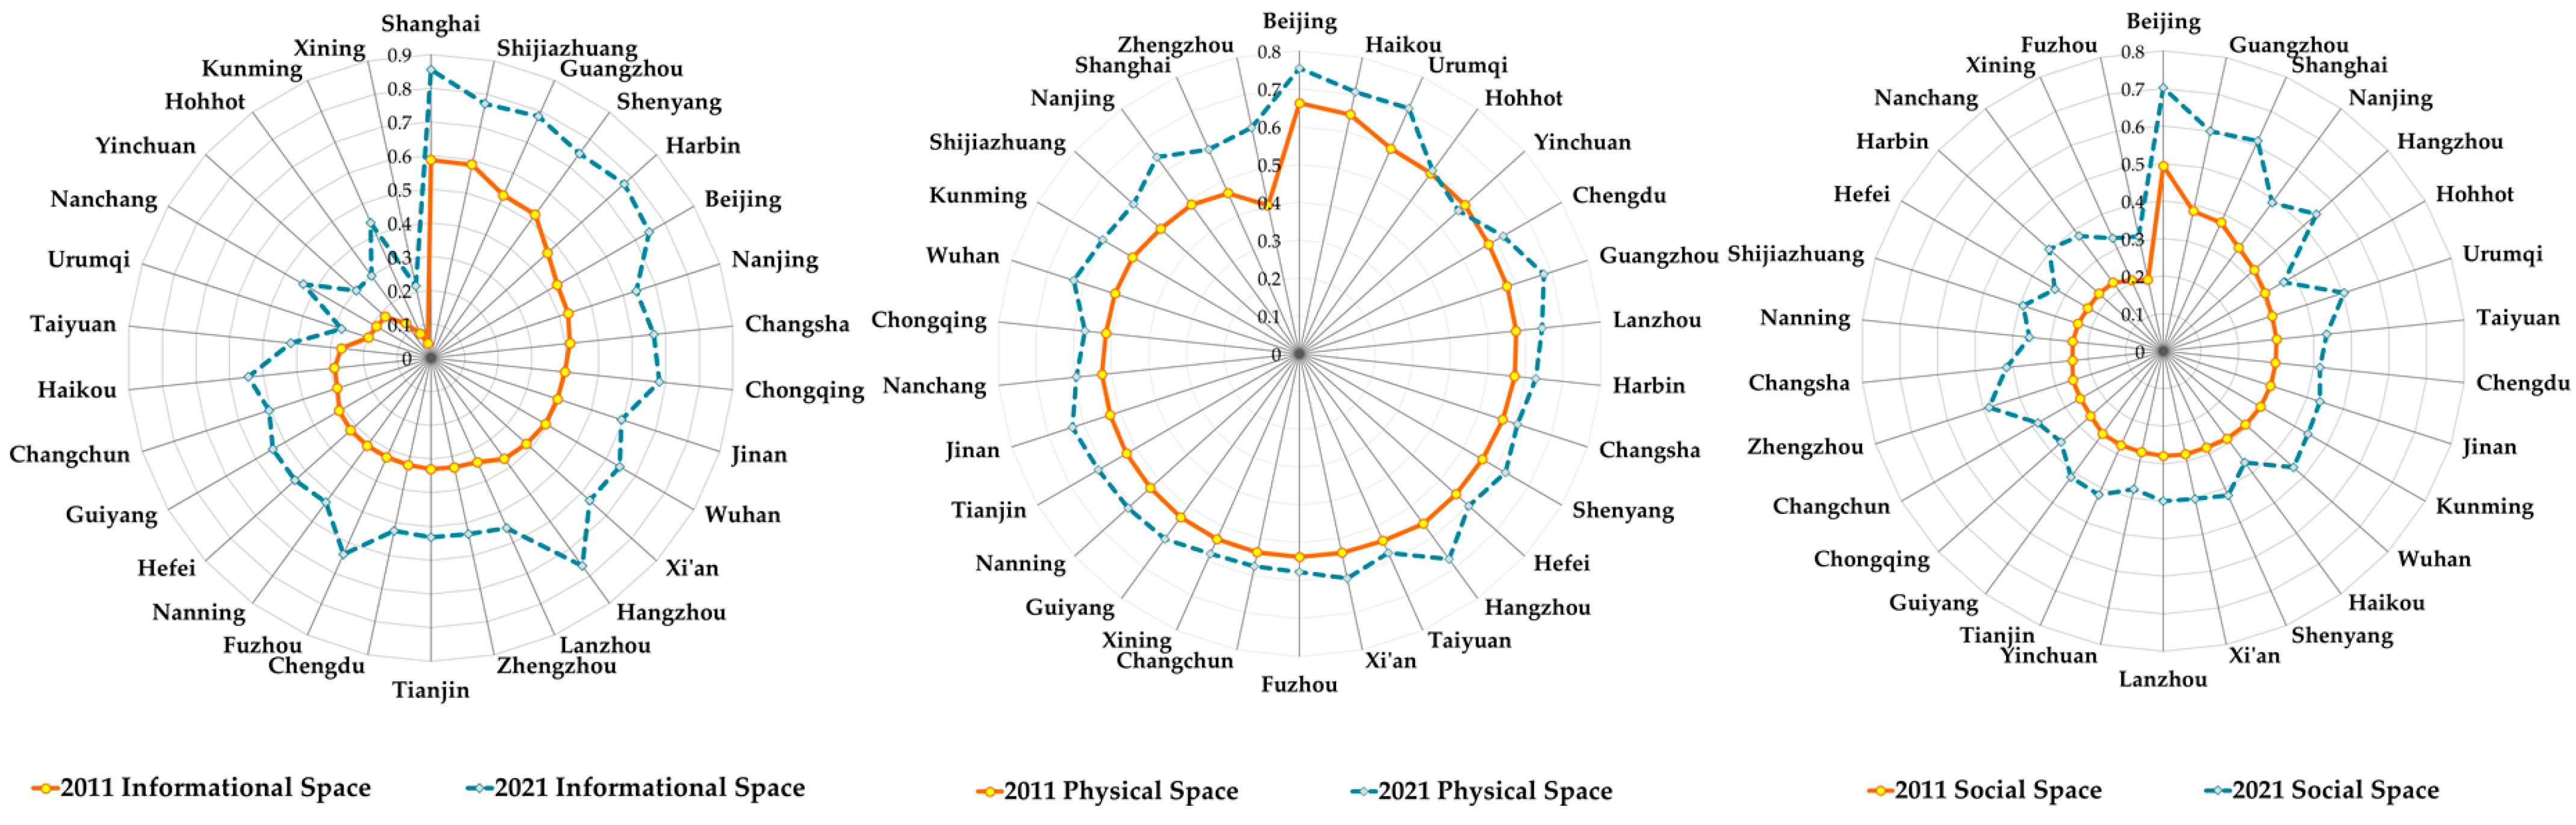
4.1.2. Subsystem Assessment of Smart City Spatial Development
4.2. Descriptive Analysis of Smart City Spatial Coupling Coordination
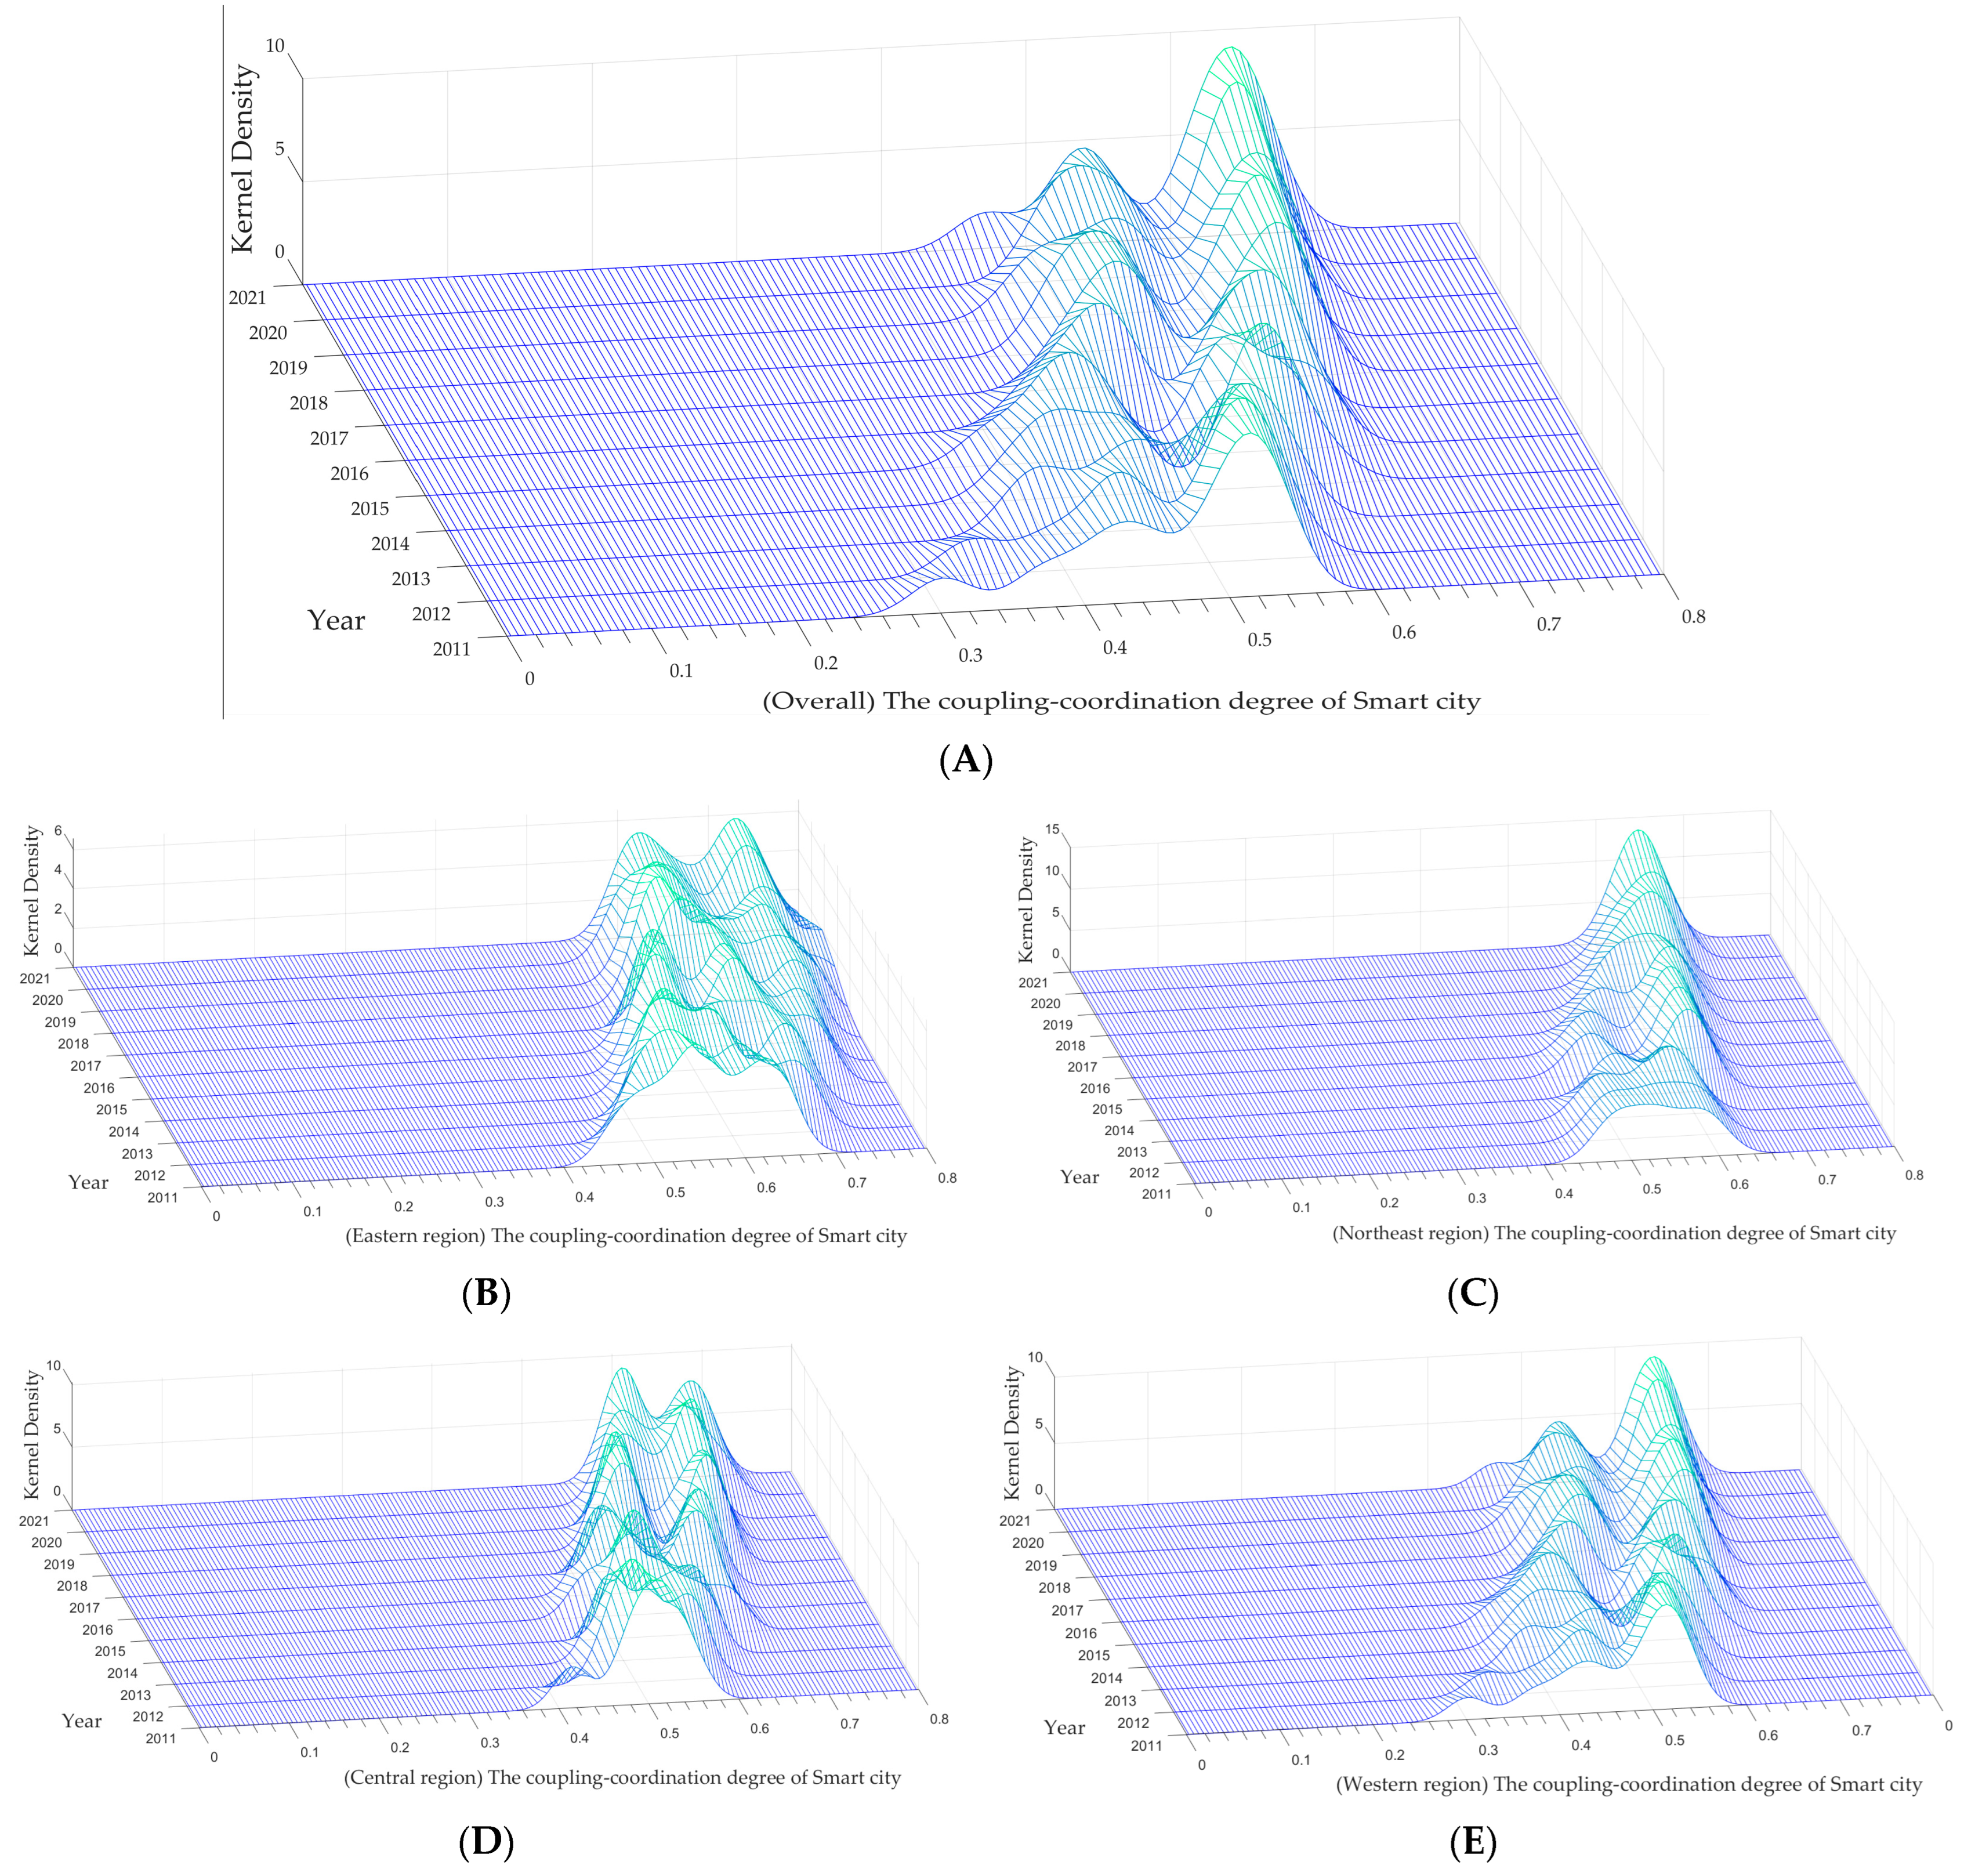
4.2.1. Overall Characteristics
4.2.2. Regional Disparities
4.2.3. Dynamic Evolution
4.3. Inferential Analysis of Smart City Spatial Coupling Coordination
5. Discussion
5.1. Pathways of Development
5.2. Limitations
6. Conclusions
6.1. Overall Positive Development Trend but Still in Early Stages
6.2. Important Influence of Regional Environment and Development Characteristics
6.3. Significant Differences of Contribution in Evaluation Indicators
Author Contributions
Funding
Data Availability Statement
Conflicts of Interest
References
- Shelton, T.; Zook, M.; Wiig, A. The ‘actually existing smart city’. Camb. J. Reg. Econ. Soc. 2015, 8, 13–25. [Google Scholar] [CrossRef]
- Khatibi, H.; Wilkinson, S.; Sweya, L.N.; Baghersad, M.; Dianat, H. Navigating Climate Change Challenges through Smart Resilient Cities: A Comprehensive Assessment Framework. Land 2024, 13, 266. [Google Scholar] [CrossRef]
- Qiu, Z. Establishment and Countermeasures of Smart City Security Risk Assessment Model. Adv. Comput. Commun. 2023, 3, 70–73. [Google Scholar] [CrossRef]
- Laufs, J.; Borrion, H.; Bradford, B. Security and the smart city: A systematic review. Sustain. Cities Soc. 2020, 55, 102023. [Google Scholar] [CrossRef]
- Niu, S.; Zhang, K.; Zhang, J.; Feng, Y. How Does Industrial Upgrading Affect Urban Ecological Efficiency? New Evidence from China. Emerg. Mark. Financ. Trade 2024, 60, 899–920. [Google Scholar] [CrossRef]
- Zheng, L. Content, Path and Direction of Urban Digital Transformation. Explor. Free Views 2021, 4, 147–152+180. [Google Scholar]
- Sun, X.; Liu, N. The Governance of Urban Community Public Space from the Perspective of Space Theory. Shanghai Urban Manag. 2022, 31, 61–67. [Google Scholar]
- Paroutis, S.; Bennett, M.; Heracleous, L. A strategic view on smart city technology: The case of IBM Smarter Cities during a recession. Technol. Forecast. Soc. Change 2014, 89, 262–272. [Google Scholar] [CrossRef]
- Ojo, A.; Curry, E.; Janowski, T. Designing next generation smart city initiatives-harnessing findings and lessons from a study of ten smart city programs. In Proceedings of the ECIS 2014 Proceedings-22nd European Conference on Information Systems, Tel Aviv, Israel, 9–11 June 2014. [Google Scholar]
- Shamsuzzoha, A.; Nieminen, J.; Piya, S.; Rutledge, K. Smart city for sustainable environment: A comparison of participatory strategies from Helsinki, Singapore and London. Cities 2021, 114, 103194. [Google Scholar] [CrossRef]
- Al Sharif, R.; Pokharel, S. Smart city dimensions and associated risks: Review of literature. Sustain. Cities Soc. 2022, 77, 103542. [Google Scholar] [CrossRef]
- Patrão, C.; Moura, P.; Almeida, A.T. Review of smart city assessment tools. Smart Cities 2020, 3, 1117–1132. [Google Scholar] [CrossRef]
- Sharifi, A. A typology of smart city assessment tools and indicator sets. Sustain. Cities Soc. 2020, 53, 101936. [Google Scholar] [CrossRef]
- Shi, G.; Liang, B.; Ye, T.; Zhou, K.; Sun, Z. Exploring the Coordinated Development of Smart-City Clusters in China: A Case Study of Jiangsu Province. Land 2024, 13, 308. [Google Scholar] [CrossRef]
- Deeb, Y.I.; Alqahtani, F.K.; Bin Mahmoud, A.A. Developing a Comprehensive Smart City Rating System: Case of Riyadh, Saudi Arabia. J. Urban Plan. Dev. 2024, 150, 04024012. [Google Scholar] [CrossRef]
- Joyce, A.; Javidroozi, V. Smart city development: Data sharing vs. data protection legislations. Cities 2024, 148, 104859. [Google Scholar] [CrossRef]
- Sorri, K.; Yrjönkoski, K.; Seppänen, M. Smart cities, smarter values: Unpacking the ecosystem of urban innovation. Technol. Soc. 2024, 77, 102499. [Google Scholar] [CrossRef]
- José, R.; Rodrigues, H. A Review on Key Innovation Challenges for Smart City Initiatives. Smart Cities 2024, 7, 141–162. [Google Scholar] [CrossRef]
- Kavitha, M.M.; Golden, E.J. Smarter and resilient smart contracts applications for smart cities environment using blockchain technology. Automatika 2024, 65, 572–583. [Google Scholar]
- Skyworks Showcases Its Momentum for Smart Cities, Automotive and More at the Consumer Electronics Show Booth No. 9627. Businesswire 9 January 2024.
- Deveci, M.; Pekaslan, D.; Canıtez, F. The assessment of smart city projects using zSlice type-2 fuzzy sets based Interval Agreement Method. Sustain. Cities Soc. 2020, 53, 101889. [Google Scholar] [CrossRef]
- Xiang, Y.; Xie, X. Digital twin city governance: Changes, dilemmas and countermeasures. E-Government 2021, 10, 69–80. [Google Scholar]
- Mei, J. Technology adapts to the city: Subject oppression and ethical dilemmas in digital transformation. Theory Reform 2021, 3, 90–101. [Google Scholar]
- Mao, Z.; Huang, Y.; Xu, X. Information Security Risk Analysis and Countermeasures of Smart City from the Perspective of Information Ecology. Chin. Public Adm. 2019, 9, 123–129. [Google Scholar]
- Zou, W.; Zhang, L. From Compartmentalization to Integration: The Compartmentalization Dilemma of Smart Cities and Strategies for Reconfiguring the Socio-Technical Imagination. J. Tianjin Adm. Inst. 2023, 25, 53–64. [Google Scholar]
- Bhattacharya, T.R.; Bhattacharya, A.; Mclellan, B.; Tezuka, T. Sustainable smart city development framework for develo** countries. Urban Res. Pract. 2020, 13, 180–212. [Google Scholar] [CrossRef]
- Richey, B.F. Risk Management Framework 2.0; Iowa State University: Ames, IA, USA, 2016. [Google Scholar]
- Hiller, J.S.; Russell, R.S. Privacy in crises: The NIST privacy framework. J. Contingencies Crisis Manag. 2017, 25, 31–38. [Google Scholar] [CrossRef]
- Abdullah, H.A.; Nizam, H.T.; Kutub, T. The Evolution of Information Security Strategies: A Comprehensive Investigation of INFOSEC Risk Assessment in the Contemporary Information Era. Comput. Inf. Sci. 2023, 16, 1. [Google Scholar]
- Meijer, A.; Bolívar, M.P.R. Governing the smart city: A review of the literature on smart urban governance. Int. Rev. Adm. Sci. 2016, 82, 392–408. [Google Scholar] [CrossRef]
- Neirotti, P.; De Marco, A.; Cagliano, A.C.; Mangano, G.; Scorrano, F. Current trends in Smart City initiatives: Some stylised facts. Cities 2014, 38, 25–36. [Google Scholar] [CrossRef]
- Winkowska, J.; Szpilko, D.; Pejić, S. Smart city concept in the light of the literature review. Eng. Manag. Prod. Serv. 2019, 11, 70–86. [Google Scholar] [CrossRef]
- Nam, T.; Pardo, T.A. Conceptualizing smart city with dimensions of technology, people, and institutions. In Proceedings of the 12th Annual International Digital Government Research Conference: Digital Government Innovation in Challenging Times, College Park, MD, USA, 12–15 June 2011; pp. 282–291. [Google Scholar]
- Yang, L.; Gan, Q.; Ma, D. Public environmental concern and corporate environmental investment—From the perspective of the moderating effect of green image. Financ. Account. Mon. 2020, 8, 33–40. [Google Scholar]
- Shan, Z.; Xu, Q.; Ma, C.; Tang, S.; Wang, W. Digital economy development evaluation system and prospects based on ternary space theory. Macroecon. Manag. 2020, 2, 42–49. [Google Scholar]
- Hui, P. Construction of Information Security Risk Assessment Model in Smart City. In Proceedings of the 2020 IEEE Conference on Telecommuni-cations, Optics and Computer Science (TOCS), Shenyang, China, 11–13 December 2020; pp. 393–396. [Google Scholar] [CrossRef]
- Liu, X.; Li, X.; He, W.; Shen, C. The Coupling Coordination Degree of Human-Land and the Spatial Allocation of “Production-Living-Ecological”: A Case Study of Jiangsu Province. Mod. Urban Res. 2022, 10, 66–72. [Google Scholar]
- Zhang, J.; Zhai, J. Measurement of coupling coordination degree in China’s “Three Living Spaces”. Urban Probl. 2019, 11, 38–44. [Google Scholar]
- Xie, G.; Jiang, S.; Zhao, C. Analysis of the coupling coordination level of regional economy, urbanization and social governance. Stat. Decis. 2020, 36, 127–130. [Google Scholar]
- Zou, X.; Xie, M.; Xiao, Z.; Wu, T.; Yin, Y. Evaluation of rural development and diagnosis of obstacle factors based on entropy weight topsis method. Chin. J. Agric. Resour. Reg. Plan. 2021, 42, 197–206. [Google Scholar]
- Li, R.; Huang, X.; Liu, Y. Spatio-temporal differentiation and influencing factors of China’s urbanization from 2010 to 2020. Acta Geogr. Sin. 2023, 78, 777–791. [Google Scholar]
- Wang, S.J.; Kong, W.; Ren, L.; Zhi, D.D. Research on misuses and modification of coupling coordination degree model in China. J. Nat. Resour. 2021, 36, 793–810. [Google Scholar] [CrossRef]
- Wu, C.; Zhou, X.; Huang, C. Study on the coupling and coordination relationship between the optimization of industrial structure and the construction of ecological civilization of ecological civilization in the Yangtze River Economic Belt. J. Cent. China Norm. Univ. (Nat. Sci.) 2020, 54, 555–566. [Google Scholar]
- Ge, S.S.; Zeng, G.; Yang, Y.; Hu, H. The coupling relationship and spatial characteristics analysis between ecological civilization construction and urbanization in the Yellow River Economic Belt. J. Nat. Resour. 2021, 36, 87–102. [Google Scholar] [CrossRef]
- Zhang, P.; Yang, X.; Chen, Z. Neural network gain scheduling design for large envelope curve flight control law. J. Beijing Univ. Aeronaut. Astronaut. 2005, 31, 604–608. [Google Scholar]
- Yang, X.; Gong, G.; Tian, Y.; Yu, X. Generalized Optimal Game Theory in virtual decision-makings. In Proceedings of the 2008 Chinese Control and Decision Conference, Yantai, China, 2–4 July 2008; pp. 2–4. [Google Scholar]
- Shen, H.; Wang, Z.; Gao, C.; Qin, J.; Yao, F.; Xu, W. Determining the number of BP neural network hidden layer units. J. Tianjin Univ. Technol. 2008, 5, 13–15. [Google Scholar]
- Meng, F.; Wu, X. Revisiting “Smart City”: Three Basic Research Questions—Based on a Systematic Review of English Literature. Public Adm. Policy Rev. 2022, 11, 148–168. [Google Scholar]


| Target Level | Standardized Layer | Index Layer | NO. | Index Properties | Weight | Source |
|---|---|---|---|---|---|---|
| Informational Space Subsystem (IS) | Data (IS1) | Peking University Digital Inclusive Finance Index | IS1-1 | + | 0.167 | [35] |
| Algorithm (IS2) | R&D personnel ratio (%) | IS2-1 | + | 0.167 | [35,36] | |
| The proportion of employees in the information transmission, computer services, and software industries (%) | IS2-2 | + | 0.163 | [35] | ||
| Computational Power (IS3) | Internet penetration (%) | IS3-1 | + | 0.170 | [35] | |
| Per capita total telecommunications services (yuan) | IS3-2 | + | 0.169 | [35] | ||
| The proportion of mobile phone users at the end of the year (%) | IS3-3 | + | 0.164 | [35] |
| Target Level | Standardized Layer | Index Layer | NO. | Index Properties | Weight | Source |
|---|---|---|---|---|---|---|
| Physical Space Subsystem (PS) | Production (PS1) | The proportion of production land (%) | PS1-1 | + | 0.063 | [38] |
| Advanced industrial structure (%) | PS1-2 | + | 0.071 | [38] | ||
| Upgrading of industrial structure (%) | PS1-3 | + | 0.072 | [38] | ||
| Living (PS2) | Population density (%) | PS2-1 | − | 0.073 | [37,39] | |
| Public library holdings per capita (volume) | PS2-2 | + | 0.067 | [35,38,39] | ||
| Per capita park green space area (square meters) | PS2-3 | + | 0.068 | [37,38,39] | ||
| Per capita medical institutions | PS2-4 | + | 0.072 | [38,39] | ||
| Per capita educational resources (persons) | PS2-5 | + | 0.074 | [38,39] | ||
| Ecology (PS3) | GDP energy intensity (yuan/billion kilowatt hours) | PS3-1 | − | 0.074 | Original | |
| Industrial wastewater discharge intensity (%) | PS3-2 | − | 0.074 | [37,38] | ||
| Industrial sulfur dioxide emission intensity (%) | PS3-3 | − | 0.074 | [37,38] | ||
| Harmless treatment rate of household waste (%) | PS3-4 | + | 0.074 | [37,38] | ||
| Industrial smoke (powder) dust emission intensity (%) | PS3-5 | − | 0.074 | [38] | ||
| Comprehensive utilization rate of general industrial solid waste (%) | PS3-6 | + | 0.073 | [38] |
| Target Level | Standardized Layer | Index Layer | NO. | Index Properties | Weight | Source |
|---|---|---|---|---|---|---|
| Social Space Subsystem (SS) | Government (SS1) | Unemployment rate (%) | SS1-1 | − | 0.095 | [37,39] |
| Government financial support (%) | SS1-2 | + | 0.091 | [37,39] | ||
| The proportion of insured individuals in unemployment insurance (%) | SS1-3 | + | 0.087 | [39] | ||
| The proportion of urban employees participating in basic pension insurance (%) | SS1-4 | + | 0.089 | [39] | ||
| The proportion of urban employees participating in basic medical insurance (%) | SS1-5 | + | 0.089 | [39] | ||
| Society (SS2) | Network search index | SS2-1 | + | 0.092 | [34] | |
| The proportion of employees in public management and social organizations (%) | SS2-2 | + | 0.091 | Original | ||
| The proportion of employees in the health, social insurance, and social welfare industries (%) | SS2-3 | + | 0.093 | Original | ||
| General Public (SS3) | Average salary of employees (yuan) | SS3-1 | + | 0.090 | Original | |
| Per capita education level (year) | SS3-2 | + | 0.092 | [37] | ||
| Per capita year-end RMB deposit balance of financial institutions (yuan) | SS3-3 | + | 0.090 | Original |
| Coordination Phase | Degree of Coupling Coordination | Coordination Index |
|---|---|---|
| Disordered type | Extremely disordered | (0, 0.1] |
| Severely disordered | (0.1, 0.2] | |
| Mildly disordered | (0.2, 0.3] | |
| Endangered coordination | (0.3, 0.4] | |
| Transition type | Fragile coordination | (0.4, 0.5] |
| Barely coordinated | (0.5, 0.6] | |
| Basic coordination | (0.6, 0.7] | |
| Coordinated development | Intermediate coordination | (0.7, 0.8] |
| Well-coordinated | (0.8, 0.9] | |
| High-quality coordination | (0.9, 1] |
| City (Ranked) | 2011 | 2012 | 2013 | 2014 | 2015 | 2016 | 2017 | 2018 | 2019 | 2020 | 2021 |
|---|---|---|---|---|---|---|---|---|---|---|---|
| Beijing | 0.638 | 0.667 | 0.693 | 0.708 | 0.718 | 0.737 | 0.759 | 0.782 | 0.796 | 0.829 | 0.841 |
| Guangzhou | 0.639 | 0.677 | 0.662 | 0.722 | 0.721 | 0.727 | 0.736 | 0.730 | 0.759 | 0.759 | 0.762 |
| Shanghai | 0.610 | 0.626 | 0.667 | 0.661 | 0.679 | 0.700 | 0.713 | 0.723 | 0.728 | 0.730 | 0.723 |
| Hangzhou | 0.550 | 0.603 | 0.604 | 0.664 | 0.644 | 0.652 | 0.693 | 0.703 | 0.727 | 0.728 | 0.737 |
| Nanjing | 0.593 | 0.597 | 0.589 | 0.626 | 0.637 | 0.647 | 0.653 | 0.665 | 0.687 | 0.711 | 0.723 |
| Wuhan | 0.547 | 0.564 | 0.590 | 0.631 | 0.622 | 0.629 | 0.648 | 0.662 | 0.665 | 0.704 | 0.704 |
| Jinan | 0.550 | 0.549 | 0.589 | 0.611 | 0.637 | 0.638 | 0.654 | 0.659 | 0.651 | 0.667 | 0.681 |
| Shenyang | 0.584 | 0.590 | 0.586 | 0.611 | 0.611 | 0.619 | 0.635 | 0.646 | 0.644 | 0.664 | 0.663 |
| Changsha | 0.520 | 0.556 | 0.575 | 0.589 | 0.611 | 0.635 | 0.661 | 0.665 | 0.663 | 0.665 | 0.668 |
| Xi’an | 0.533 | 0.552 | 0.571 | 0.606 | 0.617 | 0.608 | 0.634 | 0.624 | 0.650 | 0.648 | 0.667 |
| Harbin | 0.529 | 0.540 | 0.553 | 0.601 | 0.608 | 0.610 | 0.620 | 0.611 | 0.637 | 0.649 | 0.650 |
| Zhengzhou | 0.514 | 0.517 | 0.549 | 0.554 | 0.590 | 0.604 | 0.639 | 0.629 | 0.655 | 0.665 | 0.688 |
| Lanzhou | 0.511 | 0.516 | 0.556 | 0.570 | 0.610 | 0.607 | 0.622 | 0.623 | 0.646 | 0.632 | 0.645 |
| Tianjin | 0.510 | 0.548 | 0.543 | 0.588 | 0.579 | 0.588 | 0.605 | 0.615 | 0.634 | 0.639 | 0.654 |
| Guiyang | 0.501 | 0.540 | 0.540 | 0.564 | 0.582 | 0.581 | 0.622 | 0.630 | 0.637 | 0.640 | 0.656 |
| Average | 0.505 | 0.523 | 0.539 | 0.562 | 0.568 | 0.582 | 0.607 | 0.612 | 0.625 | 0.636 | 0.646 |
| Chongqing | 0.530 | 0.503 | 0.516 | 0.571 | 0.552 | 0.603 | 0.620 | 0.624 | 0.626 | 0.627 | 0.625 |
| Shijiazhuang | 0.542 | 0.524 | 0.542 | 0.554 | 0.556 | 0.570 | 0.613 | 0.604 | 0.610 | 0.634 | 0.631 |
| Chengdu | 0.515 | 0.519 | 0.511 | 0.561 | 0.545 | 0.559 | 0.591 | 0.600 | 0.607 | 0.626 | 0.648 |
| Nanning | 0.487 | 0.520 | 0.540 | 0.546 | 0.555 | 0.569 | 0.585 | 0.589 | 0.604 | 0.619 | 0.619 |
| Fuzhou | 0.459 | 0.506 | 0.532 | 0.547 | 0.556 | 0.558 | 0.615 | 0.593 | 0.592 | 0.594 | 0.606 |
| Taiyuan | 0.492 | 0.492 | 0.525 | 0.525 | 0.543 | 0.548 | 0.566 | 0.569 | 0.616 | 0.625 | 0.622 |
| Haikou | 0.487 | 0.490 | 0.518 | 0.526 | 0.544 | 0.561 | 0.582 | 0.593 | 0.608 | 0.594 | 0.614 |
| Changchun | 0.481 | 0.486 | 0.490 | 0.522 | 0.509 | 0.521 | 0.548 | 0.573 | 0.593 | 0.609 | 0.631 |
| Hefei | 0.477 | 0.497 | 0.481 | 0.526 | 0.530 | 0.505 | 0.541 | 0.553 | 0.577 | 0.594 | 0.611 |
| Nanchang | 0.415 | 0.470 | 0.482 | 0.510 | 0.487 | 0.518 | 0.557 | 0.561 | 0.582 | 0.588 | 0.601 |
| Urumqi | 0.446 | 0.434 | 0.472 | 0.468 | 0.471 | 0.491 | 0.526 | 0.519 | 0.541 | 0.547 | 0.552 |
| Kunming | 0.369 | 0.388 | 0.440 | 0.468 | 0.456 | 0.461 | 0.511 | 0.530 | 0.545 | 0.555 | 0.632 |
| Yinchuan | 0.429 | 0.455 | 0.463 | 0.422 | 0.431 | 0.493 | 0.507 | 0.507 | 0.519 | 0.520 | 0.536 |
| Hohhot | 0.407 | 0.432 | 0.402 | 0.426 | 0.436 | 0.477 | 0.468 | 0.486 | 0.491 | 0.514 | 0.531 |
| Xining | 0.301 | 0.335 | 0.385 | 0.392 | 0.390 | 0.432 | 0.491 | 0.479 | 0.471 | 0.498 | 0.472 |
| Year | The Overall Gini Coefficient | The Intra-Group Gini Coefficient | The Inter-Group Gini Coefficient | The Contribution of Hyperdensity |
|---|---|---|---|---|
| 2011 | 0.079 | 0.019 | 0.048 | 0.012 |
| 2012 | 0.076 | 0.018 | 0.048 | 0.010 |
| 2013 | 0.072 | 0.017 | 0.046 | 0.009 |
| 2014 | 0.077 | 0.018 | 0.048 | 0.011 |
| 2015 | 0.079 | 0.018 | 0.042 | 0.018 |
| 2016 | 0.071 | 0.016 | 0.036 | 0.018 |
| 2017 | 0.064 | 0.014 | 0.034 | 0.015 |
| 2018 | 0.064 | 0.015 | 0.032 | 0.017 |
| 2019 | 0.063 | 0.015 | 0.039 | 0.008 |
| 2020 | 0.062 | 0.015 | 0.039 | 0.008 |
| 2021 | 0.059 | 0.015 | 0.035 | 0.010 |
| Decomposition | 2011 | 2012 | 2013 | 2014 | 2015 | 2016 | 2017 | 2018 | 2019 | 2020 | 2021 | |
|---|---|---|---|---|---|---|---|---|---|---|---|---|
| The intra-group Gini coefficient | EC | 0.060 | 0.061 | 0.056 | 0.059 | 0.057 | 0.057 | 0.049 | 0.053 | 0.056 | 0.059 | 0.056 |
| NE | 0.033 | 0.035 | 0.032 | 0.035 | 0.030 | 0.030 | 0.029 | 0.028 | 0.020 | 0.022 | 0.020 | |
| CI | 0.037 | 0.012 | 0.019 | 0.007 | 0.024 | 0.018 | 0.010 | 0.006 | 0.014 | 0.014 | 0.008 | |
| WE | 0.085 | 0.077 | 0.069 | 0.077 | 0.083 | 0.065 | 0.058 | 0.057 | 0.060 | 0.052 | 0.056 | |
| The inter-group Gini coefficient | EC-WE | 0.108 | 0.108 | 0.100 | 0.108 | 0.109 | 0.096 | 0.087 | 0.089 | 0.089 | 0.089 | 0.084 |
| EC-CI | 0.098 | 0.088 | 0.090 | 0.088 | 0.093 | 0.098 | 0.088 | 0.086 | 0.071 | 0.070 | 0.067 | |
| EC-NE | 0.055 | 0.057 | 0.053 | 0.056 | 0.056 | 0.055 | 0.048 | 0.049 | 0.049 | 0.050 | 0.047 | |
| NE-WE | 0.081 | 0.078 | 0.074 | 0.081 | 0.084 | 0.071 | 0.064 | 0.064 | 0.061 | 0.064 | 0.057 | |
| NE-CI | 0.070 | 0.056 | 0.062 | 0.059 | 0.070 | 0.073 | 0.062 | 0.059 | 0.043 | 0.047 | 0.044 | |
| CI-WE | 0.069 | 0.059 | 0.054 | 0.064 | 0.067 | 0.056 | 0.050 | 0.049 | 0.049 | 0.043 | 0.043 | |
Disclaimer/Publisher’s Note: The statements, opinions and data contained in all publications are solely those of the individual author(s) and contributor(s) and not of MDPI and/or the editor(s). MDPI and/or the editor(s) disclaim responsibility for any injury to people or property resulting from any ideas, methods, instructions or products referred to in the content. |
© 2024 by the authors. Licensee MDPI, Basel, Switzerland. This article is an open access article distributed under the terms and conditions of the Creative Commons Attribution (CC BY) license (https://creativecommons.org/licenses/by/4.0/).
Share and Cite
Wang, C.; Zhu, C.; Du, M. Spatial Development and Coupling Coordination of Society–Physics–Informational Smart Cities: A Case Study on Thirty Capitals in China. Land 2024, 13, 872. https://doi.org/10.3390/land13060872
Wang C, Zhu C, Du M. Spatial Development and Coupling Coordination of Society–Physics–Informational Smart Cities: A Case Study on Thirty Capitals in China. Land. 2024; 13(6):872. https://doi.org/10.3390/land13060872
Chicago/Turabian StyleWang, Chao, Changhao Zhu, and Mingrun Du. 2024. "Spatial Development and Coupling Coordination of Society–Physics–Informational Smart Cities: A Case Study on Thirty Capitals in China" Land 13, no. 6: 872. https://doi.org/10.3390/land13060872
APA StyleWang, C., Zhu, C., & Du, M. (2024). Spatial Development and Coupling Coordination of Society–Physics–Informational Smart Cities: A Case Study on Thirty Capitals in China. Land, 13(6), 872. https://doi.org/10.3390/land13060872