Spatio-Temporal Dynamics Coupling between Land Use/Cover Change and Water Quality in Dongjiang Lake Watershed Using Satellite Remote Sensing
Abstract
1. Introduction
2. Materials and Methods
2.1. Study Area
2.2. Data Resource
2.3. Inversion of Water Quality Variables
2.4. WQI Calculation
2.5. Method for Coupling WQI and LUCC
2.5.1. Land Use Classification Methods Based on the Random Forest Method
2.5.2. Comparison of WQI and LUCC Coupled Models Based on Machine Learning Regression Method and Polynomial Regression Method
- Support Vector Machine (SVM);
- RF;
- Multiple Linear Regression Model (MLRM);
- Mixed Effects Regression Model (MERM);
- Polynomial Regression Method;
3. Results
3.1. Inversion Results of Water Quality Variables
3.2. WQI Calculation Results
3.3. Result of Spatial and Temporal Dynamic Coupling between Water Quality and LUCC
3.3.1. Land Use Classification Results
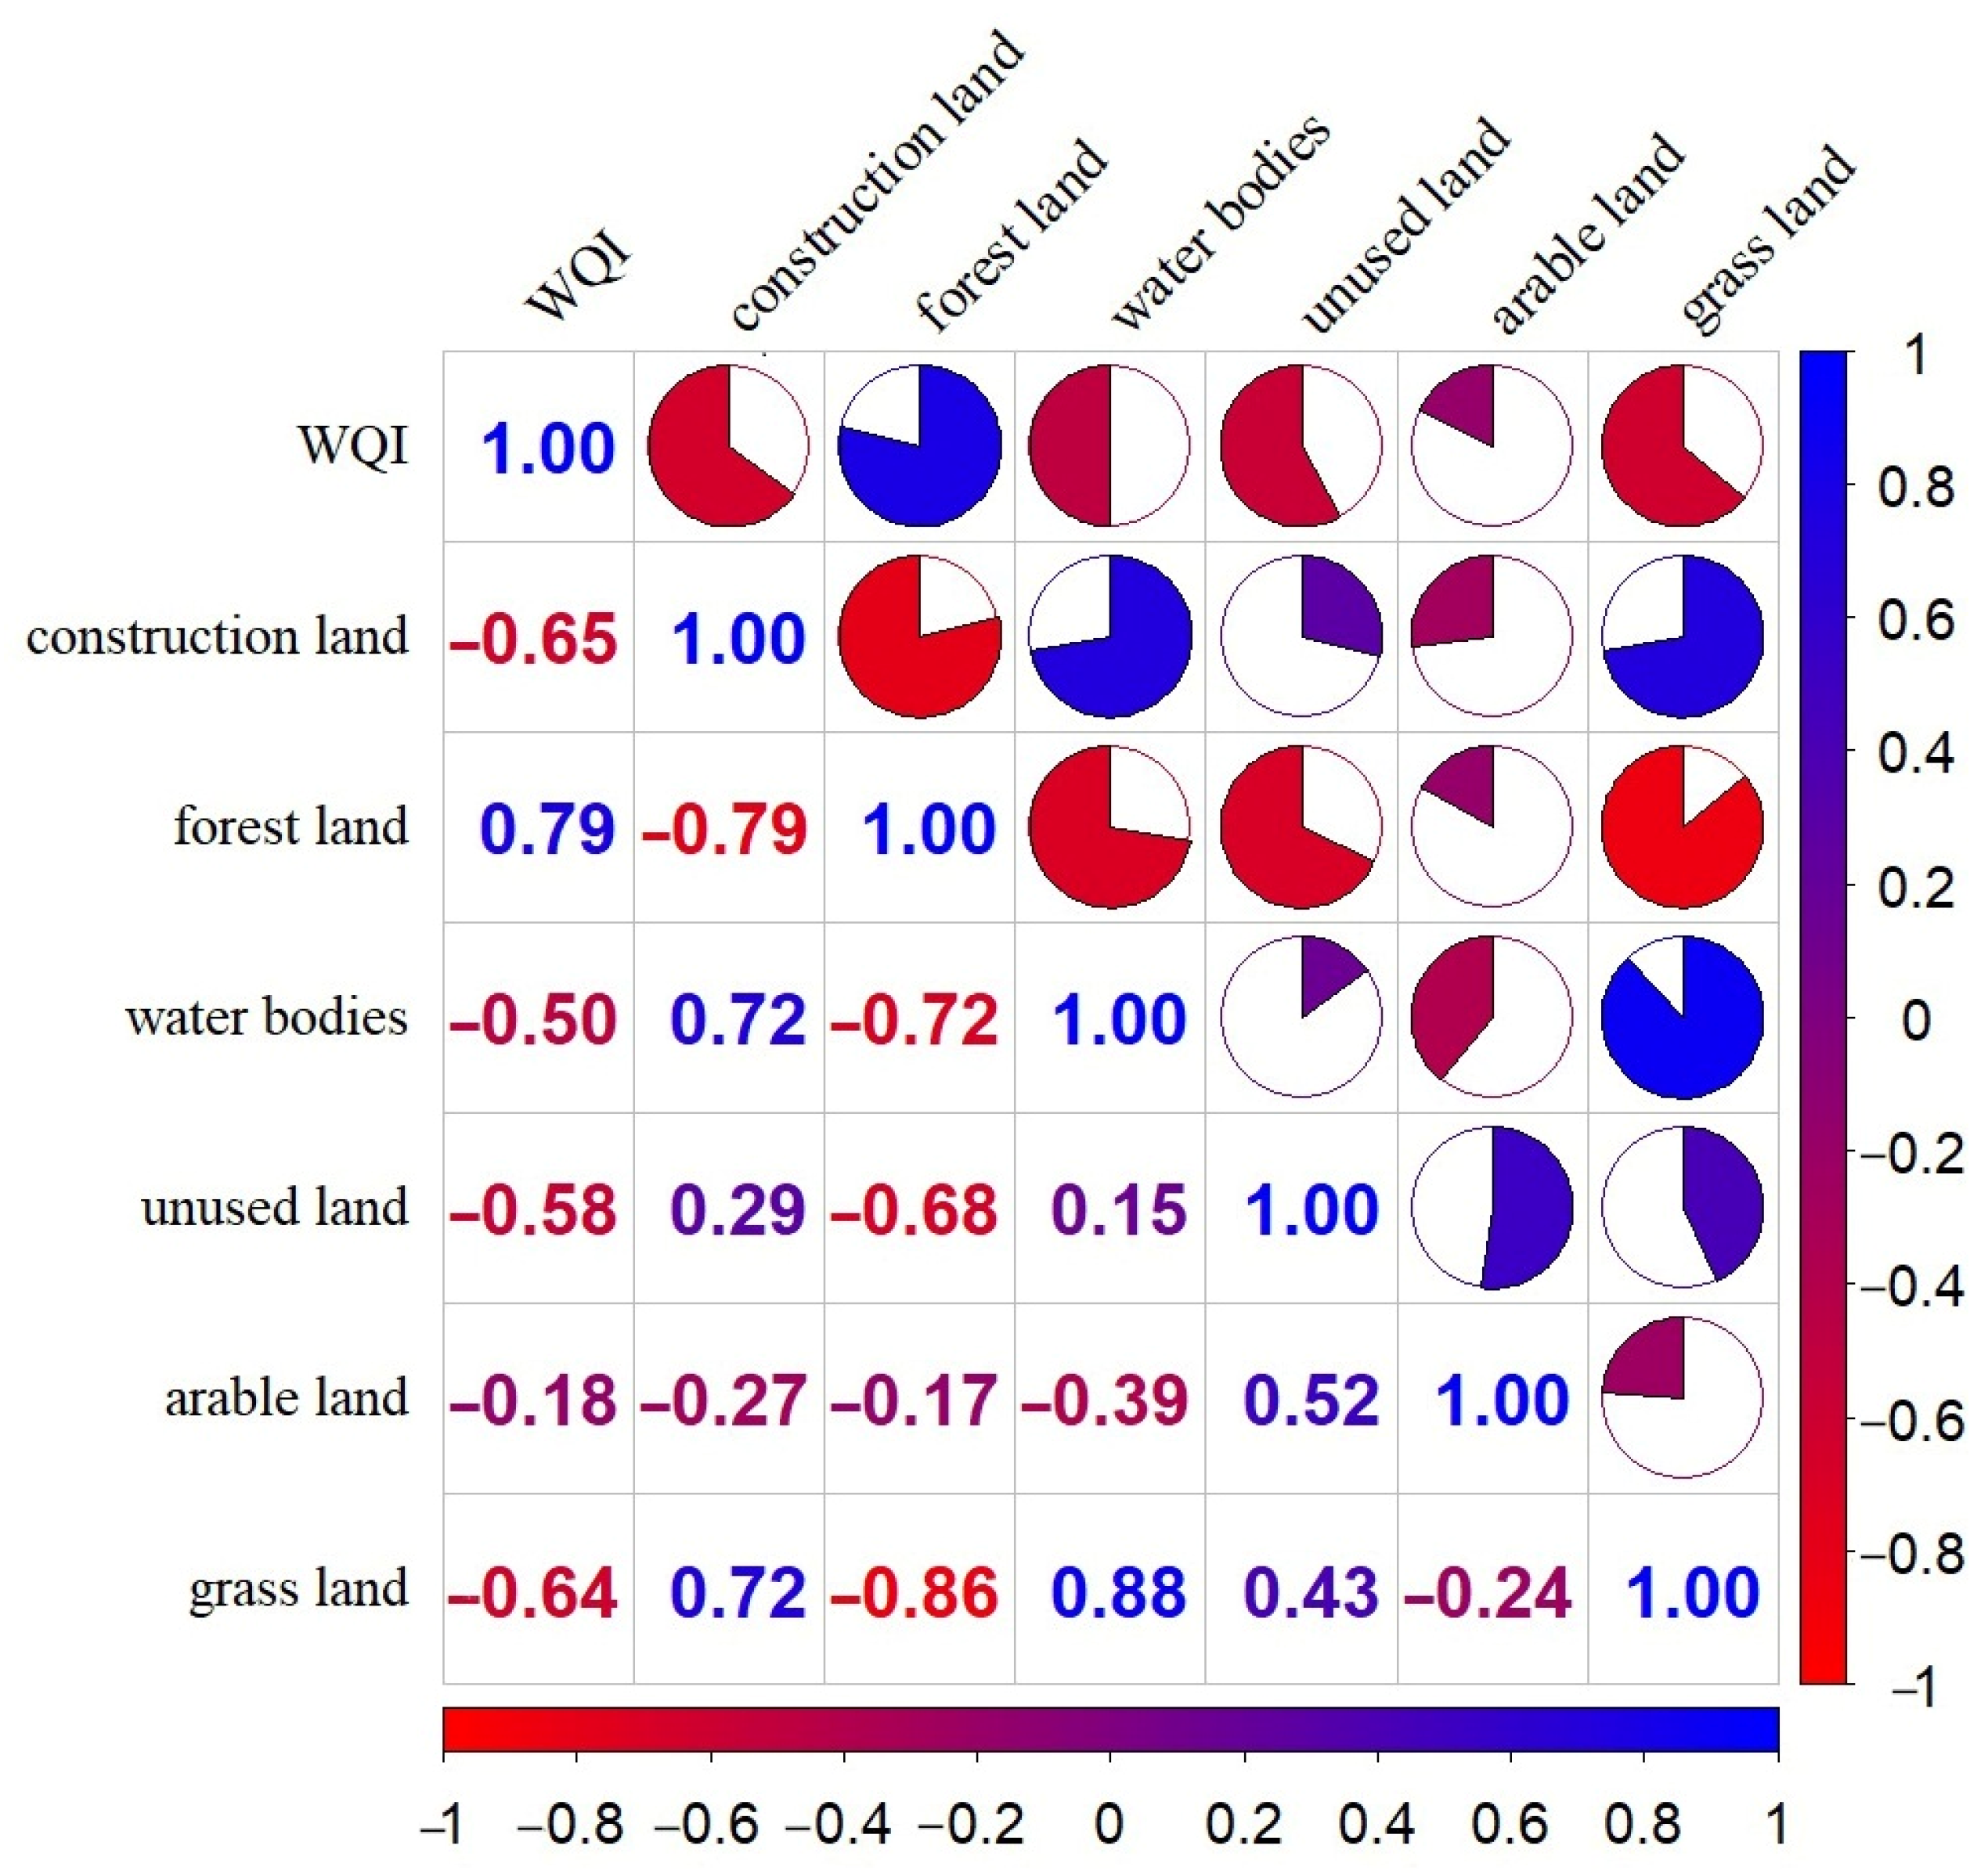
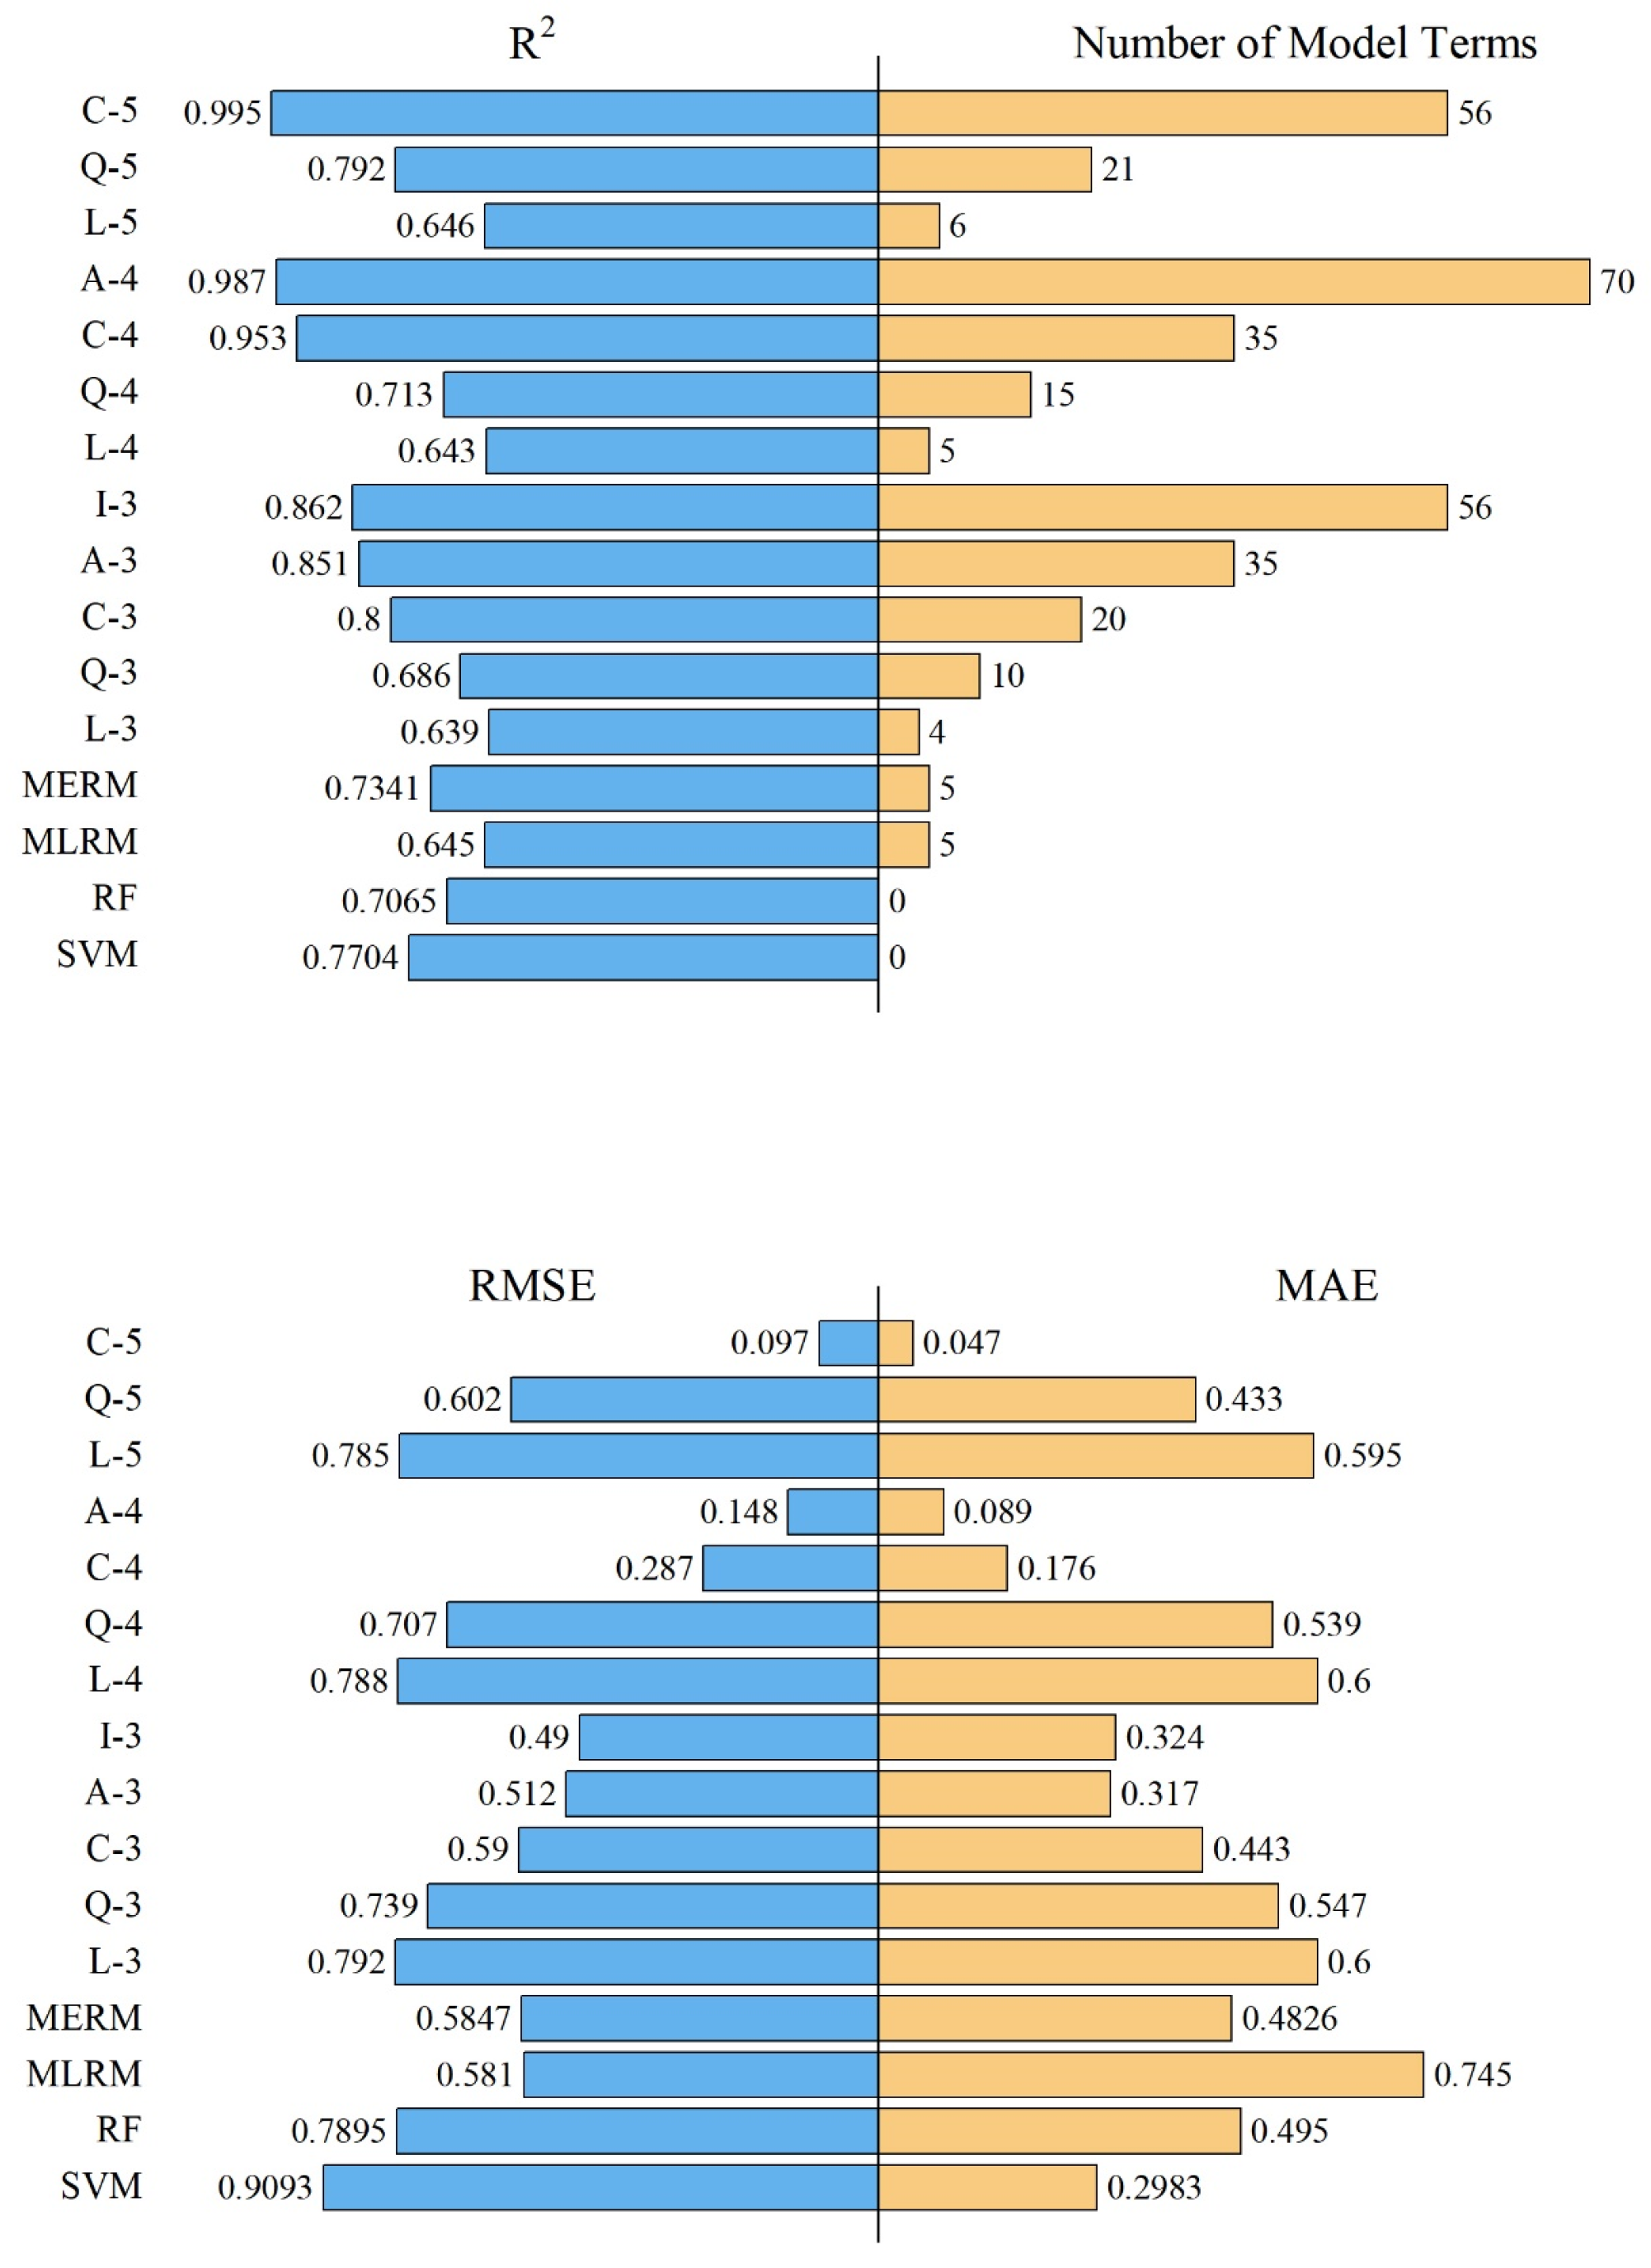
3.3.2. WQI and LUCC Coupling Results
4. Discussion and Conclusions
Author Contributions
Funding
Data Availability Statement
Acknowledgments
Conflicts of Interest
References
- John, V.; Jain, P.; Rahate, M.; Labhasetwar, P. Assessment of deterioration in water quality from source to household storage in semi-urban settings of developing countries. Environ. Monit. Assess. 2014, 186, 725–734. [Google Scholar] [CrossRef] [PubMed]
- Scanlon, B.R.; Jolly, I.; Sophocleous, M.; Zhang, L. Global impacts of conversions from natural to agricultural ecosystems on water resources: Quantity versus quality. Water Resour. Res. 2007, 43. [Google Scholar] [CrossRef]
- Todd, A.S.; Manning, A.H.; Verplanck, P.L.; Crouch, C.; McKnight, D.M.; Dunham, R. Climate-change-driven deterioration of water quality in a mineralized watershed. Environ. Sci. Technol. 2012, 46, 9324–9332. [Google Scholar] [CrossRef]
- Horton, R.K. An index number system for rating water quality. J. Water Pollut. Control Fed. 1965, 37, 300–306. [Google Scholar]
- Wu, Z.; Zhang, D.; Cai, Y.; Wang, X.; Zhang, L.; Chen, Y. Water quality assessment based on the water quality index method in Lake Poyang: The largest freshwater lake in China. Sci. Rep. 2017, 7, 17999. [Google Scholar] [CrossRef]
- Singh, K.P.; Malik, A.; Sinha, S. Water quality assessment and apportionment of pollution sources of Gomti river (India) using multivariate statistical techniques—A case study. Anal. Chim. Acta 2005, 538, 355–374. [Google Scholar] [CrossRef]
- Mir, R.A.; Gani, K.M. Water quality evaluation of the upper stretch of the river Jhelum using multivariate statistical techniques. Arab. J. Geosci. 2019, 12, 1–19. [Google Scholar] [CrossRef]
- Huang, J.; Gao, J.; Zhang, Y. Eutrophication prediction using a markov chain model: Application to lakes in the Yangtze River basin, China. Environ. Model. Assess. 2016, 21, 233–246. [Google Scholar] [CrossRef]
- Wu, N.; Schmalz, B.; Fohrer, N. Development and testing of a phytoplankton index of biotic integrity (P-IBI) for a German lowland river. Ecol. Indic. 2012, 13, 158–167. [Google Scholar] [CrossRef]
- Şener, Ş.; Şener, E.; Davraz, A. Evaluation of water quality using water quality index (WQI) method and GIS in Aksu River (SW-Turkey). Sci. Total Environ. 2017, 584, 131–144. [Google Scholar] [CrossRef]
- Mwaijengo, G.N.; Msigwa, A.; Njau, K.N.; Brendonck, L.; Vanschoenwinkel, B. Where does land use matter most? Contrasting land use effects on river quality at different spatial scales. Sci. Total Environ. 2020, 715, 134825. [Google Scholar] [CrossRef] [PubMed]
- Kuemmerlen, M.; Schmalz, B.; Guse, B.; Cai, Q.; Fohrer, N.; Jähnig, S.C. Integrating catchment properties in small scale species distribution models of stream macroinvertebrates. Ecol. Model. 2014, 277, 77–86. [Google Scholar] [CrossRef]
- Kulmatov, R. Problems of sustainable use and management of water and land resources in Uzbekistan. J. Water Resour. Prot. 2014, 2014, 42350. [Google Scholar] [CrossRef]
- Al-Mutairi, N.; Abahussain, A.; El-Battay, A. Spatial and temporal characterizations of water quality in Kuwait Bay. Mar. Pollut. Bull. 2014, 83, 127–131. [Google Scholar] [CrossRef] [PubMed]
- Wu, Z.; Wang, X.; Chen, Y.; Cai, Y.; Deng, J. Assessing river water quality using water quality index in Lake Taihu Basin, China. Sci. Total Environ. 2018, 612, 914–922. [Google Scholar] [CrossRef] [PubMed]
- Ritchie, J.C.; Zimba, P.V.; Everitt, J.H. Remote sensing techniques to assess water quality. Photogramm. Eng. Remote Sens. 2003, 69, 695–704. [Google Scholar] [CrossRef]
- Topp, S.N.; Pavelsky, T.M.; Jensen, D.; Simard, M.; Ross, M.R. Research trends in the use of remote sensing for inland water quality science: Moving towards multidisciplinary applications. Water 2020, 12, 169. [Google Scholar] [CrossRef]
- Najafzadeh, M.; Basirian, S. Evaluation of River Water Quality Index Using Remote Sensing and Artificial Intelligence Models. Remote Sens. 2023, 15, 2359. [Google Scholar] [CrossRef]
- Vignolo, A.; Pochettino, A.; Cicerone, D. Water quality assessment using remote sensing techniques: Medrano Creek, Argentina. J. Environ. Manag. 2006, 81, 429–433. [Google Scholar] [CrossRef]
- Najafzadeh, M.; Homaei, F.; Farhadi, H. Reliability assessment of water quality index based on guidelines of national sanitation foundation in natural streams: Integration of remote sensing and data-driven models. Artif. Intell. Rev. 2021, 54, 4619–4651. [Google Scholar] [CrossRef]
- Mo, W.; Zhao, Y.; Yang, N.; Xu, Z.; Zhao, W.; Li, F. Effects of climate and land use/land cover changes on water yield services in the Dongjiang Lake Basin. ISPRS Int. J. Geo-Inf. 2021, 10, 466. [Google Scholar] [CrossRef]
- Cao, F.; Qin, P.; Lu, S.; He, Q.; Wu, F.; Sun, H.; Wang, L.; Li, L. Measurement of volatile organic compounds and associated risk assessments through ingestion and dermal routes in Dongjiang Lake, China. Ecotoxicol. Environ. Saf. 2018, 165, 645–653. [Google Scholar] [CrossRef] [PubMed]
- Lyu, L.; Bi, S.; Yang, Y.; Zheng, D.; Li, Q. Effects of vegetation distribution and landscape pattern on water conservation in the Dongjiang River basin. Ecol. Indic. 2023, 155, 111017. [Google Scholar] [CrossRef]
- Jiang, J.; Wang, Z.; Lai, C.; Wu, X.; Chen, X. Climate and landuse change enhance spatio-temporal variability of Dongjiang river flow and ammonia nitrogen. Sci. Total Environ. 2023, 867, 161483. [Google Scholar] [CrossRef] [PubMed]
- Mo, W.; Yang, N.; Zhao, Y.; Xu, Z. Impacts of land use patterns on river water quality: The case of Dongjiang Lake Basin, China. Ecol. Inform. 2023, 75, 102083. [Google Scholar] [CrossRef]
- Dong, L.; Gong, C.; Huai, H.; Wu, E.; Lu, Z.; Hu, Y.; Li, L.; Yang, Z. Retrieval of Water Quality Parameters in Dianshan Lake Based on Sentinel-2 MSI Imagery and Machine Learning: Algorithm Evaluation and Spatiotemporal Change Research. Remote Sens. 2023, 15, 5001. [Google Scholar] [CrossRef]
- Kannel, P.R.; Lee, S.; Lee, Y.-S.; Kanel, S.R.; Khan, S.P. Application of water quality indices and dissolved oxygen as indicators for river water classification and urban impact assessment. Environ. Monit. Assess. 2007, 132, 93–110. [Google Scholar] [CrossRef] [PubMed]
- Zhang, S.; Zhang, H. Anthropogenic impact on long-term riverine CODMn, BOD, and nutrient flux variation in the Pearl River Delta. Sci. Total Environ. 2023, 859, 160197. [Google Scholar] [CrossRef] [PubMed]
- Liu, L.; Cao, T.-t.; Wang, X.-d.; Dandan, Z.; Cui, C.-W. Spatio-temporal variability and water quality assessment of the Mudan River Watershed, Northern China: Principal component analysis and water quality index. Desalination Water Treat 2021, 238, 38–48. [Google Scholar] [CrossRef]
- Rodríguez-López, L.; Alvarez, D.; Bustos Usta, D.; Duran-Llacer, I.; Bravo Alvarez, L.; Fagel, N.; Bourrel, L.; Frappart, F.; Urrutia, R. Chlorophyll-a Detection Algorithms at Different Depths Using In Situ, Meteorological, and Remote Sensing Data in a Chilean Lake. Remote Sens. 2024, 16, 647. [Google Scholar] [CrossRef]
- Johnes, P.; Moss, B.; Phillips, G. The determination of total nitrogen and total phosphorus concentrations in freshwaters from land use, stock headage and population data: Testing of a model for use in conservation and water quality management. Freshwat. Biol. 1996, 36, 451–473. [Google Scholar] [CrossRef]
- Said, S.; Khan, S.A. Remote sensing-based water quality index estimation using data-driven approaches: A case study of the Kali River in Uttar Pradesh, India. Environ. Dev. Sustain. 2021, 23, 18252–18277. [Google Scholar] [CrossRef]
- Zeng, J.; Liu, Z.; Liu, X.; Zhang, L.; Zhang, J.; Zeng, Y. The Spatiotemporal Variations and Potential Causes of Water Quality of Headwaters of Dongjiang River, Southeastern China. Sustainability 2023, 15, 6455. [Google Scholar] [CrossRef]
- Uddin, M.G.; Nash, S.; Olbert, A.I. A review of water quality index models and their use for assessing surface water quality. Ecol. Indic. 2021, 122, 107218. [Google Scholar] [CrossRef]
- Poonam, T.; Tanushree, B.; Sukalyan, C. Water quality indices-important tools for water quality assessment: A review. Int. J. Adv. Chem. 2013, 1, 15–28. [Google Scholar]
- Liu, W.; Liu, J.; Kuang, W.; Ning, J. Examining the influence of the implementation of Major Function-oriented Zones on built-up area expansion in China. J. Geogr. Sci. 2017, 27, 643–660. [Google Scholar] [CrossRef]
- Singh, S.K.; Mustak, S.; Srivastava, P.K.; Szabó, S.; Islam, T. Predicting spatial and decadal LULC changes through cellular automata Markov chain models using earth observation datasets and geo-information. Environ. Process. 2015, 2, 61–78. [Google Scholar] [CrossRef]
- Hasan, S.S.; Zhen, L.; Miah, M.G.; Ahamed, T.; Samie, A. Impact of land use change on ecosystem services: A review. Environ. Dev. 2020, 34, 100527. [Google Scholar] [CrossRef]
- Abd Ellah, R.G. Water resources in Egypt and their challenges, Lake Nasser case study. Egypt. J. Aquat. Res. 2020, 46, 1–12. [Google Scholar] [CrossRef]
- Zhang, X.; Chen, P.; Han, Y.; Chang, X.; Dai, S. Quantitative analysis of self-purification capacity of non-point source pollutants in watersheds based on SWAT model. Ecol. Indic. 2022, 143, 109425. [Google Scholar] [CrossRef]
- Breiman, L. Random forests. Mach. Learn. 2001, 45, 5–32. [Google Scholar] [CrossRef]
- Leong, W.C.; Bahadori, A.; Zhang, J.; Ahmad, Z. Prediction of water quality index (WQI) using support vector machine (SVM) and least square-support vector machine (LS-SVM). Int. J. River Basin Manag. 2021, 19, 149–156. [Google Scholar] [CrossRef]
- Belay, H.; Melesse, A.M.; Tegegne, G. Scenario-Based Land Use and Land Cover Change Detection and Prediction Using the Cellular Automata–Markov Model in the Gumara Watershed, Upper Blue Nile Basin, Ethiopia. Land 2024, 13, 396. [Google Scholar] [CrossRef]
- Lang, F.; Liang, Y.; Li, S.; Cheng, Z.; Li, G.; Guo, Z. Spatio-Temporal Patterns of Land Use and Cover Change in the Lancang–Mekong River Basin during 2000–2020. Land 2024, 13, 305. [Google Scholar] [CrossRef]
- Al-Taei, A.I.; Alesheikh, A.A.; Darvishi Boloorani, A. Land Use/Land Cover Change Analysis Using Multi-Temporal Remote Sensing Data: A Case Study of Tigris and Euphrates Rivers Basin. Land 2023, 12, 1101. [Google Scholar] [CrossRef]
- Wang, Y.; Yang, F.; He, F. Spatiotemporal Characteristics of Land Cover Change in the Yellow River Basin over the Past Millennium. Land 2024, 13, 260. [Google Scholar] [CrossRef]
- Bygate, M.; Ahmed, M. Monitoring Water Quality Indicators over Matagorda Bay, Texas, Using Landsat-8. Remote Sens. 2024, 16, 1120. [Google Scholar] [CrossRef]
- Jang, W.; Kim, J.; Kim, J.H.; Shin, J.-K.; Chon, K.; Kang, E.T.; Park, Y.; Kim, S. Evaluation of Sentinel-2 Based Chlorophyll-a Estimation in a Small-Scale Reservoir: Assessing Accuracy and Availability. Remote Sens. 2024, 16, 315. [Google Scholar] [CrossRef]
- Jakovljevic, G.; Álvarez-Taboada, F.; Govedarica, M. Long-Term Monitoring of Inland Water Quality Parameters Using Landsat Time-Series and Back-Propagated ANN: Assessment and Usability in a Real-Case Scenario. Remote Sens. 2024, 16, 68. [Google Scholar] [CrossRef]

| County/City | Area in Each Administrative District (km2) | Area Proportion of the Whole Watershed (%) |
|---|---|---|
| Zixing County-Level City | 1748.7 | 37.18 |
| Rucheng County | 1601.3 | 34.04 |
| Guidong County | 1234.7 | 26.25 |
| Yizhang County | 118.9 | 2.53 |
| Total | 4703.60 | 100 |
| Number | Water Body | Name of Water Quality Monitoring Section | Monitoring Frequency | Monitoring Affiliation |
|---|---|---|---|---|
| 1 | Dongjiang Lake | Xiaodongjiang Station | Once a month | Chenzhou City Station |
| 2 | Dongjiang Lake | Toushan Station | Once a month | Chenzhou City Station |
| 3 | Dongjiang Lake | Bailang Station | Once a month | Chenzhou City Station |
| 4 | Dongjiang Lake | Dongping | Once a quarter | Zixing City Station |
| 5 | Dongjiang Lake | Yanzipai Station | Once a quarter | Zixing City Station |
| 6 | Dongjiang Lake | Chukou Station | Once a quarter | Zixing City Station |
| 7 | Ou River | Chengguan Songshan Station | Once a month | Guidong County Station |
| 8 | Ou River | Chengguan Gaoqiao Station | Once a quarter | Guidong County Station |
| 9 | Ou River | Shibishan Hydropower Station | Once a quarter | Guidong County Station |
| 10 | Zheshui | Sigongqiao Station | Once a quarter | Rucheng County Station |
| 11 | Zheshui | Mantianxing Power Station | Once a quarter | Rucheng County Station |
| 12 | Zheshui | Longhudong Reservoir Station | Once a month | Rucheng County Station |
| 13 | Zheshui | Sandaianqiao Station | Once a quarter | Rucheng County Station |
| Band Combination | Band Combination Form | DO | CODMn | COD | NH3-N | TP |
|---|---|---|---|---|---|---|
| S1 | b2 + b3 | −0.19 * | 0.21 ** | 0.33 ** | −0.16 * | 0.22 * |
| S2 | b2 + b3 + b4 | −0.18 * | 0.22 ** | 0.33 ** | −0.16 * | 0.22 * |
| S3 | b4/b2 | 0.04 | 0.18 * | 0.25 * | −0.11 * | 0.21 * |
| S4 | b4/b3 | −0.04 | 0.20 * | 0.29 * | −0.11 * | 0.23 * |
| S5 | (b5 − b4) × (b5/b3) | 0.87 ** | −0.07 | −0.13 | −0.18 * | 0.14 |
| S6 | (b3 + b4)/b2 | 0.08 | 0.12 * | 0.18 | −0.10 | 0.19 |
| S7 | b3/b2 | 0.08 | 0.24 ** | 0.29 * | −0.09 | 0.21 * |
| S8 | b5/b3 | 0.60 ** | 0.25 ** | 0.32 ** | −0.09 | 0.21 * |
| S9 | (b3 + b5)/b2 | 0.12 * | 0.19 * | 0.24 * | −0.09 | 0.21 * |
| S10 | (b2 + b5)/b3 | −0.02 | 0.29 ** | 0.16 | 0.01 | 0.08 |
| S11 | b4 + b5 | 0.01 | 0.01 | −0.04 | 0.06 | 0.01 |
| S12 | (b4 + b5)/(b2 − b3) | 0.14 * | −0.04 | −0.02 | 0.10 | 0.17 |
| S13 | b4/b5 | −0.03 | −0.24 | −0.25 * | 0.06 | −0.18 |
| S14 | b2 + b3 + b5 | −0.17 * | 0.23 ** | 0.34 ** | −0.16 * | 0.23 * |
| S15 | b2 + b3 + b4 + b5 | −0.11 | 0.20 * | 0.40 ** | −0.16 * | 0.30 ** |
| S16 | b6 − b7 | 0.15 * | 0 | 0.04 | 0.03 | 0.05 |
| S17 | b2 + b3 + b6 + b7 | −0.17 * | 0.22 ** | 0.35 ** | −0.16 * | 0.23 * |
| S18 | (b2 − b3)/(b2 + b3) | 0.16 * | 0.14 * | 0.17 | −0.12 | 0.81 ** |
| S19 | b4/b6 | −0.13 | −0.04 | 0.04 | −0.03 | −0.30 ** |
| S20 | b4/b7 | −0.07 | −0.09 | 0.35 ** | −0.03 | −0.30 ** |
| S21 | b5/b6 | −0.15 * | 0.08 | −0.25 * | −0.06 | −0.32 ** |
| S22 | b5/b7 | −0.06 | −0.01 | −0.31 ** | −0.05 | −0.32 ** |
| S23 | b4 − b6 | −0.04 | −0.03 | −0.18 | −0.01 | −0.11 |
| S24 | b5 − b6 | 0.08 | 0.14 * | −0.04 | −0.01 | −0.04 |
| S25 | b4 − b7 | 0.02 | −0.03 | −0.18 | 0 | −0.10 |
| S26 | b5 − b7 | 0.12 | 0.11 | 0 | −0.02 | −0.01 |
| S27 | b4/(b6 + b7) | −0.09 | −0.09 | −0.30 ** | −0.02 | −0.32 ** |
| S28 | b5/(b6 + b7) | 0.10 | 0.01 | −0.30 ** | −0.05 | −0.34 ** |
| S29 | (b4 − b5)/(b6 + b7) | −0.07 | −0.16 * | −0.22 * | 0.01 | −0.20 |
| S30 | (b4 + b5)/(b2 + b3 + b6 + b7) | 0.04 | 0.18 * | 0.18 | −0.07 | 0.16 |
| S31 | b4 + b6 + b7 | −0.14 * | 0.23 ** | 0.35 ** | −0.16 * | 0.24 * |
| S32 | b5 + b6 + b7 | −0.13 | 0.23 ** | 0.36 ** | −0.16 * | 0.24 * |
| S33 | b5 | −0.15 * | 0.53 ** | 0.86 ** | −0.31 ** | 0.31 ** |
| S34 | b5/b2 | −0.03 | 0.76 ** | 0.56 ** | −0.15 * | 0.14 |
| S35 | ((b4 + b5) + (b2/b5) × (b2 + b5) + (b2/b5)) | −0.19 * | −0.25 ** | 0.04 | 0.61 ** | −0.17 |
| Parameters | Values | Lower Limit | Upper Limit | |
|---|---|---|---|---|
| DO | a | 1.1508 | −0.8536 | 1.4480 |
| b | −1.3064 | −3.0258 | 0.4130 | |
| CODMn | a | 1.0785 | −0.4578 | 2.3787 |
| b | −0.0604 | −0.1176 | −0.0032 | |
| COD | a | 0.9458 | −2.5422 | 4.4338 |
| b | 0.5427 | 1.6231 | 2.7034 | |
| NH3-N | a | 1.0143 | 0.0289 | 1.9997 |
| b | −0.0105 | −0.0310 | 0.0100 | |
| TP | a | 1.7047 | −0.0049 | 3.4143 |
| b | 0.0041 | 0.0014 | 0.0068 |
| DO | CODMn | COD | NH3-N | TP | |
|---|---|---|---|---|---|
| R2 | 0.7508 | 0.7640 | 0.8063 | 0.7650 | 0.6650 |
| MAE | 0.3390 | 0.3570 | 1.0880 | 0.0320 | 0.0020 |
| RMSE | 0.4130 | 0.5090 | 1.2710 | 0.0390 | 0.0017 |
| Land Use Factor | Model | R2 | RMSE | MAE |
|---|---|---|---|---|
| Forest Land | M1 | 0.629 | 0.614 | 0.803 |
| Forest Land + Construction Land | M2 | 0.631 | 0.618 | 0.802 |
| Forest Land + Grassland | M3 | 0.637 | 0.599 | 0.795 |
| Forest Land + Unused Land | M4 | 0.633 | 0.605 | 0.799 |
| Forest Land + Arable Land | M5 | 0.640 | 0.595 | 0.792 |
| Forest Land + Water Bodies | M6 | 0.631 | 0.604 | 0.801 |
| Forest Land + Construction Land + Grassland | M7 | 0.639 | 0.600 | 0.792 |
| Forest Land + Construction Land + Unused Land | M8 | 0.640 | 0.610 | 0.791 |
| Forest Land + Construction Land + Arable Land | M9 | 0.645 | 0.581 | 0.745 |
| Forest Land + Arable Land + Grassland | M10 | 0.640 | 0.591 | 0.791 |
| Forest Land + Arable Land + Unused Land | M11 | 0.640 | 0.596 | 0.792 |
| Forest Land + Grassland + Unused Land | M12 | 0.638 | 0.596 | 0.794 |
| Forest Land + Unused Land + Construction Land | M13 | 0.640 | 0.610 | 0.791 |
| Forest Land + Construction Land + Grassland + Arable Land + Unused Land | M14 | 0.646 | 0.595 | 0.785 |
| Random Effect Parameter | Model | Parameters | R2 | RMSE | MAE |
|---|---|---|---|---|---|
| Construction Land | M1 | a | 0.6237 | 0.8031 | 0.6142 |
| M2 | b | 0.6312 | 0.7888 | 0.6171 | |
| Grassland | M3 | a | 0.5896 | 0.7524 | 0.5716 |
| M4 | b | 0.6202 | 0.8007 | 0.6058 | |
| Arable Land | M5 | a | 0.6392 | 0.8112 | 0.6143 |
| M6 | b | 0.6445 | 0.7865 | 0.6039 | |
| Unused Land | M7 | a | 0.6237 | 0.8417 | 0.6260 |
| M8 | b | 0.6381 | 0.8031 | 0.6142 | |
| Construction Land + Grassland | M9 | a + a | 0.6392 | 0.8067 | 0.8381 |
| M10 | a + b | 0.5896 | 0.7524 | 0.5716 | |
| Construction Land + Arable Land | M11 | a + a | 0.6418 | 0.7321 | 0.6977 |
| M12 | a + b | 0.7341 | 0.5847 | 0.4826 | |
| Construction Land + Unused Land | M13 | a + a | 0.6254 | 0.8124 | 0.7205 |
| M14 | a + b | 0.6082 | 0.8096 | 0.6823 | |
| Construction Land + Arable Land + Grassland | M15 | a + a | 0.5896 | 0.7524 | 0.5716 |
| M16 | a + b | 0.6392 | 0.8420 | 0.6264 | |
| Construction Land + Arable Land + Unused Land | M17 | a + a | 0.6237 | 0.8031 | 0.6142 |
| M18 | a + b | 0.6381 | 0.8007 | 0.6058 |
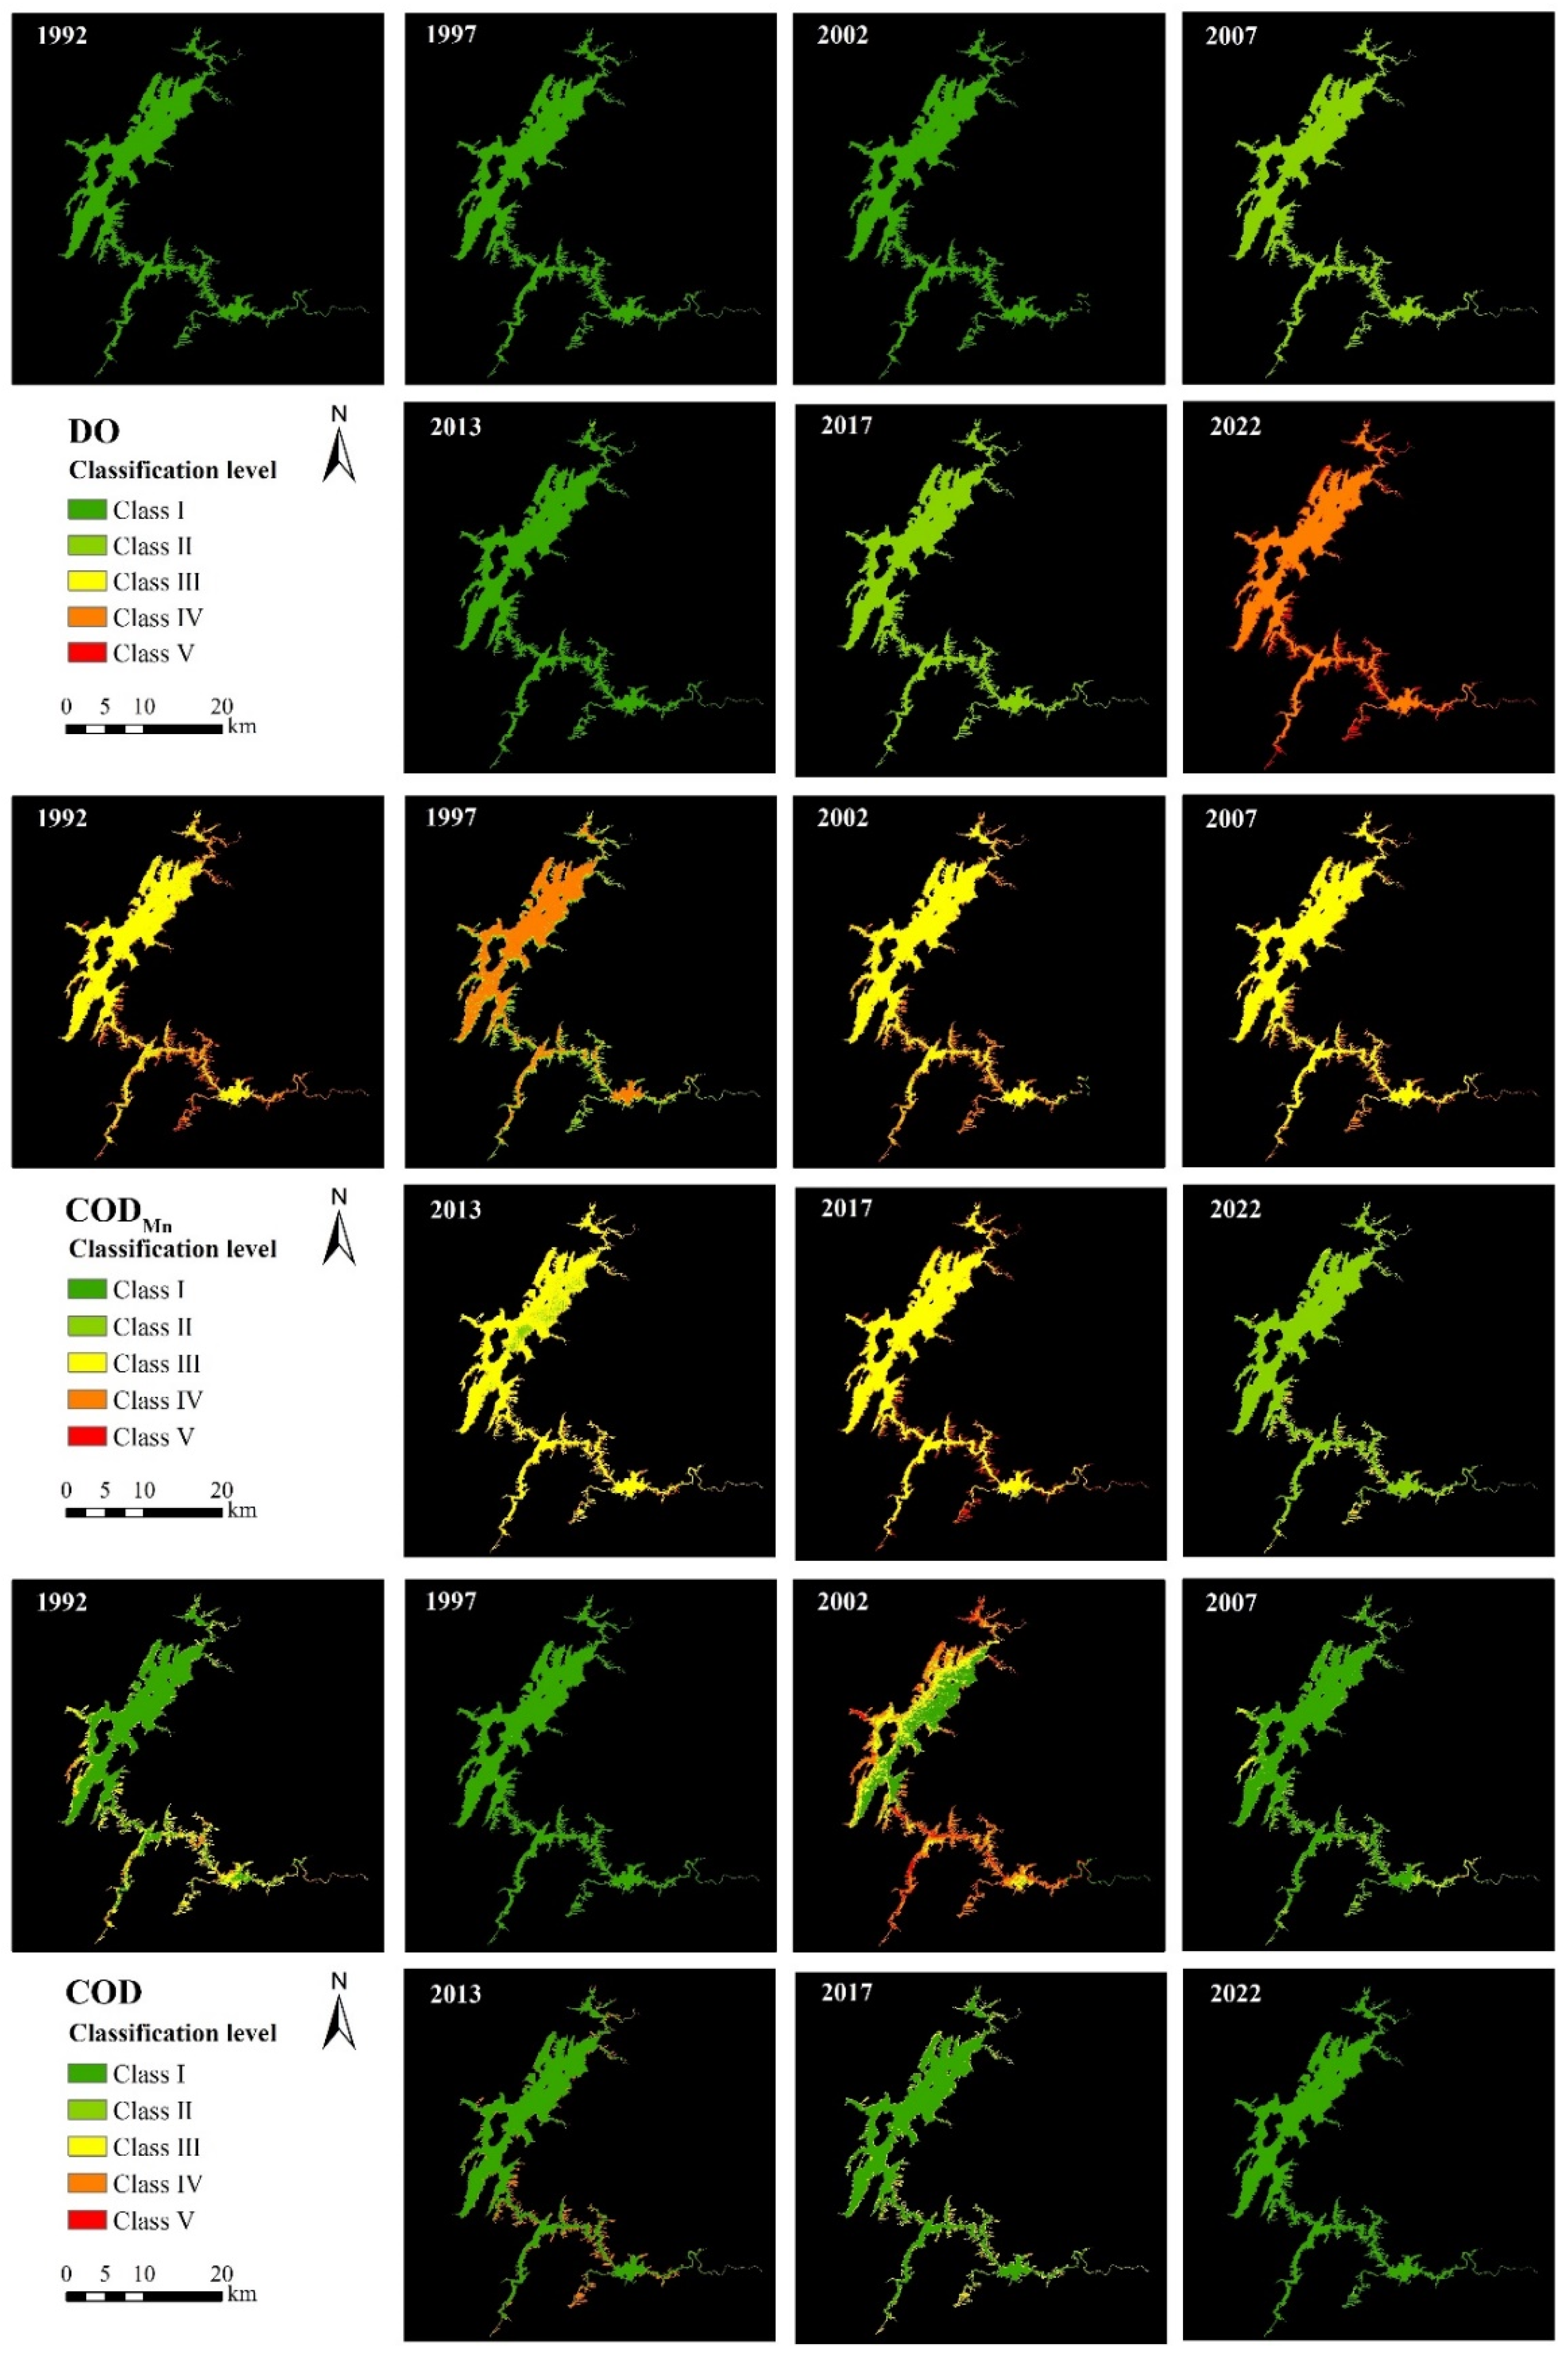
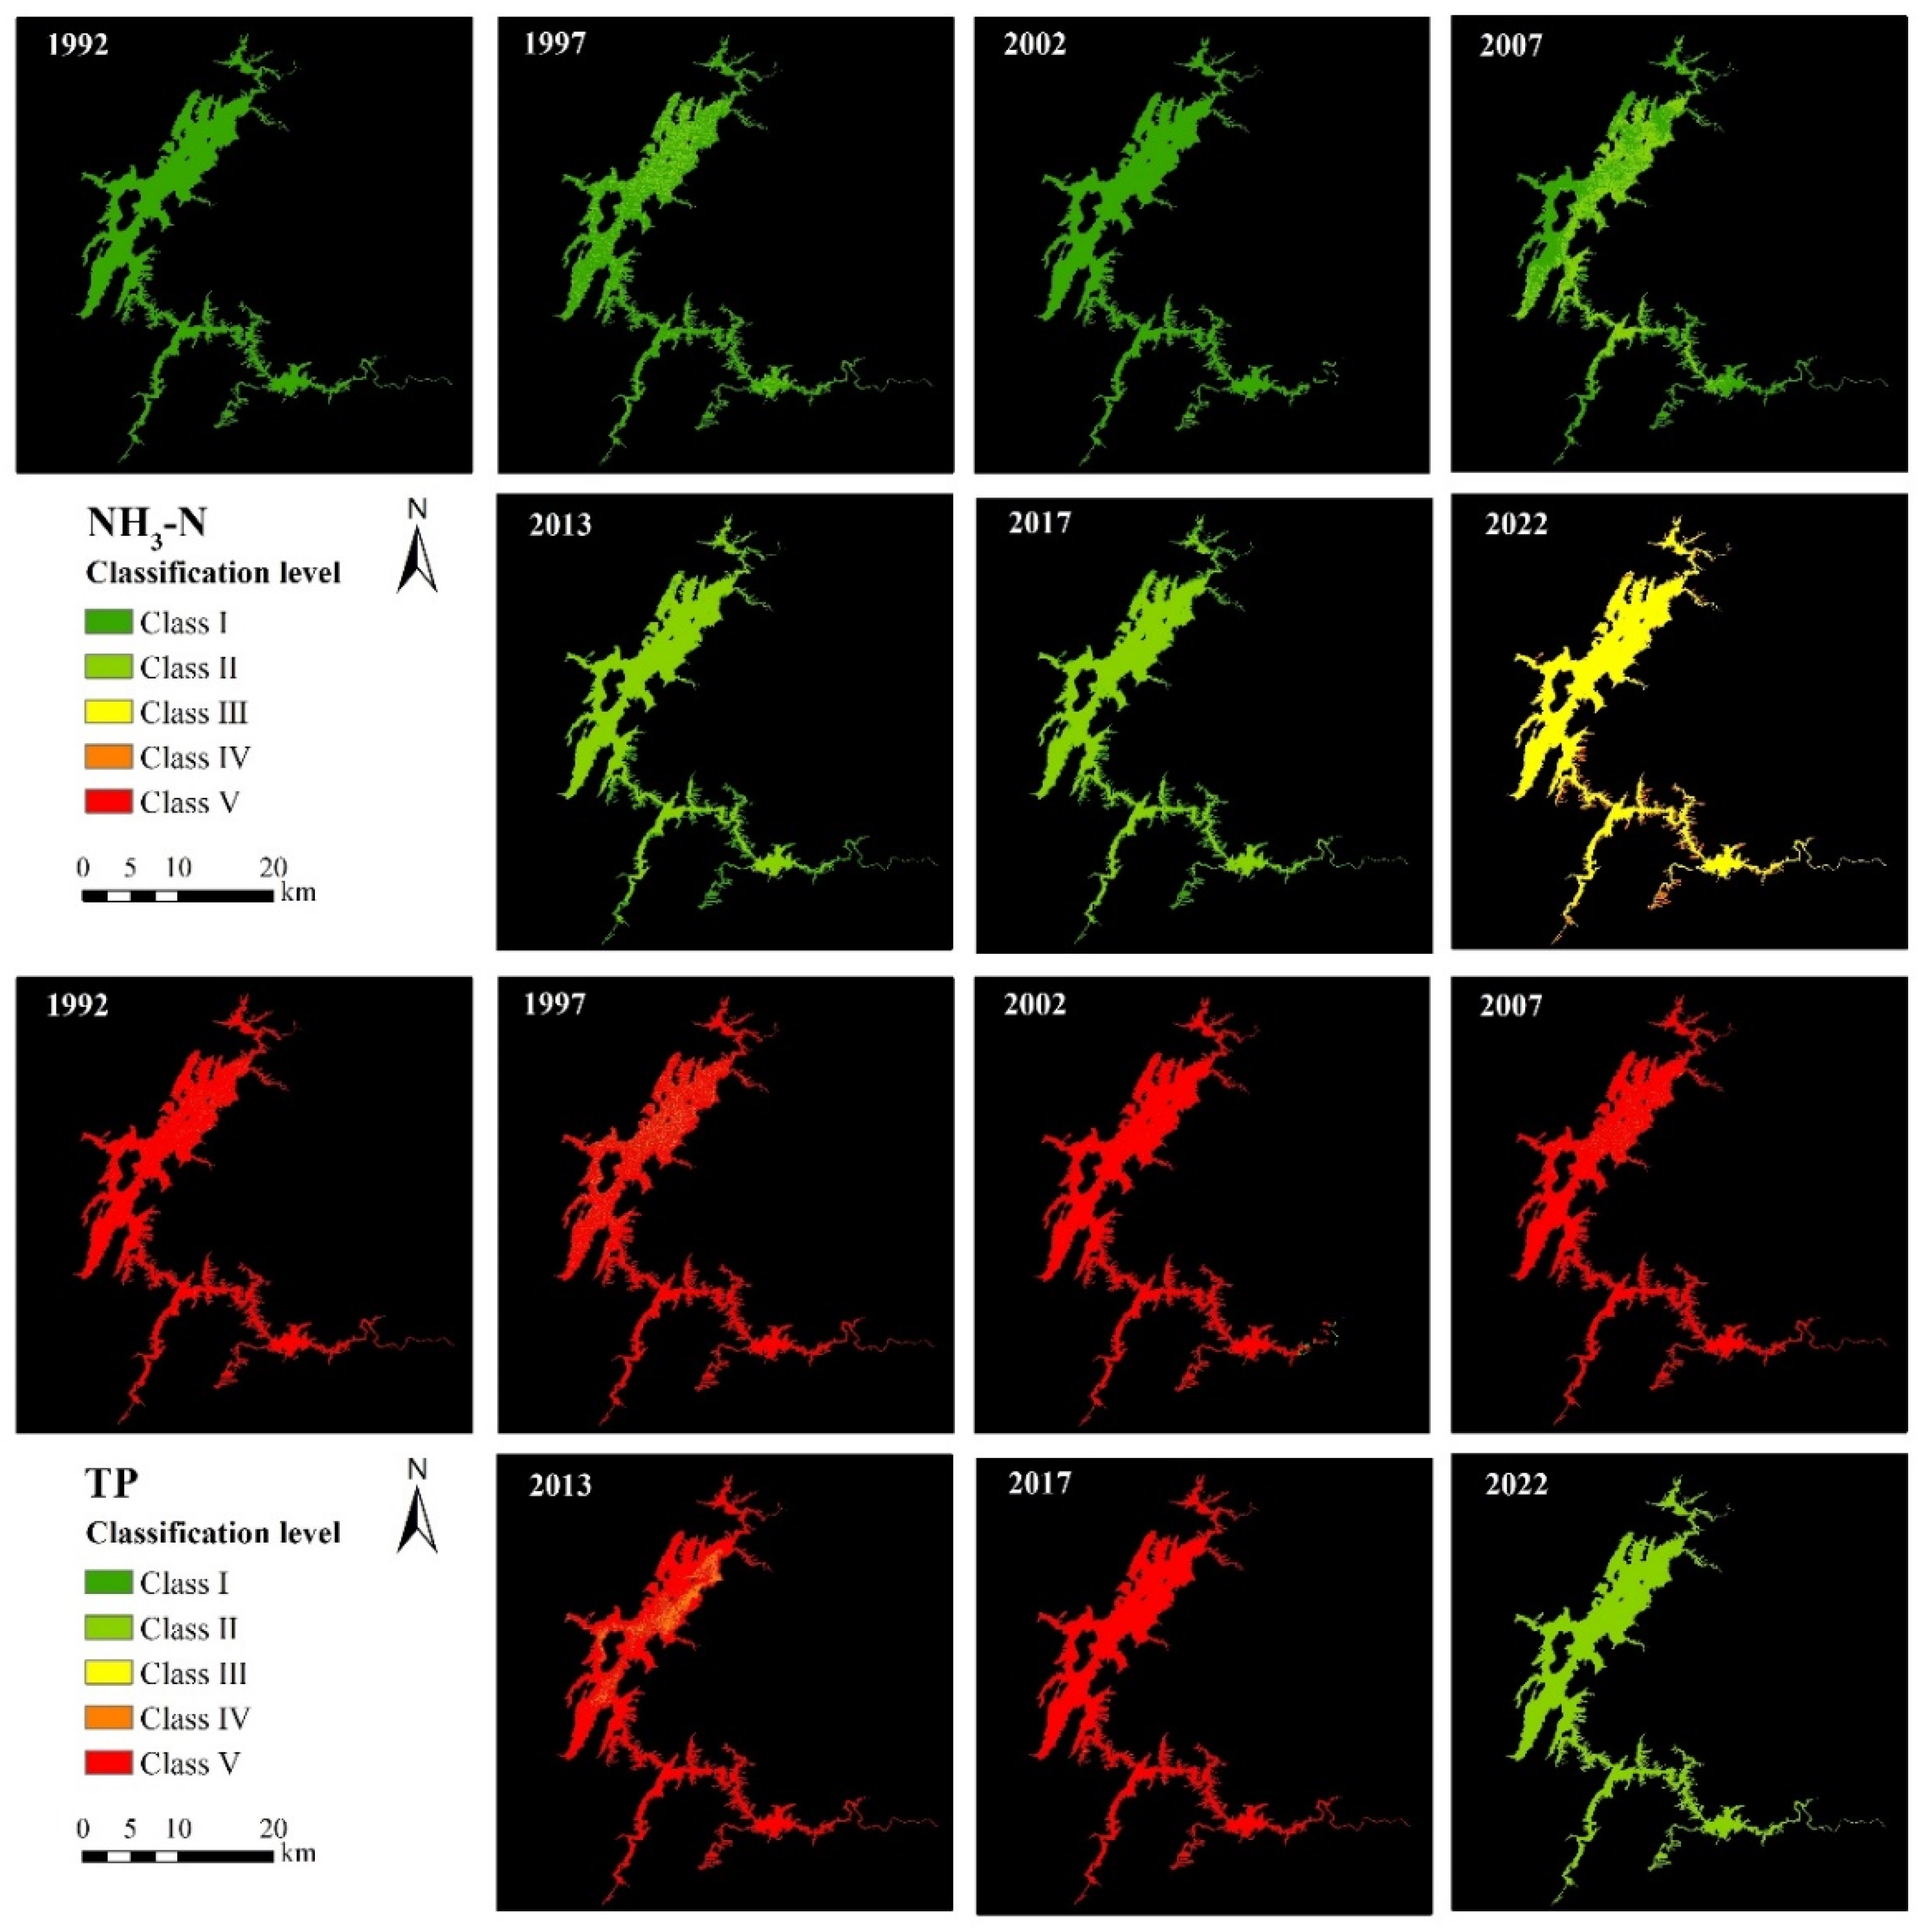
| Year | Parameter | Class I | Class II | Class III | Class IV | Class V |
|---|---|---|---|---|---|---|
| 1992 | DO | 100.00% | 0.00% | 0.00% | 0.00% | 0.00% |
| CODMn | 0.00% | 0.00% | 70.94% | 23.16% | 5.90% | |
| COD | 67.07% | 0.00% | 27.21% | 4.45% | 1.28% | |
| NH3-N | 99.98% | 0.02% | 0.00% | 0.00% | 0.00% | |
| TP | 0.00% | 0.00% | 0.08% | 1.61% | 98.30% | |
| 1997 | DO | 100.00% | 0.00% | 0.00% | 0.00% | 0.00% |
| CODMn | 0.00% | 27.59% | 8.08% | 64.19% | 0.14% | |
| COD | 98.81% | 0.00% | 0.39% | 0.47% | 0.33% | |
| NH3-N | 82.57% | 17.39% | 0.03% | 0.01% | 0.00% | |
| TP | 0.00% | 0.01% | 0.62% | 9.63% | 89.74% | |
| 2002 | DO | 99.95% | 0.01% | 0.00% | 0.01% | 0.03% |
| CODMn | 0.11% | 0.29% | 74.72% | 21.95% | 2.93% | |
| COD | 28.19% | 0.00% | 25.42% | 38.75% | 7.63% | |
| NH3-N | 99.85% | 0.15% | 0.00% | 0.00% | 0.00% | |
| TP | 0.33% | 0.01% | 0.05% | 0.21% | 99.40% | |
| 2007 | DO | 100.00% | 0.00% | 0.00% | 0.00% | 0.00% |
| CODMn | 0.00% | 1.27% | 79.80% | 15.12% | 3.80% | |
| COD | 74.05% | 0.00% | 22.23% | 2.72% | 0.99% | |
| NH3-N | 65.83% | 34.13% | 0.03% | 0.00% | 0.00% | |
| TP | 0.00% | 0.00% | 0.02% | 1.97% | 98.01% | |
| 2013 | DO | 99.86% | 0.14% | 0.00% | 0.00% | 0.00% |
| CODMn | 0.00% | 5.04% | 86.72% | 4.09% | 4.16% | |
| COD | 84.22% | 0.00% | 0.66% | 14.60% | 0.52% | |
| NH3-N | 24.04% | 75.94% | 0.01% | 0.00% | 0.00% | |
| TP | 0.00% | 0.00% | 0.00% | 9.96% | 90.04% | |
| 2017 | DO | 99.99% | 0.01% | 0.00% | 0.00% | 0.00% |
| CODMn | 0.00% | 0.45% | 80.07% | 8.98% | 10.50% | |
| COD | 79.35% | 0.00% | 17.86% | 1.70% | 1.09% | |
| NH3-N | 26.92% | 73.07% | 0.00% | 0.00% | 0.00% | |
| TP | 0.00% | 0.00% | 0.00% | 0.17% | 99.82% | |
| 2022 | DO | 0.00% | 0.00% | 0.00% | 78.99% | 21.01% |
| CODMn | 0.00% | 88.04% | 10.51% | 1.45% | 0.00% | |
| COD | 99.66% | 0.00% | 0.34% | 0.00% | 0.00% | |
| NH3-N | 0.00% | 0.45% | 86.80% | 12.20% | 0.54% | |
| TP | 0.00% | 100.00% | 0.00% | 0.00% | 0.00% |
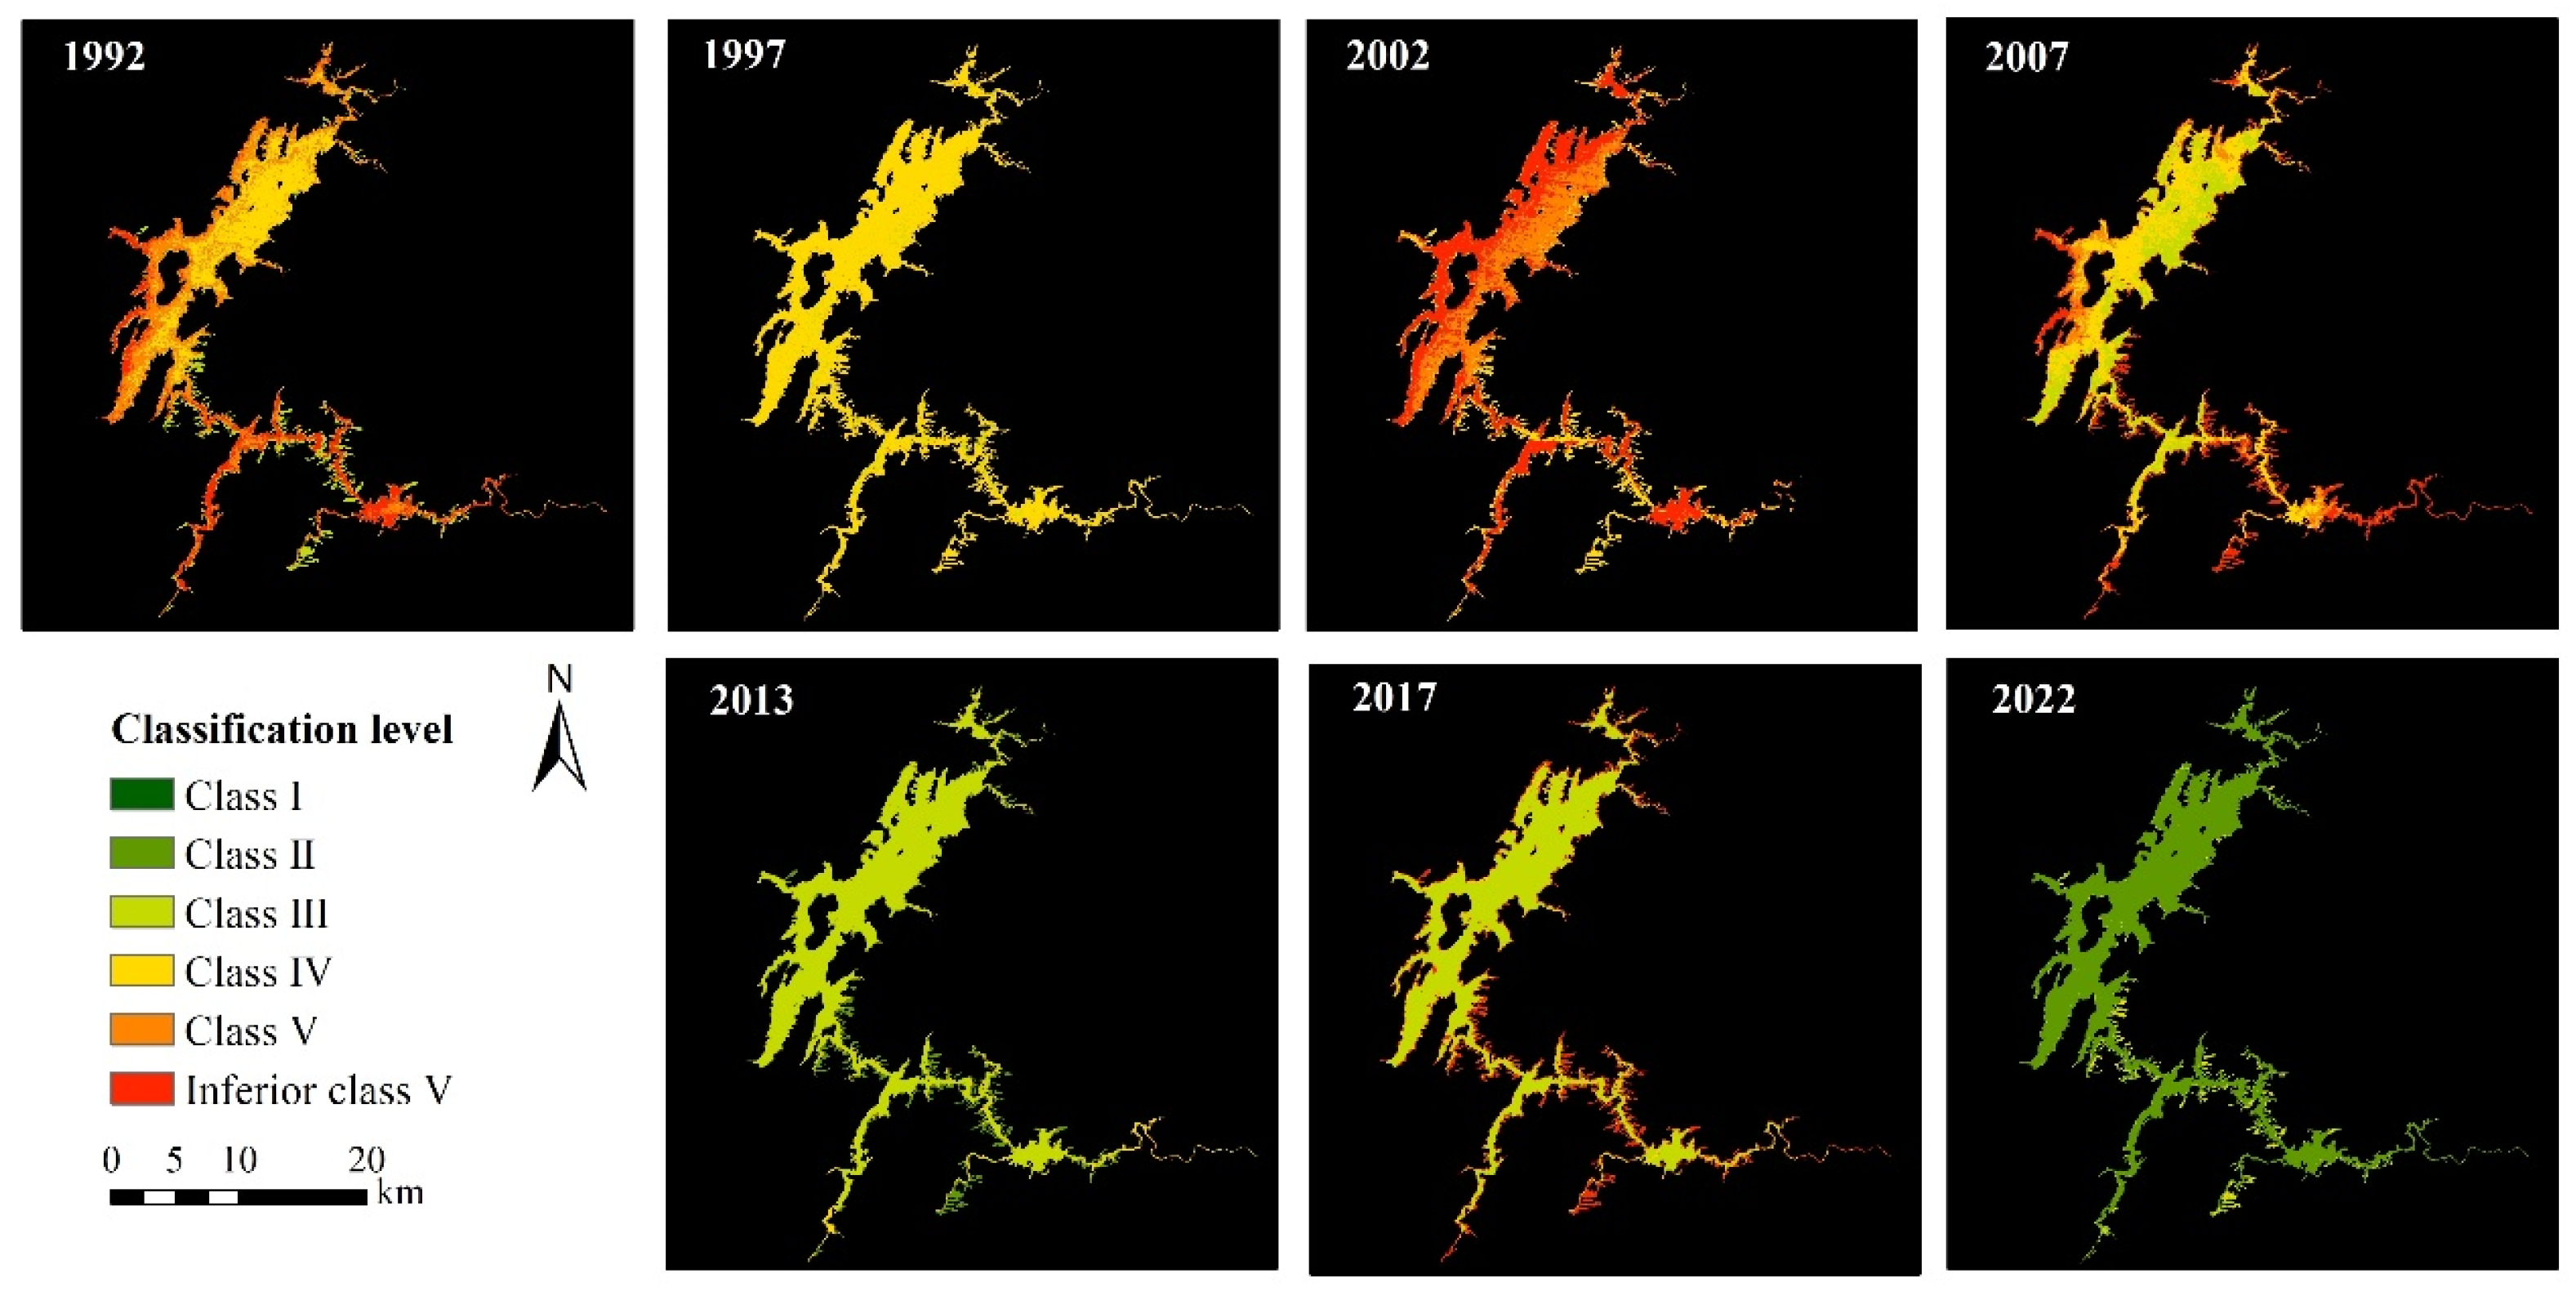
| Year | WQI Means | WQI Class | |||||
|---|---|---|---|---|---|---|---|
| Class I | Class II | Class III | Class IV | Class V | Sub-Class V | ||
| 1992 | 4.5945 | 0.00% | 0.00% | 16.15% | 29.78% | 32.54% | 21.53% |
| 1997 | 3.9695 | 0.00% | 0.01% | 5.68% | 92.68% | 0.62% | 1.01% |
| 2002 | 5.2784 | 0.00% | 0.00% | 0.02% | 22.75% | 26.58% | 50.65% |
| 2007 | 4.3345 | 0.00% | 0.00% | 27.40% | 37.15% | 10.03% | 25.41% |
| 2013 | 2.9708 | 0.00% | 14.23% | 78.74% | 4.36% | 1.03% | 1.63% |
| 2017 | 3.6886 | 0.00% | 0.00% | 74.10% | 3.85% | 1.16% | 20.90% |
| 2022 | 3.1000 | 0.96% | 89.35% | 8.42% | 1.25% | 0.01% | 0.00% |
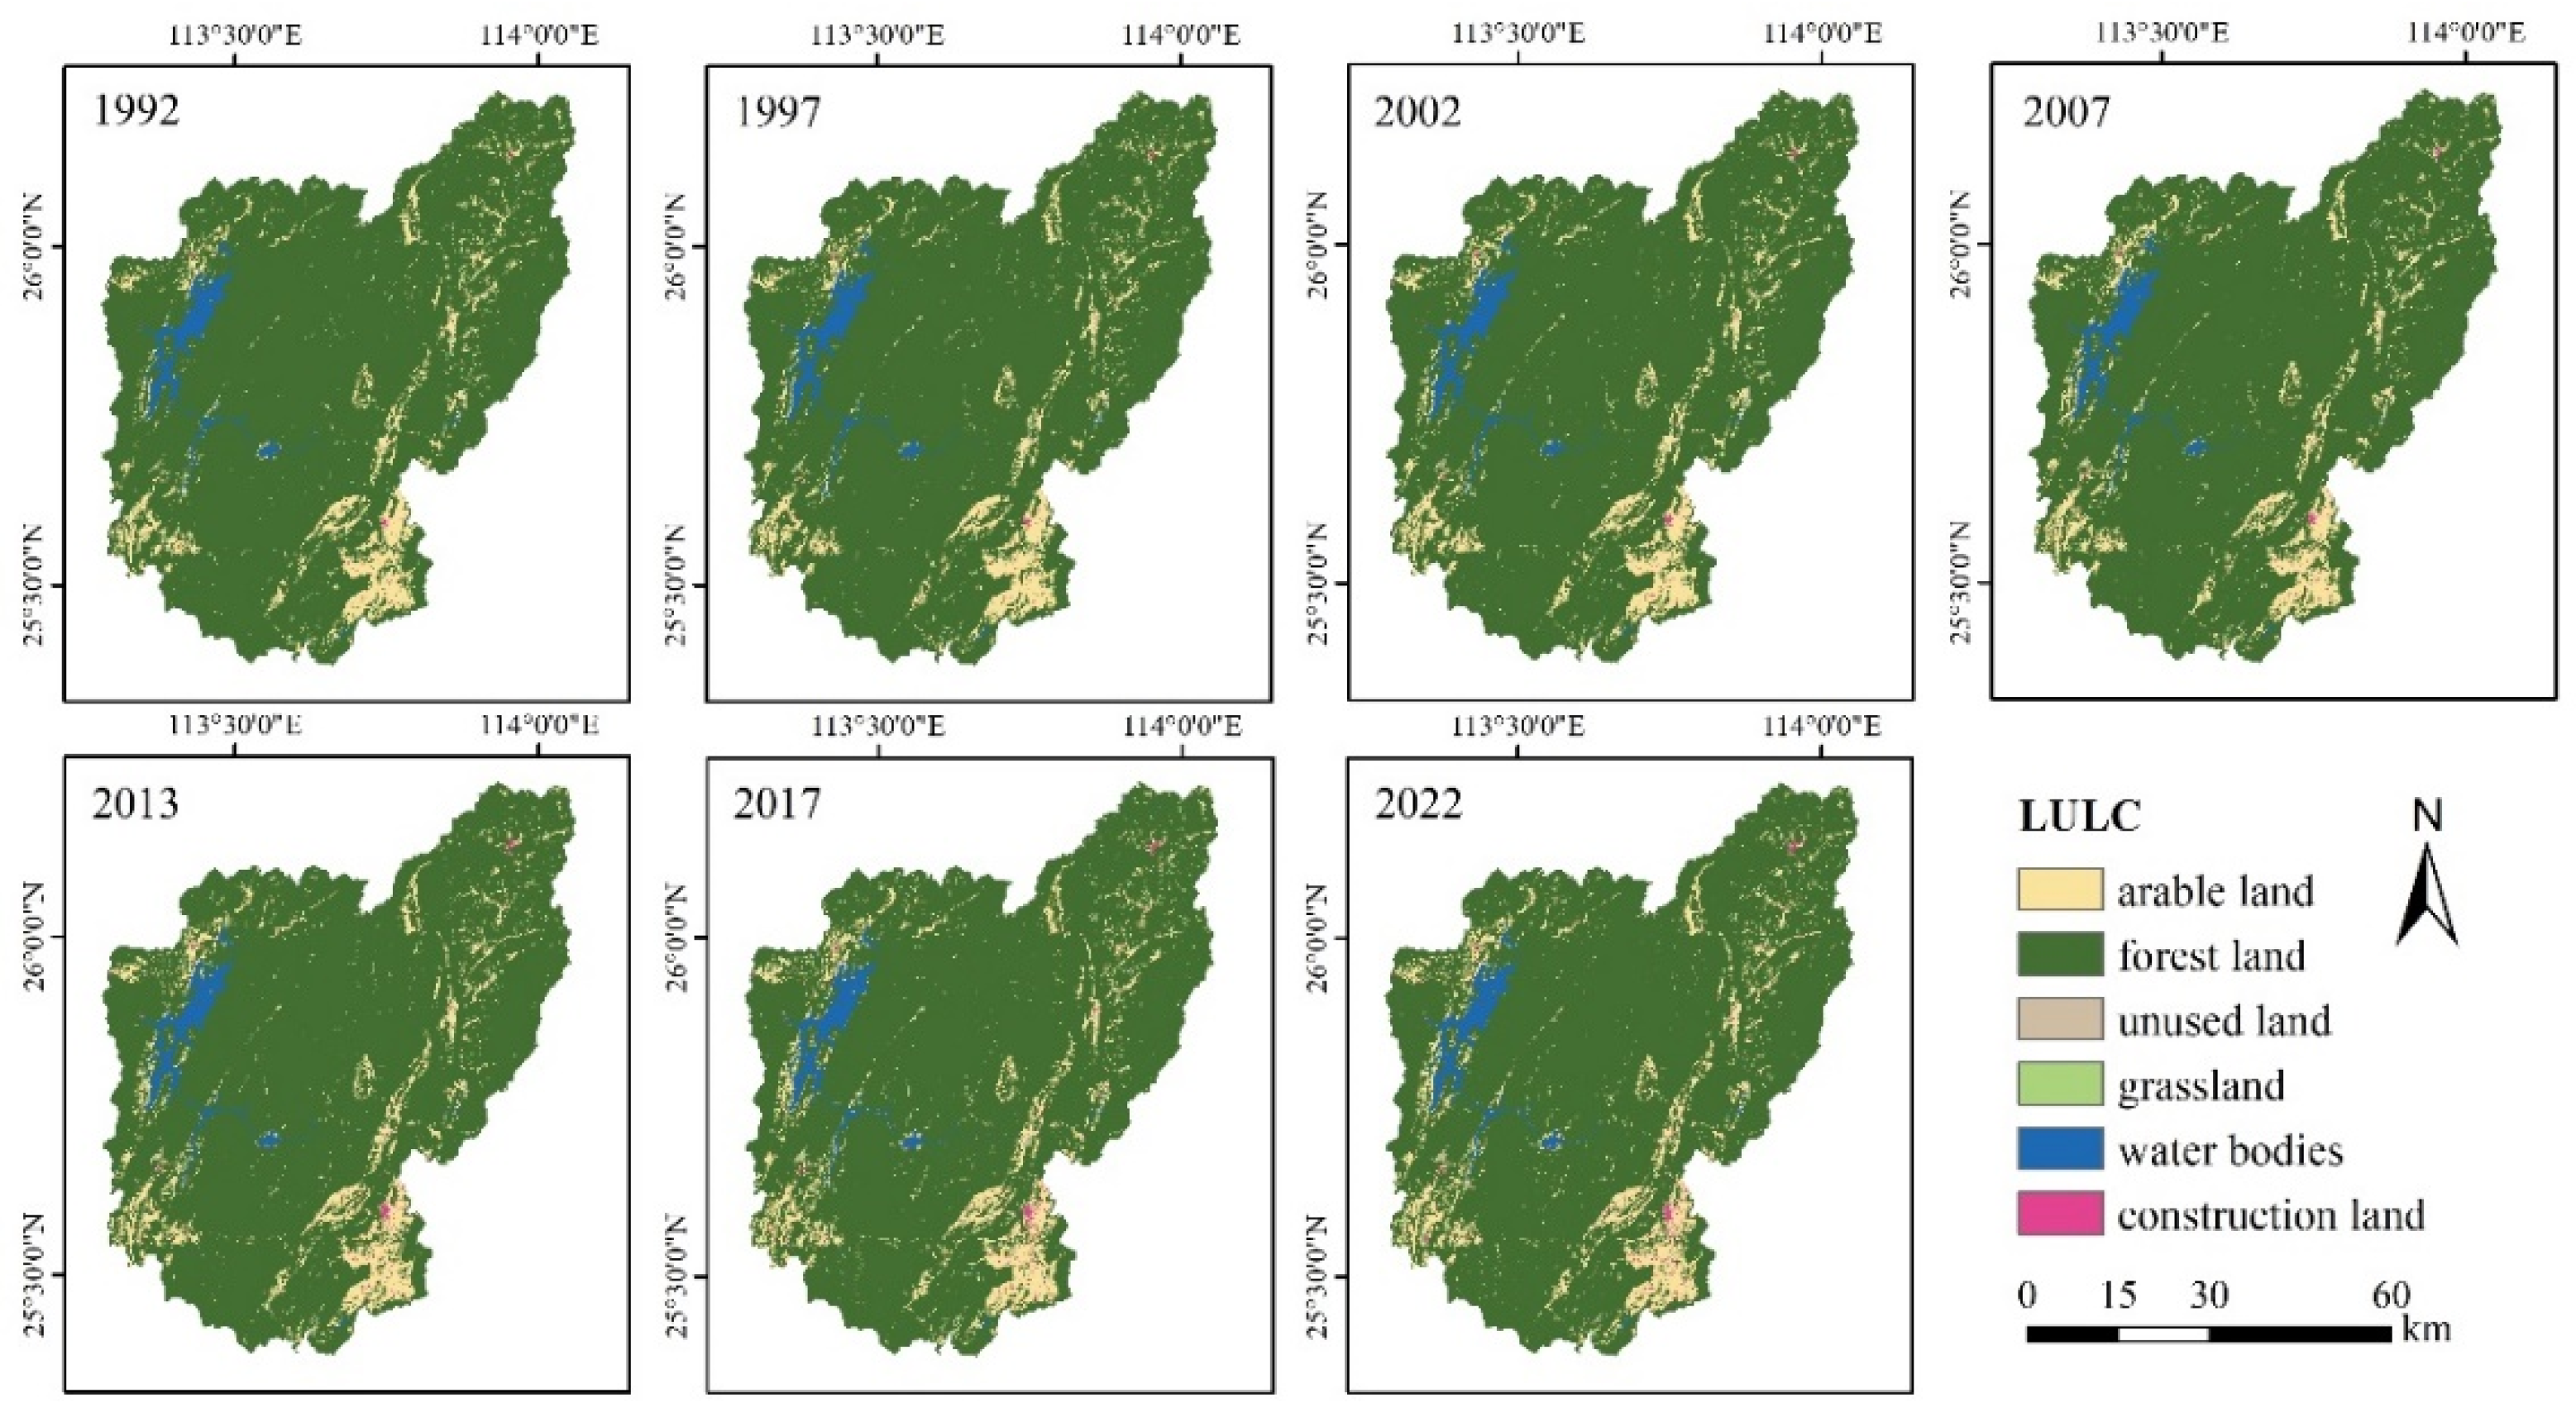
| Year | Area/Proportion | Land Use | |||||
|---|---|---|---|---|---|---|---|
| Forest Land | Arable Land | Grassland | Water Bodies | Construction Land | Unused Land | ||
| 1992 | Area (km2) | 4147.61 | 372.87 | 4.19 | 100.14 | 6.93 | 9.09 |
| Proportion (%) | 89.37% | 8.03% | 0.09% | 2.16% | 0.15% | 0.20% | |
| 1997 | Area (km2) | 4139.48 | 373.65 | 3.80 | 103.73 | 8.04 | 12.13 |
| Proportion (%) | 89.20% | 8.05% | 0.08% | 2.24% | 0.17% | 0.26% | |
| 2002 | Area (km2) | 4115.61 | 396.22 | 3.82 | 104.12 | 10.08 | 10.99 |
| Proportion (%) | 88.68% | 8.54% | 0.08% | 2.24% | 0.22% | 0.24% | |
| 2007 | Area (km2) | 4123.13 | 388.67 | 4.59 | 103.78 | 11.96 | 8.71 |
| Proportion (%) | 88.84% | 8.37% | 0.10% | 2.24% | 0.26% | 0.19% | |
| 2013 | Area (km2) | 4093.91 | 412.06 | 5.55 | 104.01 | 18.08 | 7.21 |
| Proportion (%) | 88.22% | 8.88% | 0.12% | 2.24% | 0.39% | 0.16% | |
| 2017 | Area (km2) | 4061.32 | 441.44 | 6.28 | 102.92 | 22.39 | 6.49 |
| Proportion (%) | 87.51% | 9.51% | 0.14% | 2.22% | 0.48% | 0.14% | |
| 2022 | Area (km2) | 4048.69 | 450.35 | 6.09 | 102.49 | 26.36 | 6.87 |
| Proportion (%) | 87.24% | 9.70% | 0.13% | 2.21% | 0.57% | 0.15% | |
Disclaimer/Publisher’s Note: The statements, opinions and data contained in all publications are solely those of the individual author(s) and contributor(s) and not of MDPI and/or the editor(s). MDPI and/or the editor(s) disclaim responsibility for any injury to people or property resulting from any ideas, methods, instructions or products referred to in the content. |
© 2024 by the authors. Licensee MDPI, Basel, Switzerland. This article is an open access article distributed under the terms and conditions of the Creative Commons Attribution (CC BY) license (https://creativecommons.org/licenses/by/4.0/).
Share and Cite
Song, Y.; Li, X.; Feng, L.; Zhang, G. Spatio-Temporal Dynamics Coupling between Land Use/Cover Change and Water Quality in Dongjiang Lake Watershed Using Satellite Remote Sensing. Land 2024, 13, 861. https://doi.org/10.3390/land13060861
Song Y, Li X, Feng L, Zhang G. Spatio-Temporal Dynamics Coupling between Land Use/Cover Change and Water Quality in Dongjiang Lake Watershed Using Satellite Remote Sensing. Land. 2024; 13(6):861. https://doi.org/10.3390/land13060861
Chicago/Turabian StyleSong, Yang, Xiaoming Li, Lanbo Feng, and Gui Zhang. 2024. "Spatio-Temporal Dynamics Coupling between Land Use/Cover Change and Water Quality in Dongjiang Lake Watershed Using Satellite Remote Sensing" Land 13, no. 6: 861. https://doi.org/10.3390/land13060861
APA StyleSong, Y., Li, X., Feng, L., & Zhang, G. (2024). Spatio-Temporal Dynamics Coupling between Land Use/Cover Change and Water Quality in Dongjiang Lake Watershed Using Satellite Remote Sensing. Land, 13(6), 861. https://doi.org/10.3390/land13060861


