Article

Drought Sensitivity and Vulnerability of Rubber Plantation GPP—Insights from Flux Site-Based Simulation

1
Key Laboratory of Agro-Forestry Environmental Processes and Ecological Regulation of Hainan Province, Hainan University, Haikou 570228, China
2
Ecology and Environment College, Hainan University, Haikou 570228, China
3
Danzhou Investigation & Experiment Station of Tropical Crops, Ministry of Agriculture, Rubber Research Institute, Chinese Academy of Tropical Agricultural Sciences, Danzhou 571737, China
*
Authors to whom correspondence should be addressed.
Land 2024, 13(6), 745; https://doi.org/10.3390/land13060745
Submission received: 22 March 2024 / Revised: 15 May 2024 / Accepted: 23 May 2024 / Published: 26 May 2024

Abstract

:
Drought, an intricate natural phenomenon globally, significantly influences the gross primary productivity (GPP) and carbon sink potential of tropical forests. Present research on the drought response primarily focuses on natural forests, such as the Amazon rainforest, with relatively limited studies on tropical plantations. Therefore, for a comprehensive understanding of global climate change, accurately evaluating and analyzing the sensitivity and vulnerability of rubber plantation GPP to various drought characteristics is crucial. The Standardized Precipitation Evapotranspiration Index (SPEI) was used in this research to quantify drought intensity. The Spatially Explicit Individual Based Dynamic Global Vegetation Model (SEIB-DGVM) was localized based on observation data from the Hainan Danzhou Tropical Agro-ecosystem National Observation and Research Station. Subsequently, the calibrated model was utilized to simulate the dynamic process of rubber plantation GPP under multi-gradient drought scenarios (2 extreme boundaries × 3 drought initiation seasons × 4 drought intensities × 12 drought durations × 12 SPEI time scales). The results show that the sensitivity and vulnerability of rubber plantation GPP exhibit significant differences under drought scenarios in different initiation seasons; GPP exhibits higher sensitivity to extreme, long-duration flash droughts in the early rainy season. Regarding vulnerability, the impact of extreme, long-duration flash droughts on GPP is most pronounced. This research lays the foundation for estimating the impact of droughts on the GPP of rubber plantations under future climate change scenarios, providing a scientific basis for enhancing regional ecological restoration and protection.

1. Introduction

Droughts are among the most complex natural phenomena worldwide and are caused by various factors, including relative humidity, temperature, precipitation scarcity, and wind speed [1]. With the intensification of global climate change, various extreme events are becoming increasingly severe and frequent. Droughts are a particularly serious risk to natural ecosystems and the sustainable development of human society [2]. For ecosystems, the impact of a drought is evident: vegetation withers, and ecosystem structures are disrupted, further leading to a reduction in ecosystem service functions [3,4]. Subsequently, ecosystems accelerate or mitigate climate change through feedback mechanisms [5]. Most future climate projections in the Intergovernmental Panel on Climate Change’s Sixth Assessment Report (IPCC-AR6) indicate increased heatwaves, intensification of evaporation, and scarcity of precipitation, leading to more severe regional drought [6,7,8].
Previous research has indicated that water availability significantly affects vegetation growth in most temperate regions [9,10]. The growth of vegetation in temperate regions is significantly reduced by droughts, which affects ecosystem productivity. However, due to the diversity of tropical ecosystems, there is still no consistent conclusion regarding the effects of droughts on tropical vegetation growth. Therefore, the extreme droughts of 2005 and 2010 in the Amazon region have garnered widespread attention [11,12]. Through long-term monitoring observations [13], field manipulation experiments [14], eddy covariance-based carbon flux observations [15], and large-scale remote sensing inversion [16], it was concluded that changes in hydrothermal conditions leading to drought events are one of the key factors causing variations in carbon cycling in tropical forests [17]. Tropical forest ecosystems are also inevitably expected to suffer from drought impacts [18]. However, field experiments and investigations require a lot of manpower and time [14,19]. Moreover, tropical regions experience high cloud cover throughout the year, limiting remote sensing methods [20]. Consequently, models have been essential tools for understanding and forecasting the responses of tropical forests to climate change [21,22]. Completed studies have focused on carbon fluxes, water fluxes, biomass, and the productivity of rubber forests, such as using the soil vegetation atmosphere transfer (SVAT) model to simulate CO2 and H2O fluxes in the canopy of rubber trees and the process-based Land Use Change Impact Assessment tool (LUCIA) to simulate the biomass and rubber yield of rubber plantations at the scale of individual trees, plots, and landscapes [23,24]. The community Land Model Version 5 (CLM5) has also been used to simulate rubber and has achieved excellent results in terms of rubber yield and carbon flux simulation, and has also been shown to capture the seasonal fluctuations of rubber production well. However, the cross-validation period is relatively short, which fails to reflect simulation accuracy for natural rubber plantation ecosystems under a longer time scale or during climate change [25].
As a significant component of terrestrial ecosystem productivity and surface carbon cycling, gross primary productivity (GPP) represents the expression of photosynthesis at the ecosystem level, determining the total initial carbon input into the ecosystem [26]. As the largest carbon reservoir in terrestrial ecosystems, tropical forests exchange the most carbon dioxide with the atmosphere, constituting about two-thirds of the terrestrial vegetation biomass and playing an important role in the global carbon cycle [27,28,29]. However, due to the complex habitats, community composition, and abundant biodiversity of tropical natural forests, research on these areas is relatively challenging and associated with significant uncertainties. Compared to tropical natural forests, tropical plantation forests have relatively homogeneous ecological environments and stand structures, making them advantageous entry points for studying the carbon cycle in tropical forests. Moreover, research has shown that as representative species of tropical plantation forests, rubber plantation forests have a carbon sequestration capacity per unit area that exceeds that of natural forests [24]. Hainan Island (18°10′~20°10′ N and 108°37′~111°03′ E) covers an area of about 35,400 km2 and is the largest tropical island in China [30]. Hevea brasiliensis plantations are extensively scattered across the island, especially concentrated in the northwest and central mountainous areas, occupying approximately 20 percent of the area of Hainan Island [31]. In addition, after the introduction of Hevea brasiliensis to Hainan, there was a relative scarcity of water and heat conditions, causing a reliance on typhoons to bring precipitation that was concentrated in July to September, accounting for 70% of the total yearly precipitation [32]. Hevea brasiliensis transpiration is strong, especially during the rubber production period. Coupled with the topography and geology of Hainan Island, which causes difficulty in storing large amounts of precipitation for short periods, the rubber plantations in Hainan will also face serious drought impacts [33]. It has been confirmed that the huge water consumption caused by the powerful transpiration of rubber trees in the rainy season exceeds that of other land cover types, and the water deficit caused by a drought seriously affects the carbon sequestration capacity of the natural rubber plantation ecosystem [34,35]. Therefore, it is a necessary to investigate the effects of droughts on the carbon dynamics of rubber plantation ecosystems.
Current studies have investigated the carbon cycle of rubber plantations in Hainan and Xishuangbanna through a series of methods, including biomass inventories, eddy covariance observations, and remote sensing inversion [31,36]. They have also further discussed the carbon cycling and carbon balance processes of the natural rubber plantation ecosystem under differentiated conditions, such as climate, planting patterns, and stand age. Present studies have researched the vulnerability of GPP of Hevea brasiliensis plantations to regional flash drought responses, using changes in GPP as an indicator of drought impacts [37]. Furthermore, the causes of drought in natural rubber plantation ecosystems have been carefully researched [38], as well as the drought resistance mechanisms of rubber natural rubber plantation ecosystems [39].
Against the background of future climate change, the frequency, intensity, and duration of droughts will increase, which will inevitably affect tropical forests. Based on calibrated SEIB-DGVM, used to simulate the response of rubber forest GPP in multiple drought scenarios, the sensitivity and vulnerability characteristics of natural rubber plantation ecosystems in response to different drought characteristics were quantified and clarified. In the existing studies, SEIB-DGVM has exhibited good performance in simulations at the site, intercontinental, and global scales [40], and there have been studies that have improved the simulation performance of the model through parameter optimization [41]. Moreover, by enabling flexible selection of vegetation life and phenological characteristics and allowing the activation or deactivation of plant function types (PFTs), the model has demonstrated the ability to generate simulations covering various ecosystems such as the Malaysian tropical rainforest and eastern Siberian larch forest [42]. Research on the sensitivity and vulnerability of natural rubber plantation ecosystems to droughts can help predict the impact of droughts on tropical plantation ecosystems and the change trend of tropical plantation ecosystems in future climates. Additionally, this research topic holds important practical significance for increasing carbon sinks, mitigating climate change, and maintaining ecological security. The objectives of this study are as follows: (1) to select parameter combinations suitable for natural rubber plantation ecosystems to calibrate SEIB-DGVM; (2) to estimate the sensitivity and vulnerability of rubber plantation GPP in response to different drought characteristics, driven by temperature and precipitation data, in multi-gradient drought scenarios derived based on SPEI; and (3) to explore the differences and mechanisms of rubber plantation GPP responses to multi-gradient drought scenarios.

2. Materials and Methods

2.1. Site Description

DRPFOS was selected as the research site for this study. The full name of this site is the Danzhou Thermal Crop Scientific Observation and Experiment Station of the Ministry of Agriculture, where the average annual temperature ranges from 21.5 to 28.5 °C and the mean annual rainfall is 1607 mm. The DRPFOS micrometeorology observation tower is fitted with a flux and gradient system, such as the EC system, including a three-dimensional sonic anemometer, an open-path infrared gas analyzer, and a meteorology system to collect environmental data [37,43]. In this study, the observation data of the flux tower (109°28′30″ E, 19°32′ 47″ N) were used. The area of the tower includes a mature rubber plantation planted in 2001, wherein the cultivated strain is Reyan 7-33-97, and the planting density is 476 trees/ha. At the end of 2014, the average canopy height of the gum forest community was 14.0 m, with a single structure and obvious stratification. The upper layer is a rubber forest tree layer with a height of 12–16 m, and below is a herbaceous layer, about 0.4 m high [22].

2.2. Meteorological Data

2.2.1. Site Observation Data

The data that we used to drive the model included the specific humidity (kg/kg), wind velocity (m/s), total cloudiness (fraction), soil temperatures at a 300 cm depth (°C), temperature (°C), soil temperatures at a 10–200 cm depth (°C), the daily temperature range (°C), soil temperatures at a 0–10 cm depth (°C), and precipitation (mm/day). In model localization, other data, except total cloudiness and three pieces of soil temperature-related data, from DRPFOS were obtained to realize model calibration. In addition, the GPP calculated from the vorticity flux observations at DRPFOS was cross-verified with the simulation results to ensure the usability of the model.

2.2.2. ERA5 Reanalysis Data

Published by the European Centre for Medium-Range Weather Forecasts (ECMWF), the European Reanalysis 5th Generation (ERA5) is a high-quality global meteorological dataset. ERA5 reanalysis data are widely used in meteorology, climate, environment, and climate change research. In this study, we utilized daily data from ERA5 reanalysis, spanning the years 1993–2022, including the 2 m temperature, 0–7 cm soil temperature, 28–100 cm soil temperature, 100–289 cm soil temperature, total precipitation, total cloudiness, u-component of 10 m of wind, v-component of 10 m of wind, specific humidity, and 2 m maximum (or minimum) air temperature. The resolution of the soil temperature-related data was 0.1° × 0.1°, while the resolution of the other data was 0.25° × 0.25°. Using oppositely coarse original data, the corresponding data at the specified location were determined through nearest-neighbor interpolation. To obtain the interpolated value at the selected location, all the raster data covering Hainan Island were weighted with the reciprocal of the distance to calculate the value of the selected position. The above processing was implemented using Matlab’s scatterredInterpolant function.

2.3. Method

Our research relied on observation data from the Danzhou Rubber Plantation Flux Observation Site (DRPFOS) within ChinaFLUX to complete the calibration of the SEIB-DGVM (Spatially Explicit Individual Based Dynamic Global Vegetation Model). We traced the entire drought process using the Standardized Precipitation Evapotranspiration Index (SPEI) and identified GPP as the target for drought response. Based on calibrated simulations, we investigated the response of rubber forest GPP to multiple gradient drought scenarios. Then, we quantified and elucidated the sensitivity and vulnerability features of the natural rubber plantation ecosystem to various drought characteristics.

2.3.1. Adaptation of SEIB-DGVM

SEIB-DGVM is a mechanism process model that simulates the interactions between individual plants. Driven by meteorological and soil data, the model simulates local interactions among individual plant organisms in a constructed virtual forest, including growth, competition, and death under shaded conditions influenced by light availability. It can simulate a series of terrestrial physical and physiological processes of plants and the dynamic processes of individual plant establishment, growth, and mortality. This enables feedback on the effects of environmental changes on terrestrial ecosystems and land–atmosphere interactions [44].
The SEIB-DGVM classified 16 plant function types (PFTs). Due to the monoculture ecosystem of natural rubber plantations in the rubber-producing areas of Hainan, this study only designated one PFT for rubber trees as arboreal vegetation and two PFTs for herbaceous vegetation to simulate understory cash crops. As shown in Figure 1, corrections were made to the localized latitude and longitude of the model. Then, 100 years of daily weather data from 1901 to 2000 were re-entered 10 times and inputted to drive the model during the spin-up process, allowing soil and thermal conditions to reach equilibrium. Subsequently, aboveground biomass was removed to simulate clearing native forests for rubber plantation establishment at the simulation site. Parameters adjusted in the process of model calibration included the maximum age of tree death, root depth, diameter at breast height, maximum tree height, three critical points of the temperature of vegetation growth, maximum crown diameter, and the establishment probability of new plants in the vacant grid, which were acquired by fielding measurements and communicating with rubber tree farmers. Through parameter sensitivity analysis, key parameters including the ratio of canopy thickness to tree height, the maximum leaf area of each canopy surface, the ratio of the leaf amount to fine root amount, the maximum photosynthetic rate under optimum temperature and sufficient soil moisture conditions, and the efficiency of light use in photosynthesis were selected to be adjusted in the subsequent gradient combination simulation. Daily meteorological data from 2001 to 2015 were used to drive the model and the model simulation results were cross-validated with the Danzhou site observation GPP for the corresponding periods. The observation GPP was obtained by the difference between NEE and Re. NEE was calculated by summing carbon flux and canopy carbon storage. The accurate carbon flux was obtained by correcting and interpolating the flux data of the station, and the canopy carbon storage was calculated using the change in carbon dioxide concentration in a single layer. The fitting parameters of the Van’t Hoff model were obtained by regression, and then the ecosystem respiration was calculated. We determined the optimal combination of key parameters based on the size of the RMSE. After determining the optimal combination of key parameters, the remaining parameters were adjusted by gradient one by one. The parameters that were finally adjusted based on this process included the heterogeneity index of stem dry biomass, the nitrogen proportion of sapwood, and the nitrogen proportion of fine roots, and the best parameter combination was selected to complete the final model calibration.

2.3.2. Drought Identification

The Standardized Precipitation Evapotranspiration Index (SPEI) was proposed by Vicente-Serrano et al. (2010), and the index considers the difference between temperature sensitivity, potential evapotranspiration, precipitation, and multi-time scale characteristics, making it a reasonable method for drought monitoring and assessment [45]. The principle is to analyze the statistical distribution pattern of the difference between potential evaporation and precipitation, thus reflecting the changes in drought conditions. Therefore, this study chose to use the SPEI, which is more suitable for monitoring drought under climate warming. In this study, precipitation and temperature changes were calculated for multi-drought scenarios (2 extreme boundaries × 3 drought initiation seasons × 4 drought intensities × 12 drought durations × 12 SPEI time scales) from 1993 to 2022 using the SPEI at 12 time scales. Further, four drought intensities were distinguished according to the SPEI values (when the SPEI > −0.5, drought severity was defined as non-drought; when −0.5 > the SPEI > −1, drought severity was defined as mild drought; when −1 > the SPEI > −1.5, drought severity was defined as moderate drought; when −1.5 > the SPEI > −2, drought severity was defined as severe drought; and when the SPEI ≤ −2, drought severity was defined as extreme drought).

2.3.3. Experiment Design for Multi-Gradient Drought Scenarios

  • Drought scenarios:
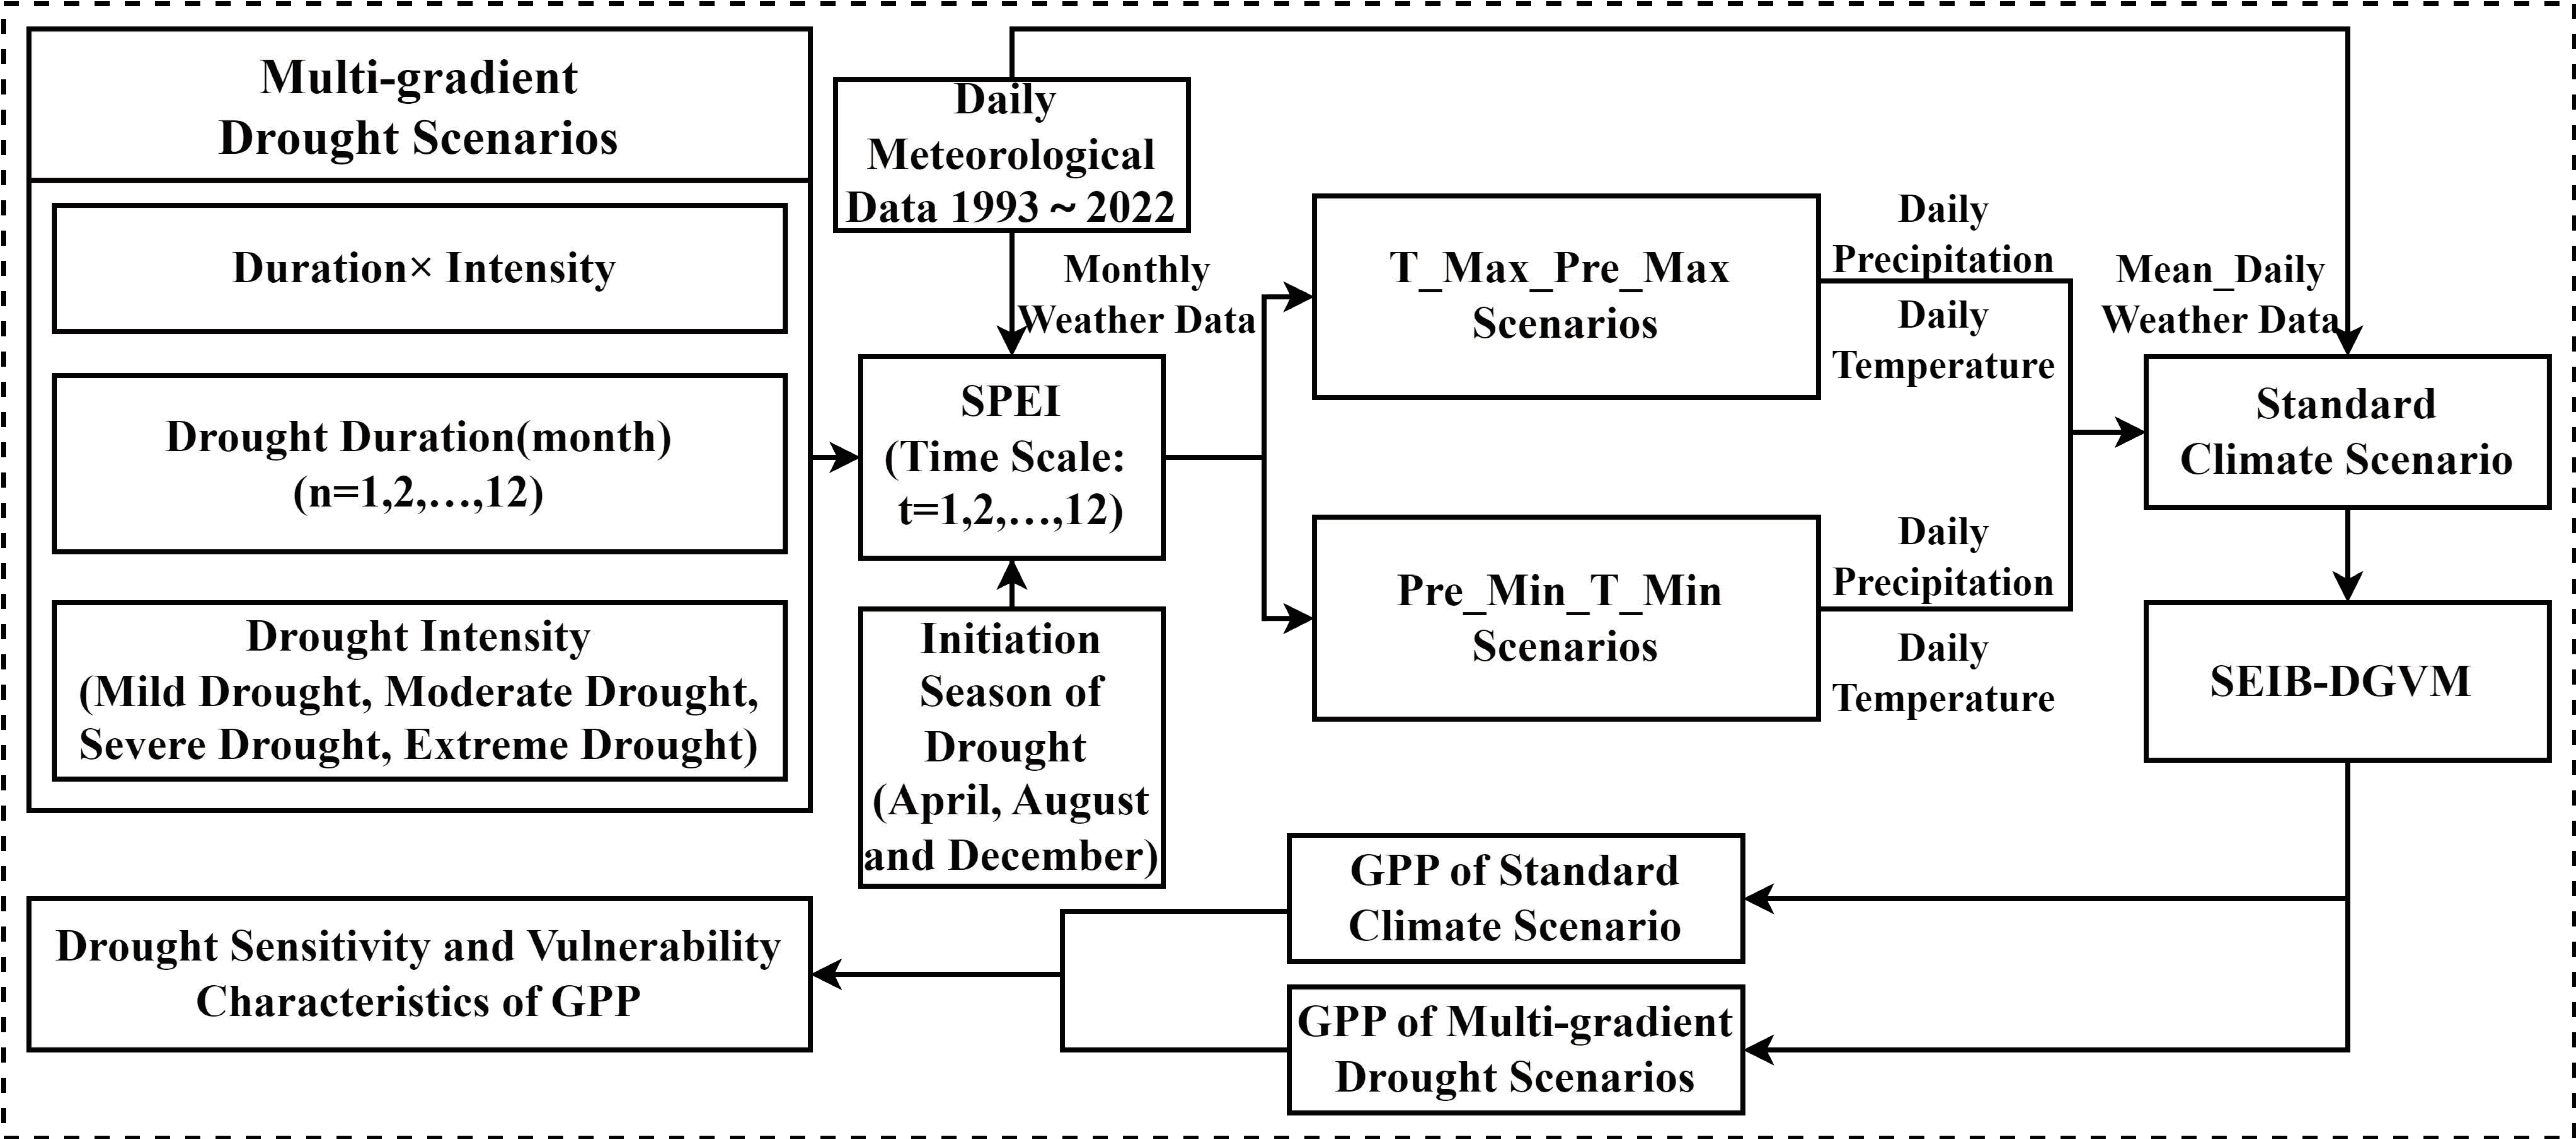
As shown in Figure 2, this study delineated drought using four gradients of drought intensity, three gradients of the drought initiation season, and twelve gradients of drought duration. Drought was uniformly defined to occur in the same year, with initiation seasons designated as the early rainy season (April), peak rainy season (August), and early dry season (December), three important climate nodes affecting rubber production. The drought duration ranged from 1 to 12 months (where 1–2 months was classified as an extremely short duration, that not exceeding 5 months was classified as a short duration, medium duration was 6–9 months, and a long duration was 10–12 months). Drought intensity was categorized as extreme drought (SPEI = −2.00), severe drought (SPEI = −1.75), moderate drought (SPEI = −1.25), and mild drought (SPEI = −0.75).
  • Model setup:
The SPEI was calculated from precipitation and potential evapotranspiration, which is derived from temperature. Therefore, corresponding precipitation and temperature values can be reverse-deduced by SPEI values and predefined extreme boundaries (including upper and lower limits for temperature and precipitation). Based on the standard climate state data, daily meteorological data corresponding to each scenario covering a 30-year period (1993 to 2022) were derived. By setting the daily meteorological data under different scenarios, SEIB-DGVM was driven to simulate rubber plantation GPP under different drought scenarios.
  • Scenario adjustment:
Based on the existing meteorological data of Hainan Island and reserving the variation range for the fluctuation of meteorological data caused by climate change in the future, in this study, the preset minimum value of precipitation was 0. In contrast, the maximum precipitation value was limited by a 10% increase from the standard climate state data. The upper and lower limits of temperature were determined by the daily maximum and minimum temperatures under a standard climate state. The upper temperature limit was set at 80% of the maximum temperature, while the lower limit was calculated by increasing the minimum temperature by 20%. According to the SPEI calculation formula, we were able to construct extreme boundaries encompassing all drought scenarios by matching the maximum temperature with the maximum precipitation (Tmax and Premax) and the minimum precipitation with the minimum temperature (Premin and Tmin). For each drought scenario, the temperature and precipitation data were iteratively adjusted to match the predefined extreme boundaries while maintaining the specified SPEI values. The temperature adjustment was carried out with a 5% increase or decrease until an equilibrium between temperature and precipitation was reached.
In the Tmax and Premax scenario, based on the set SPEI value and predefined precipitation upper limit, a set of temperature upper limit data was obtained. These were compared with the predefined temperature upper limit data, and the smaller set was chosen as the temperature data for this scenario. Based on the set SPEI value and new temperature data, a set of new precipitation data was obtained. If the new precipitation data did not exceed the predefined precipitation upper limit, the scenario was determined to exist. On the contrary, this means that the inexistence of this scenario required iterative adjustment. Similarly, in the Premin and Tmin scenario, the corresponding lower limit of temperature data was obtained based on the SPEI value we set and the predefined lower limit of precipitation. This set of temperature data was compared to a predefined lower limit of temperature data, and the larger dataset was selected as the temperature data for the scenario. We then obtained new precipitation data based on the new temperature data and the set SPEI value. If the new precipitation data were greater than 0, this scenario was determined to exist. Conversely, this means the inexistence of this scenario required iterative adjustment.
  • Data generation:
Using different time scales of specified SPEI values and drought characteristics, various drought scenarios’ daily precipitation and temperature data can be inversely derived based on standard climate state data. Ultimately, 3456 sets (2 extreme boundaries × 3 drought initiation seasons × 4 drought intensities × 12 drought durations × 12 SPEI time scales) of daily meteorological data under different drought scenarios were obtained and used to drive the model. We simulated GPP values under multiple drought scenarios, compared and analyzed GPP values under standard climate states with those under multiple drought scenarios, and elucidated the response mechanism of GPP under multiple drought scenarios.

2.3.4. Sensitivity and Vulnerability

Drought sensitivity refers to the degree of response of an ecosystem or species to drought [46]. In this research, drought sensitivity was defined as the degree of GPP response of the natural rubber plantation ecosystem to a drought at the initiation of the drought season. The formula was as follows [47]:
S e n s i t i v i t y = I n i t i a t i o n - S e a s o n ( G P P S t d G P P M o d ) G P P S t d
where GPPMod represents the simulated GPP value for the of the drought season under different drought scenarios, and GPPStd represents the simulated GPP value for the corresponding month under the standard climate state.
Vulnerability, which includes susceptibility, coping capacity, and adaptability, refers to the trend of change when subjected to disturbance, reflecting the severity of the disturbance impact [48]. In this study, vulnerability was defined as the most severe damage to the GPP of natural rubber plantations during a drought. The variation in GPP based on the monthly scale of rubber plantations was different. In order to eliminate the influence of seasonal variation on vulnerability, we conducted de-seasonality treatment. The formula was as follows:
V u l n e r a b i l i t y = M a x ( G P P S t d G P P M o d ) G P P S t d
where GPPMod denotes the simulated GPP value under drought scenarios, and GPPStd means the simulated GPP value for the corresponding month under the standard climate state, taking the maximum difference between the two values.

3. Results

3.1. Model Validation

Subject parameters involved in parameter adjustment were selected based on parameter sensitivity analysis, and 217,074 simulations were completed using different parameter combinations. After determining the optimal combination of key parameters, 7599 additional simulations were performed by adjusting the remaining parameters one by one. In total, 224,673 model simulations were completed. Figure 3a shows the time series of the Danzhou flux site monthly observation GPP value (GPP_Obs) and the monthly estimated GPP value (GPP_Est) simulated by the calibrated model during 2010–2015, while Figure 3b shows the scatter point plot of the GPP_Obs and the GPP_Est simulated by the calibrated model during 2010–2015. The missing portions in Figure 3a were mainly caused by the absence of site data. After calibration, the model’s root mean square error (RMSE) was 1.932 g C/m2/day, with an R square value of 0.643, but GPP_Est was slightly underestimated. The overall trend of the model fit well, and there was a high correlation between GPP_Obs and GPP_Est. SEIB-DGVM effectively reproduced the monthly dynamics of observation GPP at the Danzhou flux site, and can be applied to simulate GPP and carbon dynamics in rubber plantations under multi-gradient drought scenarios.

3.2. The Sensitivity and Vulnerability of GPP to Initiation Season of Drought

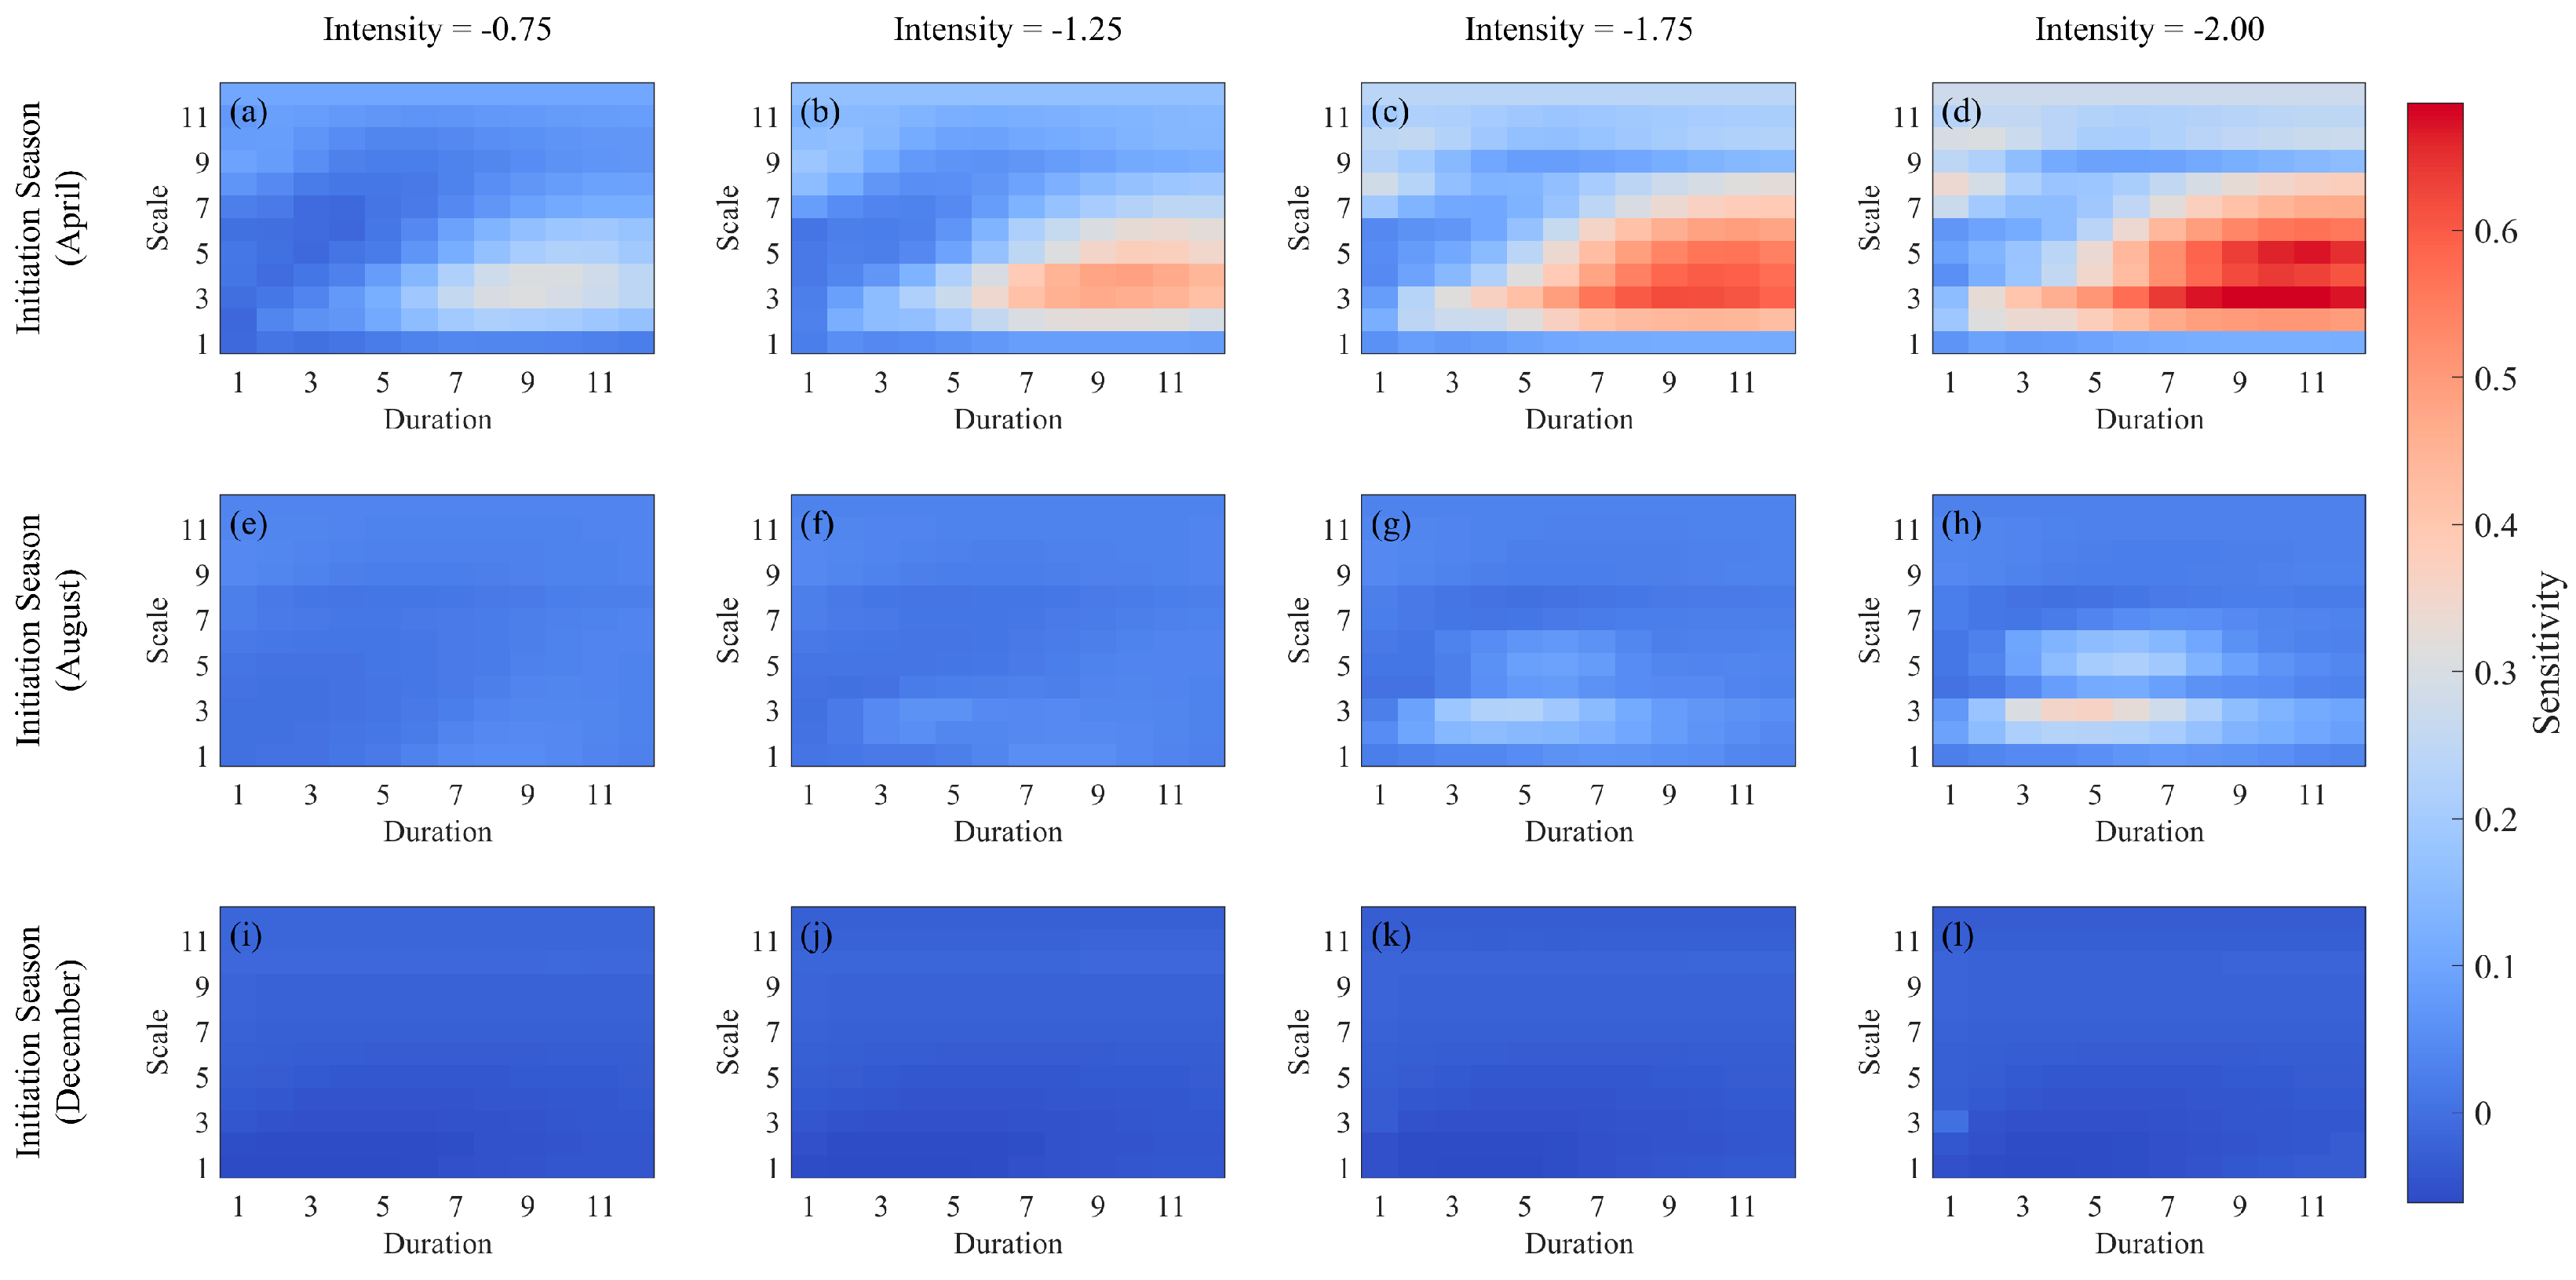
As shown in Figure 4, there were differences in the sensitivity of GPP to droughts occurring in different drought initiation seasons. In drought scenarios dominated by precipitation scarcity, the sensitivity of GPP to droughts occurring in the early rainy season ranged from a maximum of 0.655 to a minimum of 0.003; for droughts occurring in the peak rainy season, the sensitivity of GPP ranged from a maximum of 0.554 to a minimum of 0.01; and for droughts occurring in the early dry season, the sensitivity of GPP ranged from a max value of 0.748 to a min value of −0.023. Overall, GPP was generally more sensitive to droughts occurring in the early rainy season (Figure 4a–d). In contrast, the sensitivity of GPP to droughts occurring in the peak rainy season was relatively lower (Figure 4e–h). Although the sensitivity in most scenarios of droughts occurring in the early dry season was relatively low, there were specific drought scenarios with exceptionally high sensitivity, and these scenarios tended to exhibit a higher sensitivity to flash droughts than gradual droughts (Figure 4i–l).
In drought scenarios dominated by high temperatures, the sensitivity of GPP to droughts occurring in the early rainy season ranged from a maximum of 0.687 to a minimum of −0.013; for droughts occurring in the peak rainy season, the sensitivity of GPP ranged from a maximum of 0.363 to a minimum of 0.001; and for droughts occurring in the early dry season, the sensitivity of GPP ranged from a maximum of 0.001 to a minimum of −0.062. When the intensity and duration of the drought were consistent, GPP remained more sensitive to droughts occurring in the early rainy season, with a higher sensitivity to flash droughts than gradual droughts (Figure 5a–d). The sensitivity to most drought scenarios occurring in the peak rainy season and early dry season was generally lower (Figure 5e–l).
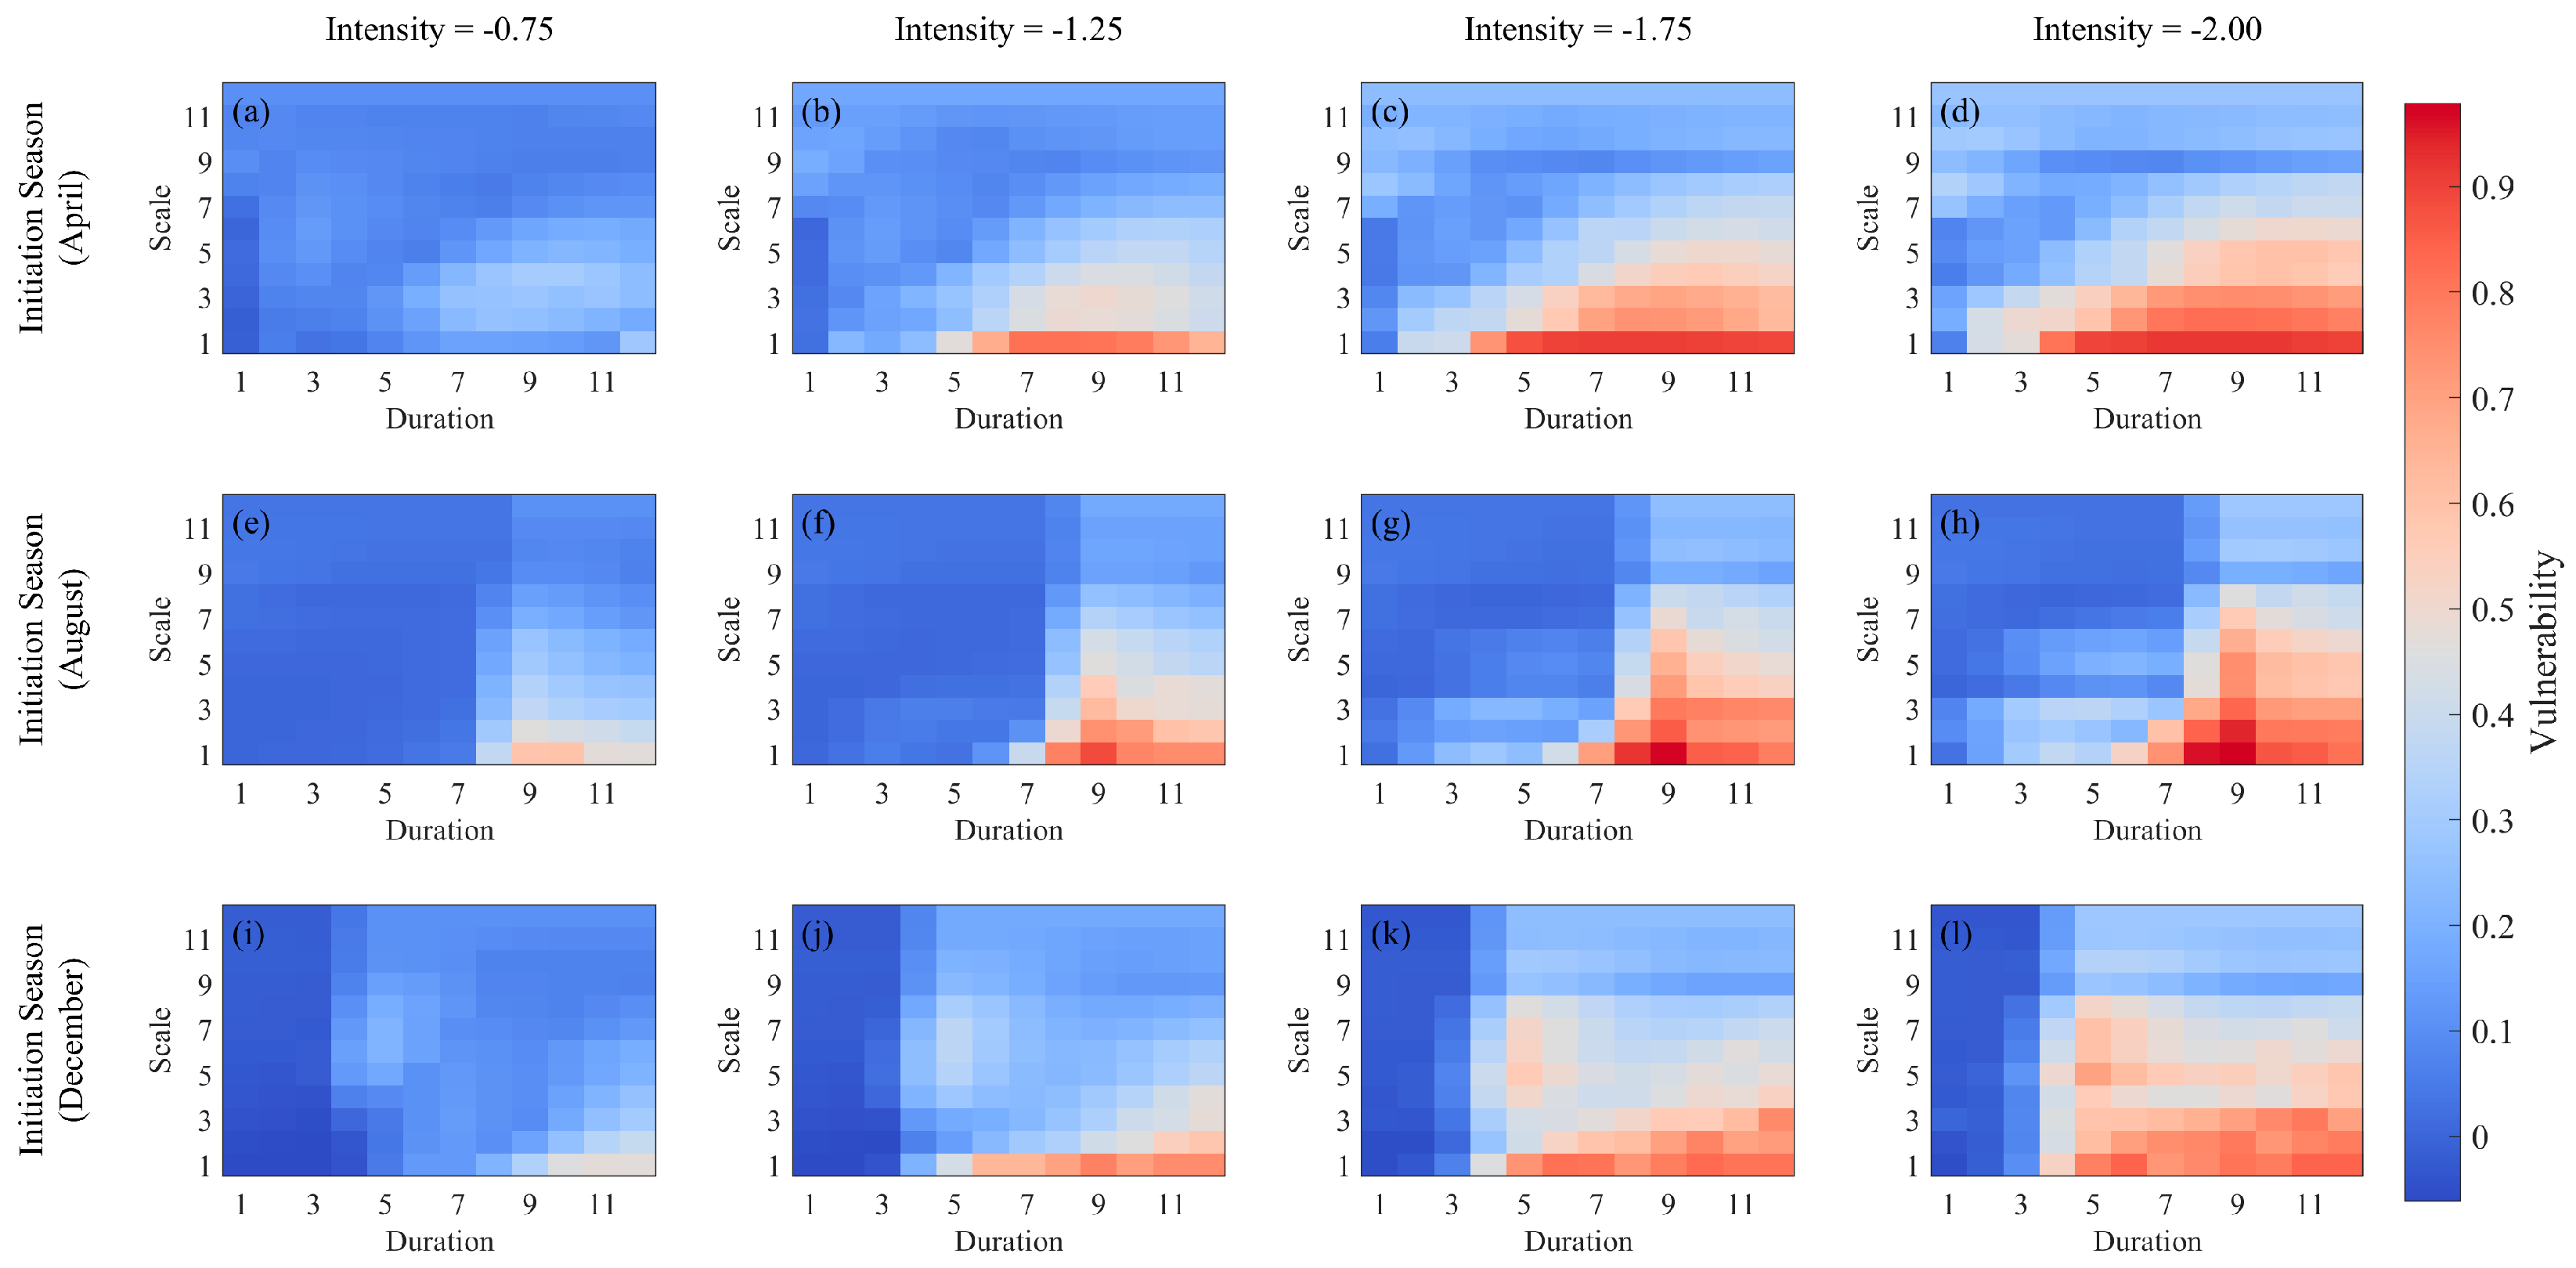
The vulnerability of GPP to droughts in different initiation seasons of drought is also different. In drought scenarios dominated by precipitation scarcity, the vulnerability exhibited by GPP to droughts occurring in the early rainy season ranged from a maximum of 0.949 to a minimum of 0.003; for droughts occurring in the peak rainy season, the vulnerability exhibited by GPP ranged from a maximum of 0.987 to a minimum of 0.01; and for droughts occurring in the early dry season, the vulnerability exhibited by GPP ranged from a maximum of 0.961 to a minimum of −0.014. Based on the vulnerability depicted in Figure 6, holistically, droughts occurring in the early rainy season and early dry season resulted in higher losses to GPP compared to droughts occurring in the peak rainy season across more drought scenarios. According to the performance of GPP vulnerability, flash droughts caused greater losses to GPP.
In drought scenarios dominated by high temperatures, the vulnerability exhibited by GPP to droughts occurring in the early rainy season ranged from a maximum of 0.918 to a minimum of −0.013; for droughts occurring in the peak rainy season, the vulnerability exhibited by GPP ranged from a maximum of 0.979 to a minimum of 0.001; and for droughts occurring in the early dry season, the vulnerability exhibited by GPP ranged from a maximum of 0.841 to a minimum of −0.062. According to the vulnerability depicted in Figure 7, droughts occurring in the early rainy season and peak rainy season resulted in higher losses to GPP in some scenarios compared to droughts originating during the early dry season. Additionally, regardless of the climatic nodes, flash droughts caused greater losses to GPP.

3.3. The Sensitivity and Vulnerability of GPP to Drought Duration

As shown in Figure 4, in drought scenarios dominated by precipitation scarcity, there were drought scenarios with higher sensitivity of GPP regardless of the duration of the drought. Most scenarios exhibited an increase in sensitivity with prolonged drought duration (Figure 4a–h), but some scenarios showed the opposite trend (Figure 4i–l). According to Figure 5, in drought scenarios dominated by high temperatures, GPP exhibited higher sensitivity to droughts with a medium to long duration than droughts with a short duration, and showed a higher sensitivity to flash droughts than gradual droughts.
The vulnerability depicted in Figure 6 shows that in drought scenarios dominated by precipitation scarcity, flash droughts with a long duration caused greater losses to GPP. In drought scenarios dominated by high temperatures, even flash droughts with a short duration had a significant impact on GPP. However, the most damaging drought scenarios were the flash droughts with a long duration (Figure 7).

3.4. The Sensitivity and Vulnerability of GPP to Intensity of Drought

Regarding sensitivity, in drought scenarios dominated by precipitation scarcity, as drought intensity intensified, the sensitivity of GPP also increased in most scenarios (Figure 4a–h). However, there were also scenarios where the opposite trend was observed (Figure 4i–l). In drought scenarios dominated by high temperatures, droughts occurring in both the early rainy season and the peak rainy season were accompanied by an increase in drought intensity, resulting in a significant increase in GPP sensitivity (Figure 5a–h).
In Figure 6, in terms of sensitivity, in drought scenarios dominated by precipitation scarcity, as the intensity increased, drought scenarios causing high damage to GPP further extended toward droughts with short duration. In Figure 7, in drought scenarios dominated by high temperatures, where other drought characteristics were consistent, as the intensity of the drought intensified, GPP exhibited increasing vulnerability.

4. Discussion

4.1. The Importance of Evapotranspiration

Before conducting the formal experiment in this study, a preliminary experiment was conducted using the SPI to define drought. However, the experimental results indicated that using the SPI based solely on precipitation failed to effectively capture the sensitivity changes in GPP in both the peak rainy season and the early dry season (Figure S1). In the peak rainy season, the vulnerability of GPP to short-duration drought scenarios was also not ideal (Figure S2). The average annual precipitation of the research area is 1607 mm, mainly in the rainy season from July to September, accounting for more than 70% of the precipitation for the year [32]. However, droughts still occur, mainly due to the significant evapotranspiration caused by strong radiation, which may be why the SPI cannot capture droughts.
Although precipitation is one of the important factors affecting the initiation season duration and intensity of droughts [49,50], global warming has become an indisputable fact. Given that the temperature may continue to rise in the future, the influence of temperature on drought events cannot be ignored [51].
The temperature acts as a determining factor for potential evapotranspiration. It has been proven that strong evapotranspiration caused by high temperatures greatly reduces precipitation, and its drying efficiency is equivalent to that caused by a lack of precipitation [52]. Extreme temperatures cause obvious damage to both natural and artificial ecosystems and significantly increase evapotranspiration rates and water stress [53].
The SPI does not capture droughts well during the rainy season, a fact corroborated by present research [54]. This may be due to the drought occurring in the rainy season, and the GPP loss is not obvious. Whether in Xishuangbanna, which serves as the study area in the present research, or at the Danzhou site in this study, precipitation during the rainy season significantly exceeds the water demand of the vegetation. When precipitation decreases abruptly during the rainy season, vegetation can still utilize the remaining precipitation and soil moisture to sustain its growth without experiencing significant water stress. However, high temperatures directly influence potential evapotranspiration. Intense evaporation and transpiration leads to a significant loss of soil moisture and water stored within vegetation. The insufficiency of available water resources for vegetation consequently affects vegetation productivity.

4.2. Characteristics of Drought

The variations in performance among different plants and ecosystems under different drought scenarios can be utilized to reveal the vulnerability and sensitivity of ecosystems to drought impacts [55]. However, significant differences exist in the response processes of GPP to drought events among different ecosystems and regions [56,57]. The initiation season, duration, intensity, and other characteristics of drought, vegetation phenology, and overall environmental conditions all influence the vegetation response to drought [58]. In this study, as the drought intensity intensified and the drought duration prolonged, the overall sensitivity and vulnerability of rubber plantations to droughts also increased. The anomalous results of short-duration droughts occurring in the early dry season in the Premin and Tmin scenarios also indicated that temperature is an important factor influencing productivity. As the study area enters the dry season, it also enters the period of the lowest temperatures of the year, during which rubber forests experience a noticeable period of leaf shedding. At this time, because rubber forests can still obtain the necessary moisture from residual precipitation and soil moisture over a short period, relatively high temperatures may delay the leaf shedding of rubber forests to some extent. In mild short-duration drought scenarios, low temperatures may accelerate the leaf shedding process of rubber forests, thereby affecting vegetation GPP. It is also possible that when a drought occurs in the early dry season, compared to a mild drought, as the intensity increases, it may trigger compensatory growth in rubber trees, resulting in an unusual phenomenon of high intensity but low sensitivity [59]. Another phenomenon contrary to the expected results is the low sensitivity of rubber plantation GPP to droughts at the SPEI on a time scale of one month. This may be because, for rubber trees, seasonal compensation growth is fully expressed; thus, they fail to exhibit high sensitivity regardless of the circumstances [60]. In addition, the reason why the seasonal compensation growth does not show mitigation of the negative effects of drought on a longer time scale may be because Hainan Island mainly relies on typhoons and other meteorological events to creat short-term heavy precipitation. Secondly, due to the high elevation in the middle part of Hainan Island and the low terrain around it, as well as the poor soil and geological structure with poor water holding capacity, it is impossible to effectively store short-term heavy precipitation. Further, it is impossible to achieve long-term effective water holding to provide adequate water supply for rubber plantations [33].

4.3. Characteristics of Rainy or Dry Seasons

After being introduced to Hainan, natural rubber trees exhibited a distinct leaf shedding period, corresponding to the phenological characteristics in the rainy and dry climatic conditions. Compared with the SPI results in the preliminary experiment (Figure S2), the SPEI was able to better capture the sensitivity of GPP to drought that initiates in the rainy season. However, in the Tmax and Premax scenarios, the sensitivity of GPP to a drought that initiates at the beginning of the dry season was consistently low. This may be because the dry season coincides with the leaf-shedding period of rubber trees. During this period, due to leaf fall, the productivity of the natural rubber plantation ecosystem is already relatively low. Therefore, drought scenarios with high temperatures and high precipitation are not likely to have a substantial impact on the GPP. The scarcity of available water resources can inhibit physiological activities such as vegetation sprouting, branch growth, and flowering. However, research has found that vegetation can still accomplish leaf unfolding and flowering in severe drought scenarios [61]. This relies on plants being able to adapt to drought scenarios by altering their physiological structure. However, these changes can affect vegetation growth, decreasing productivity [62]. Rubber trees, as a representative tropical plantation species with high carbon sequestration capacity per unit area compared to natural forests, have replaced large forested areas since 1993 [63]. The present research has confirmed that at a global scale, high temperatures and drought have led to tree mortality and canopy wilting [64]. However, studies have also shown that the impact of a single event may be higher than that of a complex event [65]. Future research will focus on post-drought studies, such as recovery and drought legacy effects, as well as the response of the GPP of natural rubber plantation ecosystems to compound hot and dry conditions and thermal adaptation of respiration in the context of climate change.

5. Conclusions

Research indicates that, in terms of sensitivity, there are differences in the response of the GPP of natural rubber plantation ecosystems to drought scenarios in different initiation seasons. GPP exhibits relatively higher sensitivity to droughts that occur in the early rainy season while showing less sensitivity to the majority of droughts that occur in the peak rainy season and early dry season. However, highly sensitive drought scenarios also occur within the peak rainy season and early dry season. Compared to gradual droughts, GPP is more sensitive to flash droughts. Additionally, GPP exhibits higher sensitivity to longer-duration drought scenarios. In most drought scenarios, GPP shows higher sensitivity to extreme drought than to mild drought. Overall, GPP exhibits higher sensitivity to extreme flash droughts with a long duration in the early rainy season.
In terms of vulnerability, the impact of drought initiation at different climatic nodes on GPP varies significantly. The maximum GPP loss caused by drought initiation at the peak rainy season is higher than that associated with droughts occurring in the early rainy season and the early dry season. The impact of flash droughts on GPP is more pronounced than that of gradual droughts. The damage effect of long duration drought on GPP is higher than that of short duration drought. Meanwhile, the loss of GPP also increases with the intensity of drought. The impact of extreme flash drought with long duration on GPP is obvious.
Therefore, complete logging during rubber plantation renewal will lead to fluctuations in productivity. The next research step will consider incorporating the succession process of logging cycles into simulations under different drought scenarios to explore their effects on GPP variation.

Supplementary Materials

The following supporting information can be downloaded at: https://www.mdpi.com/article/10.3390/land13060745/s1, Figure S1: Standardized Precipitation Index (SPI) preliminary experiment, intensity = −0.75, initiation season in April (a); August (e); April (i). Intensity = −1.25, initiation season in April (b); August (f); April (j). Intensity = −1.75, initiation season in April (c); August (g); April (k);. Intensity = −2, initiation season in April (d); August (h); April (l). The sensitivity of GPP varies with the duration of drought and the SPI time scale; Figure S2: Standardized Precipitation Index (SPI) preliminary experiment. Intensity = −0.75, initiation season in April (a); August (e); April (i). Intensity = −1.25, initiation season in April (b); August (f); April (j). Intensity = −1.75, initiation season in April (c); August (g); April (k). Intensity = −2, initiation season in April (d); August (h); April (l). The vulnerability of GPP varies with the duration of drought and the SPEI time scale.

Author Contributions

Conceptualization and methodology, R.Z., Z.S. and L.W.; data processing, R.Z., Y.A., Q.B., X.E. and Z.M.; investigation, R.Z., Z.S., L.W., Y.A., Q.B., X.E., Z.M. and Z.W.; visualization, R.Z.; writing of manuscript, R.Z.; providing and processing vorticity data, Z.W.; review and editing, R.Z., Z.S., Y.A., Q.B., X.E. and L.W. All authors have read and agreed to the published version of the manuscript.

Funding

This research was jointly funded by the National Natural Science Foundation of China (Grant No. 42101101, 32160320), the National Key Research and Development Program of China (Grant No. 2021YFD2200404), and the Hainan Province Science and Technology Innovation Talent Platform Project (Grant No. NHXXRCXM202303).

Data Availability Statement

All data are available through the website provided, except for data from the Danzhou Rubber Plantation Flux Observation Site.

Acknowledgments

The authors are thankful to all the staff who maintained and collected flux data from the Danzhou Rubber Plantation Flux Observation Site in this study. They would also like to thank the developers of the SEIB-DGVM and all the participants who contributed to this research. Finally, the authors would like to place on record their thanks to the foundation programs that provided support for this study.

Conflicts of Interest

The authors declare no conflicts of interest.

References

  1. Mishra, A.K.; Singh, V.P. A review of drought concepts. J. Hydrol. 2010, 391, 202–216. [Google Scholar] [CrossRef]
  2. Fensham, R.J.; Fairfax, R.J.; Ward, D.P. Drought-induced tree death in savanna. Glob. Change Biol. 2009, 15, 380–387. [Google Scholar] [CrossRef]
  3. Nanzad, L.; Zhang, J.; Tuvdendorj, B.; Yang, S.; Rinzin, S.; Prodhan, F.A.; Sharma, T.P.P. Assessment of drought impact on net primary productivity in the terrestrial ecosystems of Mongolia from 2003 to 2018. Remote Sens. 2021, 13, 2522. [Google Scholar] [CrossRef]
  4. Xu, C.; McDowell, N.G.; Fisher, R.A.; Wei, L.; Sevanto, S.; Christoffersen, B.O.; Weng, E.; Middleton, R.S. Increasing impacts of extreme droughts on vegetation productivity under climate change. Nat. Clim. Change 2019, 9, 948–953. [Google Scholar] [CrossRef]
  5. van der Molen, M.K.; Dolman, A.J.; Ciais, P.; Eglin, T.; Gobron, N.; Law, B.E.; Meir, P.; Peters, W.; Phillips, O.L.; Reichstein, M.; et al. Drought and ecosystem carbon cycling. Agric. For. Meteorol. 2011, 151, 765–773. [Google Scholar] [CrossRef]
  6. Chiang, F.; Mazdiyasni, O.; AghaKouchak, A. Evidence of anthropogenic impacts on global drought frequency, duration, and intensity. Nat. Commun. 2021, 12, 2754. [Google Scholar] [CrossRef] [PubMed]
  7. Murray, V.; Ebi, K.L. IPCC special report on managing the risks of extreme events and disasters to advance climate change adaptation (SREX). J. Epidemiol. Community Health 2012, 66, 759–760. [Google Scholar] [CrossRef]
  8. Masson-Delmotte, V.P.; Zhai, P.; Pirani, S.L.; Connors, C.; Péan, S.; Berger, N.; Caud, Y.; Chen, L.; Goldfarb, M.I.; Gomis, M.; et al. IPCC, 2021: Summary for policymakers. In Climate Change 2021: The Physical Science Basis; Contribution of Working Group I to the Sixth Assessment Report of the Intergovernmental Panel on Climate Change; Cambridge University Press: Cambridge, UK; New York, NY, USA, 2021. [Google Scholar]
  9. Nemani, R.R.; Keeling, C.D.; Hashimoto, H.; Jolly, W.M.; Piper, S.C.; Tucker, C.J.; Myneni, R.B.; Running, S.W. Climate-driven increases in global terrestrial net primary production from 1982 to 1999. Science 2003, 300, 1560–1563. [Google Scholar] [CrossRef]
  10. Xu, X.; Piao, S.; Wang, X.; Chen, A.; Ciais, P.; Myneni, R.B. Spatio-temporal patterns of the area experiencing negative vegetation growth anomalies in China over the last three decades. Environ. Res. Lett. 2012, 7, 035701. [Google Scholar] [CrossRef]
  11. Aragão LE, O.; Malhi, Y.; Roman-Cuesta, R.M.; Saatchi, S.; Anderson, L.O.; Shimabukuro, Y.E. Spatial patterns and fire response of recent Amazonian droughts. Geophys. Res. Lett. 2007, 34. [Google Scholar] [CrossRef]
  12. Lewis, S.L.; Brando, P.M.; Phillips, O.L.; Van Der Heijden, G.M.; Nepstad, D. The 2010 amazon drought. Science 2011, 331, 554. [Google Scholar] [CrossRef] [PubMed]
  13. Brienen, R.J.; Phillips, O.L.; Feldpausch, T.R.; Gloor, E.; Baker, T.R.; Lloyd, J.; Lopez-Gonzalez, G.; Monteagudo-Mendoza, A.; Malhi, Y.; Lewis, S.L.; et al. Long-term decline of the Amazon carbon sink. Nature 2015, 519, 344–348. [Google Scholar] [CrossRef] [PubMed]
  14. Baccini, A.; Walker, W.; Carvalho, L.; Farina, M.; Sulla-Menashe, D.; Houghton, R.A. Tropical forests are a net carbon source based on aboveground measurements of gain and loss. Science 2017, 358, 230–234. [Google Scholar] [CrossRef] [PubMed]
  15. Lu, J.; Yan, F. The Divergent Resistance and Resilience of Forest and Grassland Ecosystems to Extreme Summer Drought in Carbon Sequestration. Land 2023, 12, 1672. [Google Scholar] [CrossRef]
  16. Saleska, S.R.; Didan, K.; Huete, A.R.; Da Rocha, H.R. Amazon forests green-up during 2005 drought. Science 2007, 318, 612. [Google Scholar] [CrossRef] [PubMed]
  17. Gatti, L.V.; Gloor, M.; Miller, J.B.; Doughty, C.E.; Malhi, Y.; Domingues, L.G.; Basso, L.S.; Martinewski, A.; Correia, C.S.C.; Borges, V.F.; et al. Drought sensitivity of Amazonian carbon balance revealed by atmospheric measurements. Nature 2014, 506, 76–80. [Google Scholar] [CrossRef] [PubMed]
  18. Phillips, O.L.; Aragão, L.E.; Lewis, S.L.; Fisher, J.B.; Lloyd, J.; López-González, G.; Malhi, Y.; Monteagudo, A.; Peacock, J.; Quesada, C.A.; et al. Drought sensitivity of the Amazon rainforest. Science 2009, 323, 1344–1347. [Google Scholar] [CrossRef]
  19. Saleska, S.R.; Wu, J.; Guan, K.; Araujo, A.C.; Huete, A.; Nobre, A.D.; Restrepo-Coupe, N. Dry-season greening of Amazon forests. Nature 2016, 531, E4–E5. [Google Scholar] [CrossRef]
  20. Ju, J.; Roy, D.P. The availability of cloud-free Landsat ETM+ data over the conterminous United States and globally. Remote Sens. Environ. 2008, 112, 1196–1211. [Google Scholar] [CrossRef]
  21. Gao, F.; Zhang, S.; Yu, R.; Zhao, Y.; Chen, Y.; Zhang, Y. Agricultural Drought Risk Assessment Based on a Comprehensive Model Using Geospatial Techniques in Songnen Plain, China. Land 2023, 12, 1184. [Google Scholar] [CrossRef]
  22. Liu, J.; Wu, Z.; Yang, S.; Yang, C. Sensitivity Analysis of Biome-BGC for Gross Primary Production of a Rubber Plantation Ecosystem: A Case Study of Hainan Island, China. Int. J. Environ. Res. Public Health 2022, 19, 14068. [Google Scholar] [CrossRef]
  23. Giambelluca, T.W.; Mudd, R.G.; Liu, W.; Ziegler, A.D.; Kobayashi, N.; Kumagai, T.O.; Miyazawa, Y.; Lim, T.K.; Huang, M.; Fox, J. Evapotranspiration of rubber (Hevea brasiliensis) cultivated at two plantation sites in S outheast A sia. Water Resour. Res. 2016, 52, 660–679. [Google Scholar] [CrossRef]
  24. Wang, X.; Blanken, P.D.; Kasemsap, P.; Petchprayoon, P.; Thaler, P.; Nouvellon, Y.; Gay, F.; Chidthaisong, A.; Sanwangsri, M.; Chayawat, C.; et al. Carbon and water cycling in two rubber plantations and a natural forest in Mainland Southeast Asia. J. Geophys. Res. Biogeosci. 2022, 127, e2022JG006840. [Google Scholar] [CrossRef]
  25. Ali, A.A.; Fan, Y.; Corre, M.D.; Kotowska, M.M.; Preuss-Hassler, E.; Cahyo, A.N.; Moyano, F.E.; Stiegler, C.; Röll, A.; Meijide, A.; et al. Implementing a New Rubber Plant Functional Type in the Community Land Model (CLM5) Improves Accuracy of Carbon and Water Flux Estimation. Land 2022, 11, 183. [Google Scholar] [CrossRef]
  26. Grace, J. Understanding and managing the global carbon cycle. J. Ecol. 2004, 92, 189–202. [Google Scholar] [CrossRef]
  27. Pan, Y.; Birdsey, R.A.; Fang, J.; Houghton, R.; Kauppi, P.E.; Kurz, W.A.; Phillips, O.L.; Shvidenko, A.; Lewis, S.L.; Canadell, J.G.; et al. A large and persistent carbon sink in the world’s forests. Science 2011, 333, 988–993. [Google Scholar] [CrossRef]
  28. Nottingham, A.T.; Meir, P.; Velasquez, E.; Turner, B.L. Soil carbon loss by experimental warming in a tropical forest. Nature 2020, 584, 234–237. [Google Scholar] [CrossRef]
  29. Townsend, A.R.; Cleveland, C.C.; Houlton, B.Z.; Alden, C.B.; White, J.W. Multi-element regulation of the tropical forest carbon cycle. Front. Ecol. Environ. 2011, 9, 9–17. [Google Scholar] [CrossRef]
  30. Lan, G.; Wu, Z.; Chen, B.; Xie, G. Species diversity in a naturally managed rubber plantation in Hainan Island, South China. Trop. Conserv. Sci. 2017, 10, 1940082917712427. [Google Scholar] [CrossRef]
  31. Wu, Z.; Guan, L.; Chen, B.; Yang, C.; Lan, G.; Xie, G.; Zhou, Z. Components of soil respiration and its monthly dynamics in rubber plantation ecosystems. In Proceedings of the 2013 Fourth International Conference on Digital Manufacturing & Automation, Qingdao, China, 29–30 June 2013; IEEE: New York, NY, USA, 2013; pp. 361–369. [Google Scholar]
  32. Yang, S.; Wu, Z.; Yang, C.; Song, B.; Liu, J.; Chen, B.; Lan, G.; Sun, R.; Zhang, J. Responses of carbon exchange characteristics to meteorological factors, phenology, and extreme events in a rubber plantation of Danzhou, Hainan: Evidence based on multi-year data. Front. Ecol. Evol. 2023, 11, 1194147. [Google Scholar] [CrossRef]
  33. Chandrashekar, T.R.; Marattukalam, J.G.; Nazeer, M.A. Growth reaction of Hevea brasiliensis to heat and drought stress under dry subhumid climatic conditions. Indian J. Nat. Rubber Res. 1996, 9, 1996. [Google Scholar]
  34. Kumagai, T.O.; Mudd, R.G.; Miyazawa, Y.; Liu, W.; Giambelluca, T.W.; Kobayashi, N.; Lim, T.K.; Jomura, M.; Matsumoto, K.; Huang, M. Simulation of canopy CO2/H2O fluxes for a rubber (Hevea brasiliensis) plantation in central Cambodia: The effect of the regular spacing of planted trees. Ecol. Model. 2013, 265, 124–135. [Google Scholar] [CrossRef]
  35. Yang, X.; Blagodatsky, S.; Marohn, C.; Liu, H.; Golbon, R.; Xu, J.; Cadisch, G. Climbing the mountain fast but smart: Modelling rubber tree growth and latex yield under climate change. For. Ecol. Manag. 2019, 439, 55–69. [Google Scholar] [CrossRef]
  36. Nizami, S.M.; Yiping, Z.; Liqing, S.; Zhao, W.; Zhang, X. Managing carbon sinks in rubber (Hevea brasilensis) plantation by changing rotation length in SW China. PLoS ONE 2014, 9, e115234. [Google Scholar] [CrossRef]
  37. Cui, W.; Xiong, Q.; Zheng, Y.; Zhao, J.; Nie, T.; Wu, L.; Sun, Z. A study on the vulnerability of the gross primary production of rubber plantations to regional short-term flash drought over Hainan Island. Forests 2022, 13, 893. [Google Scholar] [CrossRef]
  38. Sopharat, J.; Sdoodee, S.; Tanavud, C.; Gay, F.; Thaler, P. A simple water balance model of rubber tree plantations under different evaporative demand regimes. Adv. Mater. Res. 2014, 844, 20–23. [Google Scholar] [CrossRef]
  39. Wang, L.F. Physiological and molecular responses to drought stress in rubber tree (Hevea brasiliensis Muell. Arg.). Plant Physiol. Biochem. 2014, 83, 243–249. [Google Scholar] [CrossRef]
  40. Tong, S.; Wang, W.; Chen, J.; Xu, C.Y.; Sato, H.; Wang, G. Impact of changes in climate and CO2 on the carbon storage potential of vegetation under limited water availability using SEIB-DGVM version 3.02. Geosci. Model Dev. 2022, 15, 7075–7098. [Google Scholar] [CrossRef]
  41. Arakida, H.; Kotsuki, S.; Otsuka, S.; Sawada, Y.; Miyoshi, T. Regional-scale data assimilation with the Spatially Explicit Individual-based Dynamic Global Vegetation Model (SEIB-DGVM) over Siberia. Prog. Earth Planet. Sci. 2021, 8, 52. [Google Scholar] [CrossRef]
  42. Sato, H. Simulation of the vegetation structure and function in a Malaysian tropical rain forest using the individual-based dynamic vegetation model SEIB-DGVM. For. Ecol. Manag. 2009, 257, 2277–2286. [Google Scholar] [CrossRef]
  43. Wu, Z.; Xie, G.; Chen, B.; Yang, C.; Zhou, Z.; Tao, Z. Fluxes footprint and source area of rubber plantation. Agric. Sci. Technol.-Hunan 2011, 12, 1937–1942. [Google Scholar]
  44. Sato, H.; Itoh, A.; Kohyama, T. SEIB–DGVM: A new Dynamic Global Vegetation Model using a spatially explicit individual-based approach. Ecol. Model. 2007, 200, 279–307. [Google Scholar] [CrossRef]
  45. Vicente-Serrano, S.M.; Beguería, S.; López-Moreno, J.I. A multiscalar drought index sensitive to global warming: The standardized precipitation evapotranspiration index. J. Clim. 2010, 23, 1696–1718. [Google Scholar] [CrossRef]
  46. Crausbay, S.D.; Ramirez, A.R.; Carter, S.L.; Cross, M.S.; Hall, K.R.; Bathke, D.J.; Betancourt, J.L.; Colt, S.; Cravens, A.E.; Dalton, M.S.; et al. Defining ecological drought for the twenty-first century. Bull. Am. Meteorol. Soc. 2017, 98, 2543–2550. [Google Scholar] [CrossRef]
  47. Dong, C.; MacDonald, G.; Okin, G.S.; Gillespie, T.W. Quantifying drought sensitivity of Mediterranean climate vegetation to recent warming: A case study in Southern California. Remote Sens. 2019, 11, 2902. [Google Scholar] [CrossRef]
  48. Meza, I.; Hagenlocher, M.; Naumann, G.; Vogt, J.; Frischen, J. Drought Vulnerability Indicators for Global-Scale Drought Risk Assessments; Publications Office of the European Union: Luxembourg, 2019. [Google Scholar]
  49. Xiong, Q.; Sun, Z.; Cui, W.; Lei, J.; Fu, X.; Wu, L. A Study on Sensitivities of Tropical Forest GPP Responding to the Characteristics of Drought—A Case Study in Xishuangbanna, China. Water 2022, 14, 157. [Google Scholar] [CrossRef]
  50. Chang, T.J.; Kleopa, X.A. A proposed method for drought monitoring 1. JAWRA J. Am. Water Resour. Assoc. 1991, 27, 275–281. [Google Scholar] [CrossRef]
  51. Heim, R.R., Jr. A review of twentieth-century drought indices used in the United States. Bull. Am. Meteorol. Soc. 2002, 83, 1149–1166. [Google Scholar] [CrossRef]
  52. Hu, Q.; Willson, G.D. Effects of temperature anomalies on the Palmer Drought Severity Index in the central United States. Int. J. Climatol. A J. R. Meteorol. Soc. 2000, 20, 1899–1911. [Google Scholar] [CrossRef]
  53. Abramopoulos, F.; Rosenzweig, C.; Choudhury, B. Improved ground hydrology calculations for global climate models (GCMs): Soil water movement and evapotranspiration. J. Clim. 1988, 1, 921–941. [Google Scholar] [CrossRef]
  54. Rebetez, M.; Mayer, H.; Dupont, O.; Schindler, D.; Gartner, K.; Kropp, J.P.; Menzel, A. Heat and drought 2003 in Europe: A climate synthesis. Ann. For. Sci. 2006, 63, 569–577. [Google Scholar] [CrossRef]
  55. Munson, S.M.; Bradford, J.B.; Hultine, K.R. An integrative ecological drought framework to span plant stress to ecosystem transformation. Ecosystems 2021, 24, 739–754. [Google Scholar] [CrossRef]
  56. Doughty, C.E.; Malhi, Y.; Araujo-Murakami, A.; Metcalfe, D.B.; Silva-Espejo, J.E.; Arroyo, L.; Heredia, J.P.; Pardo-Toledo, E.; Mendizabal, L.M.; Rojas-Landivar, V.D.; et al. Allocation trade-offs dominate the response of tropical forest growth to seasonal and interannual drought. Ecology 2014, 95, 2192–2201. [Google Scholar] [CrossRef]
  57. Yang, S.; Zhang, J.; Han, J.; Wang, J.; Zhang, S.; Bai, Y.; Cao, D.; Xun, L.; Zheng, M.; Chen, H.; et al. Evaluating global ecosystem water use efficiency response to drought based on multi-model analysis. Sci. Total Environ. 2021, 778, 146356. [Google Scholar] [CrossRef]
  58. Dubovyk, O.; Landmann, T.; Dietz, A.; Menz, G. Quantifying the impacts of environmental factors on vegetation dynamics over climatic and management gradients of Central Asia. Remote Sens. 2016, 8, 600. [Google Scholar] [CrossRef]
  59. Schärer, M.L.; Lüscher, A.; Kahmen, A. Post-drought compensatory growth in perennial grasslands is determined by legacy effects of the soil and not by plants. New Phytol. 2023, 240, 2265–2275. [Google Scholar] [CrossRef]
  60. Zhang, Y.; Liu, G.; Xu, S.; Dai, J.; Li, W.; Li, Z.; Zhang, D.; Cui, Z.; Li, C.; Dong, H. Nitric oxide reduces the yield loss of waterlogged cotton by enhancing post-stress compensatory growth. Field Crops Res. 2022, 283, 108524. [Google Scholar] [CrossRef]
  61. Shi, F.; Wu, X.; Li, X.; Ciais, P.; Liu, H.; Yue, C.; Yang, Y.; Zhang, S.; Peng, S.; Yin, Y.; et al. Seasonal compensation implied no weakening of the land carbon sink in the Northern Hemisphere under the 2015/2016 El Niño. Sci. China Earth Sci. 2024, 67, 281–294. [Google Scholar] [CrossRef]
  62. Gupta, A.; Rico-Medina, A.; Caño-Delgado, A.I. The physiology of plant responses to drought. Science 2020, 368, 266–269. [Google Scholar] [CrossRef]
  63. Wang, Y.; Hollingsworth, P.M.; Zhai, D.; West, C.D.; Green, J.M.; Chen, H.; Hurni, K.; Su, Y.; Warren-Thomas, E.; Xu, J.; et al. High-resolution maps show that rubber causes substantial deforestation. Nature 2023, 623, 340–346. [Google Scholar] [CrossRef]
  64. Matusick, G.; Ruthrof, K.X.; Kala, J.; Brouwers, N.C.; Breshears, D.D.; Hardy, G.E.S.J. Chronic historical drought legacy exacerbates tree mortality and crown dieback during acute heatwave-compounded drought. Environ. Res. Lett. 2018, 13, 095002. [Google Scholar] [CrossRef]
  65. Tschumi, E.; Lienert, S.; van der Wiel, K.; Joos, F.; Zscheischler, J. The effects of varying drought-heat signatures on terrestrial carbon dynamics and vegetation composition. Biogeosci. Discuss. 2021, 2021, 1–19. [Google Scholar] [CrossRef]
Figure 1. SEIB-DGVM localization flowchart.
Land 13 00745 g001
Figure 2. Multi-drought scenario experimental design flowchart.
Land 13 00745 g002
Figure 3. SEIB-DGVM localization results. (a) Timeseries of GPP_Est and GPP_Obs from 2010 to 2015; (b) scatter plot of GPP_Est and GPP_Obs from 2010 to 2015.
Land 13 00745 g003
Figure 4. Under the Premin and Tmin scenarios, intensity = −0.75, initiation season in April (a); August (e); December (i). Intensity = −1.25, initiation season in April (b); August (f); December (j). Intensity = −1.75, initiation season in April (c); August (g); December (k). Intensity = −2, initiation season in April (d); August (h); December (l). The sensitivity of GPP varies with the duration of the drought and the SPEI time scale.
Land 13 00745 g004
Figure 5. Under the Tmax and Premax scenarios, intensity = −0.75, initiation season in April (a); August (e); December (i). Intensity = −1.25, initiation season in April (b); August (f); December (j). Intensity = −1.75, initiation season in April (c); August (g); December (k). Intensity = −2, initiation season in April (d); August (h); December (l). The sensitivity of GPP varies with the duration of the drought and the SPEI time scale.
Land 13 00745 g005
Figure 6. Under the Premin and Tmin scenarios, intensity = −0.75, initiation season in April (a); August (e); December (i). Intensity = −1.25, initiation season in April (b); August (f); December (j). Intensity = −1.75, initiation season in April (c); August (g); December (k). Intensity = −2, initiation season in April (d); August (h); December (l). The vulnerability of GPP varies with the duration of the drought and the SPEI time scale.
Land 13 00745 g006
Figure 7. Under the Tmax and Premax scenarios, intensity = −0.75, initiation season in April (a); August (e); December (i). Intensity = −1.25, initiation season in April (b); August (f); December (j). Intensity = −1.75, initiation season in April (c); August (g); December (k). Intensity = −2, initiation season in April (d); August (h); December (l). The vulnerability of GPP varies with the duration of the drought and SPEI time scale.
Land 13 00745 g007
Disclaimer/Publisher’s Note: The statements, opinions and data contained in all publications are solely those of the individual author(s) and contributor(s) and not of MDPI and/or the editor(s). MDPI and/or the editor(s) disclaim responsibility for any injury to people or property resulting from any ideas, methods, instructions or products referred to in the content.