
The Spatial Pattern of Polluting Enterprises and the Effects of Local Regulation in the Guanzhong Plain Urban Agglomeration


Abstract
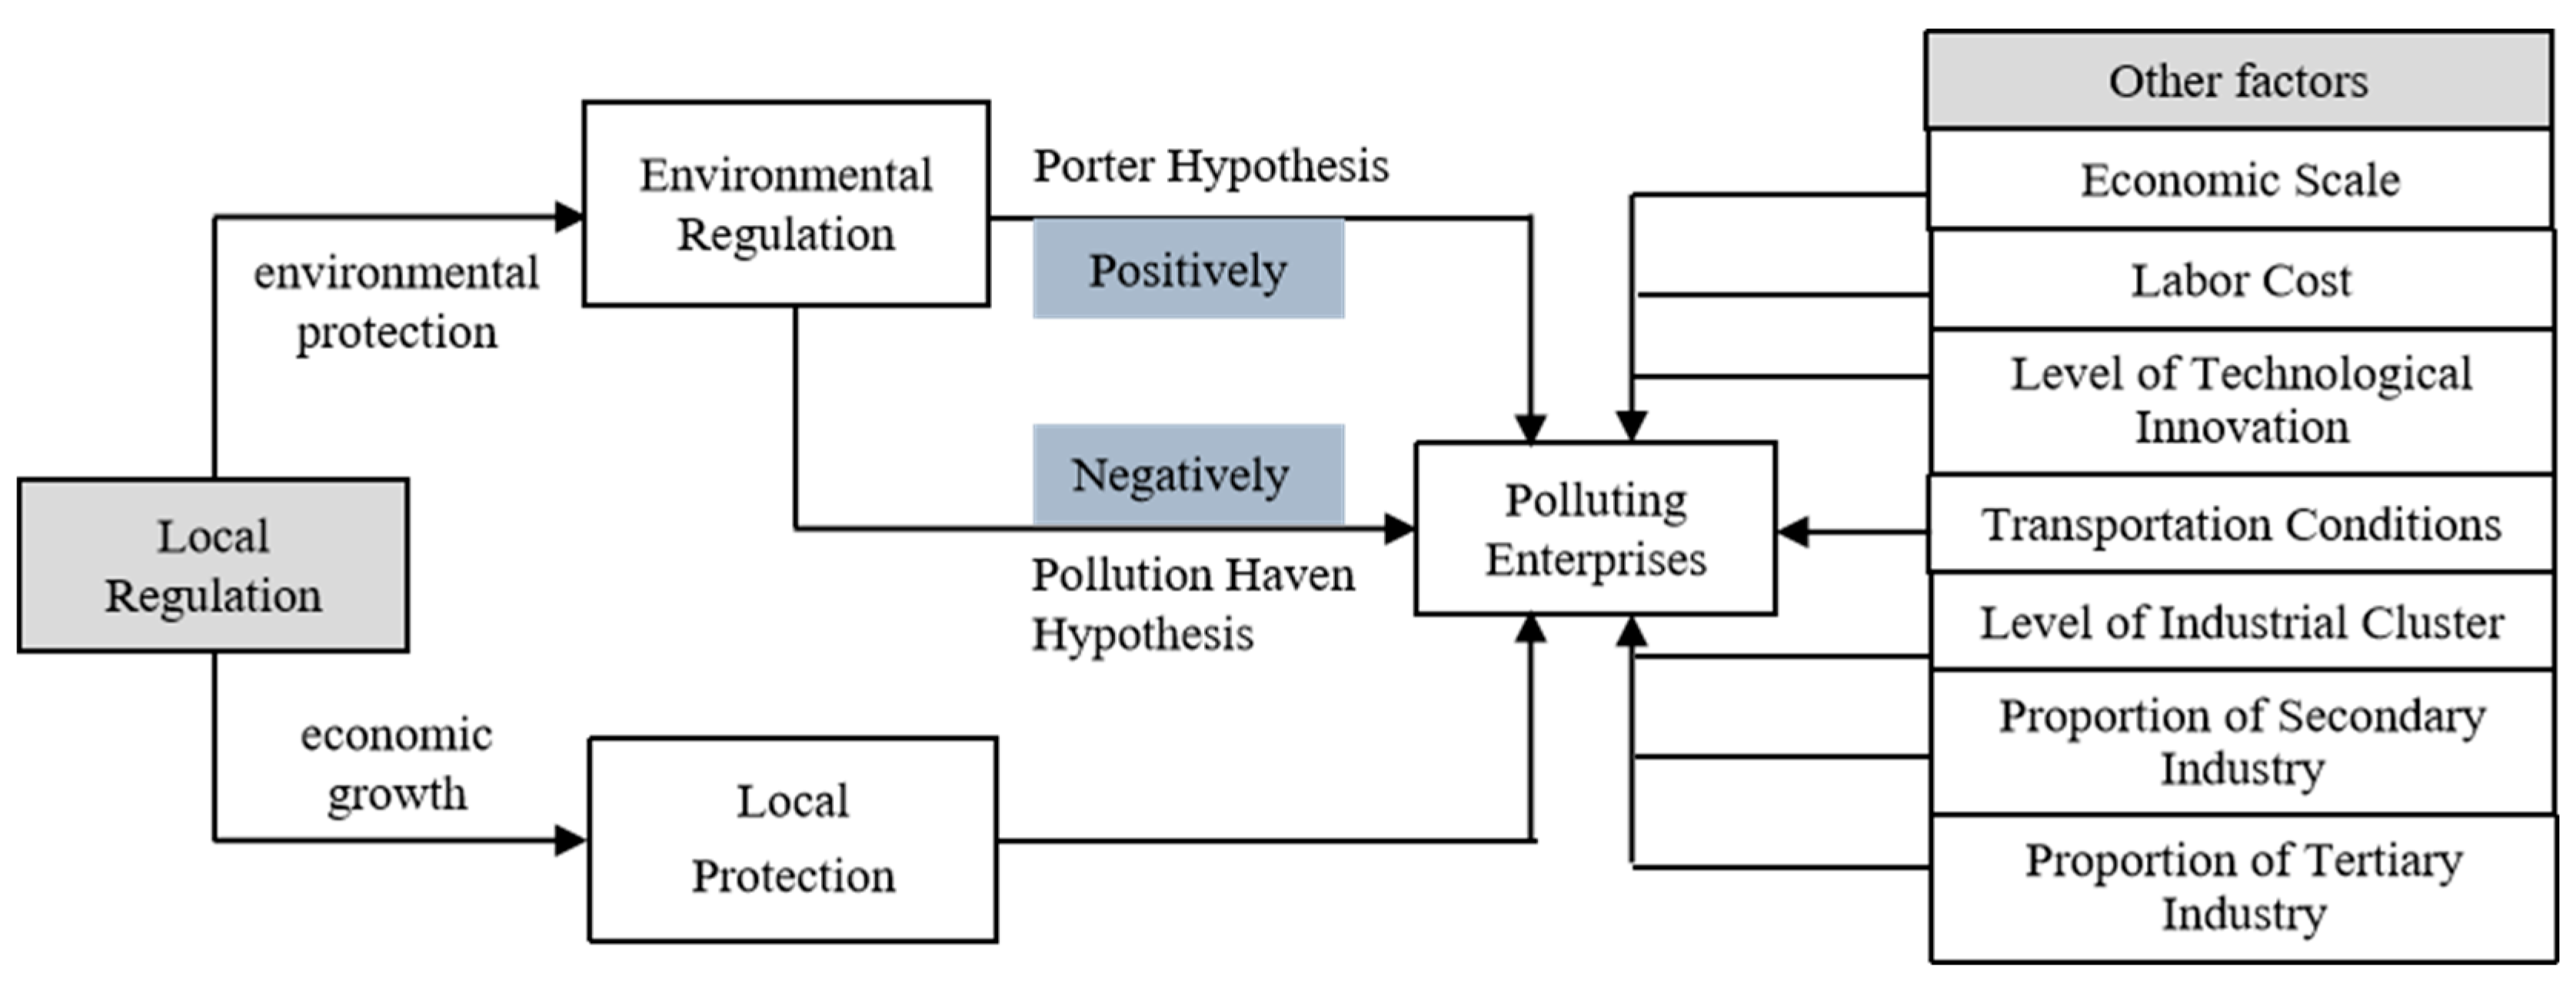
1. Introduction
2. Research Data and Methodology
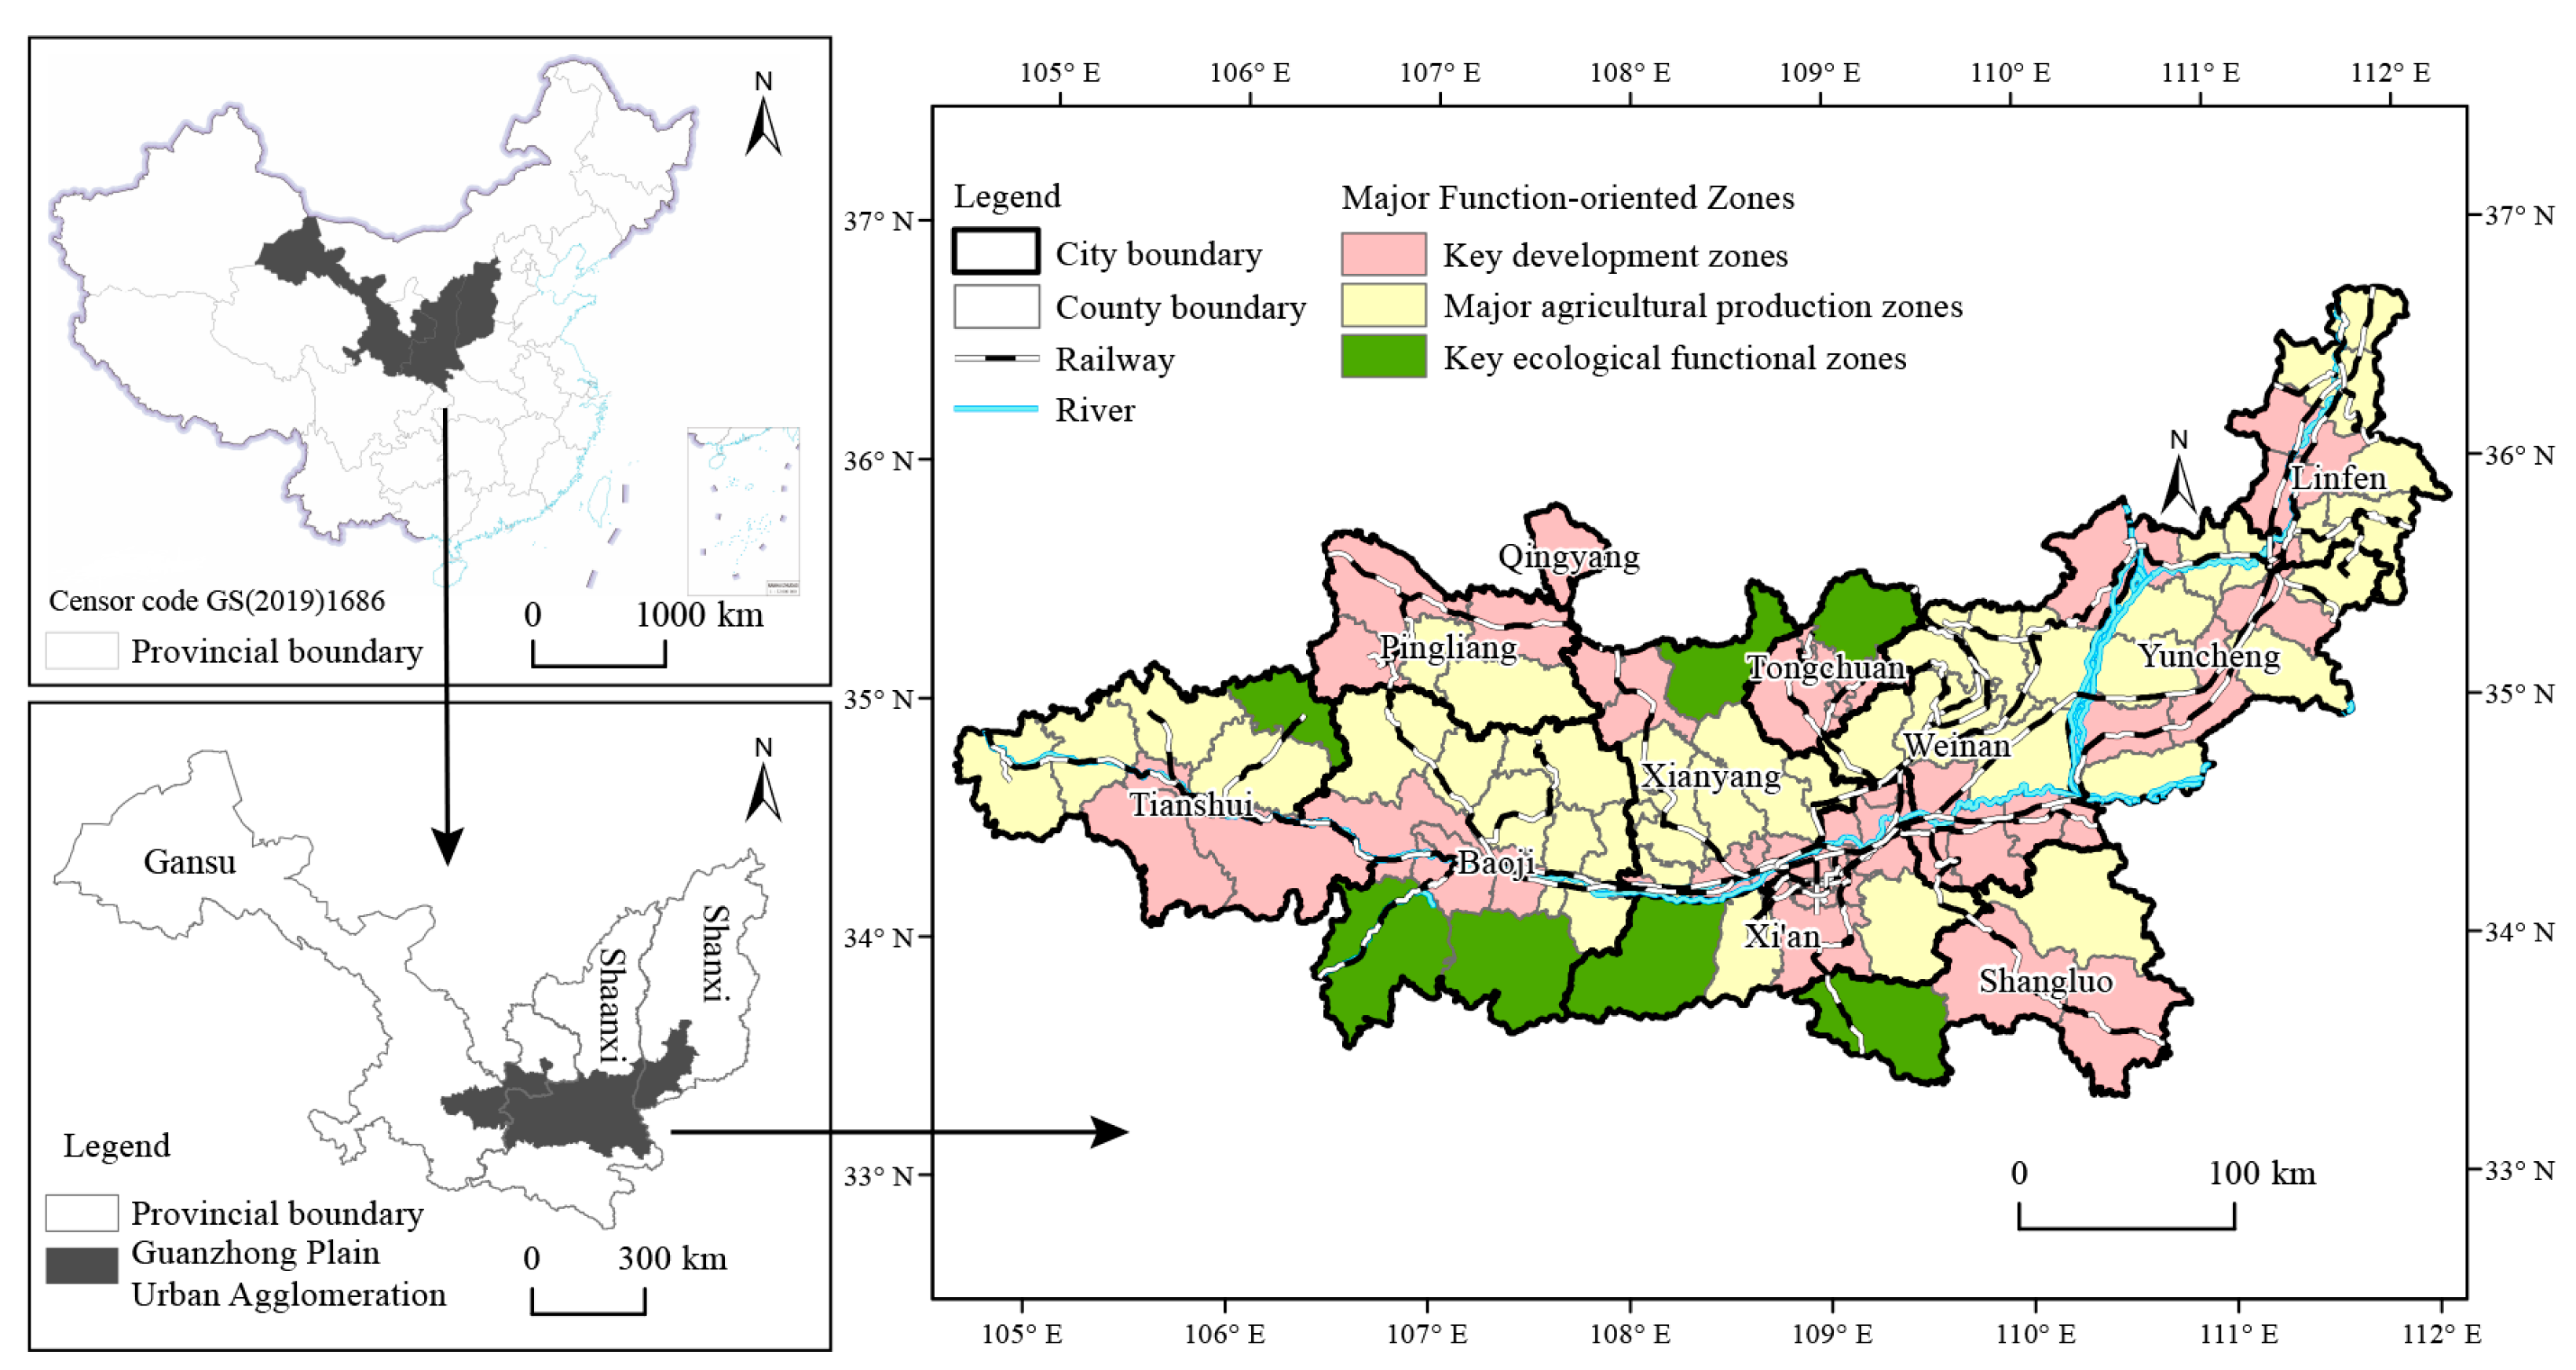
2.1. Study Area
2.2. Data Source and Processing
2.3. Research Method
2.3.1. Kernel Density Estimation
2.3.2. Geographically and Temporally Weighted Regression
2.4. Variable Selection
3. Evolution of the Spatiotemporal Pattern of PEs in the GPUA
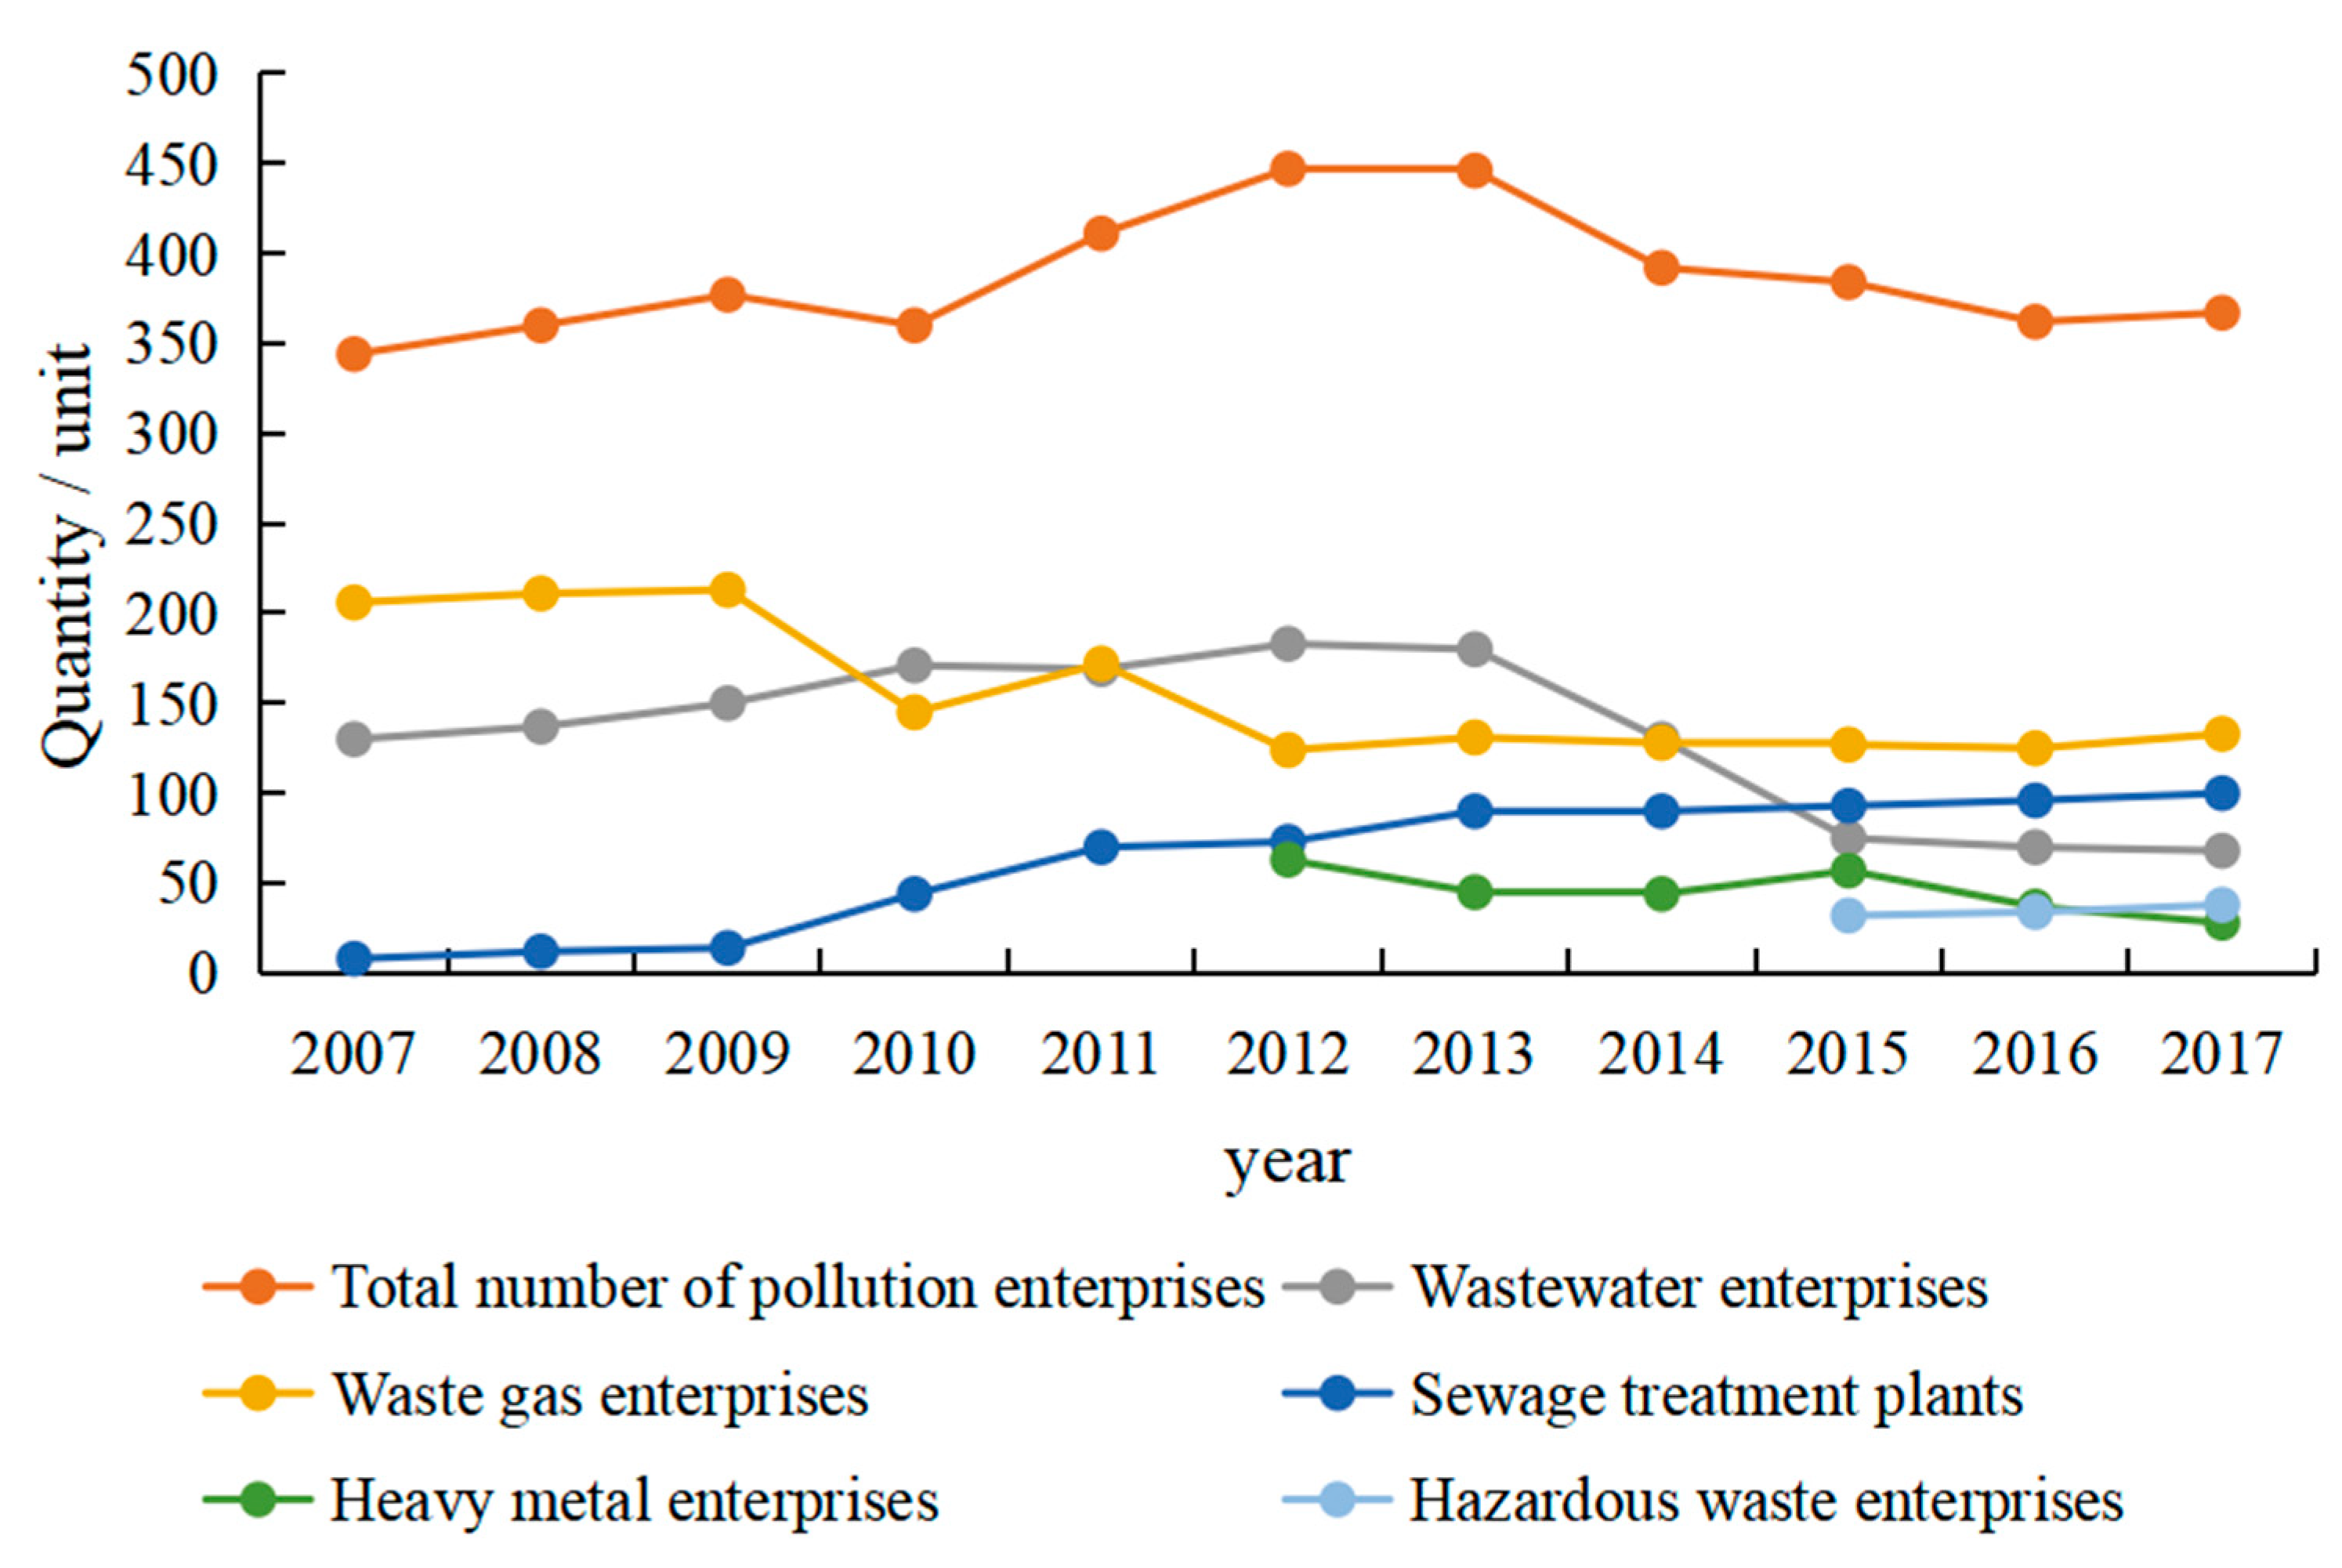
3.1. Temporal Changes in the Number of PEs
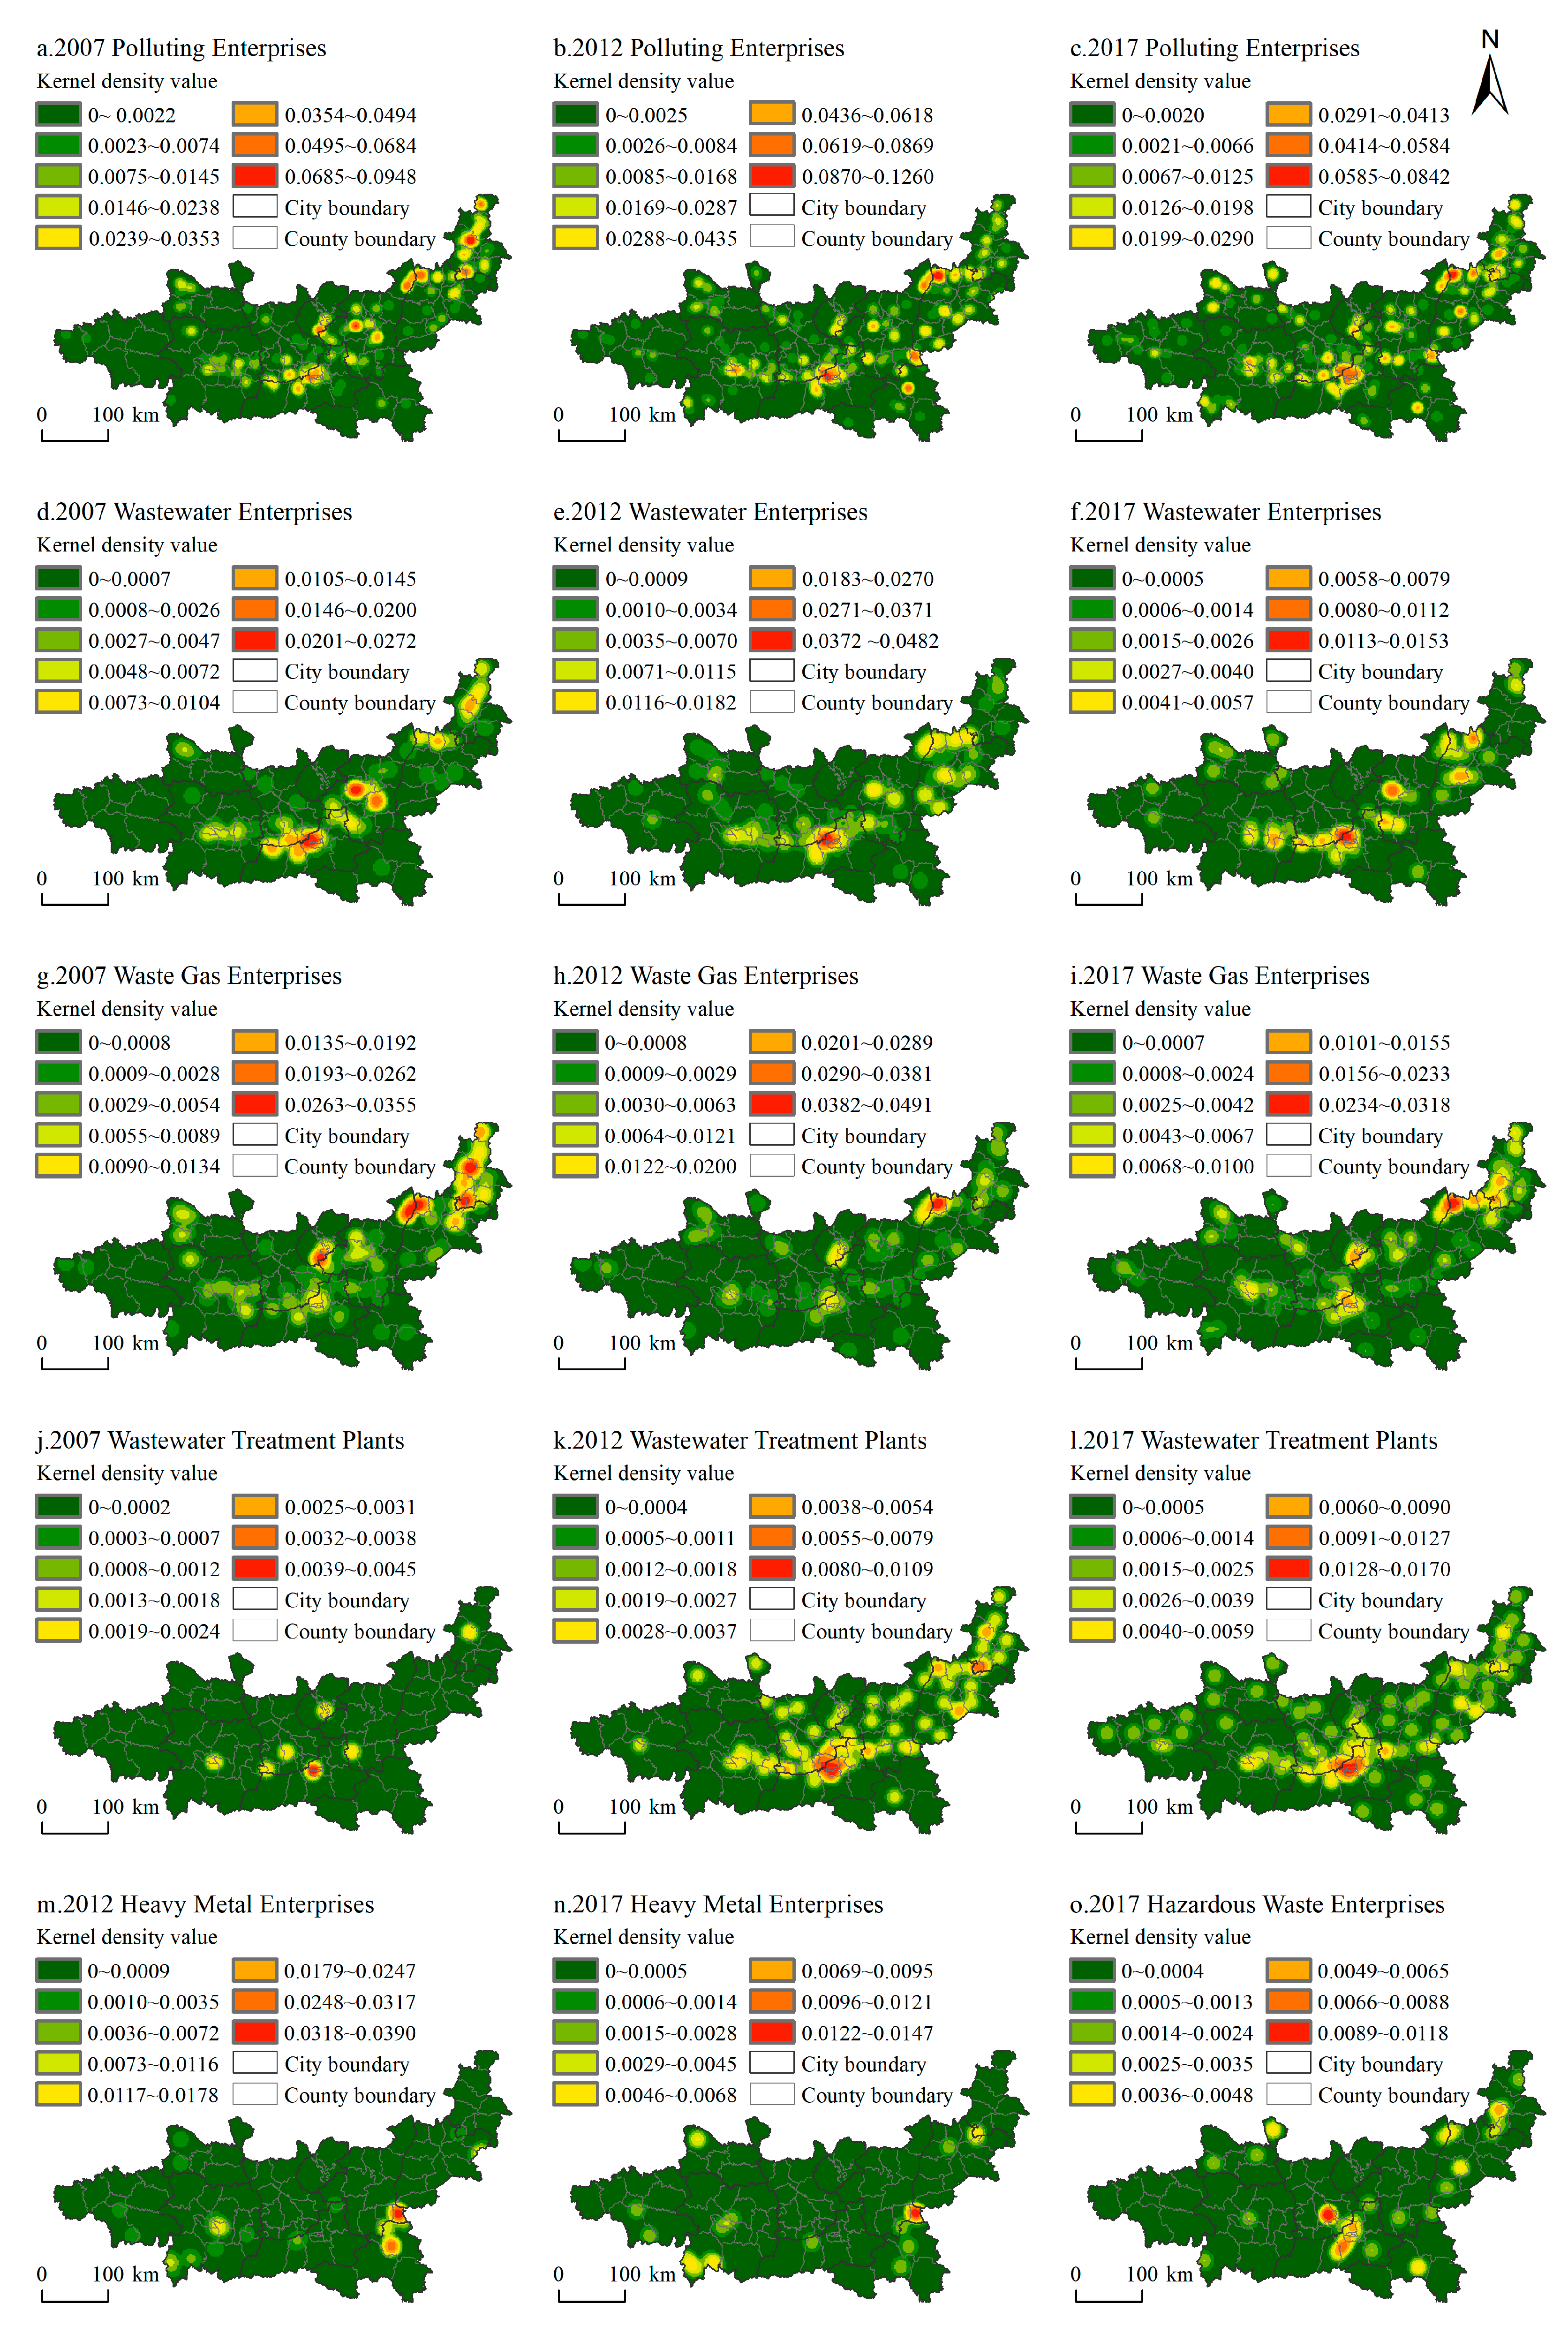
3.2. Spatial Agglomeration Characteristics Analysis of PEs
4. The Local Regulatory Effect on the Distribution Pattern of PEs
4.1. Analysis of the Results of the Traditional Regression Model
4.2. Analysis of the GTWR Model Results
4.3. Robustness Test
5. Discussion
5.1. Summary of Findings and Discussion
5.2. Policy Recommendations
5.3. Limitation and Prospects
6. Conclusions
Author Contributions
Funding
Data Availability Statement
Conflicts of Interest
References
- Ma, B.; Dang, X.; Yuan, S.; Xue, D.; Song, Y. Location selection and spatial justice of polluting enterprises in underdeveloped areas. Acta Geogr. Sin. 2022, 77, 1009–1027. [Google Scholar] [CrossRef]
- Baek, J.; Choi, Y. Does Foreign Direct Investment Harm the Environment in Developing Countries? Dynamic Panel Analysis of Latin American Countries. Economies 2017, 5, 39. [Google Scholar] [CrossRef]
- Ibrahim, M.H.; Rizvi, S.A.R. Emissions and Trade in Southeast and East Asian Countries: A Panel Co-Integration Analysis. Int. J. Climatol. Clim. Chang. Strategy Manag. 2015, 7, 460–475. [Google Scholar] [CrossRef]
- Frey, R.S. The Transfer of Core-Based Hazardous Production Processes to the Export Processing Zones of the Periphery: The Maquiladora Centers of Northern. Mex. J. World Syst. Res. 2003, 9, 317–354. [Google Scholar] [CrossRef]
- Binz, C.; Coenen, L.; Murphy, J.T.; Truffer, B. Geographies of Transition—From Topical Concerns to Theoretical Engagement: A Comment on the Transitions Research Agenda. Environ. Innov. Soc. Transit. 2020, 34, 1–3. [Google Scholar] [CrossRef]
- Sun, J.; Jiang, Z. Paths of high-quality development in China’s coastal areas. Acta Geogr. Sin. 2021, 76, 277–294. [Google Scholar] [CrossRef]
- Fu, S.; Ma, Z.; Ni, B.; Peng, J.; Zhang, L.; Fu, Q. Research on the Spatial Differences of Pollution-Intensive Industry Transfer under the Environmental Regulation in China. Ecol. Indic. 2021, 129, 107921. [Google Scholar] [CrossRef]
- Li, J.; Jiang, Q.; Cai, K.; Fu, J.; Liu, Y.; Chen, D.; Liu, X.; Dai, H.; Chen, Y.; Chen, Y. Uncovering the Spatially Uneven Synergistic Effects of China’s Enterprise-Level Industrial Water Pollutants Reduction. Resour. Conserv. Recycl. 2023, 190, 106811. [Google Scholar] [CrossRef]
- Lu, J.; Li, H. The Impact of Government Environmental Information Disclosure on Enterprise Location Choices: Heterogeneity and Threshold Effect Test. J. Clean. Prod. 2020, 277, 124055. [Google Scholar] [CrossRef]
- Salam, M.; Chishti, M.Z. Will ASEAN Countries Be a Potential Choice for the Export of Pollution Intensive Goods? Environ. Sci Pollut Res 2022, 29, 81308–81320. [Google Scholar] [CrossRef]
- Tanaka, K.; Managi, S. Industrial Agglomeration Effect for Energy Efficiency in Japanese Production Plants. Energy Policy 2021, 156, 112442. [Google Scholar] [CrossRef]
- Söderholm, P.; Bergquist, A.-K.; Pettersson, M.; Söderholm, K. The Political Economy of Industrial Pollution Control: Environmental Regulation in Swedish Industry for Five Decades. J. Environ. Plan. Manag. 2022, 65, 1056–1087. [Google Scholar] [CrossRef]
- Linares, P.; Batlle, C.; P’erez-Arriaga, I.J. Environmental Regulation. In Regulation of the Power Sector; Springer: London, UK, 2013; pp. 539–579. [Google Scholar]
- Zhang, G.; Liu, W.; Duan, H. Environmental Regulation Policies, Local Government Enforcement and Pollution-Intensive Industry Transfer in China. Comput. Ind. Eng. 2020, 148, 106748. [Google Scholar] [CrossRef]
- Walter, I.; Ugelow, J.L. Environmental Policies in Developing Countries. Ambio 1979, 8, 102–109. [Google Scholar] [CrossRef]
- Chung, S. Environmental Regulation and Foreign Direct Investment: Evidence from South Korea. J. Dev. Econ. 2014, 108, 222–236. [Google Scholar] [CrossRef]
- Dean, J.M.; Lovely, M.E.; Wang, H. Are Foreign Investors Attracted to Weak Environmental Regulations? Evaluating the Evidence from China. J. Dev. Econ. 2009, 90, 1–13. [Google Scholar] [CrossRef]
- Dou, J.; Han, X. How Does the Industry Mobility Affect Pollution Industry Transfer in China: Empirical Test on Pollution Haven Hypothesis and Porter Hypothesis. J. Clean. Prod. 2019, 217, 105–115. [Google Scholar] [CrossRef]
- Millimet, D.L.; Roy, J. Empirical Tests of the Pollution Haven Hypothesis When Environmental Regulation Is Endogenous. J. Appl. Econom. 2016, 31, 652–677. [Google Scholar] [CrossRef]
- Kahn, M.E. Domestic Pollution Havens: Evidence from Cancer Deaths in Border Counties. J. Urban Econ. 2004, 56, 51–69. [Google Scholar] [CrossRef]
- America’ Green Strategy|Scientific American. Available online: https://www.scientificamerican.com/article/essay-1991-04/ (accessed on 6 April 2024).
- Porter, M.E.; Linde, C.V.D. Linde Toward a New Conception of the Environment Competitiveness Relationship. J. Econ. Perspect. 1995, 9, 97–118. [Google Scholar] [CrossRef]
- Ramanathan, R.; He, Q.; Black, A.; Ghobadian, A.; Gallear, D. Environmental Regulations, Innovation and Firm Performance: A Revisit of the Porter Hypothesis. J. Clean. Prod. 2017, 155, 79–92. [Google Scholar] [CrossRef]
- Zhao, D.; Dou, Y.; Tong, L. Effect of Fiscal Decentralization and Dual Environmental Regulation on Green Poverty Reduction: The Case of China. Resour. Policy 2022, 79, 102990. [Google Scholar] [CrossRef]
- Tian, G.; Miao, C.; Hu, Z.; Miao, J. Environmental regulation, local protection and the spatial distribution of pollution-intensive industries in China. Acta Geogr. Sin. 2018, 73, 1954–1969. [Google Scholar] [CrossRef]
- Zhou, L. Governing China’s Local Officials: An Analysis of Promotion Tournament Model. Econ. Res. J. 2007, 7, 36–50. [Google Scholar]
- Bai, C.-E.; Du, Y.; Tao, Z.; Tong, S.Y. Local Protectionism and Regional Specialization: Evidence from China’s Industries. J. Int. Econ. 2004, 63, 397–417. [Google Scholar] [CrossRef]
- Zhang, Y. Local Protection and the Prisoner’s Dilemma of Economic Growth. J. World Econ. 2018, 41, 147–169. [Google Scholar] [CrossRef]
- Liu, W.; Shen, J.; Wei, Y.D. Spatial Restructuring of Pollution-Intensive Enterprises in Foshan China: Effects of the Changing Role of Environmental Regulation. J. Environ. Manag. 2023, 325, 116501. [Google Scholar] [CrossRef]
- Shen, J.; Wei, Y.D.; Yang, Z. The Impact of Environmental Regulations on the Location of Pollution-Intensive Industries in China. J. Clean. Prod. 2017, 148, 785–794. [Google Scholar] [CrossRef]
- Liu, N.; Sun, Y.; Tang, J.; Du, J. The environmental effects of pollution-intensive industry agglomeration based on the per-spective of spatial spillover. Acta Sci. Circumstantiae 2019, 39, 2442–2454. [Google Scholar] [CrossRef]
- Song, S. The Spatial Spillover of Environmental Regulation and Regional Transfer of Polluting Industry Investment in China. West Forum 2019, 29, 113–124. [Google Scholar] [CrossRef]
- Song, Y.; Xia, S.; Xue, D.; Luo, S.; Zhang, L.; Wang, D. Land Space Change Process and Its Eco-Environmental Effects in the Guanzhong Plain Urban Agglomeration of China. Land 2022, 11, 1547. [Google Scholar] [CrossRef]
- Song, Y.; Xia, S.; Xue, D.; Ma, B.; Liu, X. Spatio-Temporal Differences and Influencing Factors of Carbon Emission Equity in the Loess Plateau Based on Major Function-Oriented Zones. J. Geogr. Sci. 2023, 33, 1245–1270. [Google Scholar] [CrossRef]
- Song, G.; Feng, W. Analysis of the Spatial Layout and Influencing Factors of Pollution-Intensive Industries Based on Enterprise Dynamics. Ecol. Indic. 2023, 152, 110378. [Google Scholar] [CrossRef]
- Wu, B.; Li, R.; Huang, B. A Geographically and Temporally Weighted Autoregressive Model with Application to Housing Prices. Int. J. Geogr. Inf. Sci. 2014, 28, 1186–1204. [Google Scholar] [CrossRef]
- Zhang, M.; Yan, T.; Gao, W.; Xie, W.; Yu, Z. How Does Environmental Regulation Affect Real Green Technology Innovation and Strategic Green Technology Innovation? Sci. Total Environ. 2023, 872, 162221. [Google Scholar] [CrossRef] [PubMed]
- Liu, X.; Yang, J.; Xu, C.; Li, X.; Zhu, Q. Environmental Regulation Efficiency Analysis by Considering Regional Heterogeneity. Resour. Policy 2023, 83, 103735. [Google Scholar] [CrossRef]
- He, C.; Zhu, Y.; Zhu, S. Industrial Attributes, Provincial Characteristics and Industrial Agglomeration in China. Acta Geo-Graph. Sin. 2010, 65, 1218–1228. [Google Scholar]
- Chen, M.; Gui, Q.; Lu, M.; Chen, Z. How to Maintain China’s High Growth Rate?—An empirical study of economic opening and domestic market segmentation. China Econ. Q. 2008, 1, 125–150. [Google Scholar]
- Huang, J.; Li, K. Foreign Trade, Local Protectionism and Industrial Location in China. China Econ. Q. 2006, 2, 733–760. [Google Scholar] [CrossRef]
- Cheng, S.; Zhang, B.; Zhao, Y.; Peng, P.; Lu, F. Multiscale Spatiotemporal Variations of NOx Emissions from Heavy Duty Diesel Trucks in the Beijing-Tianjin-Hebei Region. Sci. Total Environ. 2023, 854, 158753. [Google Scholar] [CrossRef]
- Li, X.N.; Jiao, W.T.; Xiao, R.B.; Chen, W.P.; Chang, A.C. Soil Pollution and Site Remediation Policies in China: A Review. Environ. Rev. 2015, 23, 263–274. [Google Scholar] [CrossRef]
- Wu, H.; Li, Y.; Hao, Y.; Ren, S.; Zhang, P. Environmental Decentralization, Local Government Competition, and Regional Green Development: Evidence from China. Sci. Total Environ. 2020, 708, 135085. [Google Scholar] [CrossRef]
- Chen, Z.; Tang, J.; Wan, J.; Chen, Y. Promotion Incentives for Local Officials and the Expansion of Urban Construction Land in China: Using the Yangtze River Delta as a Case Study. Land Use Pol. 2017, 63, 214–225. [Google Scholar] [CrossRef]
- Li, X.; Liu, C.; Weng, X.; Zhou, L.-A. Target Setting in Tournaments: Theory and Evidence from China. Econ. J. 2019, 129, 2888–2915. [Google Scholar] [CrossRef]
- Bai, C.; Xie, D.; Zhang, Y. Industrial Land Transfer and Enterprise Pollution Emissions: Evidence from China. Econ. Anal. Policy 2024, 81, 181–194. [Google Scholar] [CrossRef]


| Variables | Code | Evaluation Method |
|---|---|---|
| Environmental Regulation | ER | emissions |
| Local Protection | LP | The proportion of county fiscal revenue to GDP |
| Economic Scale | ES | Gross domestic product (GDP) |
| Labor Cost | Labor | Regional average wage |
| Level of Technological Innovation | Inn | The proportion of R&D expenditure in county-level areas to the GPUA |
| Transportation Conditions | Tra | Road network density (Equation (5)) |
| Level of Industrial Cluster | Cluster | The proportion of industrial output value in county-level areas to the GPUA |
| Proportion of Secondary Industry | Sec | Proportion of secondary industry |
| Proportion of Tertiary Industry | Ter | Proportion of tertiary industry |
| Variables | Estimated Value | ||
|---|---|---|---|
| I | II | III | |
| ER | 0.156 ** | 0.027 | 0.160 |
| LP | 0.092 | 0.166 * | 0.157 * |
| Labor | −0.124 | −0.141 * | −0.121 |
| Inn | −0.340 ** | −0.378 *** | −0.431 *** |
| Cluster | 0.375 *** | 0.399 *** | 0.420 *** |
| Tra | 0.291 | 0.281 | 0.269 |
| ES | 1.181 ** | 0.212 * | 0.287 * |
| Sec | 0.345 ** | 0.316 ** | 0.299 ** |
| Ter | −0.087 | −0.097 ** | −0.114 ** |
| ER×LP | / | 0.194 ** | 0.165 * |
| ER× Inn | / | / | 0.010 |
| ER× Cluster | / | / | −0.186 |
| R2 | 0.252 | 0.266 | 0.281 |
| Adj R2 | 0.226 | 0.238 | 0.247 |
| Variables | Ⅰ | Ⅱ | Ⅲ | ||||
|---|---|---|---|---|---|---|---|
| Minimum Value | Maximum Value | Mean Value | Percentage of Positive Values (%) | Percentage of Negative Values (%) | Mean Value | Mean Value | |
| ER | 0.479 | 1.918 | 0.936 | 100 | 0 | 0.389 | 1.060 |
| LP | −0.220 | 1.022 | 0.487 | 90 | 10. | 0.902 | 0.909 |
| Labor | −0.770 | 0.743 | −0.385 | 9.259 | 90.741 | −0.455 | −0.409 |
| Inn | −4.487 | 7.031 | −1.734 | 2.963 | 97.037 | −1.934 | −2.263 |
| Cluster | −1.510 | 2.735 | 1.372 | 94.074 | 5.926 | 1.465 | 1.523 |
| Tra | −0.908 | 1.794 | 0.904 | 88.889 | 11.111 | 0.882 | 0.823 |
| ES | 0.894 | 4.454 | 1.400 | 100.000 | 0 | 1.512 | 2.186 |
| Sec | −0.841 | 2.011 | 0.933 | 88.148 | 11.852 | 0.847 | 0.769 |
| Ter | −1.140 | 2.294 | −0.270 | 24.444 | 75.556 | −0.317 | −0.399 |
| ER×LP | / | / | / | / | / | 1.594 | 1.411 |
| ER× Inn | / | / | / | / | / | / | 0.132 |
| ER× Cluster | / | / | / | / | / | / | −1.362 |
| R2 | 0.734 | 0.644 | 0.629 | ||||
| Adj R2 | 0.725 | 0.630 | 0.612 | ||||
| Major Function-Oriented Zones | Year | ER | LP | ER×LP | ER× Inn | ER× Cluster |
|---|---|---|---|---|---|---|
| Whole area | 2007 | 1.186 | 0.218 | 1.468 | −0.002 | −1.353 |
| 2012 | 0.968 | 0.552 | 1.641 | 0.195 | −1.306 | |
| 2017 | 0.654 | 0.693 | 1.673 | 0.2 | −1.427 | |
| Key development zones | 2007 | 1.19 | 0.163 | 1.593 | 0.047 | −1.22 |
| 2012 | 0.969 | 0.539 | 1.776 | 0.289 | −1.216 | |
| 2017 | 0.64 | 0.778 | 1.804 | 0.32 | −1.365 | |
| Major agricultural production zones | 2007 | 1.227 | 0.298 | 1.367 | 0.055 | −1.553 |
| 2012 | 0.986 | 0.578 | 1.525 | 0.087 | −1.441 | |
| 2017 | 0.684 | 0.726 | 1.56 | 0.055 | −1.534 | |
| Key ecological functional zones | 2007 | 0.923 | 0.076 | 1.318 | 0.069 | −0.986 |
| 2012 | 0.857 | 0.48 | 1.518 | 0.265 | −1.065 | |
| 2017 | 0.684 | 0.56 | 1.557 | 0.321 | −1.166 |
| Major Function-Oriented Zones | Year | ER | LP | ER×LP | ER× Inn | ER× Cluster |
|---|---|---|---|---|---|---|
| Whole area | 2007 | 0.569 | 0.218 | 2.056 | 0.789 | −1.599 |
| 2012 | 0.495 | 0.641 | 2.084 | 0.697 | −1.601 | |
| 2017 | 0.415 | 0.760 | 2.229 | 0.802 | −1.720 | |
| Key development zones | 2007 | 0.551 | 0.452 | 2.167 | 0.715 | −1.560 |
| 2012 | 0.467 | 0.634 | 2.192 | 0.645 | −1.581 | |
| 2017 | 0.385 | 0.754 | 2.326 | 0.760 | −1.697 | |
| Major agricultural production zones | 2007 | 0.451 | 0.495 | 1.943 | 0.445 | −1.708 |
| 2012 | 0.388 | 0.647 | 1.977 | 0.367 | −1.687 | |
| 2017 | 0.303 | 0.775 | 2.144 | 0.475 | −1.813 | |
| Key ecological functional zones | 2007 | 0.607 | 0.455 | 2.047 | 0.924 | −1.201 |
| 2012 | 0.543 | 0.652 | 2.062 | 0.806 | −1.219 | |
| 2017 | 0.465 | 0.716 | 2.138 | 0.901 | −1.311 |
Disclaimer/Publisher’s Note: The statements, opinions and data contained in all publications are solely those of the individual author(s) and contributor(s) and not of MDPI and/or the editor(s). MDPI and/or the editor(s) disclaim responsibility for any injury to people or property resulting from any ideas, methods, instructions or products referred to in the content. |
© 2024 by the authors. Licensee MDPI, Basel, Switzerland. This article is an open access article distributed under the terms and conditions of the Creative Commons Attribution (CC BY) license (https://creativecommons.org/licenses/by/4.0/).
Share and Cite
Dang, X.; Ma, B.; Xue, D.; Song, Y.; Robinson, G.M. The Spatial Pattern of Polluting Enterprises and the Effects of Local Regulation in the Guanzhong Plain Urban Agglomeration. Land 2024, 13, 733. https://doi.org/10.3390/land13060733
Dang X, Ma B, Xue D, Song Y, Robinson GM. The Spatial Pattern of Polluting Enterprises and the Effects of Local Regulation in the Guanzhong Plain Urban Agglomeration. Land. 2024; 13(6):733. https://doi.org/10.3390/land13060733
Chicago/Turabian StyleDang, Xing, Beibei Ma, Dongqian Xue, Yongyong Song, and Guy M. Robinson. 2024. "The Spatial Pattern of Polluting Enterprises and the Effects of Local Regulation in the Guanzhong Plain Urban Agglomeration" Land 13, no. 6: 733. https://doi.org/10.3390/land13060733
APA StyleDang, X., Ma, B., Xue, D., Song, Y., & Robinson, G. M. (2024). The Spatial Pattern of Polluting Enterprises and the Effects of Local Regulation in the Guanzhong Plain Urban Agglomeration. Land, 13(6), 733. https://doi.org/10.3390/land13060733