Farmland Rental Market, Outsourcing Services Market and Agricultural Green Productivity: Implications for Multiple Forms of Large-Scale Management
Abstract
1. Introduction
2. Theoretical Framework
2.1. Mechanisms of Benign Interaction between Farmland Rental Market and Outsourcing Services Market
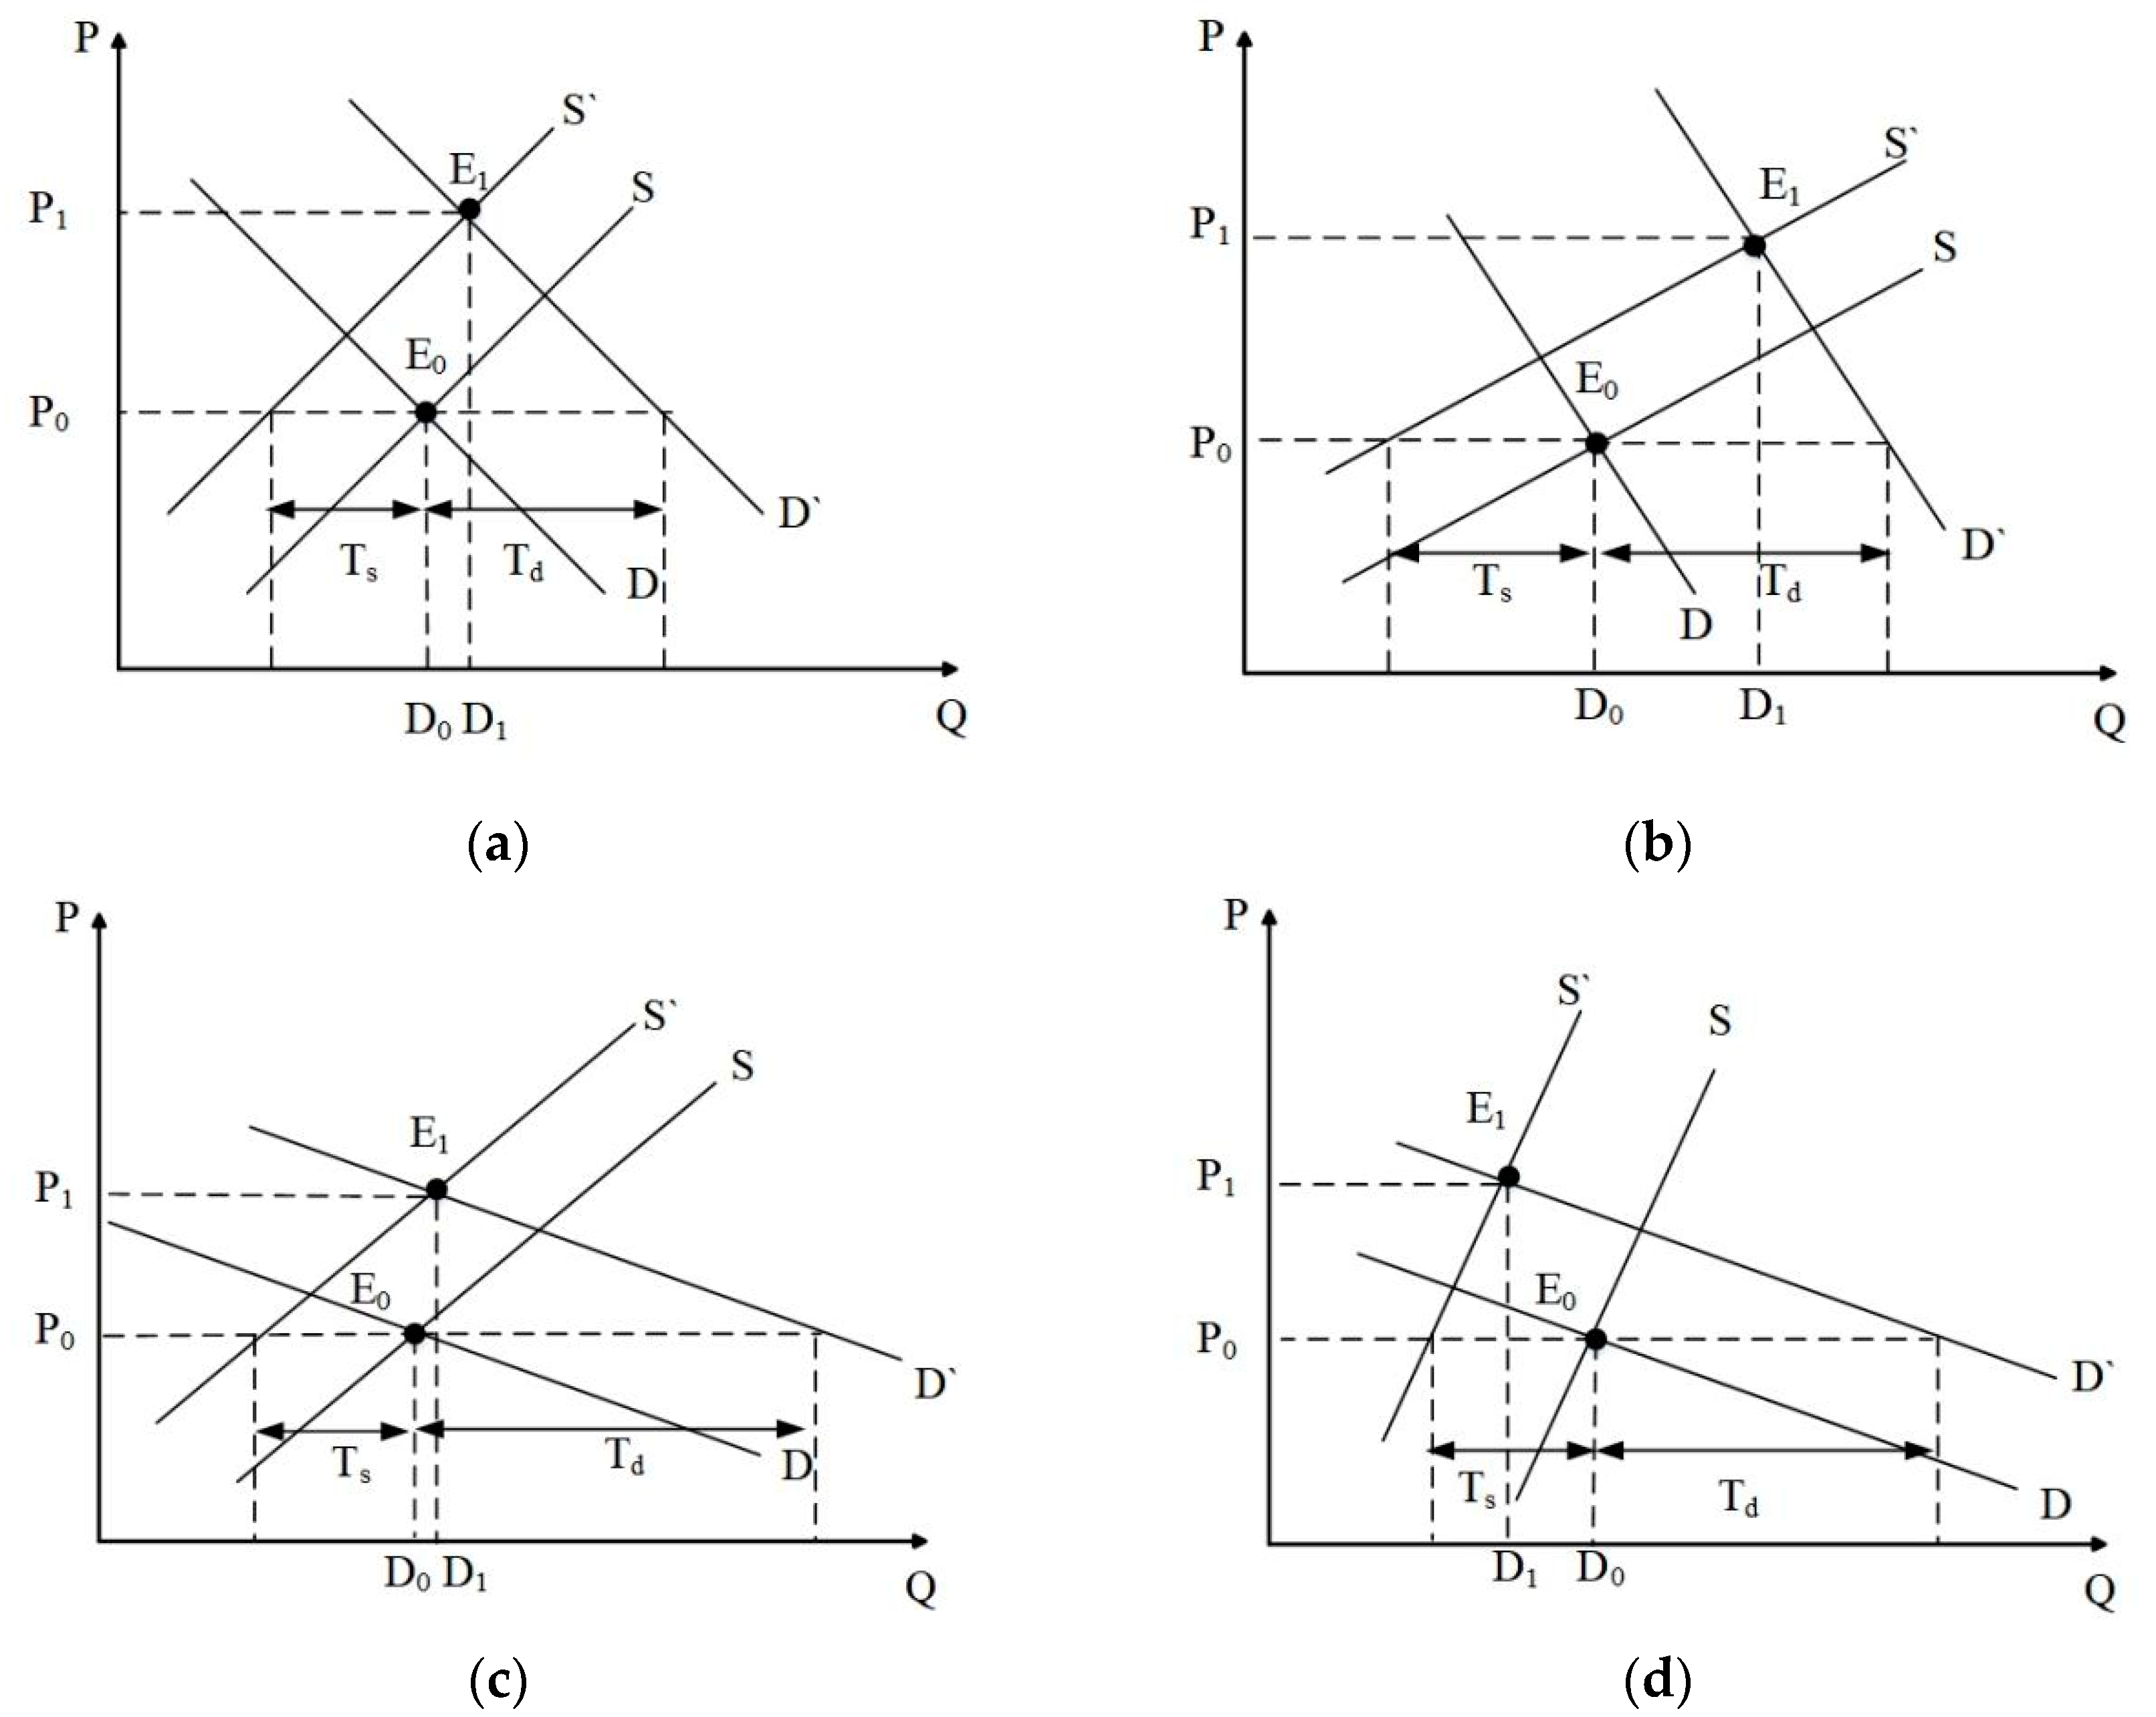
2.1.1. Mechanism of Outsourcing Services Market on Farmland Rental Market
2.1.2. Mechanism of Farmland Rental Market on Outsourcing Services Market
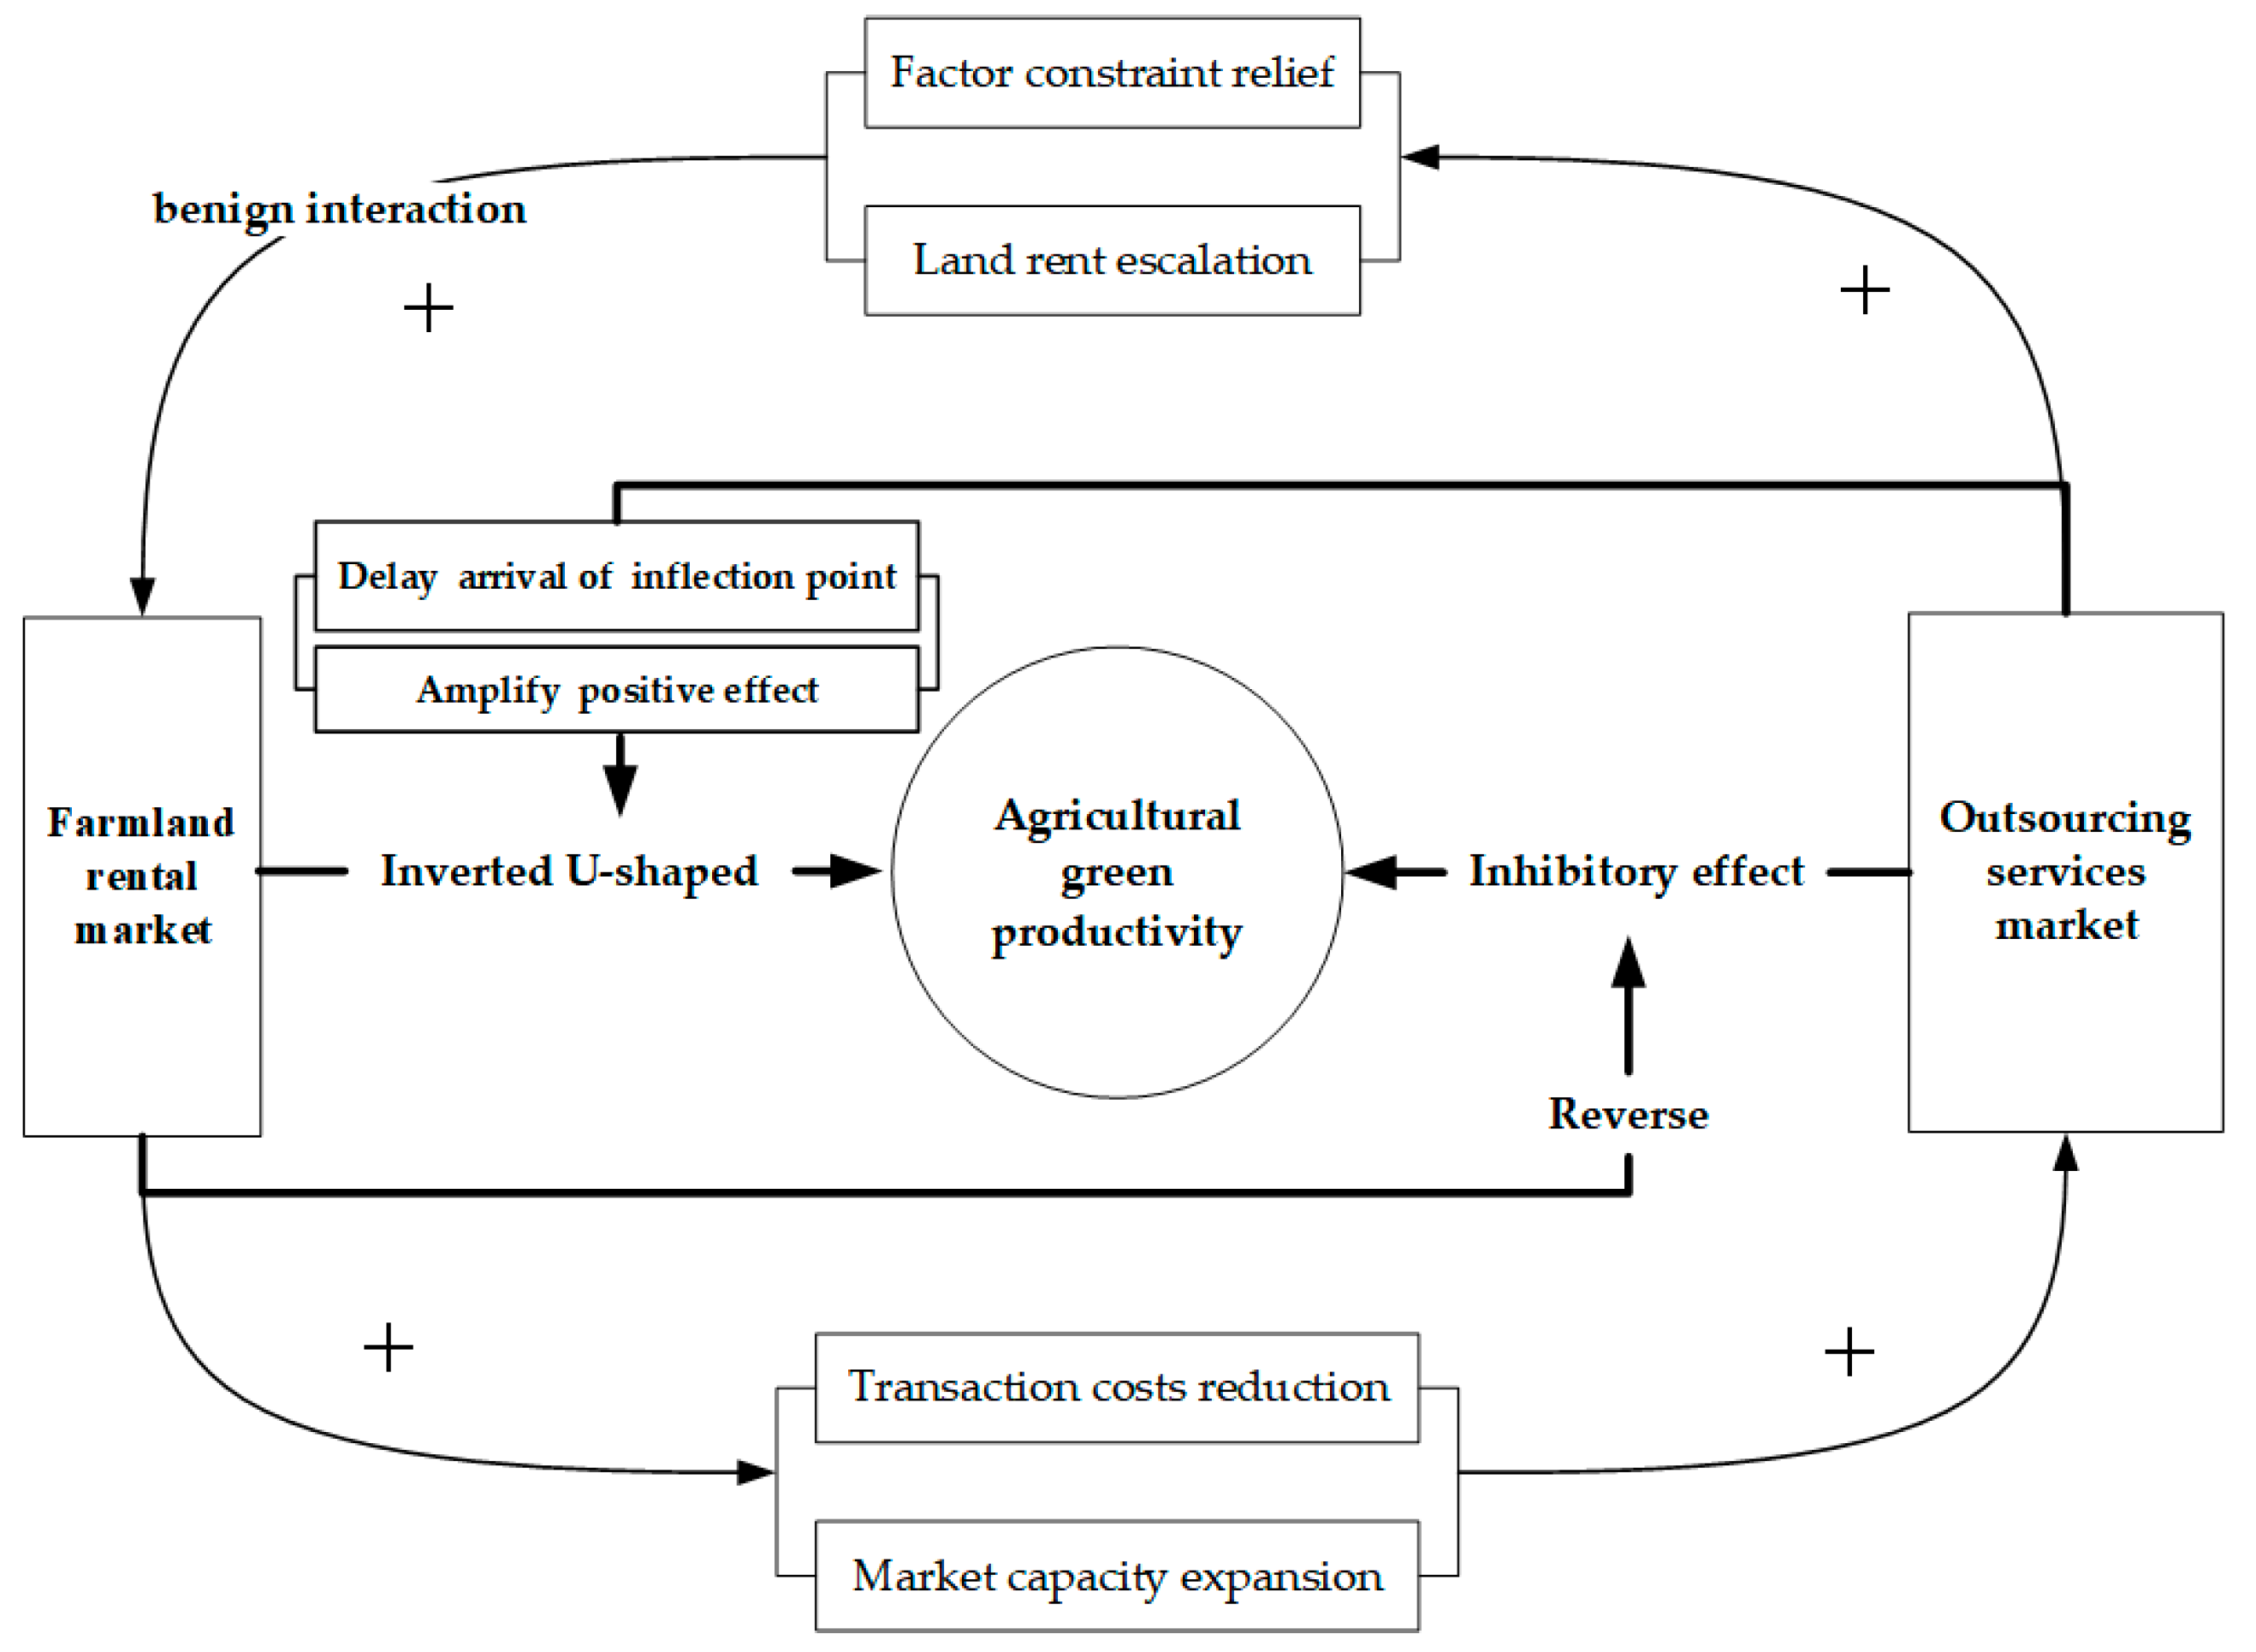
2.2. Influence Mechanisms of Benign Interaction between Farmland Rental Market and Outsourcing Services Market on Agricultural Green TFP
3. Methodology
3.1. Evaluation Model of Benign Interaction between the Two Markets
- (1)
- Indicator construction and evaluation of market maturity
- (2)
- Construction of coupling coordination model
3.2. Model for Effects and Mechanisms of Benign Interaction between the Two Markets on Agricultural Green TFP
- (1)
- Influence effects model
- (2)
- Influence mechanism model
3.3. Spatial Spillover Model
4. Estimation and Results Analysis
4.1. Results Analysis of Interaction between Farmland Rental Market and Outsourcing Services Market
- (1)
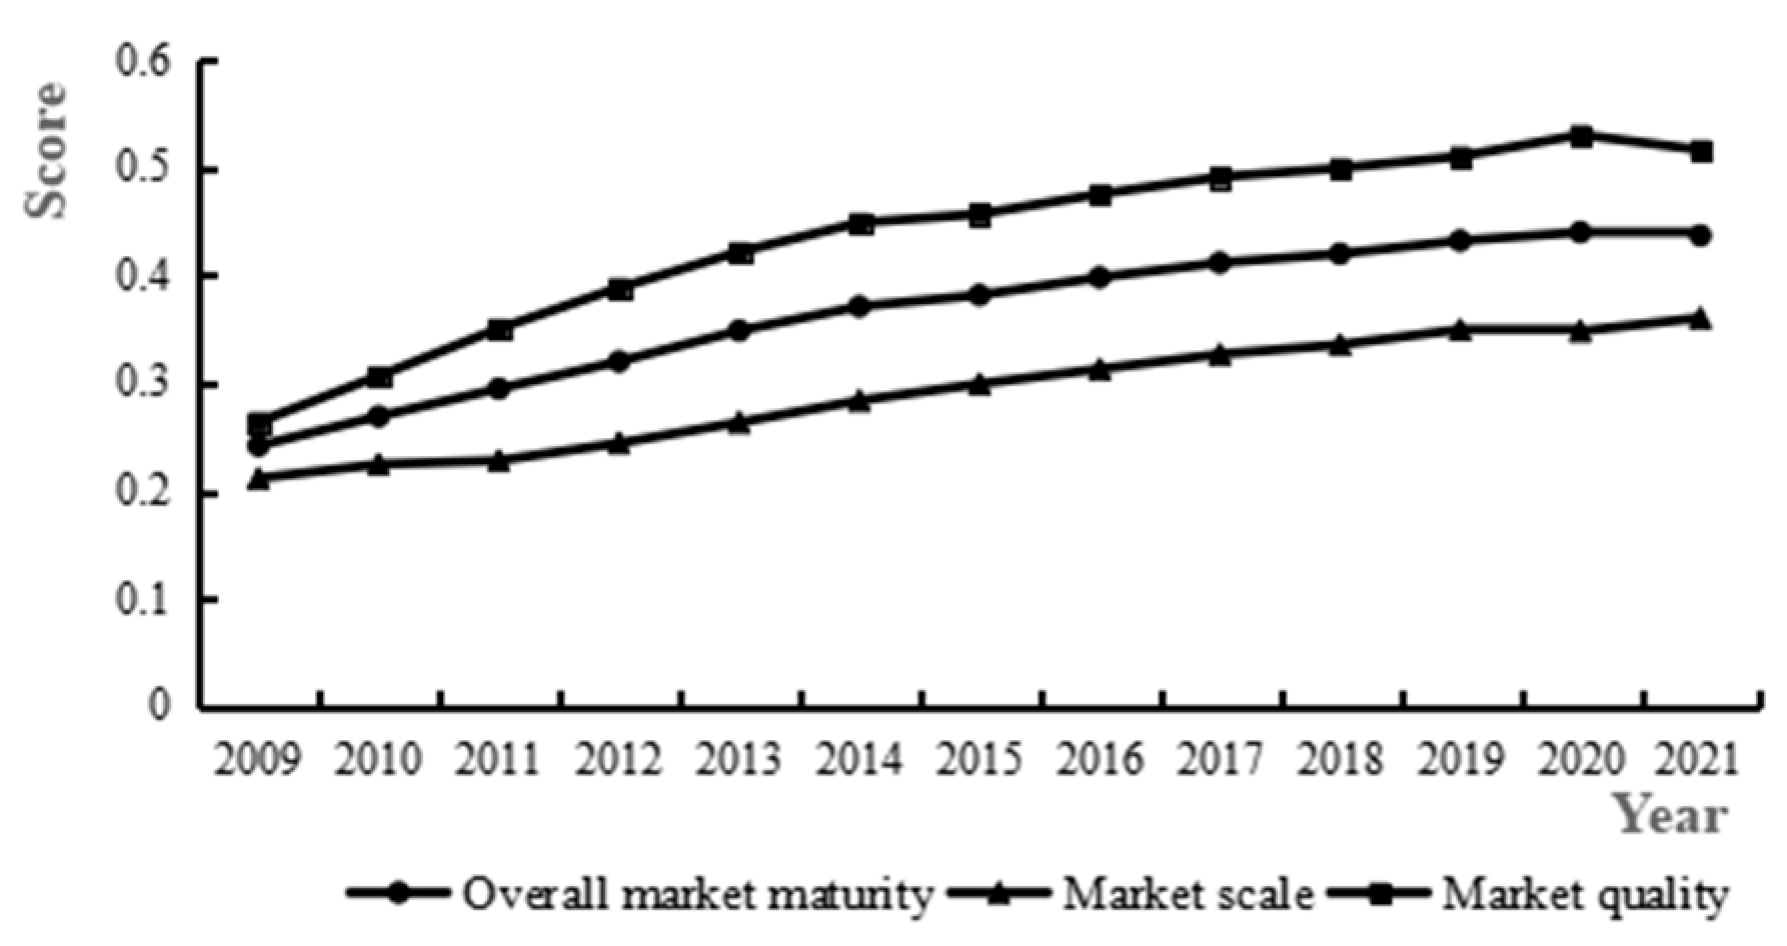
- Maturity of farmland rental market
- (2)
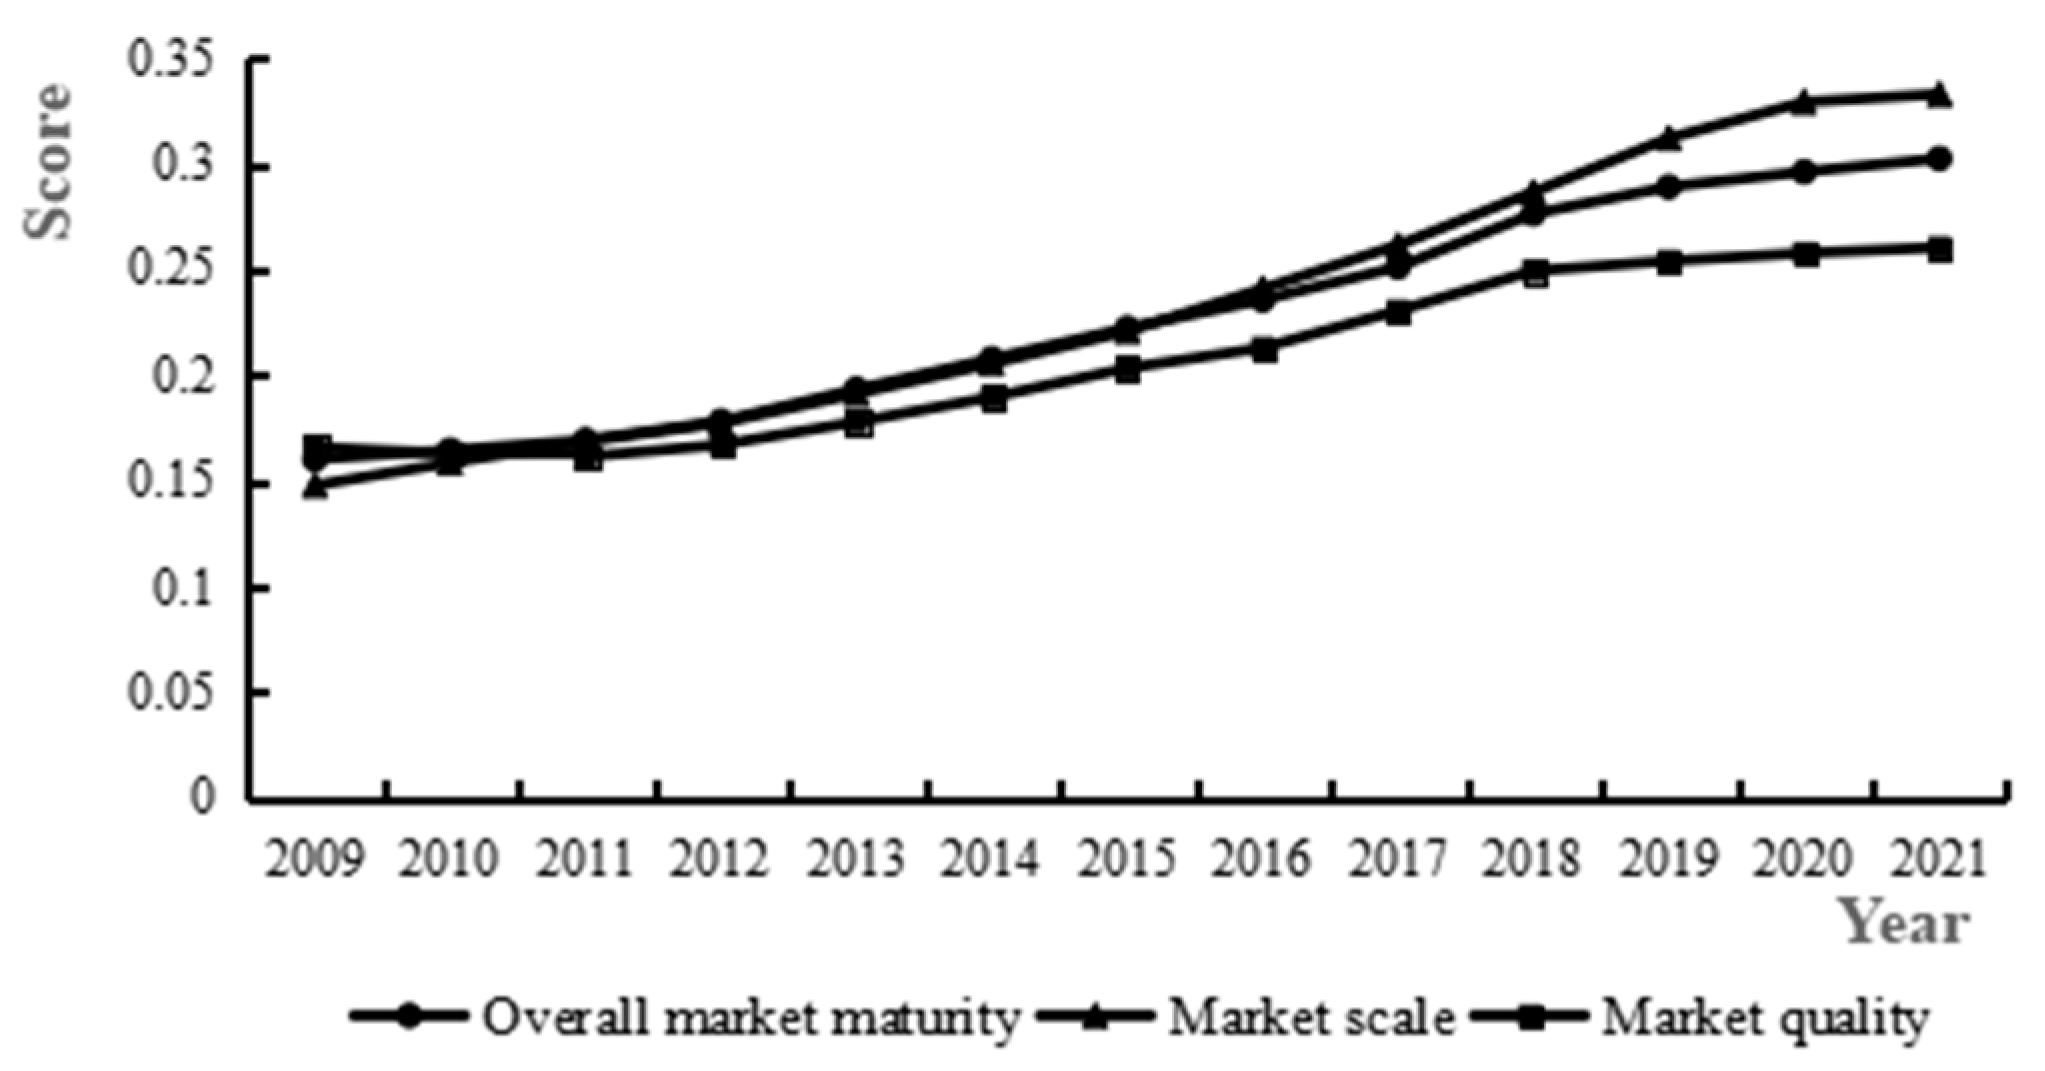
- Maturity of agricultural outsourcing services market
- (3)
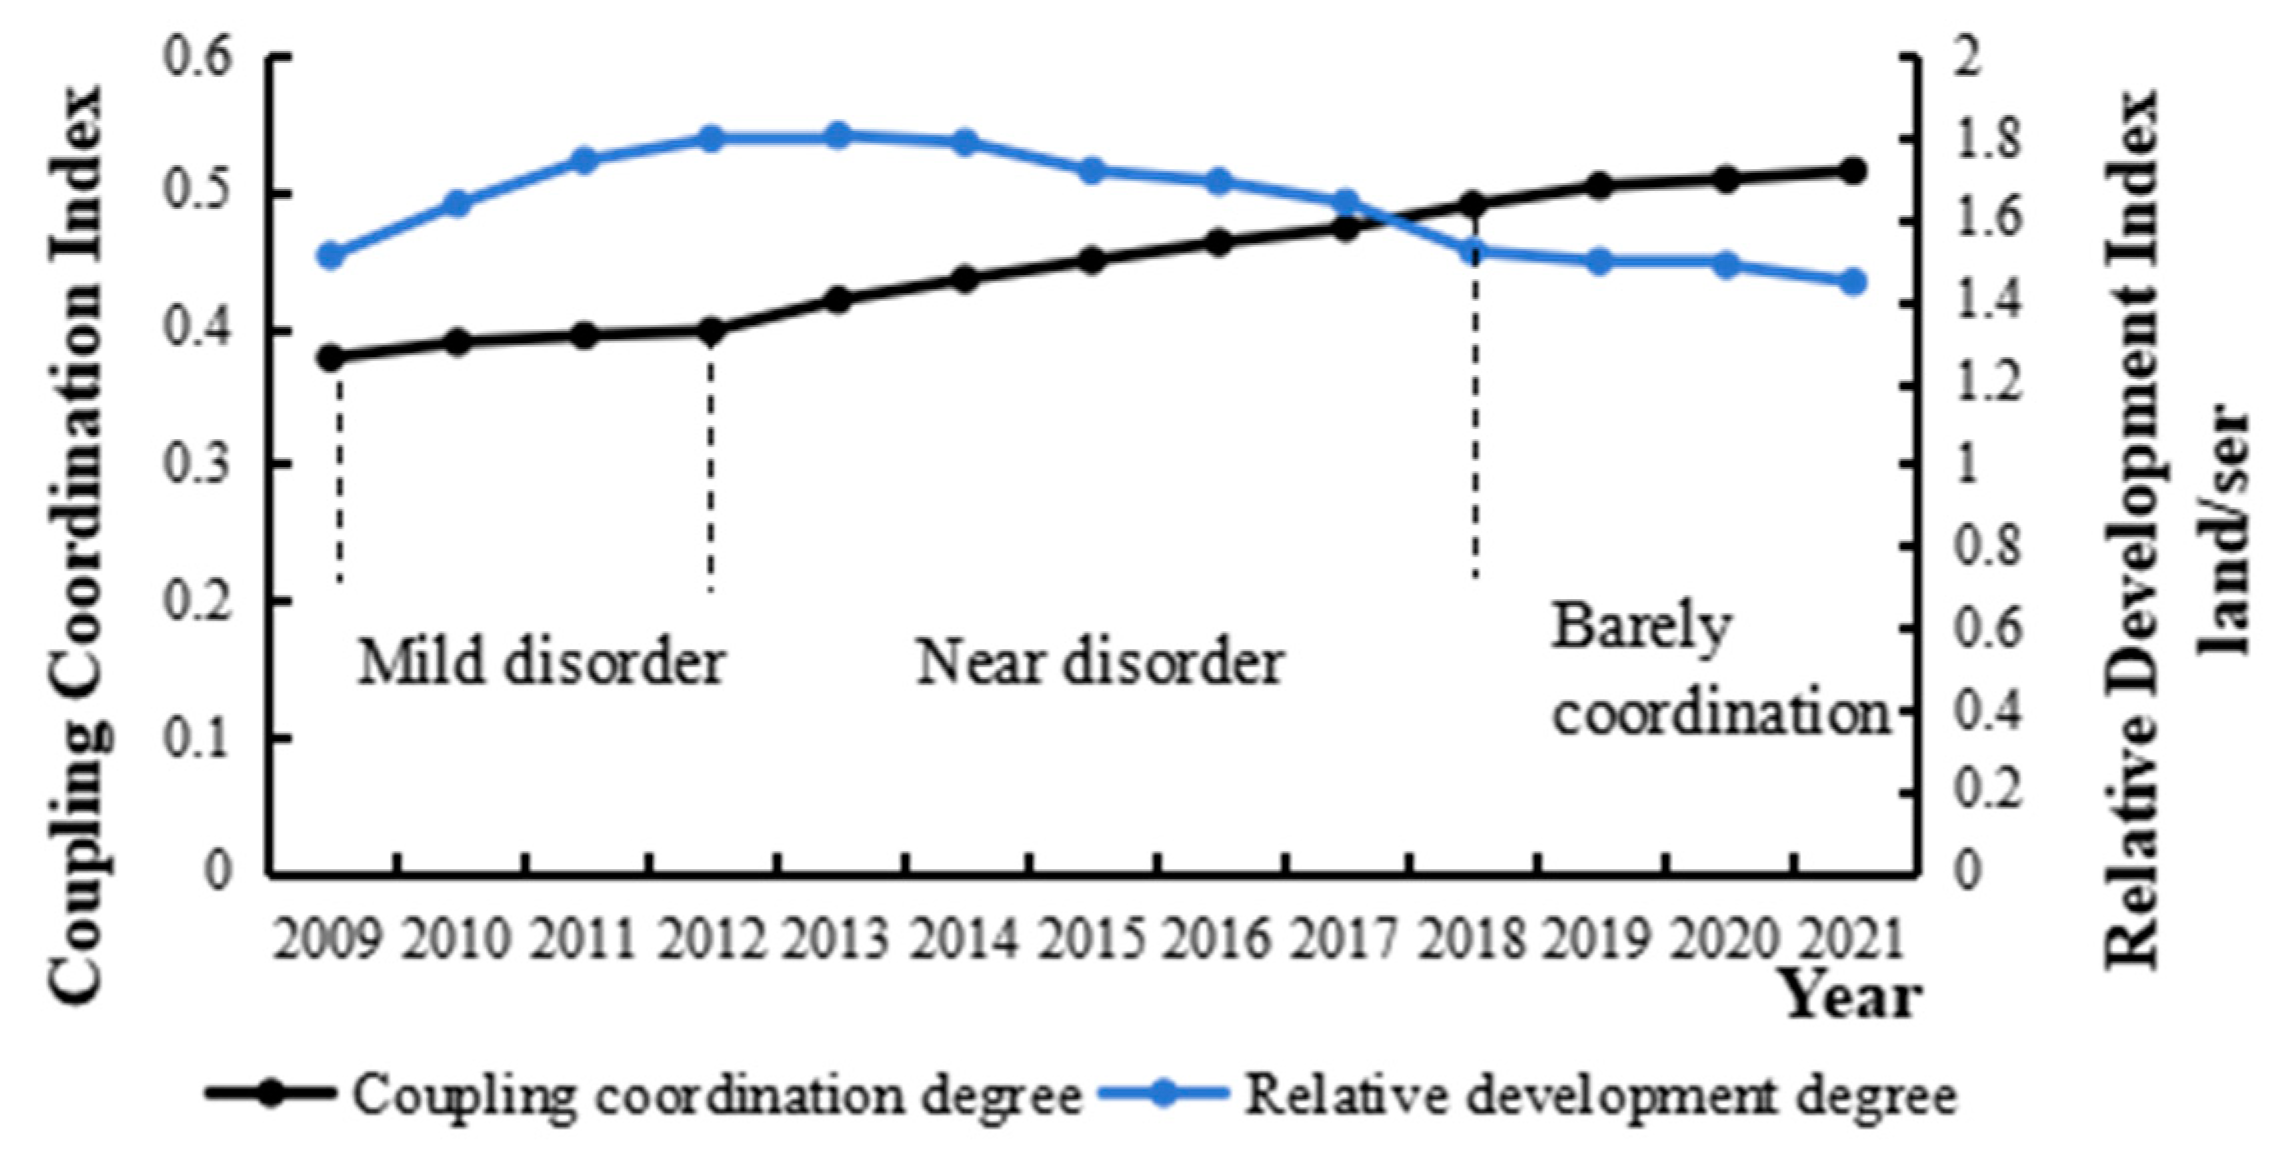
- Coupling coordination degree between the two markets
4.2. Benign Interaction between the Two Markets Improves Green Productivity: Effects and Mechanisms
4.2.1. Improved Effect Analysis
4.2.2. Improved Mechanism Analysis
Farmland Rental Market Optimizes the Relationship between Outsourcing Services Market and Agricultural Green TFP
Outsourcing Services Market Optimizes the Relationship between Farmland Rental Market and Agricultural Green TFP
- (1)
- Delay the arrival of the inflection point beyond which the expansion of farmland rental market scale reduces agricultural green TFP. Expanding market scale is an important precondition for market maturity growth. Table 8 shows the relationship between farmland rental market scale and agricultural green TFP. In model (1), the first-order coefficient of farmland rental market scale is significantly positive and the square term coefficient of it is significantly negative. The slope of the curve is positive (5.000) at the left endpoint of the value range of farmland rental market scale and negative (−4.2431) at the right endpoint. The inflection point of the curve (0.4457) is within the value range of farmland rental market scale (0.0605, 0.7726). The above satisfies the three conditions of the inverted “U” relationship proposed by Haans et al. [55]. Therefore, there is an inverted U-shaped relationship between farmland rental market scale and agricultural green TFP. When the transactions volume of the farmland rental market is low, agricultural green TFP can increase with the expansion of farmland transactions volume, and when the transactions volume crosses the inflection point, agricultural green TFP will be reduced. The interaction term of farmland rental market scale × outsourcing services market is introduced in model (2). Although farmland rental market scale and agricultural green TFP still show an inverted U-shaped relationship, it can be seen that the inflection point of the inverted U-shaped curve is shifted to the right by calculating β1*β4 − β2*β3(>0). This shows that the increase in maturity of the outsourcing services market can delay the arrival of the inflection point where the expansion of the farmland rental market transaction volume reduces agricultural green TFP.
- (2)
- Amplify the positive effects of the farmland rental market on agricultural green TFP. The threshold model is also used to explore the different effects of the farmland rental market on agricultural green TFP when the outsourcing services market is at different maturity levels. The tests and results of threshold model in Table 9 and Table 10 show that when outsourcing services market maturity is at a low level (≤0.1136) and crosses the first threshold (0.1136 < OSM ≤ 0.1898) and the second threshold (>0.1898), the degree of positive impact of the farmland rental market on agricultural green TFP increases from 2.5209 to 3.7356 and 4.5940, respectively. When controlling for constant outsourcing services market maturity, the average impact of the farmland rental market on agricultural green TFP is 1.3599 (Table 6). When the outsourcing services market maturity gradually increases, the improvement of agricultural green TFP by the farmland rental market is not only higher than 1.3599 but also gradually improved. Therefore, the existence and increasing maturity of the outsourcing services market amplifies the positive impact of the farmland rental market on agricultural green TFP, which prompts land-scale management to continuously release the potential of improving agricultural green productivity.
4.3. Results Analysis of Spatial Spillover
5. Conclusions
Author Contributions
Funding
Data Availability Statement
Acknowledgments
Conflicts of Interest
References
- Lu, X.H.; Jiang, X.; Gong, M.Q. How land transfer marketization influence on green total factor productivity from the approach of industrial structure? Evidence from China. Land Use Policy 2020, 95, 104610. [Google Scholar] [CrossRef]
- Alem, H. The role of green total factor productivity to farm-level performance: Evidence from Norwegian dairy farms. Agric. Food Econ. 2023, 11, 2. [Google Scholar] [CrossRef]
- Foster, A.D.; Rosenzweig, M.R. Microeconomics of Technology Adoption. Annu. Rev. Econ. 2010, 2, 395–424. [Google Scholar] [CrossRef] [PubMed]
- Foster, A.D.; Rosenzweig, M.R. Are there too many farms in the world? Labormarket transaction costs, machine capacities and optimal farm size. J. Polit. Econ. 2022, 130, 636–680. [Google Scholar] [CrossRef]
- Ren, C.C.; Liu, S.; van Grinsven, H.; Reis, S.; Jin, S.Q.; Liu, H.B.; Gu, B.J. The impact of farm size on agricultural sustainability. J. Clean. Prod. 2019, 220, 357–367. [Google Scholar] [CrossRef]
- De Roest, K.; Ferrari, P.; Knickel, K. Specialisation and economies of scale or diversification and economies of scope? Assessing different agricultural development pathways. J. Rural. Stud. 2018, 59, 222–231. [Google Scholar] [CrossRef]
- Young, A.A. Increasing returns and economic progress. Econ. J. 1928, 38, 527–542. [Google Scholar] [CrossRef]
- Fei, R.L.; Lin, Z.Y.; Chunga, J. How land transfer affects agricultural land use efficiency: Evidence from China’s agricultural sector. Land Use Policy 2021, 103, 105300. [Google Scholar] [CrossRef]
- Wang, J.Y.; Chen, K.Z.; Das Gupta, S.; Huang, Z.H. Is small still beautiful? A comparative study of rice farm size and productivity in China and India. China Agric. Econ. Rev. 2015, 7, 484–509. [Google Scholar] [CrossRef]
- Manjunatha, A.V.; Anik, A.R.; Speelman, S.; Nuppenau, E.A. Impact of land fragmentation, farm size, land ownership and crop diversity on profit and efficiency of irrigated farms in India. Land Use Policy 2013, 31, 397–405. [Google Scholar] [CrossRef]
- Ricciardi, V.; Mehrabi, Z.; Wittman, H.; James, D.; Ramankutty, N. Higher yields and more biodiversity on smaller farms. Nat. Sustain. 2021, 4, 651–657. [Google Scholar] [CrossRef]
- Aragón, F.M.; Restuccia, D.; Rud, J.P. Are small farms really more productive than large farms? Food Policy 2022, 106, 102168. [Google Scholar] [CrossRef]
- Kerr, P. Adam Smith’s theory of growth and technological change revisited. Contrib. Political Econ. 1993, 12, 1–27. [Google Scholar] [CrossRef][Green Version]
- Igata, M.; Hendriksen, A.; Heijman, W.J.M. Agricultural outsourcing: A comparison between the Netherlands and Japan. APSTRACT Appl. Stud. Agribus. Commer. 2008, 2, 29–34. [Google Scholar] [CrossRef]
- Deng, X.; Xu, D.D.; Zeng, M.; Qi, Y.B. Does outsourcing affect agricultural productivity of farmer households? Evidence from China. China Agric. Econ. Rev. 2020, 12, 673–688. [Google Scholar] [CrossRef]
- Qing, C.; Zhou, W.F.; Song, J.H.; Deng, X.; Xu, D.D. Impact of outsourced machinery services on farmers’ green production behavior: Evidence from Chinese rice farmers. J. Environ. Manag. 2023, 327, 116843. [Google Scholar] [CrossRef] [PubMed]
- Zhang, X.B.; Yang, J.; Thomas, R. Mechanization outsourcing clusters and division of labor in Chinese agriculture. China Econ. Rev. 2017, 43, 184–195. [Google Scholar] [CrossRef]
- Picazo-Tadeo, A.J.; Reig-Martínez, E. Outsourcing and efficiency:: The case of Spanish citrus farming. Agron. Econ-Blackwell 2006, 35, 213–222. [Google Scholar] [CrossRef]
- Qu, X.; Kojima, D.; Nishihara, Y.; Wu, L.P.; Ando, M. Can harvest outsourcing services reduce field harvest losses of rice in China? J. Integr. Agric. 2021, 20, 1396–1406. [Google Scholar] [CrossRef]
- Chen, Y.Y.; Jiao, C.Q. How agricultural contracting services are reshaping small-scale household farming in China. J. Peasant. Stud. 2024, 51, 339–357. [Google Scholar] [CrossRef]
- Zhang, Y.J.; Zhang, J.; Liu, Y.; Zhu, P.X. Agricultural machinery service adoption and farmland transfer-in decision: Evidence from rural China. Front. Env. Sci.-Switz. 2023, 11, 1195877. [Google Scholar] [CrossRef]
- Qian, L.; Lu, H.; Gao, Q.; Lu, H.L. Household-owned farm machinery vs. outsourced machinery services: The impact of agricultural mechanization on the land leasing behavior of relatively large-scale farmers in China. Land Use Policy 2022, 115, 106008. [Google Scholar] [CrossRef]
- Xu, C.H.; Wang, Q.; Fahad, S.; Kagatsume, M.; Yu, J. Impact of Off-Farm Employment on Farmland Transfer: Insight on the Mediating Role of Agricultural Production Service Outsourcing. Agriculture 2022, 12, 1617. [Google Scholar] [CrossRef]
- Zhang, D.; Xu, Z.G.; Liu, J.C. Agricultural production services and land transfer: Whether service scale management postpones land scale management ananalysis from the perspectives of factor constraint mitigation effect and land rent rise effect. China Rural. Survey 2022, 2, 19–38. [Google Scholar]
- Yi, Q.; Chen, M.Y.; Sheng, Y.; Huang, J.K. Mechanization services, farm productivity and institutional innovation in China. China Agric. Econ. Rev. 2019, 11, 536–554. [Google Scholar] [CrossRef]
- Qiu, T.; Shi, X.; He, Q.; Luo, B. The paradox of developing agricultural mechanization services in China: Supporting or kicking out smallholder farmers? China Econ. Rev. 2021, 69, 101680. [Google Scholar] [CrossRef]
- Coase, R.H. The nature of the firm. Economica 1937, 4, 386–405. [Google Scholar] [CrossRef]
- Adamopoulos, T.; Brandt, L.; Leight, J.; Restuccia, D. Misallocation, Selection, and Productivity: A Quantitative Analysis With Panel Data From China. Econometrica 2022, 90, 1261–1282. [Google Scholar] [CrossRef]
- Hsieh, C.T.; Klenow, P.J. Misallocation and Manufacturing Tfp in China and India. Q. J. Econ. 2009, 124, 1403–1448. [Google Scholar] [CrossRef]
- Lu, H.; Xie, H.L. Impact of changes in labor resources and transfers of land use rights on agricultural non-point source pollution in Jiangsu Province, China. J. Environ. Manag. 2018, 207, 134–140. [Google Scholar] [CrossRef]
- Wu, Y.Y.; Xi, X.C.; Tang, X.; Luo, D.M.; Gu, B.J.; Lam, S.K.; Vitousek, P.M.; Chen, D.L. Policy distortions, farm size, and the overuse of agricultural chemicals in China. Proc. Natl. Acad. Sci. USA 2018, 115, 7010–7015. [Google Scholar] [CrossRef]
- Ju, X.T.; Gu, B.J.; Wu, Y.Y.; Galloway, J.N. Reducing China’s fertilizer use by increasing farm size. Glob. Environ. Chang.-Human. Policy Dimens. 2016, 41, 26–32. [Google Scholar] [CrossRef]
- Goldstein, M.; Udry, C. The Profits of Power: Land Rights and Agricultural Investment in Ghana. J. Polit. Econ. 2008, 116, 981–1022. [Google Scholar] [CrossRef]
- Cao, Y.M.; Bai, Y.L.; Zhang, L.X. The impact of farmland property rights security on the farmland investment in rural China. Land Use Policy 2020, 97, 104736. [Google Scholar] [CrossRef]
- Eswaran, M.; Kotwal, A. Access to capital and agrarian production organisation. Econ. J. 1986, 96, 482–498. [Google Scholar] [CrossRef]
- Binswanger, H.P.; Deininger, K.; Feder, G. Revolt and reform in agricultural land relations. Handb. Dev. Econ. 1995, 3, 2659–2772. [Google Scholar]
- Liu, Y.; Yan, B.J.; Wang, Y.; Zhou, Y.H. Will land transfer always increase technical efficiency in China?—A land cost perspective. Land Use Policy 2019, 82, 414–421. [Google Scholar] [CrossRef]
- Sheng, Y.; Ding, J.P.; Huang, J.K. The Relationship between Farm Size and Productivity in Agriculture: Evidence from Maize Production in Northern China. Am. J. Agron. Econ. 2019, 101, 790–806. [Google Scholar] [CrossRef]
- Li, R.N.; Yu, Y.L. Impacts of Green Production Behaviors on the Income Effect of Rice Farmers from the Perspective of Outsourcing Services: Evidence from the Rice Region in Northwest China. Agriculture 2022, 12, 1682. [Google Scholar] [CrossRef]
- Lu, H.; Duan, N.; Chen, Q.R. Impact of agricultural production outsourcing services on carbon emissions in China. Environ. Sci. Pollut. Res. 2023, 30, 35985–35995. [Google Scholar] [CrossRef]
- Yang, Y.F.; Yu, Y.L.; Li, R.N.; Jiang, D.B. Impact of pesticide outsourcing services on farmers’ low-carbon production behavior. Front. Environ. Sci. 2023, 11, 1226039. [Google Scholar] [CrossRef]
- Chai, Q.; Qin, A.Z.; Gan, Y.T.; Yu, A.Z. Higher yield and lower carbon emission by intercropping maize with rape, pea, and wheat in arid irrigation areas. Agron. Sustain. Dev. 2014, 34, 535–543. [Google Scholar] [CrossRef]
- Belton, B.; Win, M.T.; Zhang, X.B.; Filipski, M. The rapid rise of agricultural mechanization in Myanmar. Food Policy 2021, 101, 102095. [Google Scholar] [CrossRef]
- Qu, X.; Kojima, D.; Wu, L.P.; Ando, M. Do Farming Scale and Mechanization Affect Moral Hazard in Rice Harvest Outsourcing Service in China? Agriculture 2022, 12, 1205. [Google Scholar] [CrossRef]
- Chen, Y.J.; Lu, H.; Luo, J.W. How does agricultural production outsourcing services affect chemical fertilizer use under topographic constraints: A farm-level analysis of China. Environ. Sci. Pollut. Res. 2023, 30, 100861–100872. [Google Scholar] [CrossRef] [PubMed]
- Yang, C.; Zeng, W.; Yang, X. Coupling coordination evaluation and sustainable development pattern of geo-ecological environment and urbanization in Chongqing municipality, China. Sustain. Cities Soc. 2020, 61, 102271. [Google Scholar] [CrossRef]
- Wang, S.J.; Ma, H.T.; Zhao, Y.B. Exploring the relationship between urbanization and the eco-environment—A case study of Beijing-Tianjin-Hebei region. Ecol. Indic. 2014, 45, 171–183. [Google Scholar] [CrossRef]
- Fan, Y.P.; Fang, C.L.; Zhang, Q. Coupling coordinated development between social economy and ecological environment in Chinese provincial capital cities-assessment and policy implications. J. Clean. Prod. 2019, 229, 289–298. [Google Scholar] [CrossRef]
- Liu, N.N.; Liu, C.Z.; Xia, Y.F.; Da, B.W. Examining the coordination between urbanization and eco-environment using coupling and spatial analyses: A case study in China. Ecol. Indic. 2018, 93, 1163–1175. [Google Scholar] [CrossRef]
- Wang, S.J.; Kong, W.; Ren, L.; Zhi, D.D.; Dai, B.T. Research on misuses and modification of coupling coordination degree model in China. J. Nat. Resour. 2021, 36, 793–810. [Google Scholar] [CrossRef]
- Li, W.W.; Yi, P.T. Assessment of city sustainability-Coupling coordinated development among economy, society and environment. J. Clean. Prod. 2020, 256, 120453. [Google Scholar] [CrossRef]
- IPCC. Climate Change 2007: Mitigation of Contribution of Working Group III to the Fourth Assessment Report of the Intergovernmental Panel on Climate Change: Summary for Policymakers and Technical Summary; Cambridge University Press: Cambridge, UK, 2007. Available online: https://www.ipcc.ch/report/ar4/wg3/ (accessed on 2 November 2023).
- Liu, D.D.; Zhu, X.Y.; Wang, Y.F. China’s agricultural green total factor productivity based on carbon emission: An analysis of evolution trend and influencing factors. J. Clean. Prod. 2021, 278, 123692. [Google Scholar] [CrossRef]
- Hansen, B.E. Threshold effects in non-dynamic panels: Estimation, testing, and inference. J. Econom. 1999, 93, 345–368. [Google Scholar] [CrossRef]
- Haans, R.F.J.; Pieters, C.; He, Z.L. Thinking about u: Theorizing and testing u- and inverted u-shaped relationships in strategy research. Strateg. Manag. J. 2016, 37, 1177–1195. [Google Scholar] [CrossRef]

| Subsystems | Primary Indicators | Weights | Secondary Indicators | Weights | ||||
|---|---|---|---|---|---|---|---|---|
| W′ | W | U | W′ | W | U | |||
| Farmland rental market | Market scale | 0.39 | 0.69 | 0.51 | Transaction volume I1 | 0.16 | 0.33 | 0.23 |
| Farmland per laborer I2 | 0.23 | 0.36 | 0.28 | |||||
| Market quality | 0.61 | 0.31 | 0.49 | Proportion of farmland transferring to cooperatives and enterprises in total transactions I3 | 0.44 | 0.17 | 0.33 | |
| Proportion of farmland rented with a transfer contract in total transactions I4 | 0.17 | 0.14 | 0.16 | |||||
| Agricultural outsourcing services market | Market scale | 0.46 | 0.23 | 0.37 | Output value of agricultural various support services per unit sowing area I5 | 0.22 | 0.12 | 0.18 |
| Added value of agricultural various support services per unit sowing area I6 | 0.24 | 0.11 | 0.19 | |||||
| Market quality | 0.54 | 0.77 | 0.63 | Proportion of service organizations with original value of machinery exceeding 500,000 yuan in total service organizations I7 | 0.16 | 0.12 | 0.14 | |
| Proportion of output value of agricultural various support services in total agricultural output I8 | 0.07 | 0.10 | 0.08 | |||||
| Proportion of added value of agricultural various support services in added value of agriculture I9 | 0.17 | 0.04 | 0.12 | |||||
| Proportion of agricultural pre- and post-production support services personnel in total agricultural support services personnel I10 | 0.14 | 0.51 | 0.29 | |||||
| Index Ranges | Coupling Coordination Types | Index Ranges | Coupling Coordination Types |
|---|---|---|---|
| [0, 0.1) | Extreme disorder | [0.5, 0.6) | Bare coordination |
| [0.1, 0.2) | Severe disorder | [0.6, 0.7) | Elementary coordination |
| [0.2, 0.3) | Moderate disorder | [0.7, 0.8) | Intermediate coordination |
| [0.3, 0.4) | Mild disorder | [0.8, 0.9) | Good coordination |
| [0.4, 0.5) | Near disorder | [0.9, 1.0) | Quality coordination |
| Regions | Development Stage of Agricultural Large-Scale Management |
|---|---|
| Eastern | Bare coordination—land-scale management lagging |
| Central | Near disorder—synchronized lagging |
| Western | Near disorder—service-scale management lagging |
| High agricultural dependency | Near disorder—synchronized lagging |
| Medium agricultural dependency | Bare coordination—service-scale management lagging |
| Low agricultural dependency | Bare coordination—synchronized development |
| Variables | Benchmark Regression: Two-Way Fixed Effects Model | Robust Test: IV-2SLS |
|---|---|---|
| lnCCD | 0.6735 *** (5.63) | 0.8720 *** (3.17) |
| lnDIS | −0.0137 (−1.53) | −0.0159 (−1.37) |
| lnATL | −0.0166 (−0.39) | −0.0211 (−0.59) |
| lnGOE | −0.1240 ** (−2.17) | −0.1555 *** (−2.96) |
| lnAVA | 0.5489 *** (10.12) | 0.5878 *** (9.01) |
| lnPES | −0.1707 *** (−2.69) | −0.1939 *** (−3.24) |
| lnFER | −0.3739 *** (−3.71) | −0.4061 *** (−4.41) |
| lnPSTR | −0.6432 *** (−4.93) | −0.7136 *** (−5.15) |
| Year | Yes | Yes |
| Province | Yes | Yes |
| Hausman P | 0.0000 | — |
| Weak instrumental variables test: F-value | — | 86.6052 |
| Observation | 390 | 390 |
| Variables | Agricultural Green TFP |
|---|---|
| OSM | −1.0571 *** (−3.83) |
| LRM | 1.3599 *** (4.15) |
| DIS | −0.4880 *** (−3.69) |
| ATL | 0.0447 (0.31) |
| GOE | −1.4206 (1.36) |
| AVA | 10.1049 *** (8.93) |
| PES | 0.0002 (0.03) |
| FER | −0.0001 (−0.08) |
| PSTR | −0.6305 (−1.26) |
| Year | Yes |
| Province | Yes |
| Hausman P | 0.0000 |
| Threshold Variable | Number of Thresholds | F-Value | p-Value | Threshold Value | 95% Confidence Interval |
|---|---|---|---|---|---|
| Maturity of farmland rental market | Single Threshold | 45.67 | 0.0500 | 0.2198 ** | [0.2061, 0.2209] |
| Double Threshold | 34.35 | 0.0333 | 0.3536 ** | [0.3458, 0.3551] | |
| triple threshold | 23.83 | 0.5800 | — | — |
| Variables | Agricultural Green TFP |
|---|---|
| OSM (LRM ≤ 0.2198) | −1.4358 ** (−2.29) |
| OSM (0.2198 < LRM ≤ 0.3536) | 0.9177 ** (1.99) |
| OSM (LRM > 0.3536) | 2.5779 *** (7.45) |
| DIS | −1.1973 *** (−5.92) |
| ATL | 0.3630 * (1.65) |
| GOE | 3.6446 ** (2.32) |
| AVA | 4.5469 *** (2.66) |
| PES | −0.0080 (−1.00) |
| FER | −0.0032 *** (−4.74) |
| PSTR | −3.3263 *** (−4.48) |
| Variables | Agricultural Green TFP | |
|---|---|---|
| (1) | (2) | |
| LRMS | 5.7850 *** (7.95) | 7.0892 *** (5.33) |
| LRMS2 | −6.4895 *** (−7.54) | −4.7713 *** (−2.62) |
| LRMS*OSM | — | −8.8469 ** (−2.24) |
| LRMS2*OSM | — | 5.5822 ** (2.16) |
| Constant | −1.0578 ** (−2.05) | −1.5517 *** (−2.77) |
| Controls | YES | YES |
| Year | YES | YES |
| Province | YES | YES |
| R2 | 0.8617 | 0.8812 |
| Threshold Variable | Number of Thresholds | F-Value | p-Value | Threshold Value | 95% Confidence Interval |
|---|---|---|---|---|---|
| Maturity of outsourcing services market | Single Threshold | 41.11 | 0.0233 | 0.1136 ** | [0.1083, 0.1147] |
| Double Threshold | 38.30 | 0.0133 | 0.1898 ** | [0.1858, 0.1904] | |
| Triple threshold | 14.64 | 0.7633 | — | — |
| Variables | Agricultural Green TFP |
|---|---|
| LRM (OSM ≤ 0.1136) | 2.5209 *** (6.84) |
| LRM (0.1136 < OSM ≤ 0.1898) | 3.7356 *** (12.27) |
| LRM (OSM > 0.1898) | 4.5940 *** (18.39) |
| DIS | −0.7008 *** (−4.29) |
| ATL | 0.3601 ** (2.09) |
| GOE | 3.5558 *** (2.71) |
| AVA | 8.3607 *** (6.05) |
| PES | −0.0092 (−1.47) |
| FER | −0.0024 *** (−4.66) |
| PSTR | −3.8640 *** (−6.72) |
| Test Type | Statistics | Results |
|---|---|---|
| Global Moran’s I | 0.614 *** (16.712) | Spatial model |
| LM_test for no spatial lag | 132.191 *** (0.00) | SDM |
| Robust LM_test for no spatial lag | 74.177 *** (0.00) | |
| LM_test for no spatial error | 65.760 *** (0.00) | |
| Robust LM_test for no spatial error | 7.747 *** (0.005) | |
| Wald_spatial_lag test | 19.67 ** (0.0117) | SDM |
| LR_spatial_lag test | 53.50 *** (0.0000) | SDM |
| Wald_spatial_error test | 19.37 ** (0.0130) | SDM |
| LR_spatial_error test | 55.25 *** (0.0000) | SDM |
| Hausman test | 31.05 ** (0.0197) | Fixed effect |
| Variables | Static SDM | Dynamic SDM |
|---|---|---|
| L.lnAGTFP | — | 0.1223 ** (2.40) |
| WL.lnAGTFP | — | 0.4566 *** (4.41) |
| lnCCD | 1.006 *** (8.73) | 0.8694 *** (6.87) |
| lnDIS | −0.0050 (−1.53) | −0.0042 (−1.26) |
| lnATL | −0.0053 (−0.13) | −0.0348 (−0.83) |
| lnGOE | −0.1875 *** (−3.34) | −0.1692 *** (−2.88) |
| lnAVA | 0.6350 *** (11.15) | 0.6177 *** (10.21) |
| lnPES | 0.1678 *** (2.75) | 0.1747 *** (2.72) |
| lnFER | −0.3114 *** (−3.28) | −0.3717 *** (−3.80) |
| lnPSTR | −0.5051 *** (−3.90) | −0.6140 *** (−4.45) |
| WlnCCD | 0.6516 *** (3.20) | 0.0832 (0.33) |
| WlnDIS | 0.0033 (0.38) | 0.0015 (0.17) |
| WlnATL | −0.0439 (−0.50) | −0.1137 (−1.27) |
| WlnGOE | −0.3014 ** (−2.45) | −0.1988 (−1.58) |
| WlnAVA | −0.1618 (−1.40) | −0.1579 (−1.28) |
| WlnPES | −0.4769 *** (−2.81) | −0.5611 *** (−3.18) |
| WlnFER | 0.3753 * (1.71) | 0.3568 (1.57) |
| WlnPSTR | 0.6052 ** (2.14) | 0.8299 *** (2.70) |
| sigma2_e | 0.0098 *** (13.71) | 0.0098 *** (14.48) |
| rho | 0.3825 *** (6.37) | 0.1458 * (1.77) |
| Observation | 390 | 390 |
| Short-Term Effect | Long-Term Effect | ||||
|---|---|---|---|---|---|
| Direct effect | Spatial effect | Total effect | Direct effect | Spatial effect | Total effect |
| 0.8733 *** (7.12) | 0.2455 (0.81) | 1.1189 *** (3.39) | 1.009 *** (6.59) | 1.4786 ** (2.44) | 2.4880 *** (2.79) |
Disclaimer/Publisher’s Note: The statements, opinions and data contained in all publications are solely those of the individual author(s) and contributor(s) and not of MDPI and/or the editor(s). MDPI and/or the editor(s) disclaim responsibility for any injury to people or property resulting from any ideas, methods, instructions or products referred to in the content. |
© 2024 by the authors. Licensee MDPI, Basel, Switzerland. This article is an open access article distributed under the terms and conditions of the Creative Commons Attribution (CC BY) license (https://creativecommons.org/licenses/by/4.0/).
Share and Cite
Zhang, H.; Guo, X. Farmland Rental Market, Outsourcing Services Market and Agricultural Green Productivity: Implications for Multiple Forms of Large-Scale Management. Land 2024, 13, 676. https://doi.org/10.3390/land13050676
Zhang H, Guo X. Farmland Rental Market, Outsourcing Services Market and Agricultural Green Productivity: Implications for Multiple Forms of Large-Scale Management. Land. 2024; 13(5):676. https://doi.org/10.3390/land13050676
Chicago/Turabian StyleZhang, Heng, and Xiangyu Guo. 2024. "Farmland Rental Market, Outsourcing Services Market and Agricultural Green Productivity: Implications for Multiple Forms of Large-Scale Management" Land 13, no. 5: 676. https://doi.org/10.3390/land13050676
APA StyleZhang, H., & Guo, X. (2024). Farmland Rental Market, Outsourcing Services Market and Agricultural Green Productivity: Implications for Multiple Forms of Large-Scale Management. Land, 13(5), 676. https://doi.org/10.3390/land13050676


