Article

Temporal and Spatial Response of Ecological Environmental Quality to Land Use Transfer in Nanling Mountain Region, China Based on RSEI: A Case Study of Longnan City

1
Jiangxi Provincial Technology Innovation Center for Ecological Water Engineering in Poyang Lake Basin, Jiangxi Provincial Institute of Water Sciences, Nanchang 330029, China
2
Jiangxi Key Laboratory of Watershed Ecological Process and Information, East China University of Technology, Nanchang 330013, China
3
Nanchang Key Laboratory of Landscape Process and Territorial Spatial Ecological Restoration, East China University of Technology, Nanchang 330013, China
*
Authors to whom correspondence should be addressed.
Land 2024, 13(5), 675; https://doi.org/10.3390/land13050675
Submission received: 29 March 2024 / Revised: 8 May 2024 / Accepted: 11 May 2024 / Published: 13 May 2024
(This article belongs to the Section Land – Observation and Monitoring)

Abstract

:
Nanling Mountain region is a typical southern hilly region, which plays an important ecological and environmental protection role in China’s overall land protection pattern. Based on the remote sensing image data of Longnan City in Nanling Mountain region in 2013, 2018 and 2023, this paper interpreted the land use type and analyzed the land use transfer situation by using land use transfer flow, and a land use transfer matrix. At the same time, based on the remote sensing ecological index (RSEI) model, the ecological environmental quality of Longnan City from 2013 to 2023 was retrieved. The temporal and spatial response model of the ecological environmental quality to land use transfer in Longnan City from 2013 to 2023 was discussed based on spatial autocorrelation and a geographical detector. The results show that from 2013 to 2023, the decrease of forest land (16.23 km2) and the increase of construction land (13.25 km2) were the main land use transfers in Longnan City. The ecological environment indexes of Longnan City in 2013, 2018 and 2023 were 0.789, 0.917 and 0.872, respectively, showing a trend of “first rising and then decreasing”. The ecological environmental quality in the north of Longnan City was significantly lower than that in the south, and the poor ecological quality area appeared in and around the northern main urban area, showing a trend of “inward contraction”. Forest land, garden land, grassland, cultivated land and water area have a positive impact on ecological environmental quality, while traffic land, construction land and other land have a negative impact on ecological environmental quality. The response of ecological environmental quality to different land use transfer modes is related to the change of the overall ecological environmental quality. The interaction between land use and land cover change (LUCC) and other factors had a great impact on the evolution of ecological environmental quality in Longnan City.

1. Introduction

The impact of climate change and strong human activities on the ecological environment is enormous [1,2], China’s complex topography and climate system, which is greatly affected by climate change, coupled with a large population, the pressure on the ecosystem has subsequently increased, and the strengthening of ecological governance is an important measure to slow down the ecological pressure and improve the quality of the ecological environment. In order to promote the construction of an ecological civilization and the efficient and rational allocation of national land space, ecological restoration has been implemented in most areas of China, and the quality of the ecological environment has significantly improved [3]. In this context, the influence of the ecological environment in the new urbanization, land space planning and other aspects gradually expand and account for the formation of constraints on it [4,5,6,7]. On the one hand, the development and utilization of national land space usually cause land use transfer [8,9], land types such as agricultural land and ecological land are squeezed, resulting in the gradual deterioration of ecological environmental quality [10,11]. On the other hand, the land transfer caused by the implementation of measures such as returning farmland to forests and lakes will improve the local vegetation cover and ecological environmental quality [12,13,14]. The impacts of the two land use transfer processes on ecological environment changes show heterogeneity. Therefore, exploring the response mode of ecological environmental quality change to land use transfer can help the adjustment of local land use structure and improve regional ecological environmental quality. Relevant studies have proved that land use efficiency [15,16] and land cover change [17] will have a direct impact on ecological efficiency and the ecological landscape, and urban expansion [18] will have a negative impact on the ecological environment. And these effects tend to work in both directions, with ecological quality also reacting to socio-economic factors such as regional economy [19], residents’ well-being [20], and urban development [21].
The most direct way to evaluate the regional ecological environmental quality is to calculate the ecological index. For example, ecological index (EI) [22], remote sensing ecological index (RSEI) [23], city ecological index (CEI) [24] and other quantitative evaluation methods are used to calculate regional ecological environmental quality. Methods such as principal component analysis [25], geo-detector model [26], and improved remote sensing eco-index [27] are also widely used to evaluate the ecological environmental quality. Yan et al. [25] applied the PCA method to detect the factors influencing the ecological environmental quality of the urban agglomerations in the northern slopes of Tianshan Mountain, and the results showed that the degree of influence of land use/land cover (LULC) is high. Lai et al. [26] applied the geo-detector model with the RSEI model to Pingtan Island, Songming County (China), and Yoshkar-Ola (Russia), to analyze and construct the ecological security pattern, and the results showed that drought is the biggest factor affecting the ecological environmental quality, and that it influences the ecological security pattern. Zhang Wei and other scholars [27] introduced the salinity index (CSI) and water network density (WND) ecological environment evaluation model to evaluate the ecological environment of China’s arid zones, which showed that the improved ERSEI can fully characterize the surface details of arid zones. RSEI has been widely used in the study of changes in ecological environmental quality because of its objectivity [28], and Zhang [29], Yuan [30], Zhang [31], Yuan [32] have used RSEI to analyze the changes of regional ecological environmental quality and its potential influencing factors, and the study shows that natural factors such as elevation, slope, vegetation cover, and average annual temperature, and anthropogenic factors such as land use and town construction have an impact on the ecological environment. Li [33] and Xu [34] used RSEI to evaluate urban ecological environmental quality, and the study shows that impermeable surfaces are not the most important factors for urban ecological environment quality. This study also showed that impervious surfaces have an impact on the quality of the urban ecological environment and the living environment.
Nanling Mountain is an important part of the hilly mountain belt in southern China, mainly developing subtropical evergreen broad-leaved forest and coniferous forest, with rich biodiversity. Artificial forests account for a high percentage of the area, with a single forest species and low forest quality, and urban construction and mining development have led to biodiversity damage and deterioration of ecological environmental quality. Longnan City is an important part of Jiangxi Province’s soil-preservation and water-source conservation area, with rich vegetation types, forming a distinctive comparison with the single plantation forest species in the Nanling Mountains. Previously, few studies have been conducted on the relationship between ecological quality and land use transfer in the Nanling Mountain area, especially in Longnan City. Therefore, exploring the response pattern of ecological environmental quality to land use transfer in Longnan City can help to map out the causes of ecological environment changes in Longnan City, with a view to providing reference for ecological protection and restoration in other counties of the Nanling Mountainous Region. However, most of the current studies explore the pattern of land use as a single factor on ecological environmental quality [35,36,37], explaining the mechanism of action between the two at a qualitative level, and reporting the response pattern of ecological environmental quality to land use transfer in the study area; few scholars have conducted fieldwork in the study area, explored ecological environment indices of different land classes, and classified the land classes into directions.
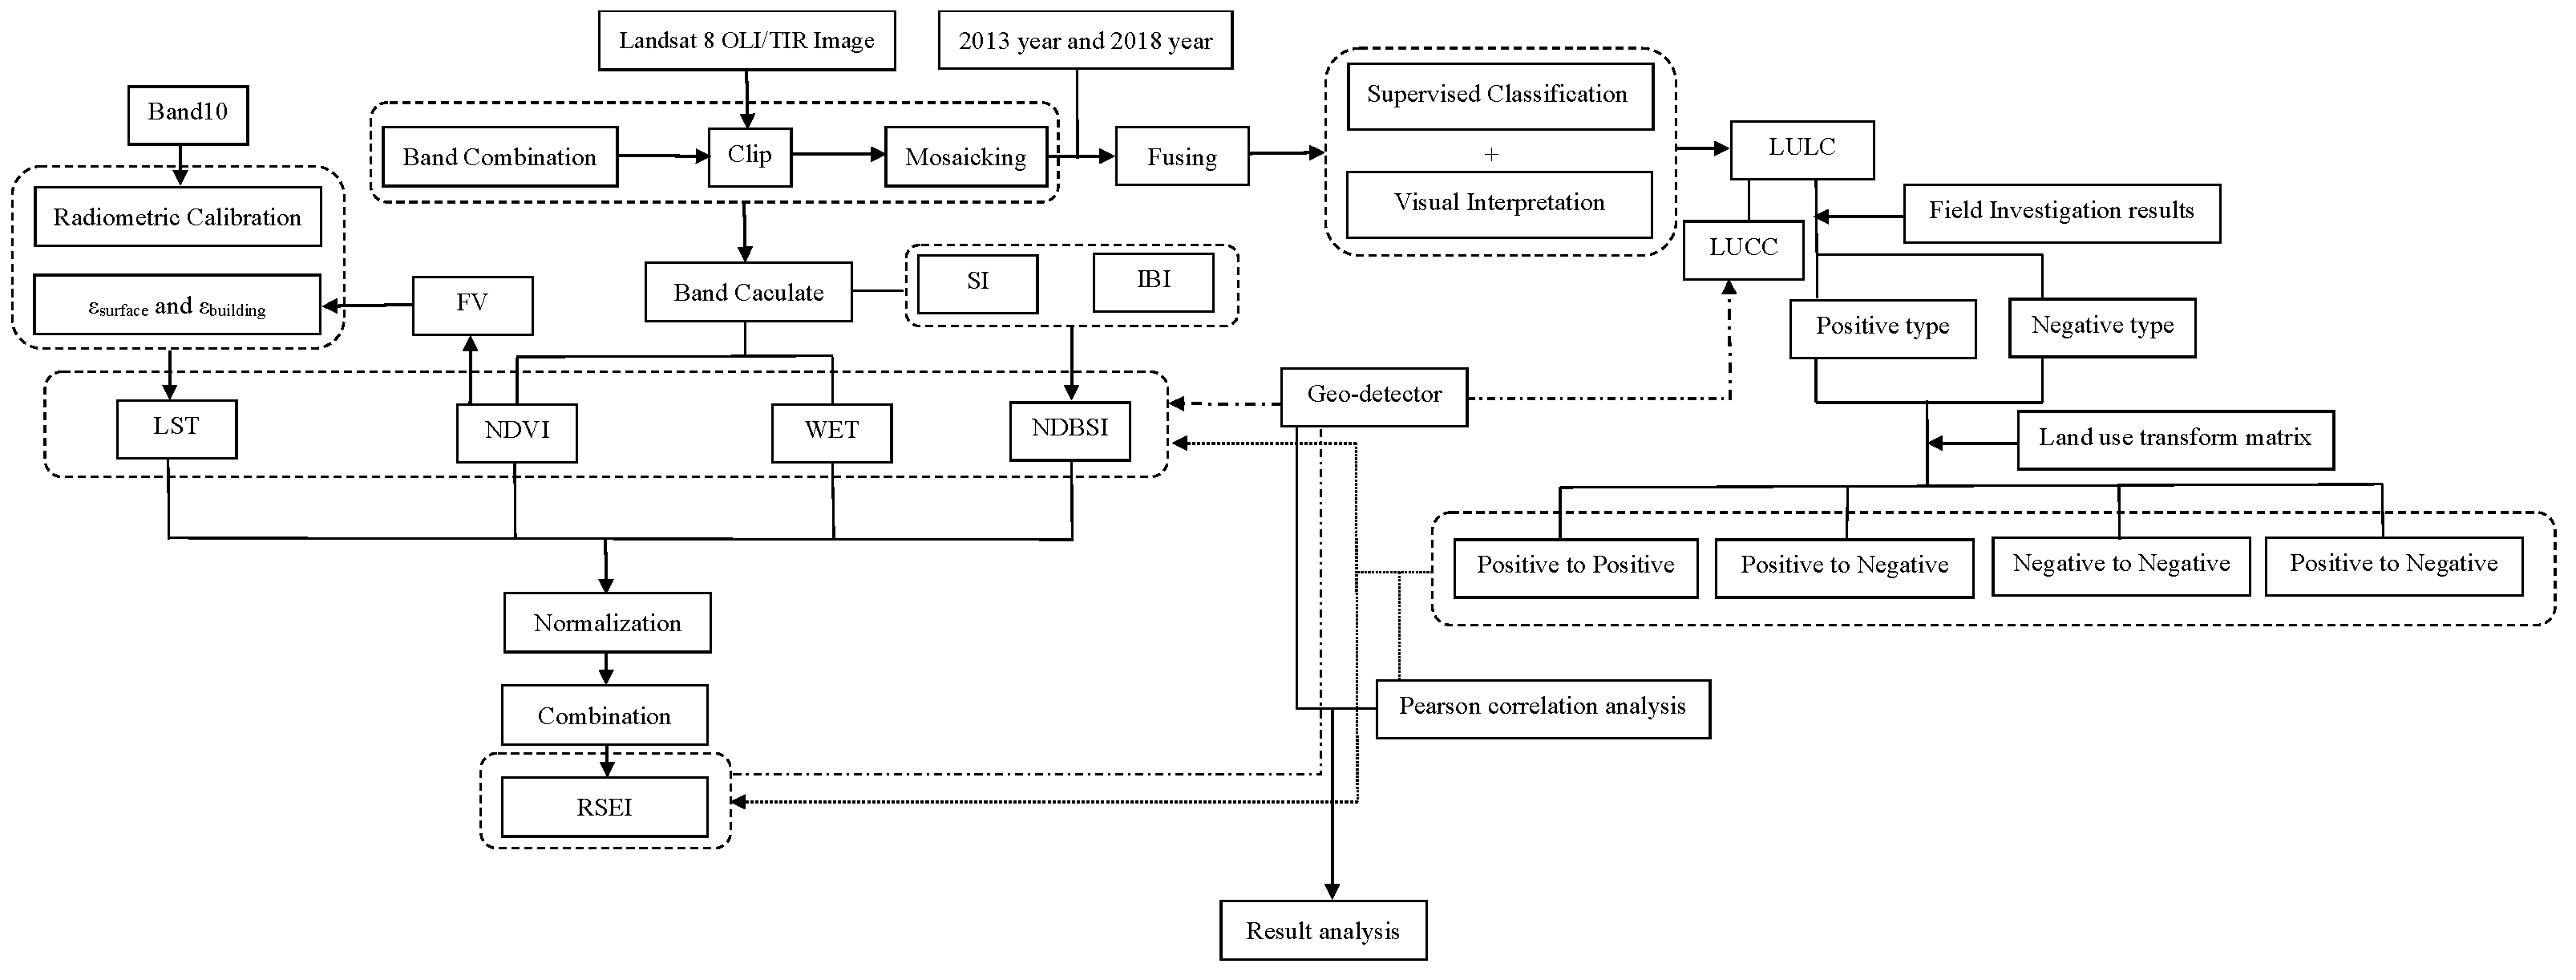
In this study, the ecological environmental quality of Longnan City was evaluated by obtaining three remote sensing images of Longnan City in 2013, 2018 and 2023, and calculating the RSEI index. On this basis, combined with the results of fieldwork, the land use types were divided into two directions: positive land types that promote the ecological environment and negative land types that hinder the ecological environment. By calculating the Pearson’s correlation coefficient to explore the degree of correlation between the evolution of ecological environmental quality and land use transfer, and using a geo-detector to explore the spatio-temporal relationship between land use transfer and ecological environment evolution, the spatio-temporal response pattern of the ecological environmental quality of Lonan City to land use transfer was further explored. The research results provide an important perspective for understanding the relationship between ecological environment and land use, and also provide a scientific basis for mountain ecological protection and restoration.

2. Materials and Methods

2.1. Study Area

Longnan City is located in the southernmost part of Jiangxi Province (Figure 1), in the subtropical humid monsoon climate zone, covering an area of 1641 km2. The territory is rich in natural resources, the forest coverage rate of the whole area is as high as 81.42%, the soil is dominated by red soil, and there are five first-level tributaries of the Ganjiang River, for example the Taojiang and the Lianjiang. Longnan City belongs to the soil and water conservation area of the Nanling mountains and hills in Jiangxi Province, which has an excellent ecological environment. Unlike other areas in the Nanling Mountains where there is a single species of plantation forest, Longnan City is characterized by evergreen broad-leaved forests, mixed coniferous and broad-leaved forests, coniferous forests, thickets, mountain meadows and other natural vegetation, and has a favorable ecological environment. However, in recent years, the urban expansion of Longnan City inevitably occupied part of the ecological land around the town, which posed a potential threat to the quality of its ecological environment.

2.2. Data Processing

In this study, through the preprocessing of remote sensing images, combined with machine learning and visual interpretation, the land use is classified, the RSEI is calculated by ENVI 5.3 software, and the spatio-temporal response pattern of ecological environment quality to land use transfer in Longnan City is comprehensively analyzed through the test of Pearson’s correlation coefficient and the geodetector model. The specific process is shown in Figure 2.
Remote sensing data acquired in this study (Table 1) were obtained from Geospatial Data Cloud (https://www.gscloud.cn/search accessed on 16 March 2018) and Alibaba Cloud AI Earth Platform (https://engine-aiearth.aliyun.com accessed on 21 March 2023). Three-phase Landsat 8 OLI/TIRS image data, of which the C2 L1 level data are for 2013 and 2018, and the C2 L2 level data are for 2023, and the spatial resolution of all of them is 30 m, the cloudiness of all of them is lower than 10%. The 2023 land use data were obtained from the National Soil and Water Conservation Survey Project, and the 2018 and 2013 land use data were obtained from supervised classification (Random Forest Algorithm [38]) with visual interpretation, based on random sampling, 70% of the samples were used for training, and 30% were used for the confusion matrix to compute the classification accuracy [39], with Kappa coefficients in 2018 and 2013 being 0.92 and 0.88 respectively, both of which meet the required accuracy. In this study, the first-level land class classification system was adopted, and combined with the actual situation of the study area, the land use types were divided into eight categories of cultivated land, garden land, forest land, grassland, built-up land, traffic land, water area and other land (Table 2).

2.2.1. Remote Sensing Ecological Index

The remote sensing ecological index (RSEI) is composed of four main indicators: greenness, humidity, dryness and heat [23]. The results of the calculation of ESRI and its related indicators are shown in Figure 3. The calculation process is as follows:
(1)
Greenness index. In this study, the normalized vegetation index (NDVI) was used to characterize the greenness index, as shown in Formula (1):
N D V I = ( B 5 B 4 ) / ( B 5 + B 4 )
In Formula (1), B5 is the near-infrared band and B4 is the red band.
(2)
Humidity index. The humidity index was calculated using the OLI image calculation method [40] (obtained by referring to indexdatabase https://www.indexdatabase.de/, accessed on 12 October 2023), as shown in Formula (2).
W E T = 0.1511 × B 2 + 0.1973 × B 3 + 0.3283 × B 4 + 0.3407 × B 5 0.7117 × B 6 0.4559 × B 7
In Formula (2), B2, B3, B4, B5, B6 and B7 are respectively blue band, green band, red band, near infrared band, short-wave infrared 1 and short-wave infrared 2.
(3)
Dryness index. The dryness Index is represented by the average value of soil index (SI) and urban building index (IBI) [41,42].
N D B S I = ( S I + I B I ) / 2
S I = [ B 6 + B 4 B 2 + B 5 ] / [ B 6 + B 4 + ( B 2 + B 5 ) )
I B I = [ 2 B 6 / ( B 6 + B 5 ) B 5 / ( B 5 + B 4 ) B 3 / ( B 3 + B 6 ) ] / [ 2 B 6 / ( B 6 + B 5 ) + B 5 / ( B 5 + B 4 ) + B 3 / ( B 3 + B 6 ) ]
In Formula (4), B2, B4, B5 and B6 are respectively blue band, red band, near infrared band and short-wave infrared. In Formula (5), B3, B4, B5 and B6 are respectively green band, red band, near infrared band and short-wave infrared.
(4)
Heat index. In this study, the inverse function of Planck’s formula is utilized to calculate the heat metrics for the Landsat 8 B10 band [36,37], as shown in the following equations:
L λ = [ ε · B ( T S ) + ( 1 ε ) L ] · τ + L  
TS = K_2/[K_1∙B_i (TS) + 1]
In Formulas (6) and (7), Lλ is the radiant brightness value in the thermal infrared band, ε is the surface emissivity, B(TS) is the thermal radiant brightness of the blackbody at the true temperature of the surface (TS) derived from Planck’s law, τ is the transmittance rate of the atmosphere in the thermal infrared band, and L↑ and L↓ are the atmospheric upward radiant brightness and atmospheric downward radiant brightness, respectively (available on the official website of NASA at https://www.nasa.gov/ accessed on 11 November 2023) the imaging time and the center latitude and longitude can be checked) for OLI images: K1 is 1321.08 W/m2, K2 is 774.89 W/m2.
ε s u r f a c e = 0.9625 + 0.0615 F V 0.0461 F V 2
ε b u i l d i n g = 0.9589 + 0.086 F V 0.0671 F V 2
In Formulas (8) and (9), εsurface and εbuilding are the ratio radiation of natural surfaces and towns, respectively, and FV is the vegetation cover.
F V = ( N D V I N D V I S ) / ( N D V I V N D V I S )
In Formula (10), NDVIS = 0.00 and NDVIV = 0.70; and the FV value is taken to be 1 when the NDVI value of an image element is greater than 0.70, and the FV value is taken to be 0 when the NDVI value of an image element is less than 0.00.
(5)
Remote sensing ecological index. After calculating each indicator according to Formulas (1)–(10), resampling of each indicator is processed to 30 m. In order to eliminate the influence of indicator direction, it is necessary to normalize the indicator.
N I i = ( I i I m i n ) / ( I m a x I m i n )
In Formula (11), NIi is the index value after normalization, Ii is the value of this index at pixel i, Imin is the minimum value of this index, and Imax is the maximum value of this index.
In this study, the RSEI model proposed by Xu [28] was adopted to calculate the RSEI index.
R S E I 0 = 1 P C I f N D V I , W E T , N D B S I , L S T
R S E I = ( R S E I 0 R S E I 0 m i n ) / ( R S E I 0 m a x R S E I 0 m i n )
In Formulas (8) and (9), RSEI0 is the initial RSEI value synthesized by the main component, and RSEI is the RSEI index after normalization treatment, ranging from 0 to 1. The higher the RSEI index is, the better the ecological environmental quality is. RSEI0 min is the minimum value of RSEI0, and RSEI0 max is the maximum value of RSEI0.

2.2.2. Pearson Correlation Coefficient

The Pearson correlation coefficient is used to describe the degree of correlation between two variables. In this study, the Pearson correlation coefficient was used to explore the correlation degree between four indicators (NDVI, WET, NDBSI and LST) and RSEI. The calculation method was referred to the explanation of the Pearson correlation coefficient by Xu Jianhua [43].
  r x y = [ i = 1 n ( x i x ¯ ) ( y i y ¯ ) ] / i = 1 n ( x i x ¯ ) 2 i = 1 n ( y i y ¯ ) 2
In equation (14), rxy is the correlation index among the factors.

2.2.3. Land Use Change Analysis

(1)
Land use transfer matrix
The land use transfer matrix is used to analyze the process of land use transfer [44]. In this study, the superposition analysis module of ArcGIS 10.6 software was used to calculate the land use transfer matrix of Longnan City [45,46].
B = B 11 B 12 B 1 n B 21 B n 1 B 22 B n 2 B 2 n B n n
In Formula (15), Bij is the area of land use type i transformed into land use type j; n is the number of land use types.
(2)
Land use transfer flow
The land use transfer flow [47] is a vector attribute used to represent land use change, divided into “inflow flow” and “outflow flow”, and the difference between inflow flow and outflow flow is the net value of land transfer flow. When the net value is greater than 0, it means net inflow, and vice versa. The calculation is as follows:
L f = L i n + L o u t
L n f = L i n L o u t
In Formulas (16) and (17), Lf is the land use transfer flow, Lout is the transfer flow, Lin is the transfer flow, and Lnf is the net value of land transfer flow.
(3)
Single land use dynamic attitude
By calculating the dynamic attitude of single land use, it can reflect the change of the quantity of certain land use types in a certain time in the study area. See the following formula:
K = L n f U a i × 1 T × 100 %
In Equation (18), K is the dynamic attitude of single land use, Uai is the land use area of a certain type in year A, and T is the time period of land use change. In this study, T has a value of 5.

2.2.4. Spatial Autocorrelation Analysis

(1)
Global spatial autocorrelation
The global Moran’s I index is used to reflect the similarity of the attribute values of the unit in the space region [43]. It takes values in the following range: −1 < Moran’s I < 1. When the Moran’s I index is less than 0, it indicates a negative correlation; a value equal to 0 indicates no correlation; a value greater than 0 indicates a positive correlation.
I = n i = 1 n j = 1 n w i j ( x i x ¯ ) ( x j x ¯ ) n i = 1 n j = 1 n w i j ( x i x ¯ ) 2
(2)
Local spatial autocorrelation
The local Moran’s I describes the degree of correlation between local spatial units in a region. As follows:
I i = n ( x i x ¯ ) j w i j ( x j x ¯ ) i ( x i x ¯ ) 2
In Equations (19) and (20), wij is the space weight, n is the total number of space units, xi and xj are the observed values of region i and region j, and x ¯ is the average value of attributes of all space units.

2.2.5. Geographical Detector

Geodetector is a statistical method to explore spatial differentiation and explain the driving factors behind it [48]. In this study, factor detector and interactive detector were used to explore the relationship between the evolution trend of ecological environmental quality and land use transfer in Longnan City. The value of q indicates the extent to which attribute Xi explains the spatial differentiation of attribute Y [49]. The larger the value of q, the more obvious the spatial differentiation of Y. Its calculation is shown in the following formula:
q = 1 h = 1 L N h σ h 2 N σ 2 = 1 S S W S S T
In Formula (21), q ∈ [0,1]; SSW and SST are the sum of intra-layer variance and the total variance of the whole region, respectively. h = 1,… L is the number of layers of influence factor X in the study area; Nh is the number of units in layer h, and N is the number of units in the whole area. σ h 2 is the variance of Y in layer h, and σ 2 is the variance of Y in the study area.

3. Results

3.1. Temporal and Spatial Changes of Ecological Environmental Quality

3.1.1. Interannual Change of Ecological Environmental Quality

According to the ecological environmental quality classification standard issued by the National Environmental Protection Standard (HJ192-2015), the ecological environmental quality of Longnan City is divided into five levels, as shown in Table 3.
According to the classification standard, the ecological environmental quality of Longnan City was classified and measured, and the results are shown in Table 4. The mean values of the remote sensing ecological index of Longnan City in 2013, 2018 and 2023 were 0.789, 0.917 and 0.872, respectively, and the ecological environmental quality showed a trend of “first rising and then decreasing”.
The areas of poor ecological environment of Longnan City in 2013, 2018 and 2023 were 144.81 km2 (accounting for 8.759%), 6.815 km2 (0.414%) and 18.48 km2 (1.123%), respectively. The areas of fair ecological environmental quality were 73.1 km2 (4.441%), 31.223 km2 (1.897%) and 49.46 km2 (3.005%), respectively. The areas of the region with moderate ecological environmental quality were 221.634 km2 (13.464%), 79.431 km2 (4.825%) and 130.89 km2 (7.951%), respectively. The areas of the region with good ecological and environmental quality were 498.371 km2 (30.274%), 403.883 km2 (24.535%) and 570.077 km2 (34.63%), respectively. The areas with excellent ecological environmental quality were 708.894 km2 (43.063%), 1124.827 km2 (68.33%) and 877.273 km2 (53.291%), respectively.
In general, from 2013 to 2023, the poor ecological environment area, poor ecological environment area and general ecological environment area of Longnan City showed a downward trend. The area of good ecological environment and excellent ecological environment showed an increasing trend. The peak values of the area with poor ecological environmental quality and the area with excellent ecological environmental quality appeared in 2013 and 2018 respectively.

3.1.2. Temporal and Spatial Evolution of Ecological Environmental Quality

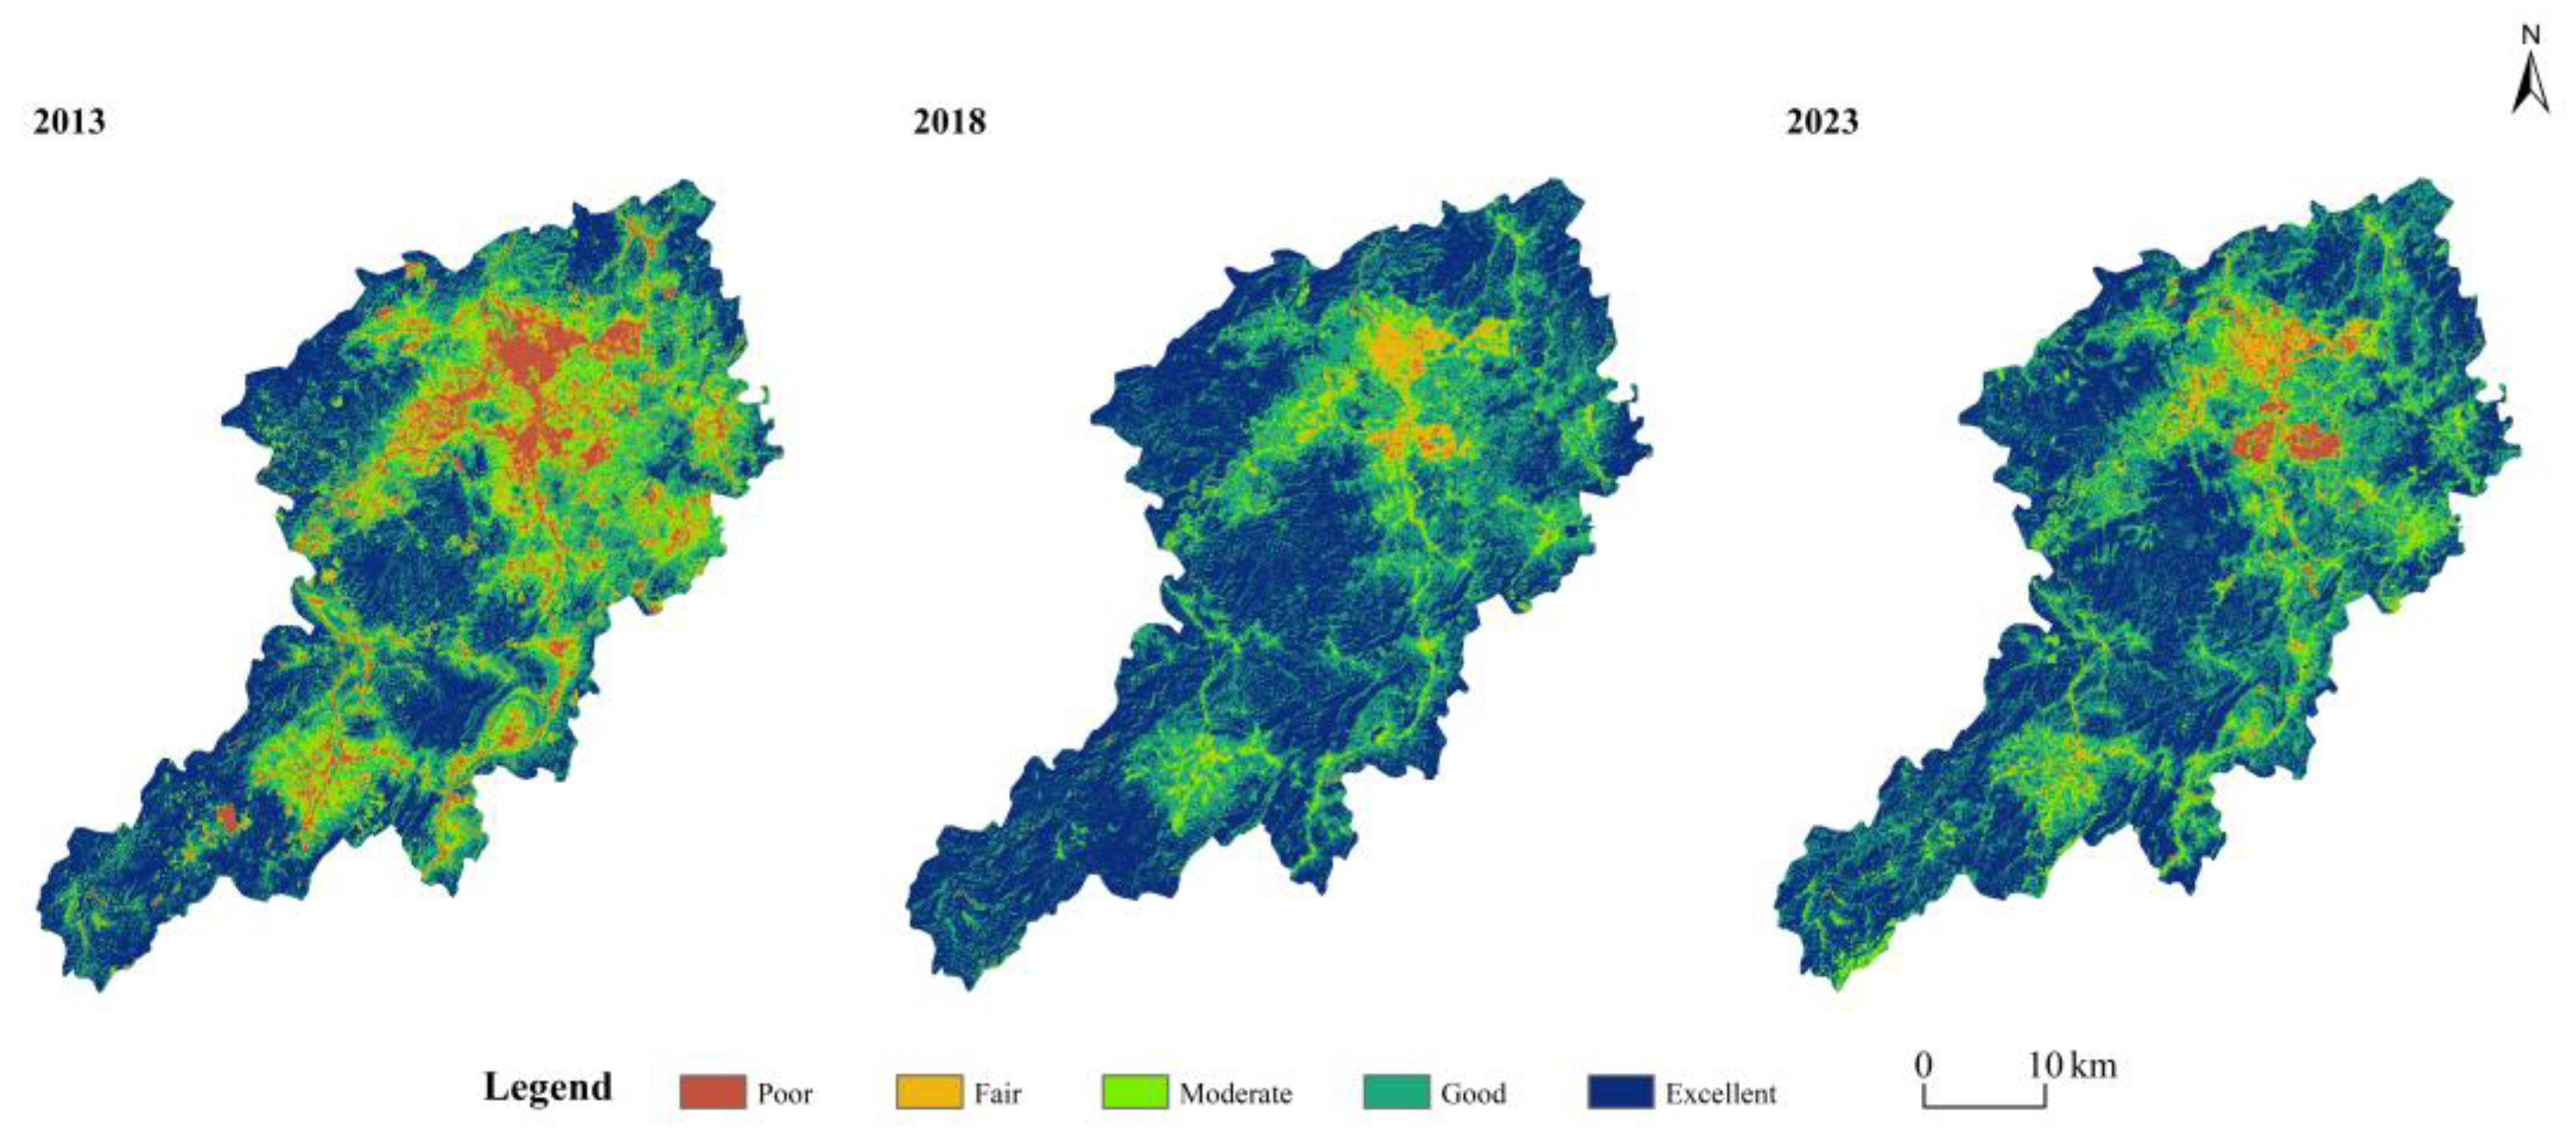
The spatial distribution of ecological and environmental quality in Longnan City from 2013 to 2023 is shown in Figure 4. The ecological and environmental quality in the northern part of Longnan City is significantly lower than that in the southern part in the three periods. The area of poor ecological environmental quality is concentrated in the main urban area and its surrounding area. From 2013 to 2023, the scope of this area shows the characteristics of “inward contraction”. The regions with good ecological environmental quality are distributed in the southwest and central regions with wide forest cover, but the ecological environmental quality of the two regions increased first and then decreased due to the influence of human activities.
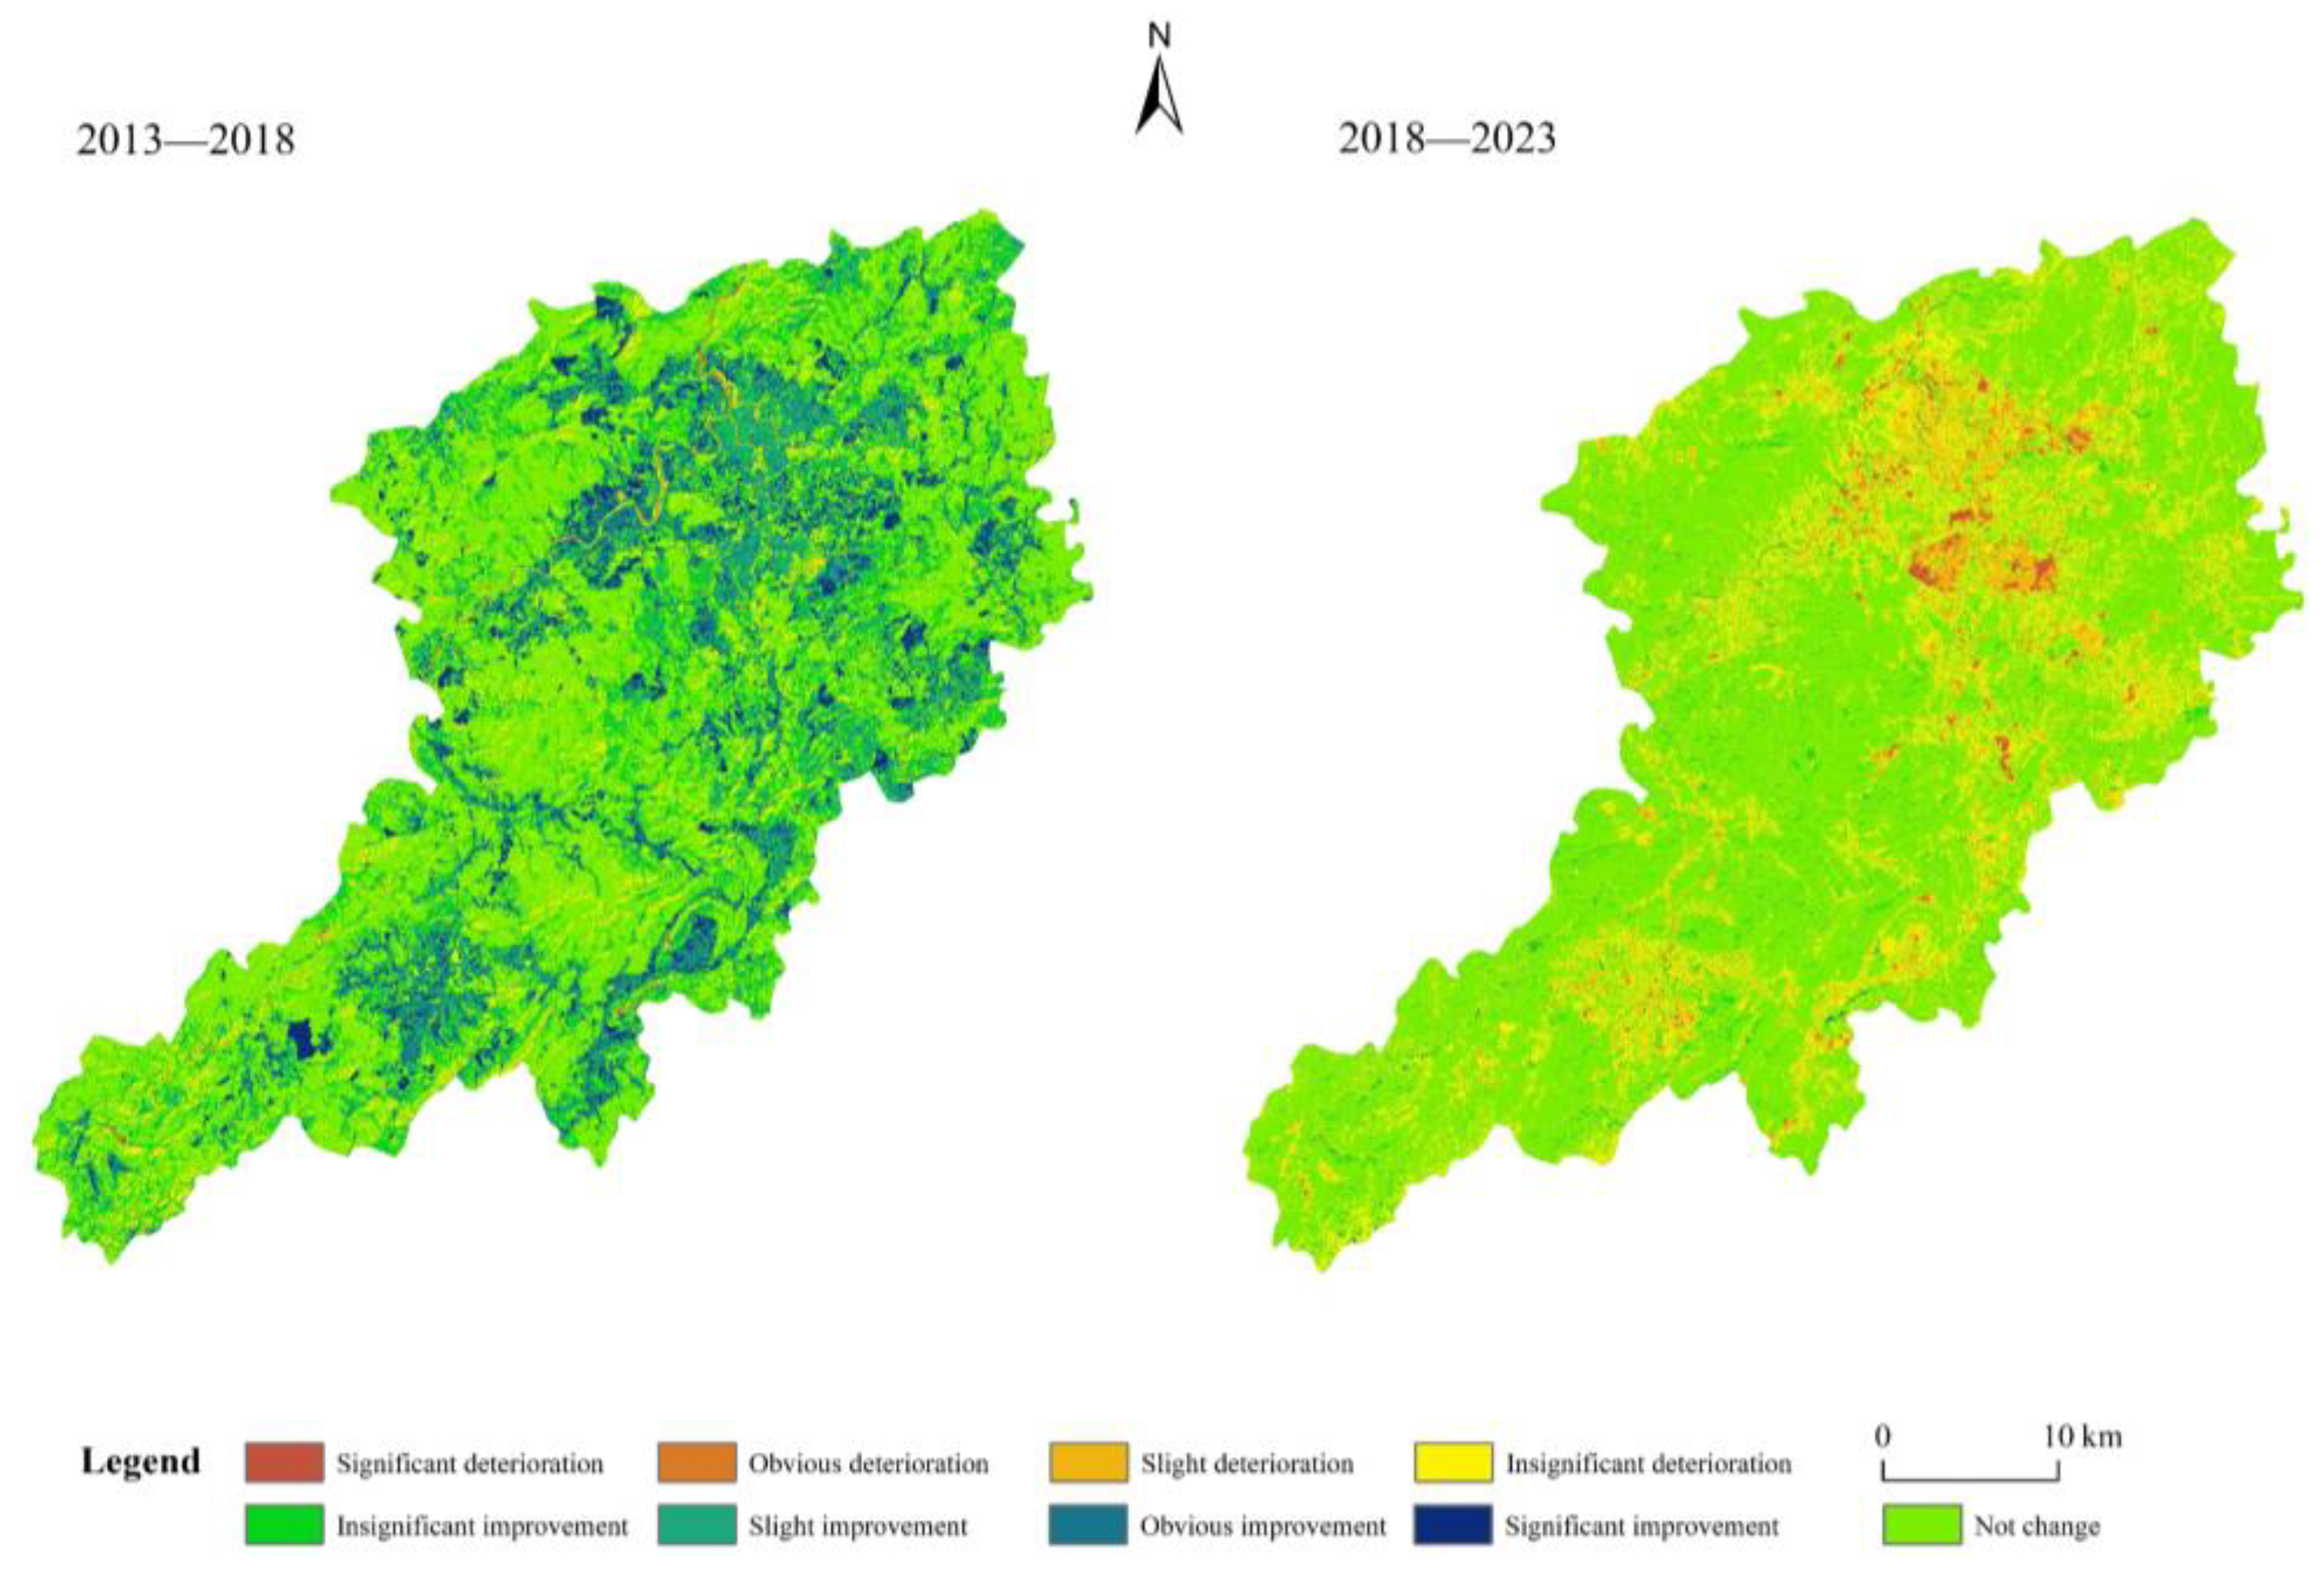
In order to explore the change of ecological environmental quality in Longnan City, this study processed the difference between the two periods of data before and after, and obtained the spatio-temporal differentiation of ecological environment change in the two periods (from 2013 to 2018 and from 2018 to 2023), as shown in Figure 5. As can be seen from Figure 4, the change of ecological environmental quality in Longnan City showed a strong spatial difference between the two periods. The change of ecological environmental quality in the north was significantly greater than that in the south, and the change was mainly distributed in the main urban area of Longnan City and its surrounding areas. From 2013 to 2018, the ecological environmental quality of Longnan City showed an overall trend of improvement, and there were two obvious improvement areas in the southern and northern regions respectively. From 2018 to 2023, the ecological environmental quality of Longnan City remained unchanged on the whole, but the ecological environmental quality of the northern main urban area showed obvious deterioration, which may be related to the expansion of the main urban area and the occupation of ecological land.
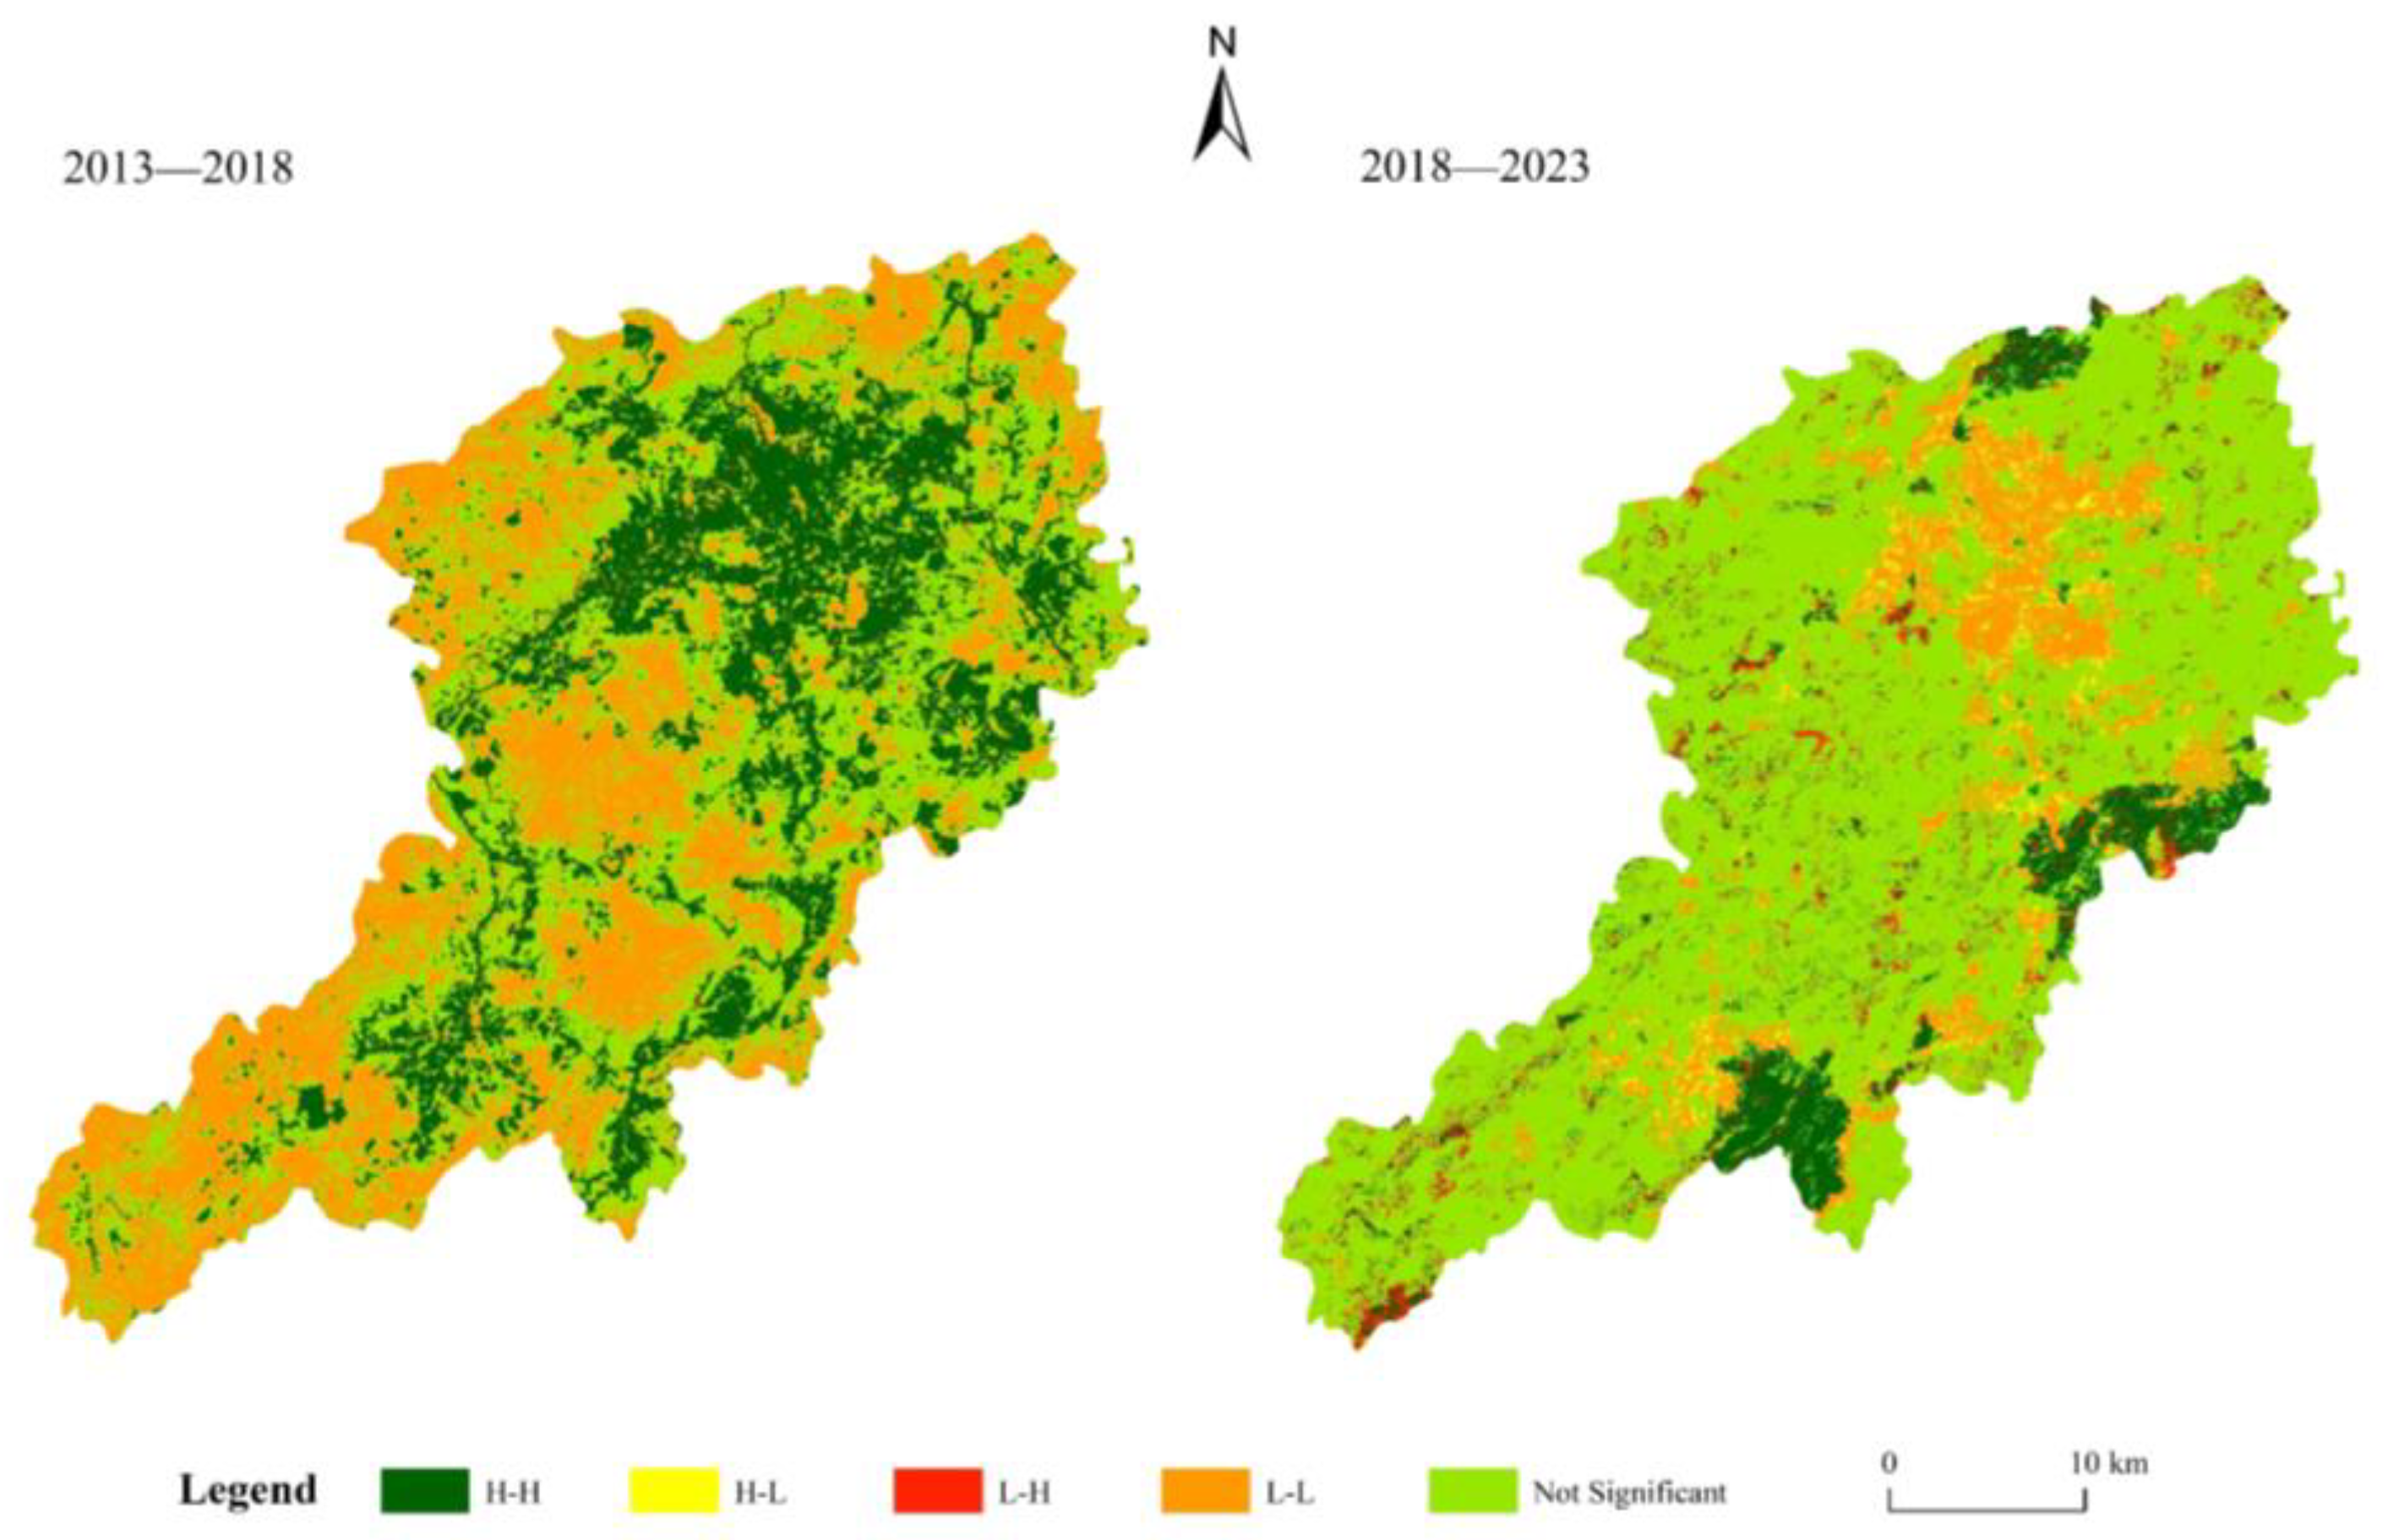
It is not difficult to see from the global Moran’s I index of Longnan City (Table 5) and the local spatial autocorrelation LISA clustering diagram (Figure 6) in the two time periods calculated by spatial autocorrelation: (1) The RSEIi global Moran’s I index of Longnan City in the two periods were −0.13 and 0.28, and both passed the p < 0.05 test. The results showed that the change pattern of ecological environmental quality in Longnan City showed negative spatial correlation from 2013 to 2018, and positive spatial correlation from 2018 to 2023. The global Moran’s I index increased significantly, indicating that from 2013 to 2023, the spatial agglomeration of ecological environmental quality in Longnan City increased significantly. (2) From 2013 to 2018, the changes of ecological environmental quality in Longnan City were mainly high-high clustering (ecological environmental quality improved) and low-low clustering (ecological environmental quality did not change significantly). The high-high cluster area is concentrated in and around the northern main urban area, and the low-low cluster area is distributed in most forest covered areas of Longnan City. (3) From 2018 to 2023, the changes of ecological environmental quality in Longnan City are mainly high-high clustering (ecological environmental quality becomes better), low-low clustering (ecological environmental quality becomes worse) and not significant (no significant changes). Low-low cluster areas are concentrated in and around the main urban area, while high-high cluster areas are distributed in a few areas in the north, east and south of Longnan City. The non-obvious area is almost all over the whole area of Longnan City, and the area is mostly forest-covered area.

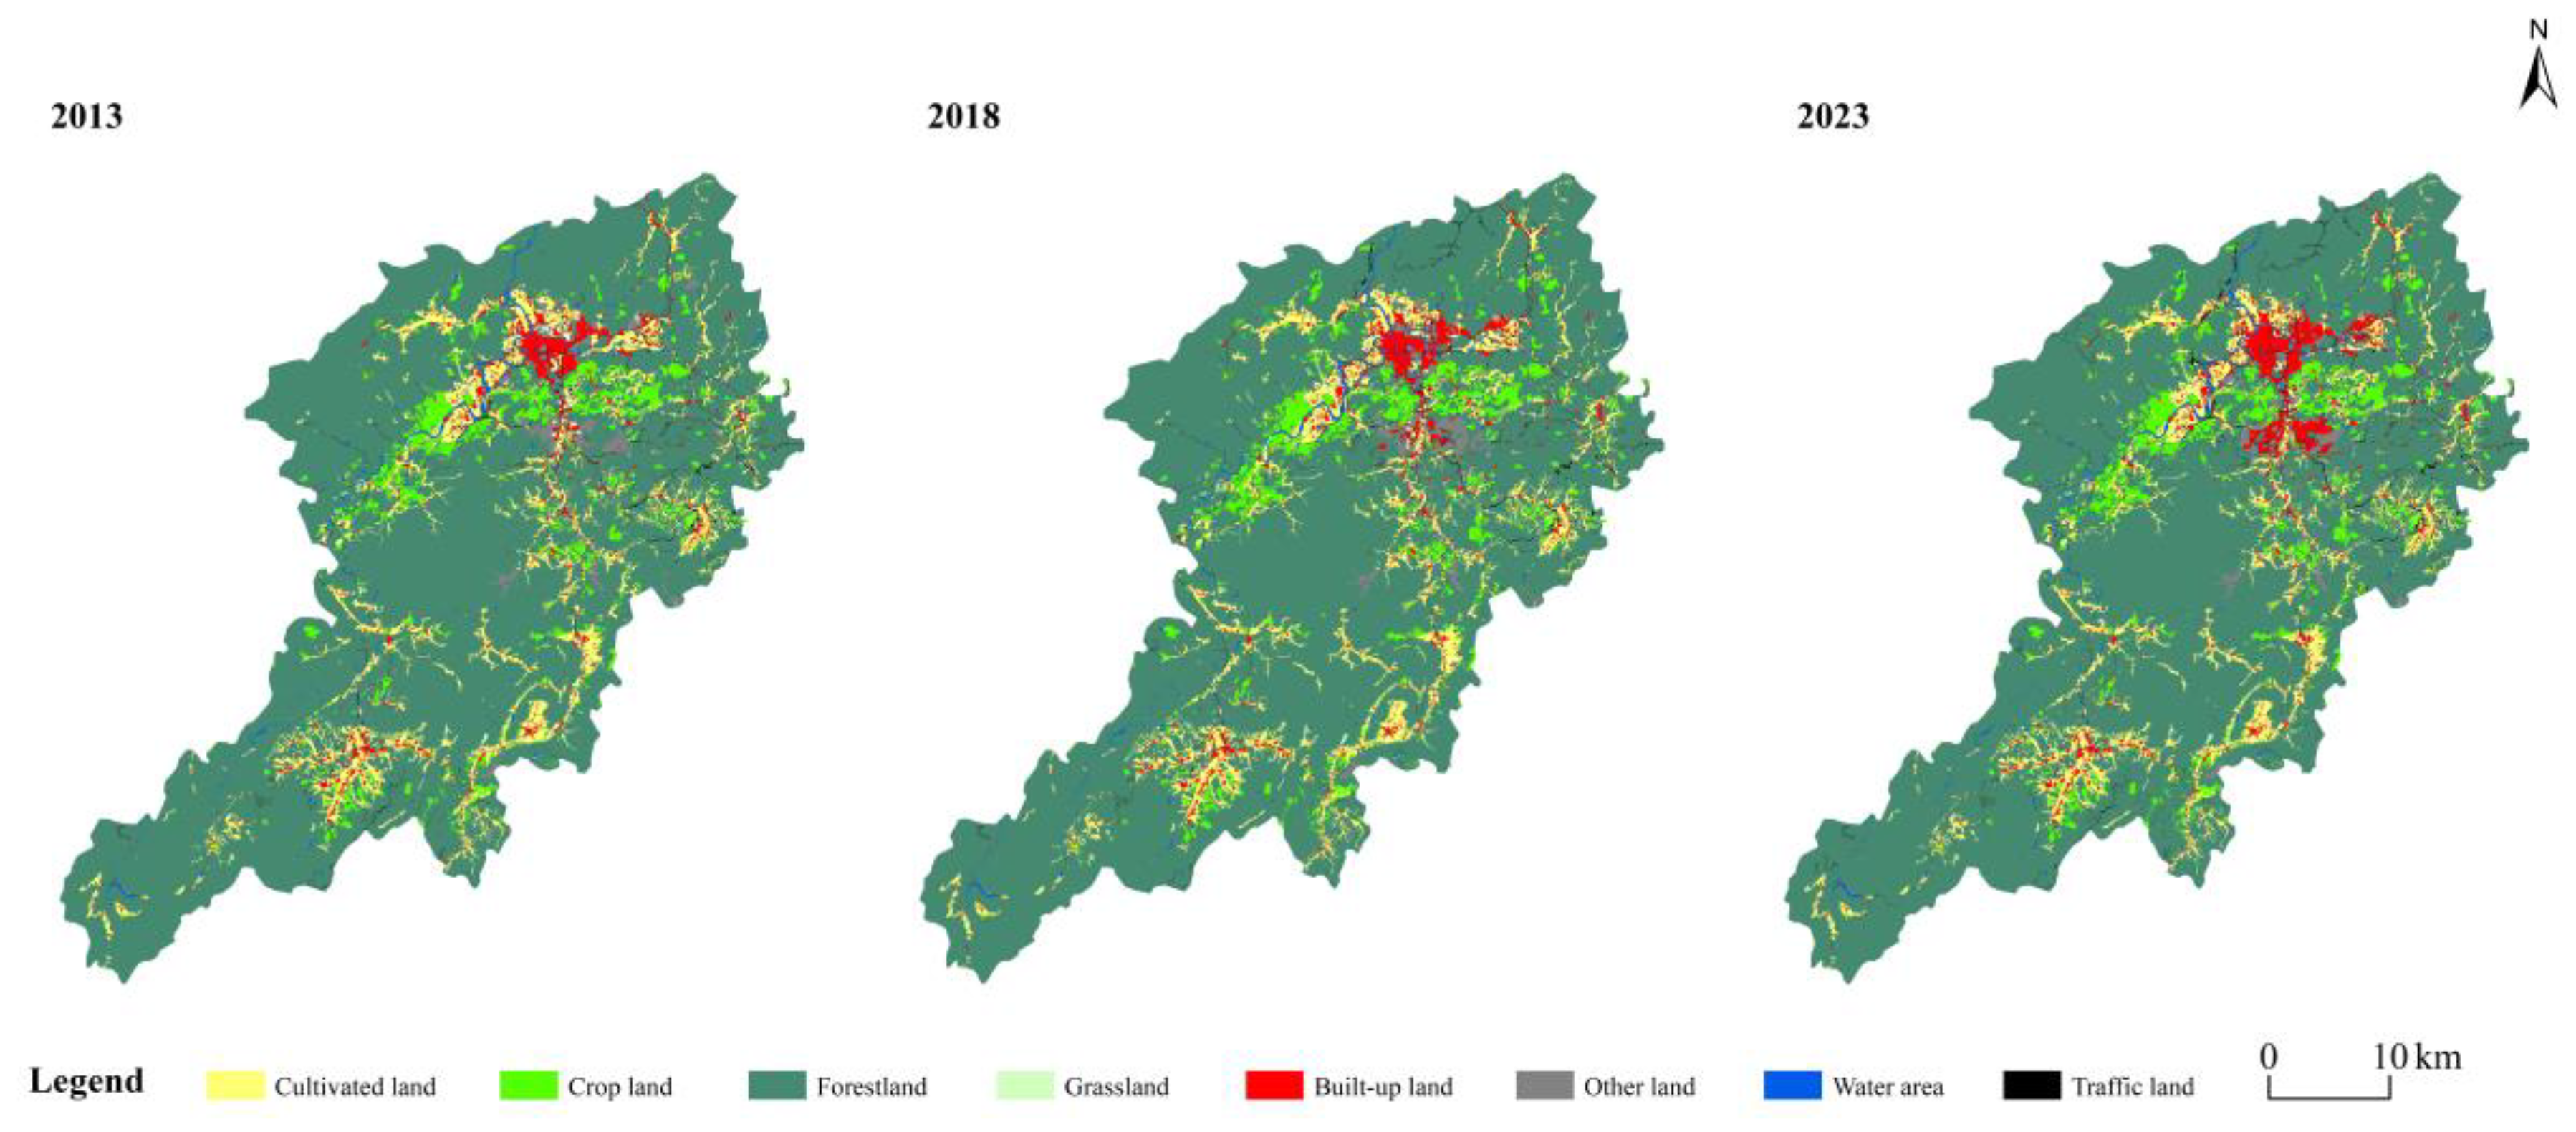
3.2. Land Use Transfer Characteristics

According to the national land classification standard, the land use type of Longnan City is divided into eight types: cultivated land, garden land, forest land, grassland, construction land, traffic land, water body and other land (mainly man-made disturbance land). By counting the area of each category in each year (Table 6) and calculating the land use transfer matrix for the two time periods (Table 7 and Table 8, Figure 7), the following results were obtained.
The transfer of the above eight types of land use types in the 10 years from 2013 to 2023 is as follows:
(1)
A total of 5.72 km2 of cultivated land was transferred in Longnan City, of which 4.64 km2 (mainly transferred to other land) was transferred from 2013 to 2018, and 3.11 km2 (mainly transferred to grassland) was transferred from 2013 to 2018; from 2018 to 2023, a total of 4.64 km2 was transferred out (mainly to other land), and a total of 0.45 km2 was transferred in (mainly to other land).
(2)
A total of 5.64 km2 of garden land in Longnan City was transferred, of which 7.18 km2 (mainly transferred from forest land) and 0.96 km2 (mainly transferred to other land) from 2013 to 2018; From 2018 to 2023, a total of 0.6 km2 was transferred (mainly from other land) and a total of 1.19 km2 was transferred (mainly from other land).
(3)
A total of 16.03 km2 of forest land was transferred out of Longnan City, of which 16.76 km2 (mainly transferred out of garden land and other land) and 5.32 km2 (mainly transferred into other land) from 2013 to 2018; from 2018 to 2023, a total of 6.7 km2 of forest land was transferred (mainly to other land), and a total of 2.12 km2 was transferred (mainly from cultivated land).
(4)
A total of 1.49 km2 of grassland in Longnan City was transferred, of which 1.61 km2 (mainly transferred to other land) and 1.02 km2 (mainly transferred to building land and other land) from 2013 to 2018; from 2018 to 2023, grassland was transferred to 1.11 km2 (mainly transferred to other land) and 0.21 km2 (mainly transferred to other land).
(5)
The building land of Longnan City increased by 13.25 km2, of which 7.09 km2 was transferred from 2013 to 2018 (mainly transferred from other land) and 4.56 km2 was transferred from 2018 to 2023 (mainly transferred from other land). A total of 11.07 km2 of building land was transferred (mainly from other land), and a total of 0.35 km2 was transferred (mainly from other land).
(6)
The transportation land of Longnan City increased by 6.24 km2, of which from 2013 to 2018, the transportation land was transferred to 4.09 km2 (mainly transferred to forest land) and 2.25 km2 (mainly transferred to forest land); from 2018 to 2023, a total of 4.53 km2 of transportation land was transferred (mainly from forest land), and a total of 0.13 km2 was transferred (to other land).
(7)
The water area of Longnan City has increased by 0.21 km2. From 2013 to 2018, the water area was transferred to 0.41 km2 (mainly transferred from other land) and 0.29 km2 (mainly transferred from cultivated land). From 2018 to 2023, the water area has been transferred to 0.22 km2 (mainly transferred from cultivated land). A total of 0.03 km2 is transferred out (transferred out to other land).
(8)
Other land use in Longnan City decreased by 2.21 km2, of which 10.41 km2 was transferred from 2013 to 2018 (mainly transferred from construction land) to 13.25 km2 (mainly transferred from forest land). From 2018 to 2023, a total of 11.99 km2 of other land was transferred out (mainly for building land), and a total of 6.94 km2 was transferred into (mainly from forest land).

3.3. Temporal and Spatial Response of Ecological Environmental Quality Evolution to Land Use Transfer

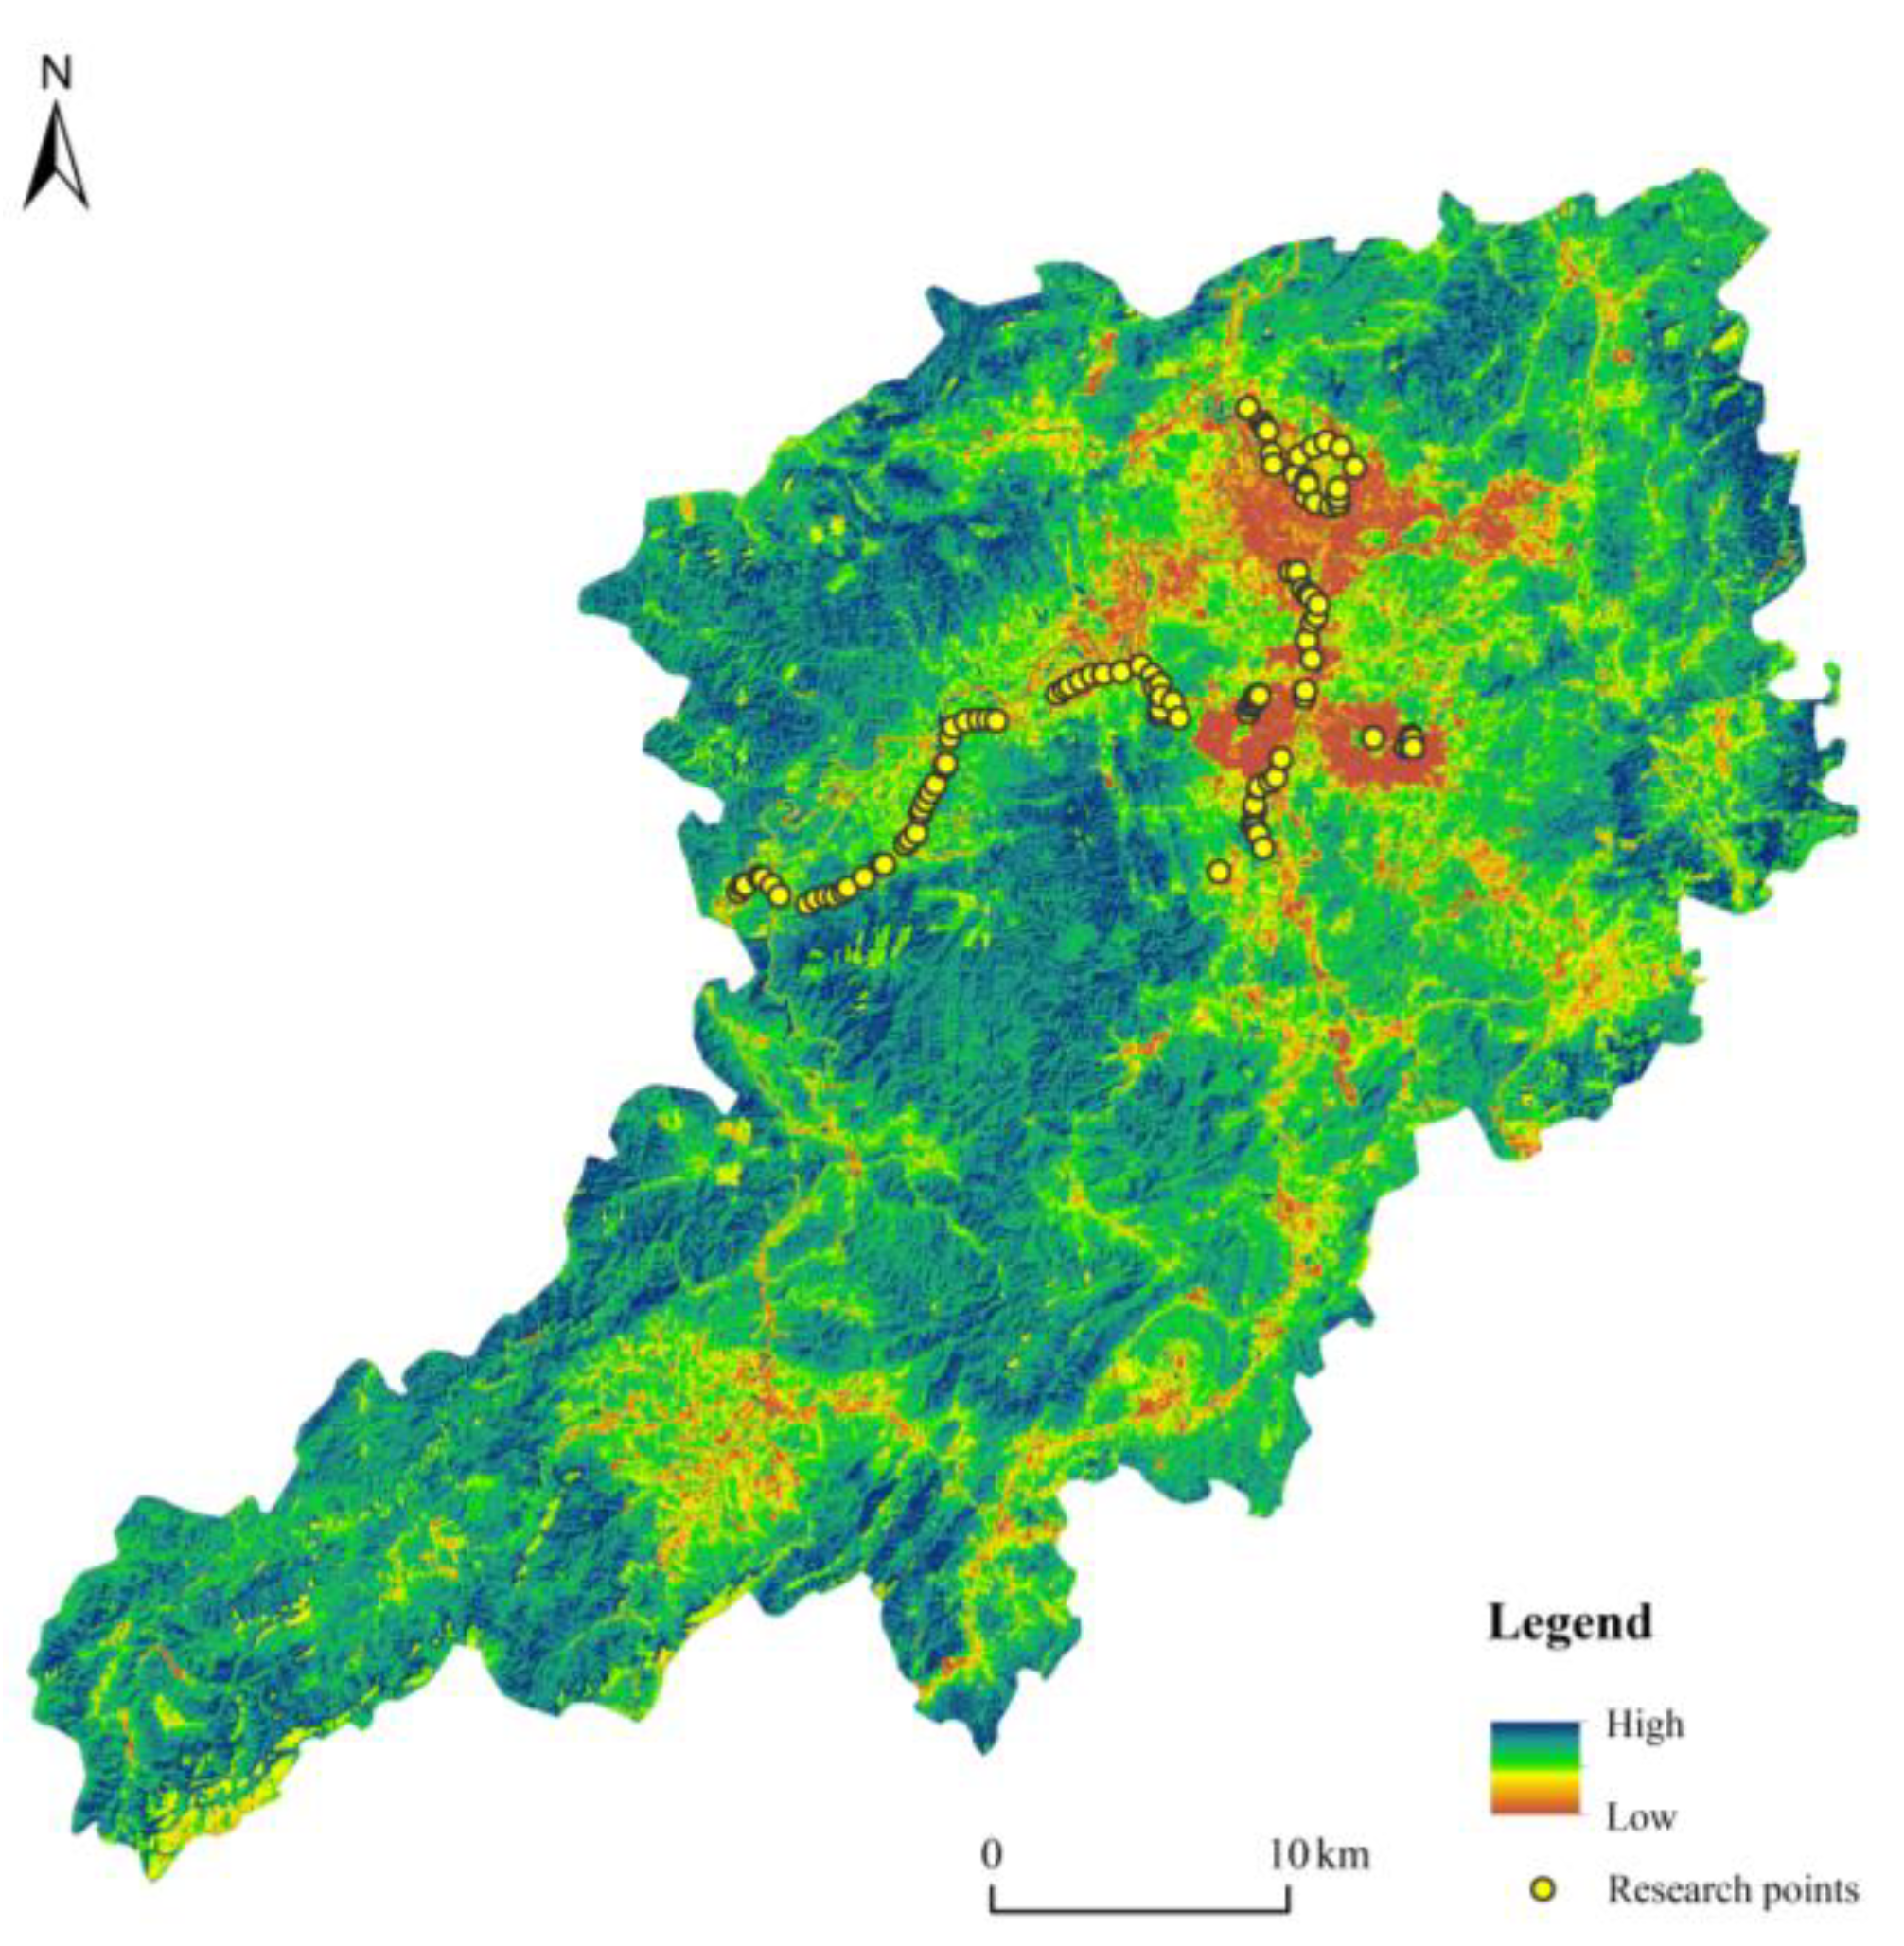
3.3.1. Correlation between Ecological Environmental Quality Evolution and Land Use Type

In order to explore the correlation degree between ecological environmental quality and land use in Longnan City, this study conducted a field investigation of Longnan City, and selected 114 points containing eight typical land classes (Figure 8) to calculate their ecological index. The results are shown in Table 9.
In order to explore the spatio-temporal response mode of ecological environment evolution to land use transfer in Longnan City, based on 
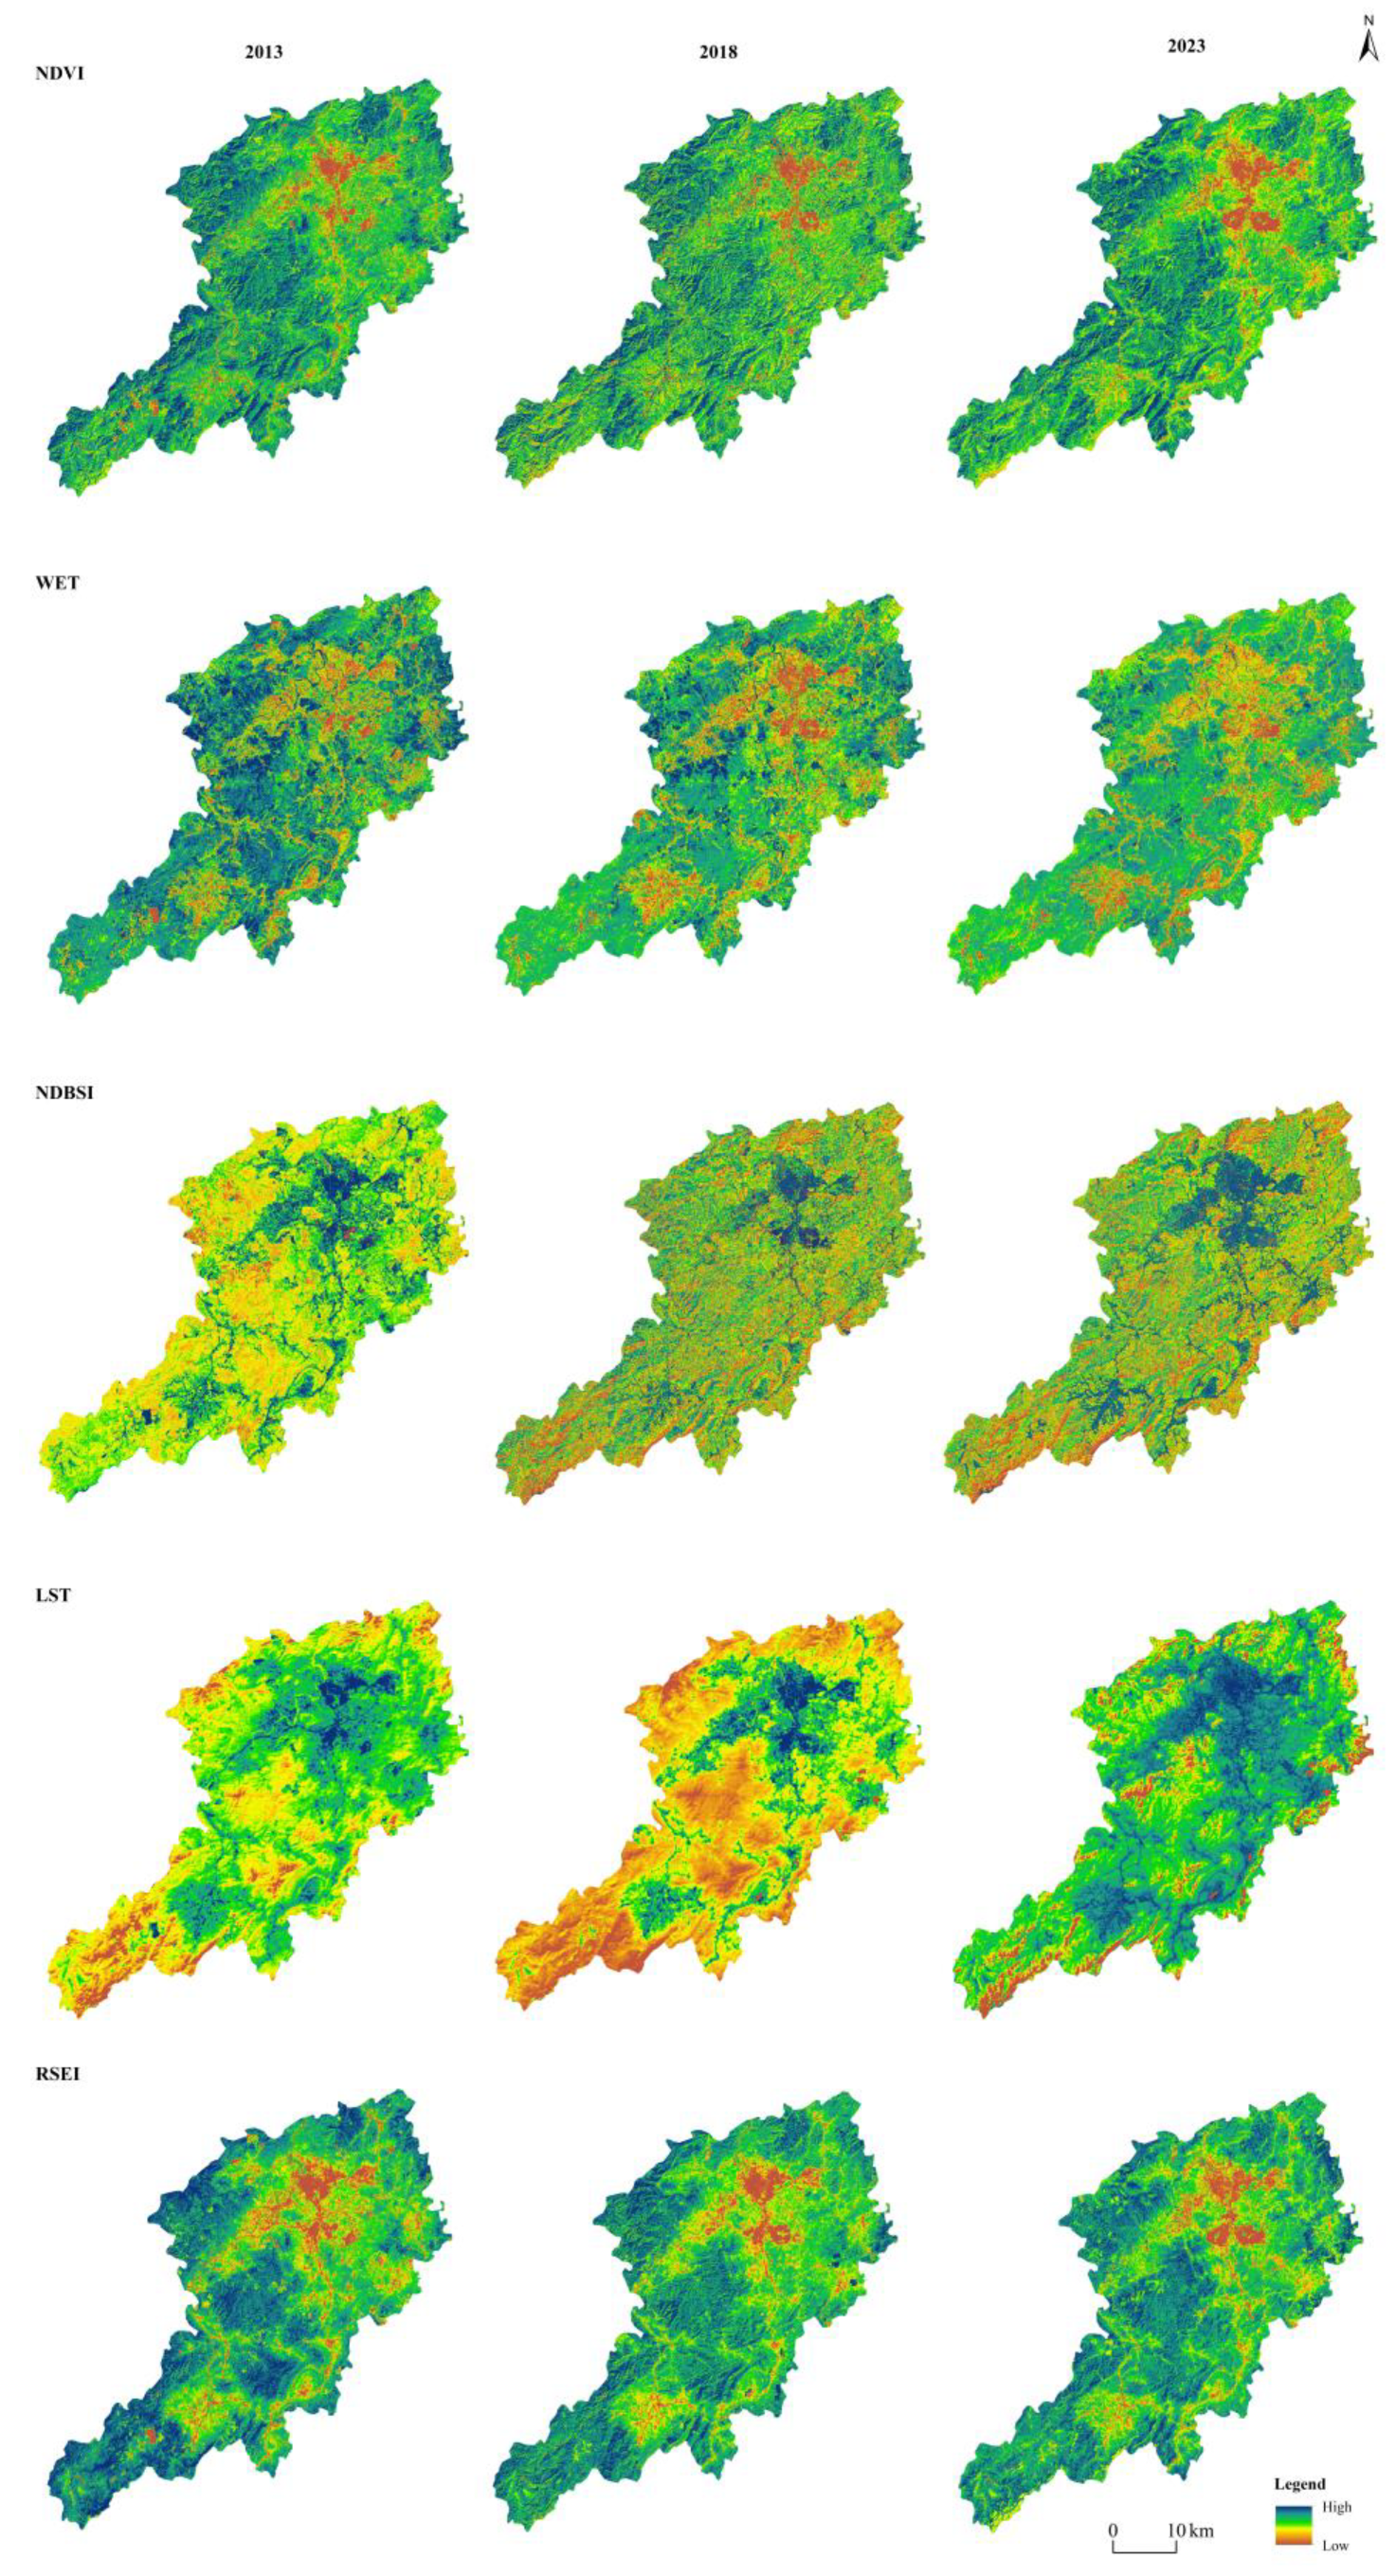
Table 9, the study divided five land types (forest land, garden land, water area and cultivated land) with good ecological environmental quality into positive factors, and three land types (construction land, transportation land and other land) with average and poor ecological environmental quality into negative factors. According to whether the land use type is a positive factor or a negative factor before and after the change, land use transfer is divided into four transfer modes: “positive–to–positive” (from positive factor to positive factor), “positive–to–negative” (from positive factor to negative factor), “negative–to–negative” (from negative factor to negative factor), and “negative–to–positive” (from negative factor to positive factor). On this basis, the temporal and spatial response model of ecological environmental quality to land use transfer in Longnan City was explored. Among the four indexes of NDVI, WET, NDBSI and LST, NDVI and WET have a positive impact on ecological environmental quality, while NDBSI and LST have a negative impact on ecological environmental quality [28].
Based on this, on the basis of the land use transfer mode, this study determined the correlation coefficient between RSEI and NDVI, WET, NDBSI and LST by creating fishing nets (extracting 6586 sets of data points in the study area), and explored the response mode of ecological environmental quality to different land use transfer modes. The measurement results are shown in Table 10.
On the whole, NDVI, WET and RSEI were positively correlated, while NDBSI and LST were negatively correlated. The correlation coefficient changes with the change of land transfer type, which is manifested in: (1) The correlation coefficients of positive indicators NDVI, WET and RSEI increased with the difference of land use transfer mode. In other words, the correlation coefficient is small when the land use transfer mode is “homotropic”, while the correlation coefficient is large when the land use transfer mode is “heterotropic”. This suggests that land classes characterizing positive indicators have a greater impact on ecosystem quality in areas of anisotropic change than in areas of isotropic change. (2) The correlation coefficients of negative indicators NDBSI, LST and RSEI change with the change of land use transfer results, that is, when the land use transfer results are positive, the correlation coefficient is small, and when the land use transfer results are negative, the correlation coefficient is large. This suggests that land classes characterizing negative indicators have a greater impact on the quality of the ecosystem when the transfer outcome is negative.

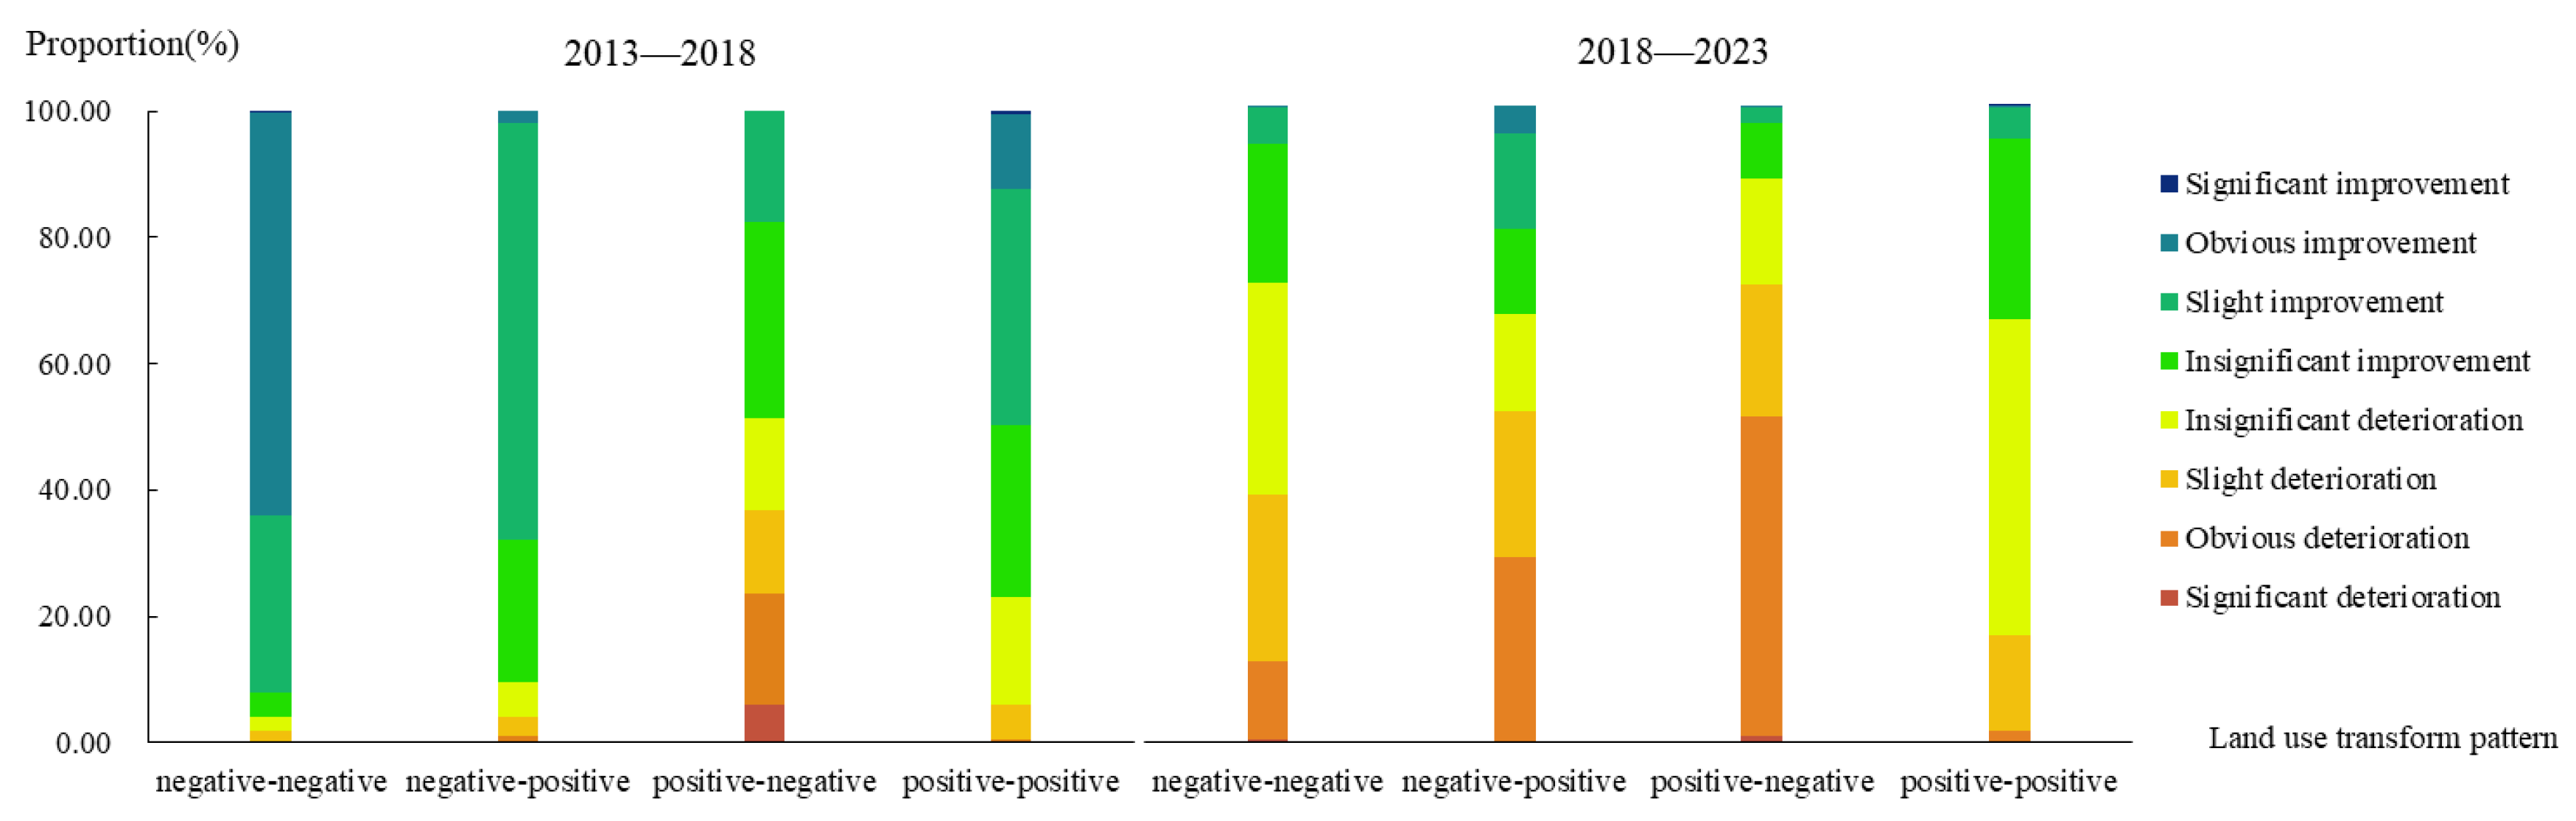
3.3.2. Temporal and Spatial Response Model of Ecological Environmental Quality Evolution to Land Use Transfer

In this study, the changes of ecological environmental quality under different land use transfer modes were divided into two periods, and the changes of ecological environmental quality were classified according to national standards, as shown in Table 11. On this basis, the response of ecological environmental quality to the four land use transfer modes was further explored, and the statistical results are shown in Figure 9 and Table 12.
From 2013 to 2018: (1) The response of ecological environmental quality change to the “negative–negative” land use transform pattern is as follows: The area of obvious improvement (63.962%) of ecological environmental quality is relatively large, followed by the slight improvement area (27.905%), there are a small number of areas with insignificant deterioration (2.257%), insignificant improvement (3.908%) and slight deterioration (1.435%), there are very few areas with obvious deterioration (0.331%) and significant improvement (0.202%), and almost no significant deterioration (0.002%). (2) The response of the change of ecological environmental quality to the “negative–positive” land use transform pattern is as follows: the area of slight improvement (66.091%) ecological environmental quality is relatively large, followed by the area of insignificant improvement (22.449%), with a few areas of insignificant deterioration (5.696%), obvious improvement (1.782%), slight deterioration (2.892%) and obvious deterioration (1.029%), with a few areas of significant deterioration (0.061%) and no significant improvement. (3) The response of the change of ecological environmental quality to the “position–negative” land use transform pattern is as follows: the area of the ecological environmental quality is insignificant improvement (30.921%), and the area of the ecological environmental quality is slight improvement (17.625%), insignificant deterioration (14.588%), slight deterioration (13.284%) and significant deterioration (17.444%) is equal in proportion. There are a few areas of significant deterioration (6.079%), a few areas of obvious improvement (0.033%), and no areas of significant improvement. (4) The response of the change of ecological environmental quality to the “positive–positive” land use transform pattern is as follows: The area of the ecological environmental quality is slight improvement (37.442%), followed by the area of insignificant improvement (27.129%), and then the area of obvious improvement (11.883%) and insignificant deterioration (17.1%). There are a few areas of slight deterioration (5.535%), a few areas of significant improvement (0.219%) and obvious deterioration (0.219%), and almost no significant deterioration (0.024%).
From 2018 to 2023: (1) The response of the change of ecological environmental quality to the “negative–negative” land use transform pattern is as follows: The proportion of areas with slight deterioration (26.202%), insignificant deterioration (33.268%) and slight improvement (22.001%) ecological environmental quality is the same, followed by the obvious deterioration (12.073%) area, there are a few slight improvement (5.636%) areas, there are a few significant deterioration (0.517%) and obvious improvement (0.304%) areas, and there are no significant improvement areas. (2) The response of the change of ecological environmental quality to the “negative–positive” land use transform pattern is as follows: The area of obvious deterioration (29.097%) of ecological environmental quality is relatively large, followed by the slight deterioration (22.714%) area, the area of insignificant deterioration (15.303%), insignificant improvement (13.554%) and slight improvement (14.799%) is the same, there are a few obvious improvement (4.505%) areas, almost no significant deterioration (0.028%) area, no significant improvement area. (3) The response of the change of ecological environmental quality to the “positive–negative” land use transform pattern is as follows: the area with obvious deterioration (50.101%) of ecological environmental quality accounts for a large proportion, the area with insignificant deterioration (16.612%) and the area with slight deterioration (20.746%) accounts for the same proportion, there are a few areas with slight improvement (8.791%) and significant deterioration (2.509%), a few areas with obvious improvement (0.219%) and no significant improvement. (4) The response of the change of ecological environmental quality to the “positive–positive” land use transform pattern is as follows: The area of the ecological environmental quality is not significant deterioration (49.69%), followed by the area of insignificant improvement (28.514%), and the area of slight deterioration (14.809%) again, there are a small number of slight improvement (4.79%) and obvious deterioration (1.821%) areas, there are very few significant improvement (0.318%) areas, and almost no obvious improvement (0.318%) and significant deterioration (0.043%) areas.

3.4. Analysis of Temporal and Spatial Evolution Factors of Ecological Environmental Quality in Longnan City

The geographical detector was used to analyze the driving factors for the spatial heterogeneity of the evolution of ecological environmental quality in Longnan City. The inter-annual changes of NDVI, WET, NDBSI, LST and LUCC (reflected by a single dynamic attitude of land use) were taken as X1, X2, X3, X4 and X5, and the inter-annual changes of RSEI were taken as Y for detection. As shown in Table 13 and Figure 10.
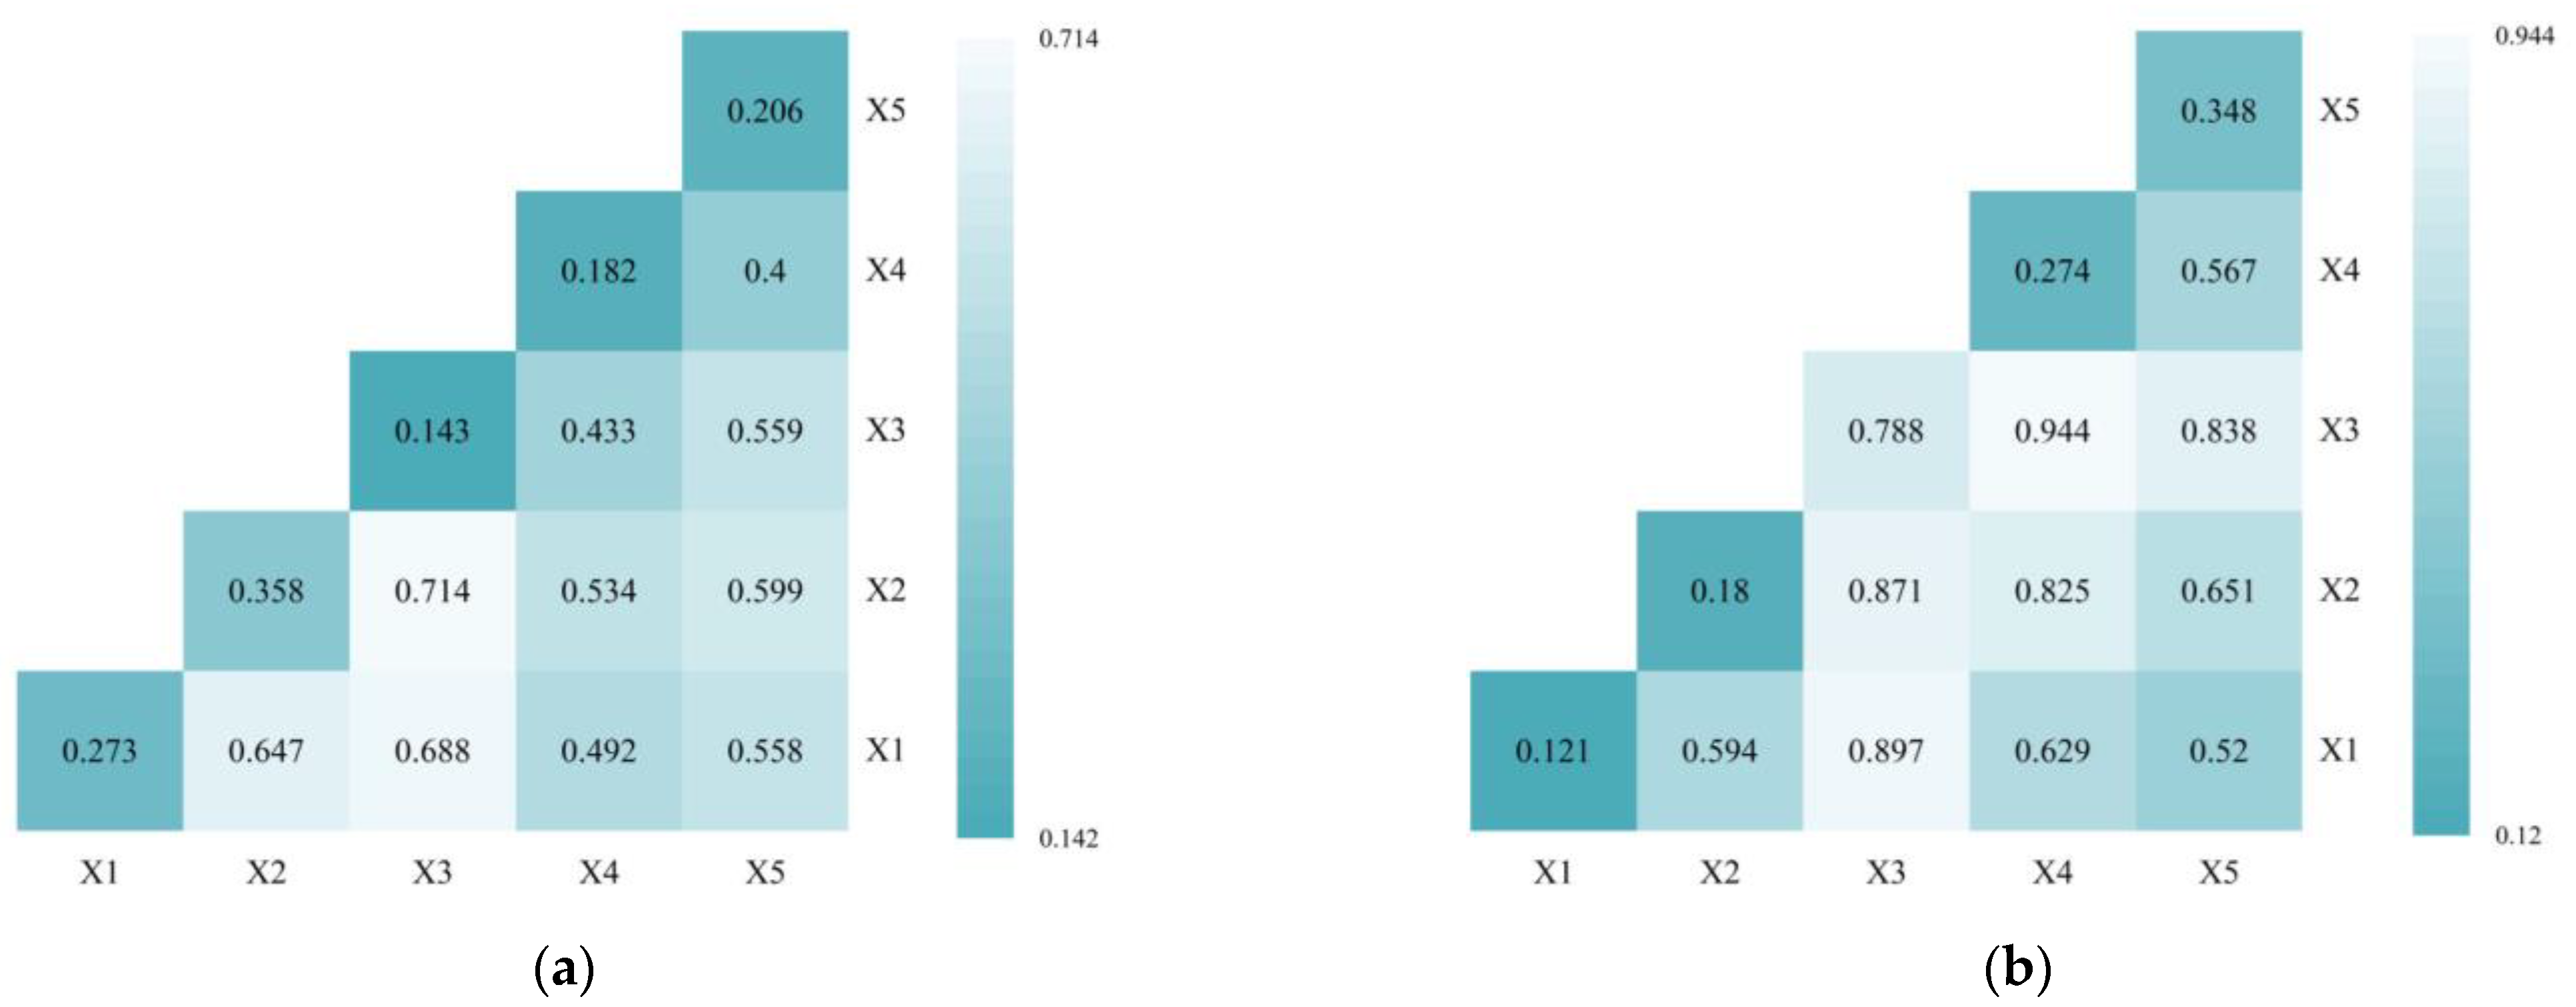
From 2013 to 2018, the q-values of X1, X2, X3, X4 and X5 were 0.27, 0.36, 0.14, 0.18 and 0.21 respectively, indicating that changes in WET have the greatest impact on changes in ecological quality, followed by NDVI; LUCC ranked third in terms of its influence; LST had less influence; and the NDBSI had virtually no impact. From 2018 to 2023, the q-values of the indicators were 0.12, 0.18, 0.79, 0.27 and 0.35, indicating that changes in NDBSI had the greatest impact on changes in ecological quality, followed by LUCC; LST had the third highest impact; WET had a low impact; and NDVI had virtually no impact.
The results of interaction detection are both double factor enhancement or nonlinear enhancement, indicating that the impact of interaction between factors on ecological environmental quality in Longnan City is stronger than that of any single factor. From 2013 to 2018, the two combinations of X4 with X2 and X5 were the main factors influencing the changes in ecological environmental quality in Longnan City, which means that the intensity of changes in ecological environmental quality under the influence of the interaction of LST with WET and the interaction of LST with LUCC is greater than the intensity of changes in the three factors when they act alone. From 2018 to 2023, the four combinations of X3 with X1, X2, X4, X5 and the combination of X4 and X5 were the main factors causing changes in ecological environmental quality in Longnan City. That is, the intensity of changes in ecological environmental quality under the influence of the interaction of NDBSI and NDVI, NDBSI and WET, NDBSI and LST, NDBSI and LUCC and LST and LUCC is greater than the intensity of changes when these five factors act alone.

4. Discussion

4.1. Spatio-Temporal Response Mechanism of Ecological Environmental Quality to Land Use Transfer in Longnan City

Most of the previous studies explored the impact of land use on ecological environmental quality [26,36,37]. There are relatively few studies on the response of ecological environmental quality to land use transfer, especially in the Nanling mountainous area. Based on a comprehensive analysis of the previous research of LUCC’s effect on the change of ecological environmental quality, this study aims to explore the spatio-temporal response mechanism of ecological environmental quality to land use transfer, by using the RSEI model, land use dynamic attitude, spatial autocorrelation analysis, Pearson’s correlation analysis, and geodetic detector model, combined with the fieldwork to distinguish the real impact of land use transfer. This work expands the perspective of the research field.
From 2013 to 2023, the ecological environmental quality of Longnan City shows a trend of “rising and then declining”, and the rising trend is obviously greater than the declining trend, which is the same as the conclusion of Ouyang [50] and others. The reason may be related to the implementation of engineering measures such as returning farmland to forest and grassland in the study area [12], which led to an increase in the area of forest and grassland in the region, and counteracted the negative impacts on the ecological environmental quality caused by urban expansion [18]. The ecological environmental quality of the study area is highly correlated with the land use status. The southern part of Longnan City is dominated by forests, while the northern part is an urban construction area, indicating that the ecological environmental quality in the southern part is better than that in the northern part. Human activities in the southern region are not active, coupled with ecological protection measures [14], so that the quality of its ecological environment has been maintained at a good level. Human activities are strong in the construction area in the northern part of the city, and the development and utilization of the surrounding areas lead to the transfer of forest land and grassland to the construction land, which is the main reason for the poor ecological environment in the northern part of the city [51].
This study conducted a field investigation of 114 points containing eight typical land classes in Longnan City to calculate their RSEI indexes. Based on the RSEI index, the study divided five land types (forest land, crop land, grassland, water area and cultivated land) with good ecological environmental quality into positive factors, and three land types (built-up land, traffic land and other land) with average and poor ecological environmental quality into negative factors. According to whether the land use type is a positive factor or a negative factor before and after the change, land use transfer is divided into four modes “positive–to–positive”, “positive–to–negative”, “negative–to–positive” and “negative–to–negative”. Based on land use transfer mode, the response mechanism of ecological environmental quality change to land use transfer was explored by calculating the Pearson correlation coefficients between each ecological indicator with RSEI under different land use transfer modes [23]. And the response mechanism of each ecological indicator and LUCC to land use transfer was further explored by geo-detectors. RSEI’s response mechanism fills the gap left by previous studies that did not involve fieldwork to improve the credibility of the impact of land use transfer direction on ecological environmental quality. It was found that the positive and negative land uses in this study were more reliable. Firstly, the correlation coefficients between the negative indicators NDBSI and LST and RSEI were larger when the land uses shifted in the negative direction, and the correlation coefficients between the positive indicators NDVI and WET and RSEI were larger when the land uses were shifted in the same direction. Secondly, the correlation coefficients of the positive indicators NDVI and WET were larger when the land uses were shifted in the same direction in Longnan City between 2013 and 2018. Thirdly, from 2013 to 2018, the ecological environmental quality in Longnan City improved significantly, and the interaction effect of LST with WET and LUCC on the ecological environmental quality was larger than that of other factors, and from 2018 to 2023, the ecological environmental quality in Longnan City deteriorated a little bit, and the interaction effect of LUCC, LST and NDBSI with LST was larger than that of other factors.

4.2. Shortcomings and Prospects of the Study

The evolution of ecological environmental quality and land use change is a complex synthesis of natural and anthropogenic systems acting together [52], involving soil quality [53], water environment [54], air pollution [55], etc. In this study, we only chose Landsat remote sensing imagery to calculate the RSEI index of Longnan City to reflect the ecological environmental quality and the trend of spatial and temporal evolution in the period of 2013–2023, which would inevitably produce deviation with the actual situation. The combination of machine learning [38,39] and manual interpretation were used to accurately classify and recognize the LULC in the study area and improve the interpretation accuracy. Fieldwork improved the credibility of the influence of land use transfer directions on ecological environmental quality, and the drivers of ecological environmental quality evolution were explored more intuitively with the help of the geo-detector. However, there are still some areas that need further study.
Cultivated land was classified as a positive land category in the study was reliable, because related studies also showed that the comprehensive ecological effect of conversion to cultivated land was positive [56], and farmland was an area of ecological quality improvement [57]. However, due to the seasonal influence, part of the cultivated land is in the state of “barren planting”, which will lead to the low RSEI of this type of land, and the classification of the cultivated land into land that is positive to the ecological environmental quality may cause less interference with the results of the measurements. The Pearson correlation coefficient is reliable for detecting the correlation degree between regional ecological quality and other factors [58,59]. However, there are differences between different ecological indicators in urban and rural areas. Therefore, comprehensive consideration of the impact of differences in urban and rural areas is also needed in detecting the correlation degree between regional ecological quality and other factors.
Under the guidance of the 14th Five-Year Plan for ecological restoration of territorial space in Jiangxi Province, the future ecological environment protection and restoration of Longnan City mainly points to the rational and efficient allocation of territorial space. On the one hand, the protection of forest resources, grassland resources, water resources and arable land resources should be strengthened. In the core area of ecological restoration, except for ecological construction, landscape protection and ecological tourism projects, no other construction projects will be carried out. In the protected farmland areas, except for the normal agricultural production activities with the high-standard farmland construction activities, there will be no transformation or encroachment of farmland in any form. On the other hand, the planning and control of urban development boundaries should be strengthened and complied with the strictest ecological protection system and arable land protection system. In the process of urban development, both economic and ecological benefits should be taken into account, and ecological space should not be occupied. The three zones and three lines should be strictly delineated, urban construction land management should be strengthened, and the construction of blue and green spaces should be incorporated into town development plans, minimizing the construction of industrial and other projects that cause serious pollution to the ecological environment.

5. Conclusions

Based on RSEI index, geo-detector, the field observation and LUCC mapping by remote sensing, this paper evaluated the ecological environmental quality of Longnan City in 2013, 2018 and 2023, divided land use types into two directions (positive and negative), studied the correlation degree and the spatio-temporal relationship between the ecological environmental quality evolution and land use transfer, and further explored the spatio-temporal response pattern among them. The RSEI of Longnan City in 2013, 2018 and 2023 were 0.789, 0.917 and 0.872, respectively. There were large spatial differences in the ecological quality of Longnan City, and that of the northern part was significantly worse than that of the southern part, with the northern main urban area gradually deteriorating in the trend of “inward contraction”. From 2013 to 2023, Longnan City was dominated by the transfer out of forest land (16.03 km2 transferred out) and the transfer in of construction land (13.25 km2 transferred in).
The correlation coefficients between the NDVI, WET, NDBSI, LST and the RSEI under the positive–positive transform pattern were respectively 0.523, 0.408, −0.268, −0.241; 0.767, 0.337, −0.479, −0.528 in positive–negative transform pattern; 0.741, 0.521, −0.121, −0.472 in negative–positive transform pattern; 0.561, 0.5, −0.523, −0.511 in positive–positive transform pattern. When the land category is transferred in the same direction, the correlation between positive indicators NDVI, WET and RSEI is higher than that of heterogeneous transfer. While the land use type is transferred to the negative land category, the correlation between the negative indicators NDBSI, LST and RSEI is higher than that of the transfer to the positive land category. The method proposed in this study for characterizing the positive and negative impacts on the ecological environmental quality of the land classes is accurate.
The spatial and temporal responses of ecological environmental quality to different land use transform patterns are highly correlated with the changes in ecological environmental quality. From 2013 to 2018, the area with better ecological environmental quality was always larger than that with worse ecological environmental quality under different land use transform patterns. From 2018 to 2023, the area with worse ecological environmental quality was always larger than that with better ecological environmental quality under different land use transform patterns. LUCC always had a strong impact on the ecological environmental quality in Longnan City in both periods. Specifically, from 2013 to 2018, the interaction between LUCC and LST (q = 0.4) had a greater impact on the ecological environmental quality change than the interaction between other factors in this period; from 2018 to 2023, the interaction between LUCC and both NDBSI and LST (LST ∩ LUCC = 0.567, NDBSI ∩ LUCC = 0.838) also had a greater strength of influence on changes in ecological quality during this period than the interactions among other factors. The interaction between LUCC and other indicators has a greater effect on the evolution of ecological environmental quality in Longnan City than the single factor effect.

Author Contributions

Conceptualization, Q.X. and Q.H.; methodology, Q.H.; software, Q.H.; validation, Q.X. and Q.H.; formal analysis, Q.H.; investigation, Q.X. and Q.H.; resources, Q.X.; data curation, Q.H.; writing—original draft preparation, Q.H.; writing—review and editing, Q.X. and W.C.; visualization, Q.H.; supervision, Q.X.; project administration, Q.X.; funding acquisition, Q.X. All authors have read and agreed to the published version of the manuscript.

Funding

This research was funded by National Natural Science Foundation of China (No: 42107274),Natural Science Foundation of Jiangxi Province (No: 20202BABL213030) and Open Foundation of Jiangxi Provincial Technology Innovation Center for Ecological Water Engineering in Poyang Lake Basin (No: 2022SKLS03), all granted to Q.X. and the APC was funded by Q.X.

Data Availability Statement

The datasets used and/or analyzed during the current study are available from the corresponding author upon reasonable request.

Conflicts of Interest

The authors declare no conflicts of interest.

References

  1. Guo, J.P.; Shen, B.B.; Li, H.X.; Wang, Y.D.; Tuvshintogtokh, I.; Niu, J.M.; Potter, M.A.; Li, Y.H. Past dynamics and future prediction of the impacts of land use cover change and climate change on landscape ecological risk across the Mongolian plateau. J. Environ. Manag. 2024, 355, 120365. [Google Scholar] [CrossRef] [PubMed]
  2. Chen, S.M.; Liu, F.T.; Zhang, Z.; Zhang, Q.; Wang, W. Changes of groundwater flow field of Luanhe River Delta under the human activities and its impact on the ecological environment in the past 30 years. China Geol. 2021, 4, 455–462. [Google Scholar] [CrossRef]
  3. Zhang, Y.Q.; Zhao, X.; Gong, J.; Luo, F.; Pan, Y.P. Effectiveness and driving mechanism of ecological restoration efforts in China from 2009 to 2019. Sci. Total Environ. 2023, 910, 168676. [Google Scholar] [CrossRef] [PubMed]
  4. Lei, X.Q.; Liu, H.H.; Li, S.D.; Luo, Q.H.; Cheng, S.Z.; Hu, G.Y.; Wang, X.; Bai, W.Q. Coupling coordination analysis of urbanization and ecological environment in Chengdu-Chongqing urban agglomeration. Ecol. Indic. 2024, 161, 111969. [Google Scholar] [CrossRef]
  5. Wu, X.L.; Zhang, Y.H. Coupling analysis of ecological environment evaluation and urbanization using projection pursuit model in Xi’an, China. Ecol. Indic. 2023, 156, 111078. [Google Scholar] [CrossRef]
  6. Zhu, C.M.; Yuan, S.F.; Yang, L.X. Evolution of territorial spatial pattern and associated eco-environmental effects from the perspective of major functional zones: A case study of Zhejiang Province. Acta Ecol. Sin. 2023, 43, 4488–4501. [Google Scholar]
  7. Yang, S.; Zheng, X.Z.; Zhao, G.P. Spatial ecological effects of ecological-production-living spaces in the Guanzhong Plain Agglomeration and influencing factors. J. Arid Land 2023, 37, 26–35. [Google Scholar]
  8. Ye, J.A. Economic Restructuring and Land Use Planning in Hongkong. Acta Geogr. Sin. 1997, S1, 39–51. [Google Scholar]
  9. Long, H.L.; Chen, K.Q. Urban-rural integrated development and land use transitions: A perspective of land system science. Acta Geogr. Sin. 2021, 76, 295–309. [Google Scholar]
  10. Zheng, H.L.; Li, H. Spatial-temporal evolution characteristics of land use and habitat quality in Shandong Province, China. Sci. Rep. 2022, 12, 15422. [Google Scholar] [CrossRef]
  11. Kong, L.Q.; Wu, T.; Xiao, Y.; Xu, W.H.; Zhang, X.B.; Daily, G.C.; Ouyang, Z.Y. Natural capital investments in China undermined by reclamation for gardenland. Nat. Ecol. Evol. 2023, 11, 1771–1777. [Google Scholar] [CrossRef] [PubMed]
  12. Su, Y.; Feng, G.J.; Ren, J.T. Spatio-temporal evolution of land use and its eco-environmental effects in the Caohai National Nature Reserve of China. Sci. Rep. 2023, 13, 20150. [Google Scholar] [CrossRef] [PubMed]
  13. Jia, X.Q.; Fu, B.J.; Feng, X.M.; Huo, G.H.; Wang, X.F. The tradeoff and synergy between ecosystem services in the Grain-for-Green areas in Northern Shaanxi, China. Ecol. Indic. 2014, 43, 103–113. [Google Scholar] [CrossRef]
  14. Fan, X.L.; Qu, Y.; Zhang, J.; Edith, B. China’s vegetation restoration programs accelerated vegetation greening on the Loess Plateau. Agric. For. Meteorol. 2024, 350, 109994. [Google Scholar] [CrossRef]
  15. Chen, Y.; Cai, H.S.; Chen, Y.R. Spatial correlation and interaction effect intensity between territorial spatial ecological quality and new urbanization level in Nanchang metropolitan area, China. Ecol. Indic. 2023, 156, 111163. [Google Scholar] [CrossRef]
  16. Bai, Z.F.; Han, L.; Liu, H.Q.; Li, L.Z.; Jiang, X.H. Assessment of coordinated development between urban land use efficiency and ecological carrying capacity: Case study of the cities in Inner Mongolia. Ecol. Indic. 2023, 155, 110933. [Google Scholar]
  17. Yohan, S.; Celine, C.; JChristophe, F. A metrics-based approach for modeling covariation of visual and ecological landscape qualities. Ecol. Indic. 2021, 123, 107331. [Google Scholar]
  18. An, H.; Xiao, W.D.; Huang, J. Relationship of construction land expansion and ecological environment changes in the Three Gorges reservoir area of China. Ecol. Indic. 2023, 157, 111209. [Google Scholar] [CrossRef]
  19. Sami, U.; Tang, S.L.; Muhammad, Y.R. How the energy depletion rate and financial structure can promote environmental sustainability: Empirical evidence from Pakistan using ecological footprints. Energy Strateg. Rev. 2023, 50, 101208. [Google Scholar]
  20. Sarah, J.K.; Colin, J.M.; Piran, C.L. White. The importance of ecological quality of public green and blue spaces for subjective well-being. Landsc. Urban Plan. 2022, 226, 104510. [Google Scholar]
  21. Zou, C.; Zhu, J.W.; Luo, K.L.; Yang, L. Coupling coordination and spatiotemporal heterogeneity between urbanization and ecological environment in Shaanxi Province, China. Ecol. Indic. 2022, 141, 109152. [Google Scholar] [CrossRef]
  22. Yu, H.D.; Zhao, J.J. The impact of environmental conditions on urban eco-sustainable total factor productivity:a case study of 21 cities in Guangdong Province, China. Int. J. Environ. Res. Public Health 2020, 17, 1329. [Google Scholar] [CrossRef]
  23. Xu, H.Q. A remote sensing urban ecological index and its application. Acta Ecol. Sin. 2013, 33, 7853–7862. [Google Scholar]
  24. Yue, A.; Zhang, Z. Research on Urban Ecological Environment Evaluation Based on Remote Sensing Analysis. J. Green Sci. Tech. 2018, 12, 126–127. [Google Scholar]
  25. Yan, Y.B.; Chai, Z.Y.; Yang, X.D.; Simayi, Z.; Yang, S.T. The temporal and spatial changes of the ecological environment quality of the urban agglomeration on the northern slope of Tianshan Mountain and the influencing factors. Ecol. Indic. 2021, 133, 108380. [Google Scholar]
  26. Lai, S.H.; Eladawy, A.; Sha, J.M.; Li, X.M.; Wang, J.L.; Kurbanov, E.; Lin, Q.X. Towards an integrated systematic approach for ecological maintenance: Case studies from China and Russia. Ecol. Indic. 2022, 140, 108982. [Google Scholar] [CrossRef]
  27. Zhang, W.; Du, P.J.; Guo, S.C.; Lin, C.; Zheng, H.R.; Fu, P.J. Enhanced remote sensing ecological index and ecological environment evaluation in arid area. J. Remote Sens. 2023, 27, 299–317. [Google Scholar] [CrossRef]
  28. Xu, H.Q. A remote sensing index for assessment of regional ecological changes. Chin. Environ. Sci. 2013, 33, 889–897. [Google Scholar]
  29. Zhang, Y.; She, J.Y.; Long, X.R.; Zhang, M. Spatio-temporal evolution and driving factors of eco-environmental quality based on RSEI in Chang-Zhu-Tan metropolitan circle, central China. Ecol. Indic. 2022, 144, 109436. [Google Scholar] [CrossRef]
  30. Yuan, B.D.; Fu, L.N.; Zou, Y.A.; Zhang, S.Q.; Chen, X.S.; Li, F.; Deng, Z.M.; Xie, Y.H. Spatiotemporal change detection of ecological quality and the associated affecting factors in Dongting Lake Basin, based on RSEI. J. Clean. Prod. 2021, 302, 126995. [Google Scholar] [CrossRef]
  31. Zhang, X.Y.; Jia, W.W.; He, J.Y. Spatial and temporal variation of ecological quality in northeastern China and analysis of influencing factors. J. Clean. Prod. 2023, 423, 138650. [Google Scholar] [CrossRef]
  32. Yang, H.H.; Yu, J.; Xu, W.Z.; Wu, Y.; Lei, X.Y.; Ye, J.N.; Geng, J.W.; Ding, Z. Long-time series ecological environment quality monitoring and cause analysis in the Dianchi Lake Basin, China. Ecol. Indic. 2023, 148, 110084. [Google Scholar] [CrossRef]
  33. Li, J.N.; Liu, J.H.; Liu, M.X.; Lv, X.Q.; Dong, Z.Y.; Yan, X.Y. Urban ecological environment evaluation and influencing factors analysis at the residential quarter-level in Xi’an, China. Ecol. Indic. 2024, 158, 111348. [Google Scholar] [CrossRef]
  34. Xu, H.Q.; Wang, M.Y.; Shi, T.T.; Guan, H.D.; Fang, C.Y.; Lin, Z.L. Prediction of ecological effects of potential population and impervious surface increases using a remote sensing based ecological index (RSEI). Ecol. Indic. 2018, 93, 730–740. [Google Scholar] [CrossRef]
  35. Huang, H.P.; Chen, W.; Zhang, Y.; Qiao, L.; Du, Y.Y. Analysis of ecological quality in Lhasa Metropolitan Area during 1990-2017 based on remote sensing and Google Earth Engine platform. J. Geogr. Sci. 2021, 31, 265–280. [Google Scholar] [CrossRef]
  36. Mohammad, P.; Goswami, A.; Chauhan, S.; Nayak, S. Machine learning algorithm based prediction of land use land cover and land surface temperature changes to characterize the surface urban heat island phenomena over Ahmedabad city, India. Urban Clim. 2022, 42, 101116. [Google Scholar] [CrossRef]
  37. Shi, T.T.; Xu, H.Q.; Tang, F. Built-up land change and its impact on ecological quality in a fast-growing economic zone: Jinjiang County, Fujian Province, China. J. Appl. Ecol. 2017, 28, 1317–1325. [Google Scholar]
  38. Ullah, W.; Ahmad, K.; Ullah, S.; Tahir, A.A.; Javed, M.F.; Nazir, A.; Abbasi, A.M.; Aziz, M.; Mohamed, A. Analysis of the relationship among land surface temperature (LST), land use land cover (LULC), and normalized difference vegetation index (NDVI) with topographic elements in the lower Himalayan region. Heliyon 2023, 9, e13322. [Google Scholar] [CrossRef] [PubMed]
  39. Tian, S.D.; Zhang, X.F.; Tian, J.; Sun, Q. Random Forest Classification of Wetland Landcovers from Multi-Sensor Data in the Arid Region of Xinjiang, China. Remote Sens. 2016, 8, 954. [Google Scholar] [CrossRef]
  40. Liu, L.; Zhang, Y.Z. Urban Heat Island analysis using the Landsat TM data and ASTER data: A case study in Hong Kong. Remote Sens. Remote Sens. 2011, 8, 1535–1552. [Google Scholar] [CrossRef]
  41. Xu, H.Q. Spatiotemporal dynamics of the bare soil cover in the Hetian basinal area of County Changting, China, during the past 35 years. Acta Ecol. Sin. 2013, 33, 2946–2953. [Google Scholar]
  42. Liu, J.R.; Lin, X.F.; Wang, H.W.; Wang, C.P. Ecological quality differentiation of the environment and impacts of port development on both coasts of the Taiwan Strait. Acta Ecol. Sin. 2024, 44, 1–17. [Google Scholar]
  43. Xu, J.H. Quantitative Geography; Higher Education Press: Beijing, China, 2014; pp. 84–160. [Google Scholar]
  44. Shi, P.J.; Chen, J.; Pan, Y.Z. Landuse Change Mechanism in Shenzhen City. Acta Geogr. Sin. 2000, 55, 151–160. [Google Scholar]
  45. Jenson, J.Q.; Cowen, D. Principles of change detection using digital remote sensor data. In Integration of GIS and Remote Sensing; Cambridge University Press: Cambridge, UK, 1997; pp. 1–25. [Google Scholar]
  46. Zheng, B.H.; Tian, Z.Q.; Wang, W.J.; Li, Z.C. Analysis of recent land usage and survey in Western China. Acta Ecol. Sin. 2004, 24, 1078–1085. [Google Scholar]
  47. Ma, C.H.; Ren, Z.Y.; Li, X.Y. Land use change flow and its spatial agglomeration in the loess platform region. Acta Geogr. Sin. 2013, 68, 257–267. [Google Scholar]
  48. Wang, J.F.; Xu, C.D. Geodetector: Principle and prospective. Acta Geogr. Sin. 2017, 72, 116–134. [Google Scholar]
  49. Wang, J.F.; Li, X.H.; George, C.; Liao, Y.L.; Zhang, T.; Gu, X.; Zheng, X.Y. Geographical Detectors-Based Health Risk Assessment and its Application in the Neural Tube Defects Study of the Heshun Region, China. Int. J. Geogr. Inf. Sci. 2010, 24, 107–127. [Google Scholar] [CrossRef]
  50. Ouyang, X.H.; Wang, J.B.; Chen, X.; Zhao, X.L.; Ye, H.; Watson, A.E.; Wang, S.Q. Applying a projection pursuit model for evaluation of ecological quality in Jiangxi Province, China. Ecol. Infrom. 2021, 133, 108414. [Google Scholar] [CrossRef]
  51. Hu, Q.; Huang, H.P.; Kung, C.C. Ecological impact assessment of land use in eco-industrial park based on life cycle assessment: A case study of Nanchang High-tech development zone in China. J. Clean. Prod. 2021, 300, 126816. [Google Scholar] [CrossRef]
  52. Chen, A.; Yang, X.C.; Guo, J.; Zhang, M.; Xing, X.Y.; Yang, D.; Xu, B.; Jiang, L.W. Dynamic of land use, landscape, and their impact on ecological quality in the northern sand-prevention belt of China. J. Environ. Manag. 2022, 317, 115351. [Google Scholar] [CrossRef]
  53. Hacisalihoglu, S.; Misir, M.; Misir, N.; Yucesan, Z.; Oktan, E.; Gumus, S.; Kezik, U. The effects of land use change on soil loss and carbon stock amounts. Fresenius Environ. Bull. 2017, 26, 6007–6016. [Google Scholar]
  54. Singh, S.; Bhardwaj, A.; Verma, V.K. Remote sensing and GIS based analysis of temporal land use/land cover and water quality changes in Harike wetland ecosystem, Punjab, India. J. Environ. Manag. 2020, 262, 110355. [Google Scholar] [CrossRef] [PubMed]
  55. Wang, L.; Li, Q.Y.; Qiu, Q.Y.; Hou, L.P.; Ouyang, J.Y.; Zeng, R.H.; Huang, S.; Li, J.; Tang, L.N.; Liu, Y. Assessing the ecological risk induced by PM2.5 pollution in a fast developing urban agglomeration of southeastern China. J. Environ. Manag. 2022, 324, 110355. [Google Scholar] [CrossRef] [PubMed]
  56. Xu, W.J.; Song, J.X.; Long, Y.Q.; Mao, R.c.; Li, B.J. Analysis and simulation of the driving mechanism and ecological effects of land cover change in the Weihe River basin, China. J. Environ. Manag. 2023, 344, 118320. [Google Scholar] [CrossRef] [PubMed]
  57. Liu, Z.X.; Zhang, W.W.; Lu, H.Y.; Ji, J.W.; Yang, Z.H.; Chen, C. Exploring evolution characteristics of eco-environment quality in the Yangtze River Basin based on remote sensing ecological index. Heliyon 2023, 9, e23243. [Google Scholar] [CrossRef] [PubMed]
  58. Yang, X.Y.; Meng, F.; Fu, P.J.; Zhang, J.W.; Liu, Y.H. Instability of remote sensing ecological index and its optimisation for time frequency and scale. Ecol. Infrom. 2022, 72, 101870. [Google Scholar] [CrossRef]
  59. Mohammad, K.F.; Majid, K.; Mehdi, H.; Jamal, J.K.; Seyed, K.A. A novel method to quantify urban surface ecological poorness zone: A case study of several European cities. Sci. Total Environ. 2021, 757, 143755. [Google Scholar]
Figure 1. Schematic diagram of the research area (the scale unit refers specifically to Longnan City).
Land 13 00675 g001
Figure 2. Study technical flow chart.2.2.1. Data.
Land 13 00675 g002
Figure 3. RSEI and its main indicators.
Land 13 00675 g003
Figure 4. Spatial distribution of ecological environmental quality in Longnan.
Land 13 00675 g004
Figure 5. Types of spatial and temporal evolution of ecological environmental quality in Longnan.
Land 13 00675 g005
Figure 6. LISA cluster diagram of changes in ecological quality in Longnan.
Land 13 00675 g006
Figure 7. Spatial distribution of land use in Longnan City.
Land 13 00675 g007
Figure 8. The route of the field trip.
Land 13 00675 g008
Figure 9. Statistics on changes in the quality of the ecological environment.
Land 13 00675 g009
Figure 10. Driving factors for the ecological environmental quality in Longnan for each phase using the interaction detector. (a) 2013–2018. (b) 2018–2023.
Land 13 00675 g010
Table 1. Description of data sources.
DataSources
Remote sensing imagery 2013https://www.gscloud.cn/search (accessed on 16 March 2018)
Remote sensing imagery 2018
Remote sensing imagery 2023https://engine-aiearth.aliyun.com (accessed on 21 March 2023)
LULC of 2013Random Forest Classification and Visual Interpretation
LULC of 2018
LULC of 2023National Soil and Water Conservation Survey Project 2023
Table 2. Description of land-use classifications.
Land Use TypeSpecific Meaning
Cultivated landIncludes ripe land, rotational land; land used mainly for growing gardens for agriculture, fruit, mulberry, agriculture and forestry.
Garden landIncluding orchards, tea gardens, other gardens.
Forest landForest land with trees, shrubs, bamboos, etc.
GrasslandIncludes natural and planted grasslands.
Built-up landRefers to urban land, rural settlements and other building land.
Traffic landIncluding railroads, highways and rural roads.
Water areaLand-based natural waters, reservoirs, artificial surface waters.
Other landMainly composed of human-disturbed land, unutilized land and bare rock and gravel land.
Table 3. Ecological environmental quality Classification in Longnan City.
Ecological Environmental QualityEcological IndexEcological Environmental Quality Grade
Poorr < 0.2V
Fair0.2 ≤ r < 0.35IV
Moderate0.35 ≤ r < 0.55III
Good0.55 ≤ r < 0.75II
Excellentr ≥ 0.75I
Table 4. Statistics on Ecological environmental quality Grade of Longnan City from 2013 to 2023.
Ecological Environmental Quality Grade201320182023
Area (km2)Proportion (%)Area (km2)Proportion (%)Area (km2)Proportion (%)
V144.1818.7596.815 0.414 18.481.123
IV73.14.44131.223 1.897 49.463.005
III221.63413.46479.431 4.825 130.897.951
II498.37130.274403.883 24.535 570.07734.63
I708.89443.0631124.827 68.330 877.27353.291
Table 5. Global Moran’s I Index of Changes in Ecological Quality in Longnan.
PeriodMoran’s IZP
2013–2018−0.13−2.600.009
2018–20230.283.950.000
Table 6. Statistics on Land Use in Longnan City from 2013 to 2023.
Land-Use Type201320182023
Area (km2)Proportion (%)Area (km2)Proportion (%)Area (km2)Proportion (%)
Cultivated land147.848.981146.318.888142.128.633
Garden land80.144.86886.365.24685.775.210
Frostland1308.3279.4761296.8778.7811292.2978.502
Grassland4.570.2773.980.2423.080.187
Built-up land43.832.66246.362.81657.083.467
Traffic land16.160.98218.001.09322.41.361
Water area19.021.15519.141.16319.331.174
Other land26.311.59829.151.77124.101.464
Table 7. Land Use Transfer Matrix in Longnan City from 2013 to 2018 (unit:km2).
2018Positive Land Use TypeNegative Land Use Type
2013 Cultivated LandGarden LandForestlandGrasslandWater AreaTraffic LandBuilt-Up LandOther LandAll
Positive land use typeCultivated land143.20 0.61 0.79 0.26 0.72 0.59 0.07 1.58 147.84
Garden land0.19 79.18 0.15 00.05 0.06 00.51 80.14
Forestland1.23 5.07 1291.56 0.15 1.17 2.54 0.03 6.56 1308.32
Grassland000.06 2.96 0.20 0.26 01.09 4.57
Water area0.32 0.00 0.35 0.31 39.27 0.06 0.05 3.46 43.83
Negative land use typeTraffic land0.35 0.17 1.68 00.01 13.91 00.04 16.16
Built-up land0.15 0.09 0.02 00.01 0.01 18.73 0.01 19.02
Other land0.86 1.24 2.26 0.30 4.92 0.57 0.25 15.90 26.31
All146.31 86.36 1296.88 3.98 46.36 18.00 19.14 29.15 1646.18
Table 8. Land Use Transfer Matrix in Longnan City from 2018 to 2023 (unit:km2).
2023Positive Land Use TypeNegative Land Use Type
2018 Cultivated LandGarden LandForestlandGrasslandWater AreaTraffic LandBuilt-Up LandOther LandAll
Positive land use typeCultivated land141.67 0.17 1.09 00.65 1.00 01.73 146.31
Garden land085.17 0.03 00.05 0.32 00.79 86.36
Forestland0.03 01290.17 0.02 0.64 2.72 03.30 1296.87
Grassland0002.87 00.02 0.45 0.65 3.98
Water area000019.11 0.00 00.03 19.14
Negative land use typeTraffic land0000017.87 00.13 18.00
Built-up land0.03 00.01 00.01 0.01 46.01 0.31 46.36
Other land0.40 0.43 0.99 0.20 0.00 0.47 9.50 17.16 29.15
All142.12 85.77 1292.29 3.08 20.46 22.40 55.96 24.10 1646.18
Table 9. Ecological environmental quality Grade of Field Study Sites.
Land-Use TypeCultivated LandGarden LandForest
Land
Grass LandBuilt-Up LandTraffic LandWater AreaOther Land
RSEI0.60.7250.7240.60.40.250.5670.235
Ecological environmental quality gradeGoodGoodGoodGoodmoderateFairGoodFair
Table 10. Correlation Between RSEI and the Four Factors under Different Land Use Transfer Patterns.
Factors
Land-Use
NDVIWETNDBSILST
Transition Type
positive–positive0.5230.408−0.268−0.241
positive–negative0.7670.337−0.479−0.528
negative–positive0.7410.521−0.121−0.472
negative–negative0.5610.5−0.523−0.511
Table 11. Grading Degree of Ecological environmental quality Change.
Change DegreeNo Significant ChangeSlight ChangeObvious ChangeSignificant Change
Changing value | E I | < 1 1     | E I | < 3 3     | E I | < 8 | E I | ≥ 8
DescriptionNo significant change in ecological environmental qualitySlightly better or worse in ecological environmental qualityObviously better or worse in ecological environmental qualitySignificantly better or worse in ecological environmental quality
Table 12. Statistics on Changes in Ecological Quality Under Different Land Use Transfer Patterns.
Land-Use Transfer
Pattern
Negative–NegativeNegative–PositivePositive–NegativePositive–Positive
Proportion(%) 2013–20182018–20232013–20182018–20232013–20182018–20232013–20182018–2023
Change Trend
Significant deterioration0.0020.5170.0610.0286.0791.0240.0240.043
Obvious deterioration0.33112.0731.02929.09717.44450.1010.4151.821
Slight deterioration1.43526.2022.89222.71413.28420.7465.53514.809
Insignificant deterioration2.25733.2685.69615.30314.58816.61217.10049.690
Insignificant improvement3.90822.00122.44913.55430.9218.79127.12928.514
Slight improvement27.9055.63666.09114.79917.6522.50937.4424.790
Obvious improvement63.9620.3041.7824.5050.0330.21911.8830.318
Significant improvement0.2020.0000.0000.0000.0000.0000.4720.015
Table 13. Results of Ecological Environment Equality Evolution Factor Detection in Longnan City.
Driving FactorsPeriod
2013–20182018–2023
X10.27 *0.12
X20.36 **0.18 *
X30.140.79 **
X40.18 *0.27 *
X50.21 *0.35 **
* means p < 0.05, ** means p < 0.01.
Disclaimer/Publisher’s Note: The statements, opinions and data contained in all publications are solely those of the individual author(s) and contributor(s) and not of MDPI and/or the editor(s). MDPI and/or the editor(s) disclaim responsibility for any injury to people or property resulting from any ideas, methods, instructions or products referred to in the content.

