1. Introduction
The global map of saline soils published by the Food and Agriculture Organization of the United Nations (FAO) in 2021 estimates that saline soils are widespread in more than 100 countries and regions of the world, covering more than 833 million hectares, or 8.7% of the Earth’s surface, most of which are found in naturally arid or semi-arid zones in Asia, Africa, and Latin America. Presently, the situation of arable land resources is dire, with low land quality. Soil salinization and secondary salinization have emerged as primary contributors to the desertification and degradation of land [
1]. Consequently, due to various factors, portions of arable land have experienced phenomena such as salt and alkali accumulation, leading to severe land degradation and abandonment [
2]. Thus, for agriculture to flourish sustainably, the accurate prediction and effective monitoring of soil salinity and alkalinity at a broad regional scale are crucial.
Soil salinization is a global issue, and traditional field soil sampling methods require a lengthy process of data accumulation and handling, often lagging behind the cyclical natural processes and failing to meet the demands of agricultural research. Since remote sensing technology is always evolving, using it to monitor and study saline–alkaline soil ensures the availability of information needed for both the sustainable growth of agriculture and the management of this type of land. One of the main methods used to monitor soil salinization is remote sensing [
3]. International efforts to monitor soil salinity using remote sensing began in the 1970s [
4,
5,
6]. Satellite remote sensing technology has acquired nearly 40 years of observational data, laying the foundation for the mapping, quantitative inversion, and dynamic monitoring of soil salinity. These observational data record solar reflection signals (visible and near-infrared bands), thermal infrared emission signals (thermal infrared bands), and microwave emission and radar scattering signals (microwave bands) from the land surface. These signals contain complex information such as soil moisture, vegetation cover, and surface roughness. Separating the soil salinity signal from this information is the main task of remote sensing inversion. With the support of ground sampling data, various methods for soil salinity inversion have been developed. China started employing visible-light bands from remote sensing in the 1980s to reverse the salinity of soil. Because spectral reflectance and saline alkaline soil characteristics have a complicated and nonlinear relationship [
7], artificial neural networks have gradually been used to determine the saline alkaline parameters [
8,
9,
10]. Based on the salt content value and radar backscatter coefficient, Liu et al. [
11] constructed a quantitative inversion model for soil salt content in the Jiefangzha irrigation district using a back propagation artificial neural network (BP ANN), which was consistent with the ground validation results. Sun [
12] took the Songnen Plain in western Jilin Province as the study area, and after the Box Cox transform of the measured EC of the sampled soils satisfied the normal distribution, the optimal spectral parameters were constructed based on the correlation between the spectral reflectance of EC and Sentinel-2 MSI in various bands, and then, a support vector machine (SVM) was used to build the linear regression model, while regression tree (RT), Gaussian process regression (GPR), and ensemble tree (ET) methods were used to build the EC inversion models. The test results of the model on the validation set showed that the GPR model performed optimally (R
2 = 0.66, RMSE = 0.48 m S/cm, MAE = 0.52 m S/cm), and the R
2 was improved by 29.04% compared with the traditional linear regression model. There is currently a dearth of thorough literature that summarizes and analyzes the state of the research in this field as well as the dynamic shifts in remote sensing inversion of soil salinity, both domestically and internationally. Traditional literature summarization methods such as one-by-one reading, tracing back, and qualitative summarization reveal low efficiency, low timeliness, and serious deficiencies in objectivity and intuitiveness when facing massive literature targets [
13,
14].
Bibliometric analysis is a kind of cross-science that applies mathematical and statistical methods to quantitatively analyze all knowledge carriers; it integrates several disciplines, such as mathematics, statistics, and bibliography, to form a comprehensive knowledge system focusing on quantification. The main measurement objects of bibliometric analysis include the volume of literature (including various publications, especially journal articles, and citations), the number of authors (including individuals, collectives, or groups), and the vocabulary (various literature markers, such as narratives, etc.). The essential feature of this method of analysis is that its output must be “quantitative”, i.e., when studying the use of a particular teaching methodology, it is necessary to collect a wide range of relevant literature and to count the number of such documents, their sources, etc. This refers to the analytical method of researching the collected literature on a particular aspect in order to determine the nature and condition of the subject of study and to derive one’s own viewpoints from it, so as to provide a systematic and comprehensive account and commentary on the research results and progress of a certain discipline or topic within a certain period of time, after summarizing, organizing, analyzing, and identifying them [
15]. Bibliometric analysis is a powerful tool that can help researchers gain a deeper understanding and analyze the development of knowledge domains from a quantitative perspective. Citation management software tools for information visualization are primarily used to measure and analyze data from the scientific literature [
16]. They can also be used to identify important literature, hot research topics, and frontier directions in a particular scientific field, as well as to draw knowledge maps of how science and technology have developed, and to intuitively display information panoramas of scientific knowledge fields [
17]. The mapping methods used in bibliometric analysis mainly rely on a variety of visualization tools and techniques that can present complex bibliographic data in an intuitive and easy-to-understand graphical form. The following are some common mapping methods for bibliometric analysis: citation network analysis, co-occurrence analysis, cluster analysis, temporal order analysis, and word cloud analysis, to name but a few. In order to carry out these mapping operations, researchers can use a variety of professional bibliometric analysis software platforms or tools; for example, CiteSpace and VOSviewer are professional bibliometric information analysis software platforms that can be combined with SPSS and other software to analyze the main authors of the research in relevant fields, along with the issuing organizations, keywords, and other information, which can be used to understand the focus of the research in related fields through keyword clustering analysis. These tools usually have powerful data import, cleaning, analysis, and visualization functions, which can help researchers easily complete the mapping work needed for bibliometric analysis.
When conducting scientific research, scientists must sift through a vast volume of material. The first challenge to be addressed before beginning any research is how to identify the research hotspots within the literature. CiteSpace and VOSviewer, as a mainstream software for knowledge graph analysis and bibliometric mining, plays a vital role in domestic and foreign review research. They can show the relationships between papers as a scientific knowledge graph, which can be used to both organize the history of previous studies and show the links between documents. Additionally, it can help give us a rough idea of the potential for future study. Many scholars, at home and abroad, have conducted detailed studies and overviews from different perspectives, scales, and regions, but there is a lack of overview studies on the remote sensing inversion of soil salinity based on bibliometric analysis.
In order to fulfill our research objectives, we asked the following research questions: Q1. What are the trends in the scientific literature on the remotely sensed inversion of soil salinity? Q2. What are the future research trends? The specific objectives of this study were as follows: (1) to obtain bibliometric information on scientific studies extracted from the Web of Science (WoS) Core Collection database as a data source; (2) to use bibliometric analysis methods to transform and analyze the quantitative data of the selected articles; (3) to use the total number of citations to identify the main authors, countries, institutions, etc., in this field of study; and (4) to use keywords to analyze the research history and current research hotspots. The remainder of this paper is organized as follows:
Section 2 describes the data and methods used in the bibliometric analysis.
Section 3 describes the basic features and research hotspots of remote sensing inverse soil salinization studies.
Section 4 discusses the research hotspots in the field of the remote sensing inversion of soil salinization and discusses future trends based on the analysis.
3. Analysis of the Fundamental Characteristics of Research on Remote Sensing Inversion of Soil Salinization
A summary of bibliometric statistics was provided by the preliminary results of the bibliometric analysis. Subsequently, we delved into the details of the literature, including authors, institutions, journals, and countries of origin.
3.1. Descriptive Bibliometric Analysis
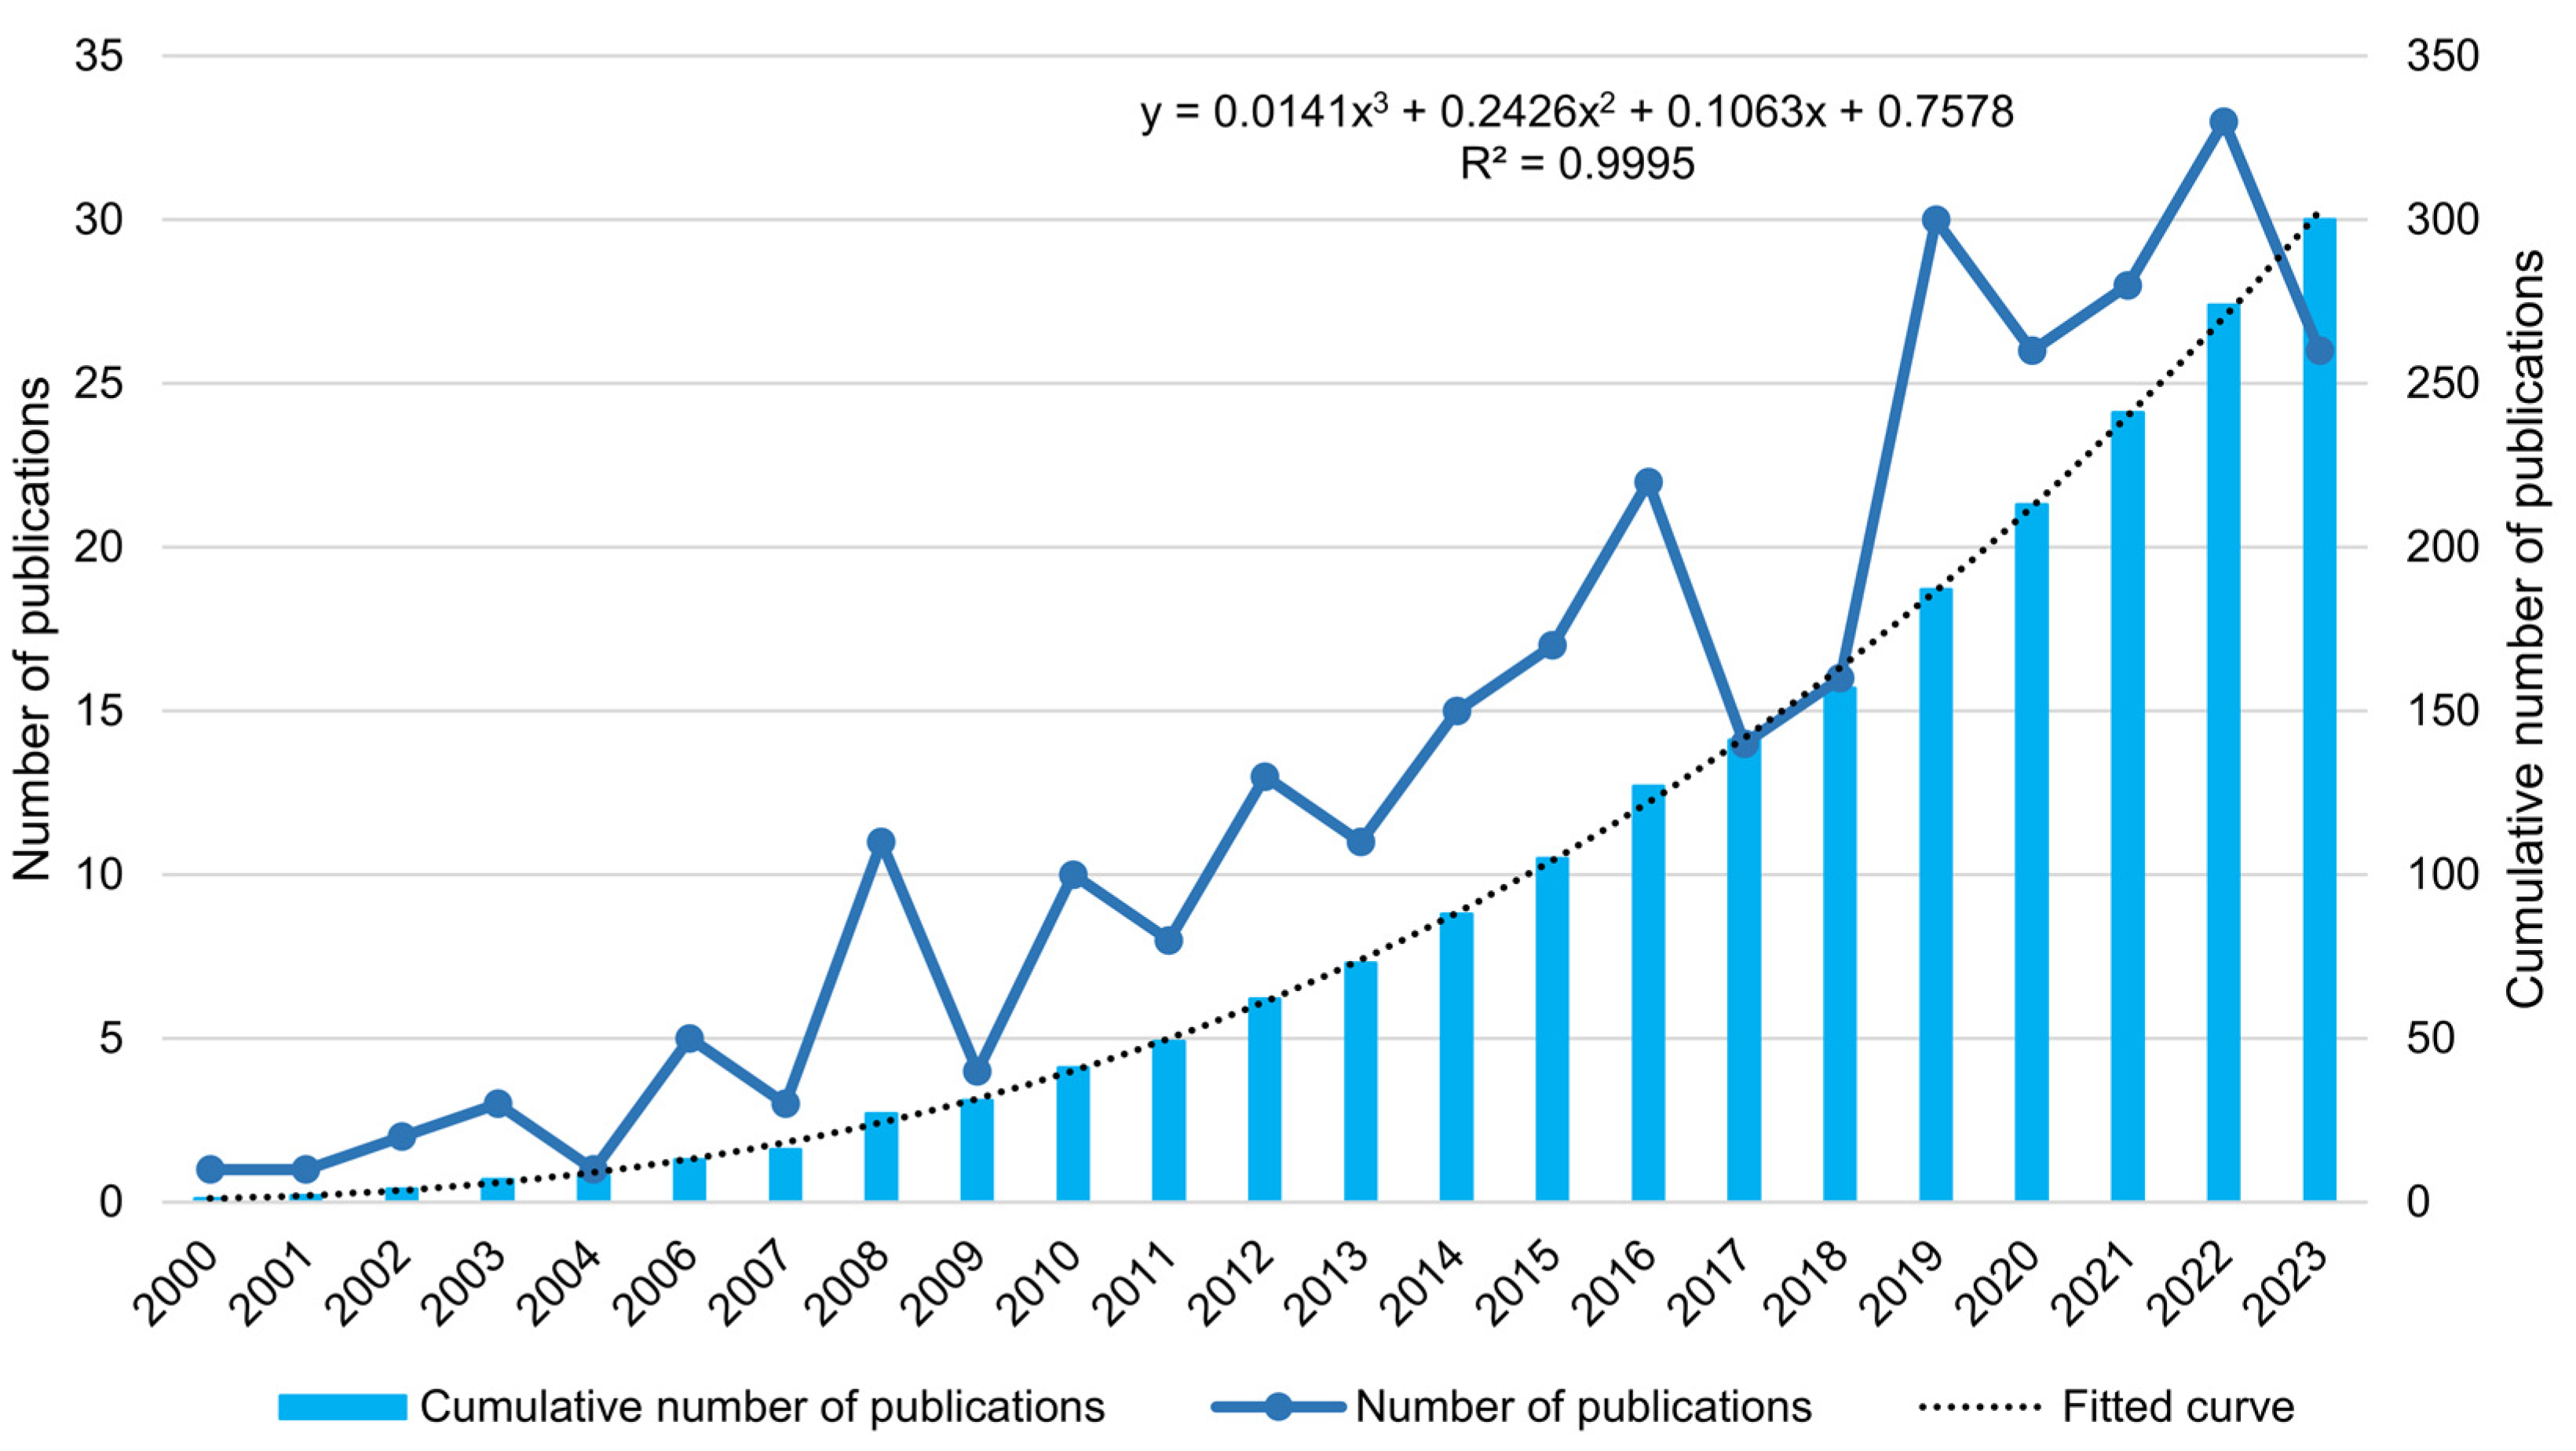
The overall direction of research and the advancement of academic issues can be reflected in the fluctuations in the number of publications over time [
23]. An essential measure of a research direction’s development process and potential future trends is its annual publication volume. The pattern of variations in cumulative publication output can be used to determine the phases of development and potential future directions for research.
Figure 1 presents the scientific achievements during the study period. From 2000 to 2007, the research was in its initial stages, with few achievements. Then, there was a period of erratic growth from 2008 to 2014. There were 227 publications in the ten years following 2014, accounting for 75.67% of all publications.
Regression analysis of the data from 2000 to 2023 yielded a well-fitting index curve of y = 0.0141x3 + 0.2426x2 + 0.1063x + 0.7578 (R2 = 0.9995). The fitting curve indicates that the field of remote sensing inversion of soil salinization is still in its early stages and is predicted to expand quickly in the coming years. A growing number of academics are beginning to concentrate on the topic of remote sensing monitoring of soil salinization, which has been growing actively and is in a comparable developmental stage. The pattern of studies indicates that future publications will continue to be published in greater numbers.
3.2. Analysis of Primary Authors
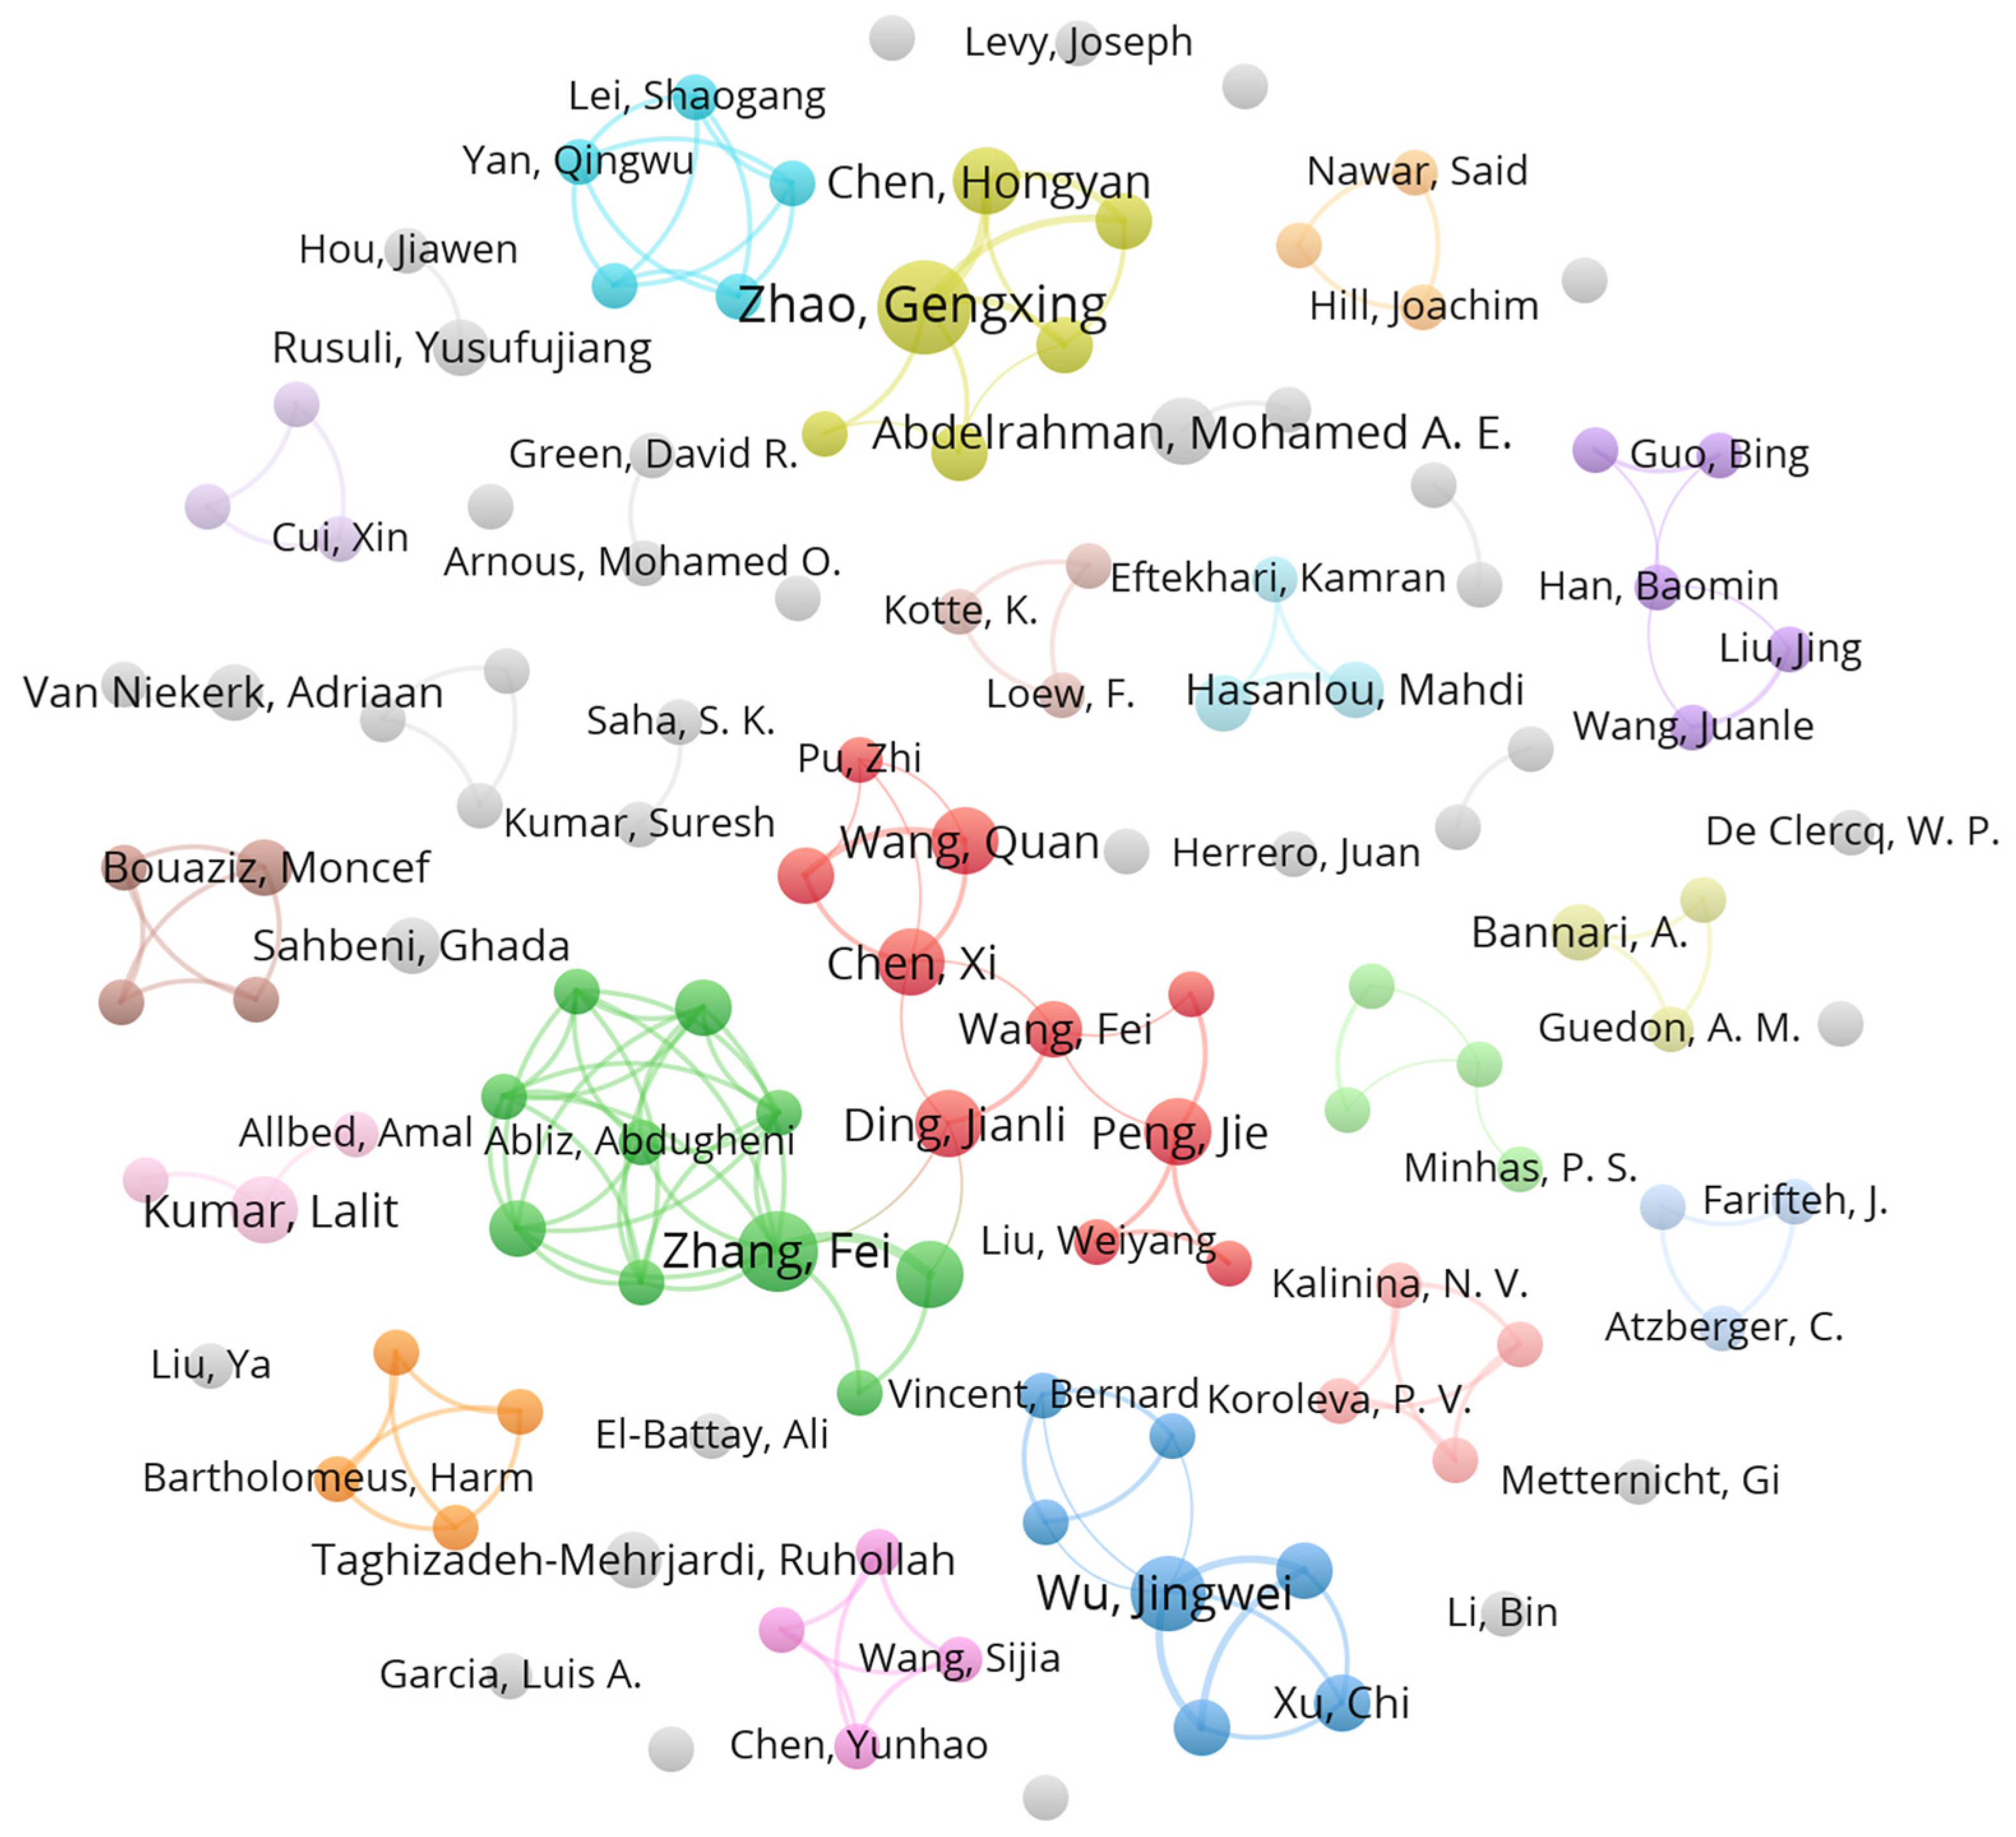
According to the statistics, the maximum number of publications by an author is eight, denoted by Nmax = 8. Hence, N = 2.11 articles, rounded to the nearest integer (3), define authors who have published at least three articles as core authors in this field. Therefore, 36 authors were identified as core contributors to this research.
From the author collaboration network diagram (
Figure 2) and the top 10 authors by publication volume, it can be observed that the three authors with the largest nodes are Zhao, Gengxing with eight papers; Zhang, Fei with six papers; and Wu, Jingwei with five papers, all hailing from China. Based on the optimization of the cooperation network [
24] using pathfinding algorithms, the main groups of authors consist of three concentrated author clusters: the Zhao, Gengxing team; the Zhang, Fei and Ding, Jianli team; and the Wu, Jingwei team. Among them, the research area of Zhao, Gengxing’s team mainly focuses on the Yellow River Delta in China [
25], Ding, Jianli’s team primarily focuses on Xinjiang, China [
26], and Wu, Jingwei’s team concentrates on the Hetao Plain in China. There are also many cooperation networks composed of small nodes and scattered independent authors, indicating that the concentration of authors is not high and the research teams are dispersed. The loose connections between different research teams suggest weak citation relationships among them, which could lead to academic barriers over time, adversely affecting sustainable development research.
The top ten authors by citation frequency are listed in
Table 1. Ding Jianli has the highest citation frequency and can be considered the most influential author. Among the ten most influential researchers, three are from China, and the rest are from Australia, Germany, Poland, India, Tunisia, and the United States. The two authors with the most publications—Zhao Gengxing (eight papers) and Wu, Jingwei (five papers)—are not listed in
Table 1, because of their comparatively low citation counts.
3.3. Research Institutions and Countries
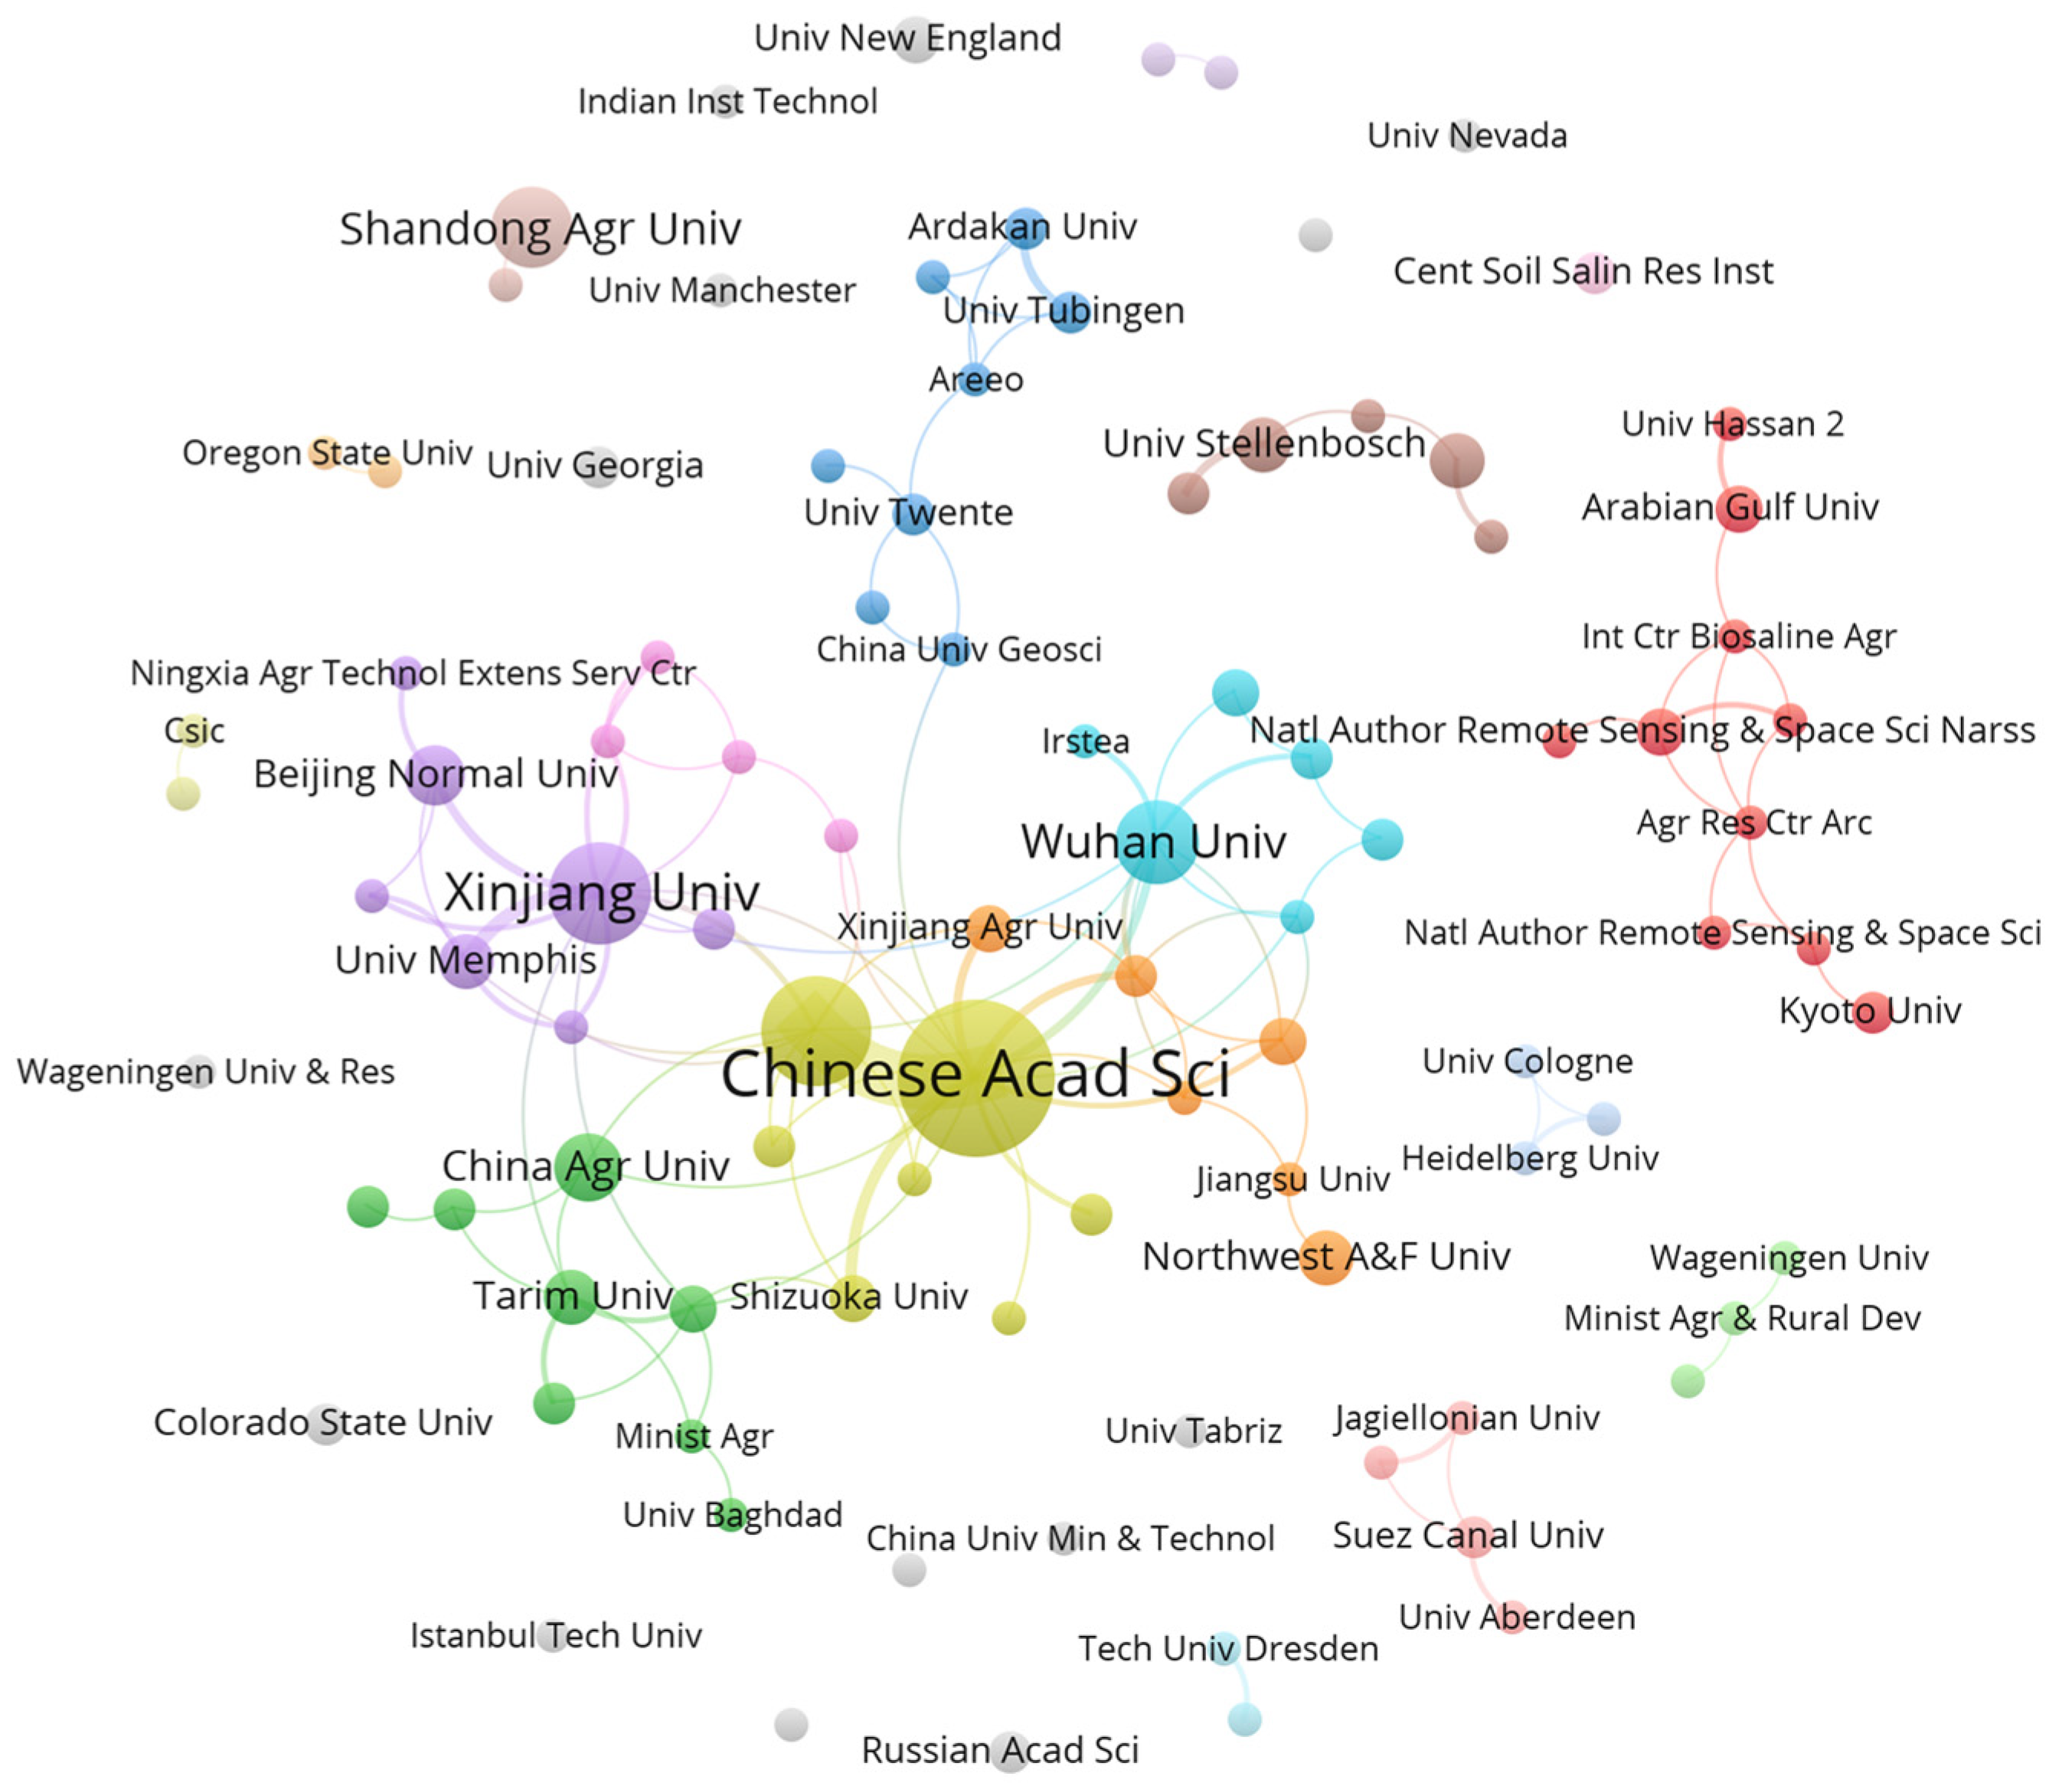
Research institutions with more than two published papers were selected as the research objects to identify the top ten institutions by citation frequency, as shown in
Table 2. The three institutions with the highest citation frequencies are the International Institute for Geoinformatics Science and Earth Observation, Curtin University of Technology, and Xinjiang University. Among the top ten, five institutions are based in China, indicating a significant contribution of Chinese research in the field of saline alkaline land, both nationally and globally. Globally, China, the Netherlands, the United States, Australia, and Egypt are the leading nations in the field of remote sensing soil salinity research, setting the stage for future research endeavors. Although institutions such as Shandong Agricultural University (with 11 publications and 176 citations) and China Agricultural University (with 8 publications and 176 citations) have relatively few citations compared to the top ten, their substantial publication outputs have exerted significant influence on this research. The visualization of the institutions (
Figure 3) reveals a network where larger core institutions connect with smaller ones, indicating close collaborations among Chinese institutions.
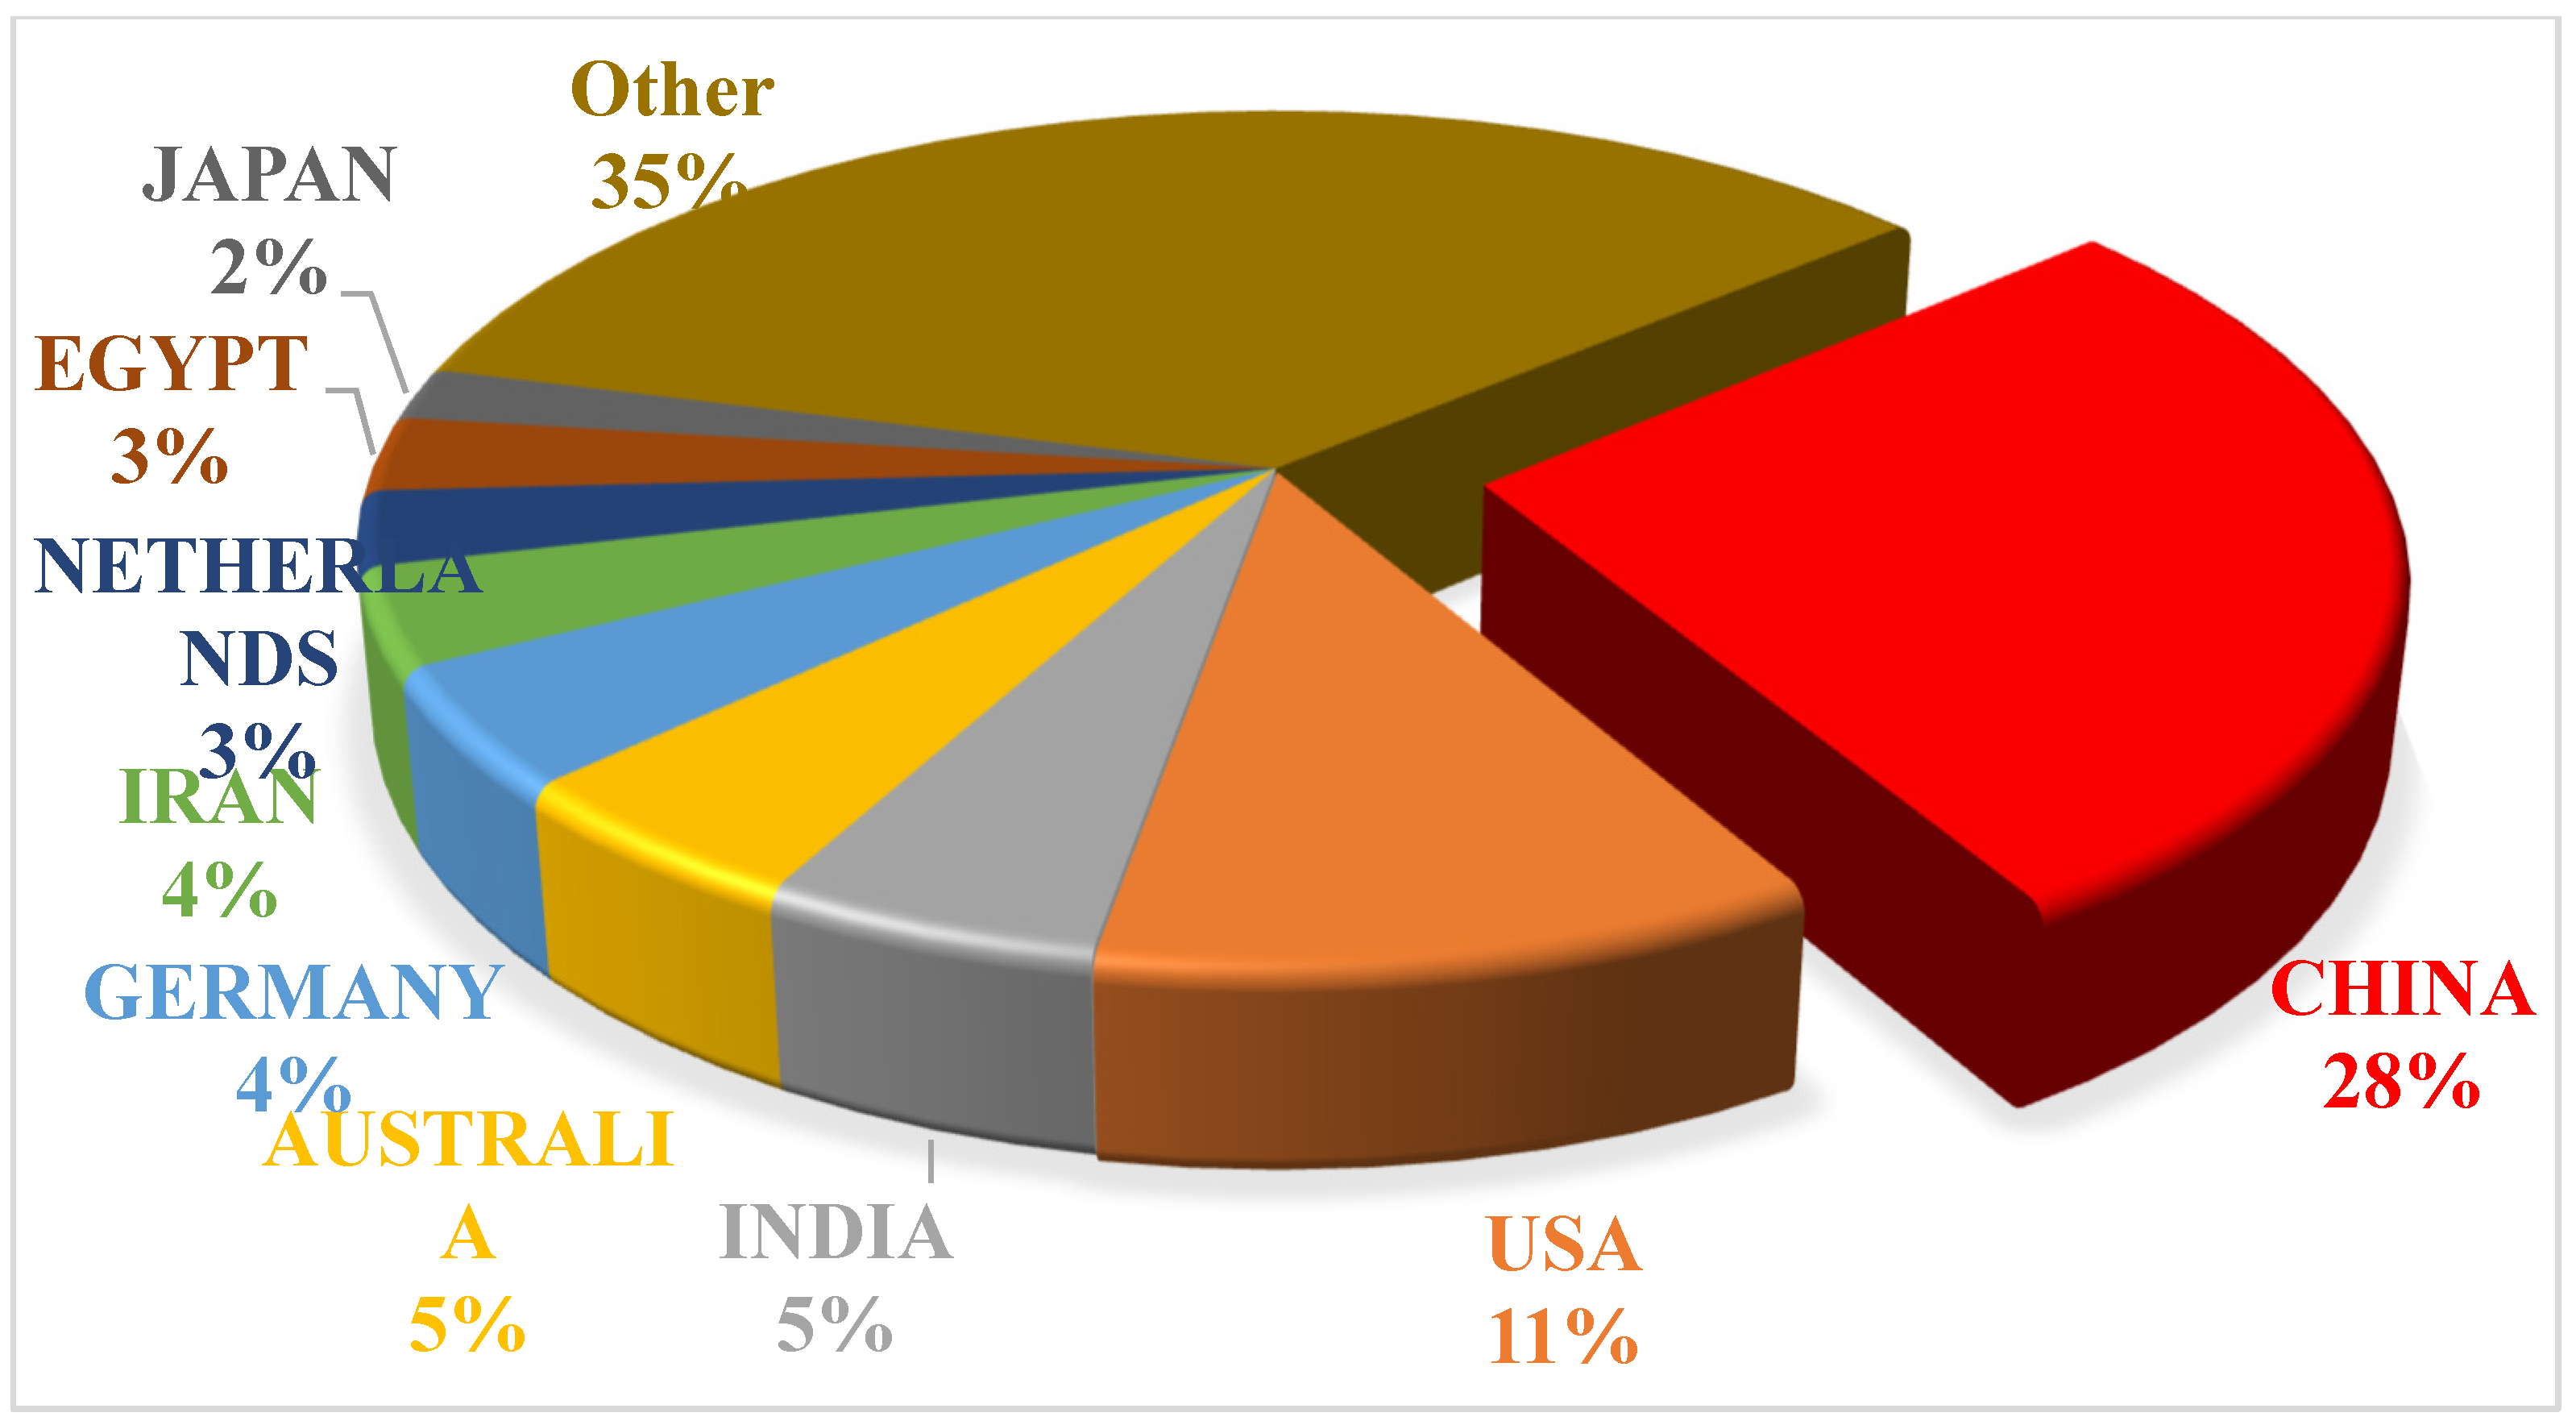
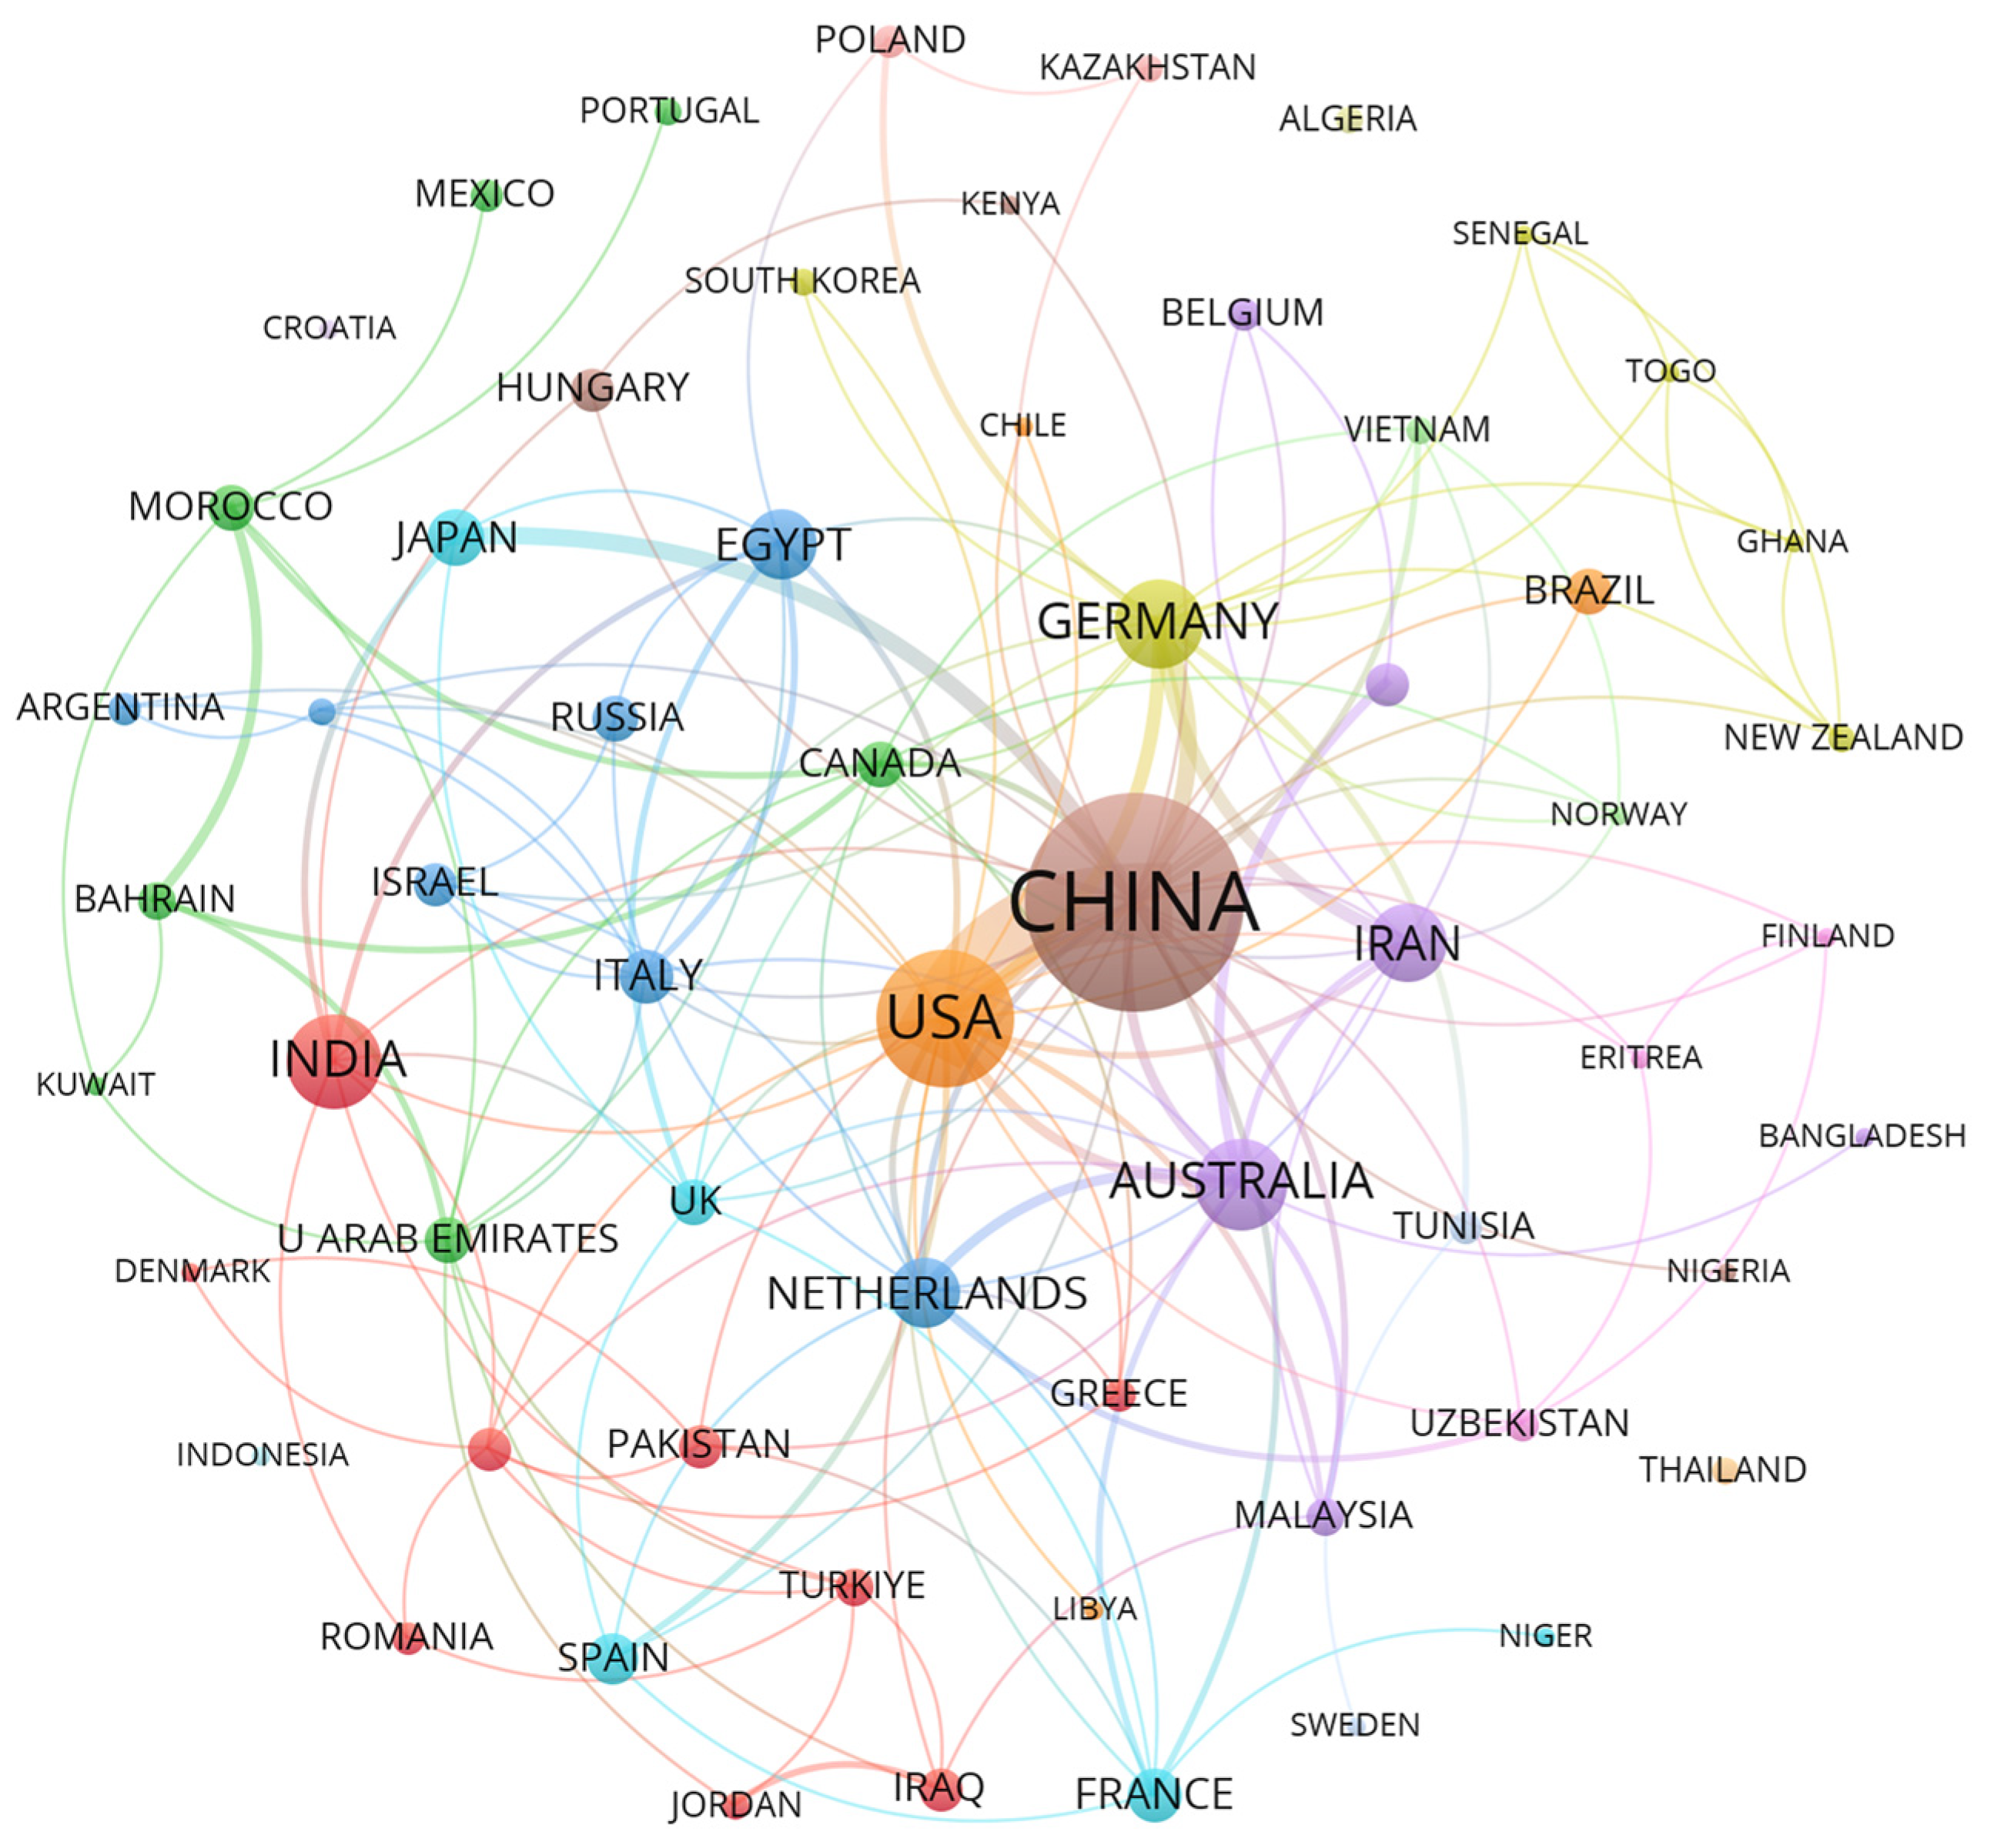
According to the analysis (
Figure 4), China ranks first in publication output, contributing 28% of the total publications. Given China’s vast saline alkaline lands and considerable development potential, along with the intensifying trend of land salinization in some regions, numerous studies reflect that the highest research output in this field is from Chinese institutions and scholars, showcasing China’s growing research prowess. The United States ranks second in publication output, accounting for 11%, followed by India and Australia in the third and fourth positions, both at 5%. The countries with the highest citation frequencies are China (2884 citations), the Netherlands (2040 citations), Australia (1778 citations), the United States (1703 citations), and Germany (1070 citations). An analysis of country relationships (
Figure 5) indicates close collaborations between China and the United States with various other countries, particularly with Australia and Italy, among others. Considering both publication output and citation frequency at the national and institutional levels, China and the United States are the leaders in the research field of remote sensing for soil salinity.
3.4. The Most Influential Journals
The top ten journals by citation frequency published 105 papers (35%), as shown in
Table 3. The five journals with the highest citation frequencies are “Geoderma” (publishing 14 papers), “Remote Sensing” (publishing 47 papers), and the “Remote Sensing of Environment” (publishing three papers). These journals played significant roles in research on remote sensing for soil salinity retrieval.
3.5. Field of Research
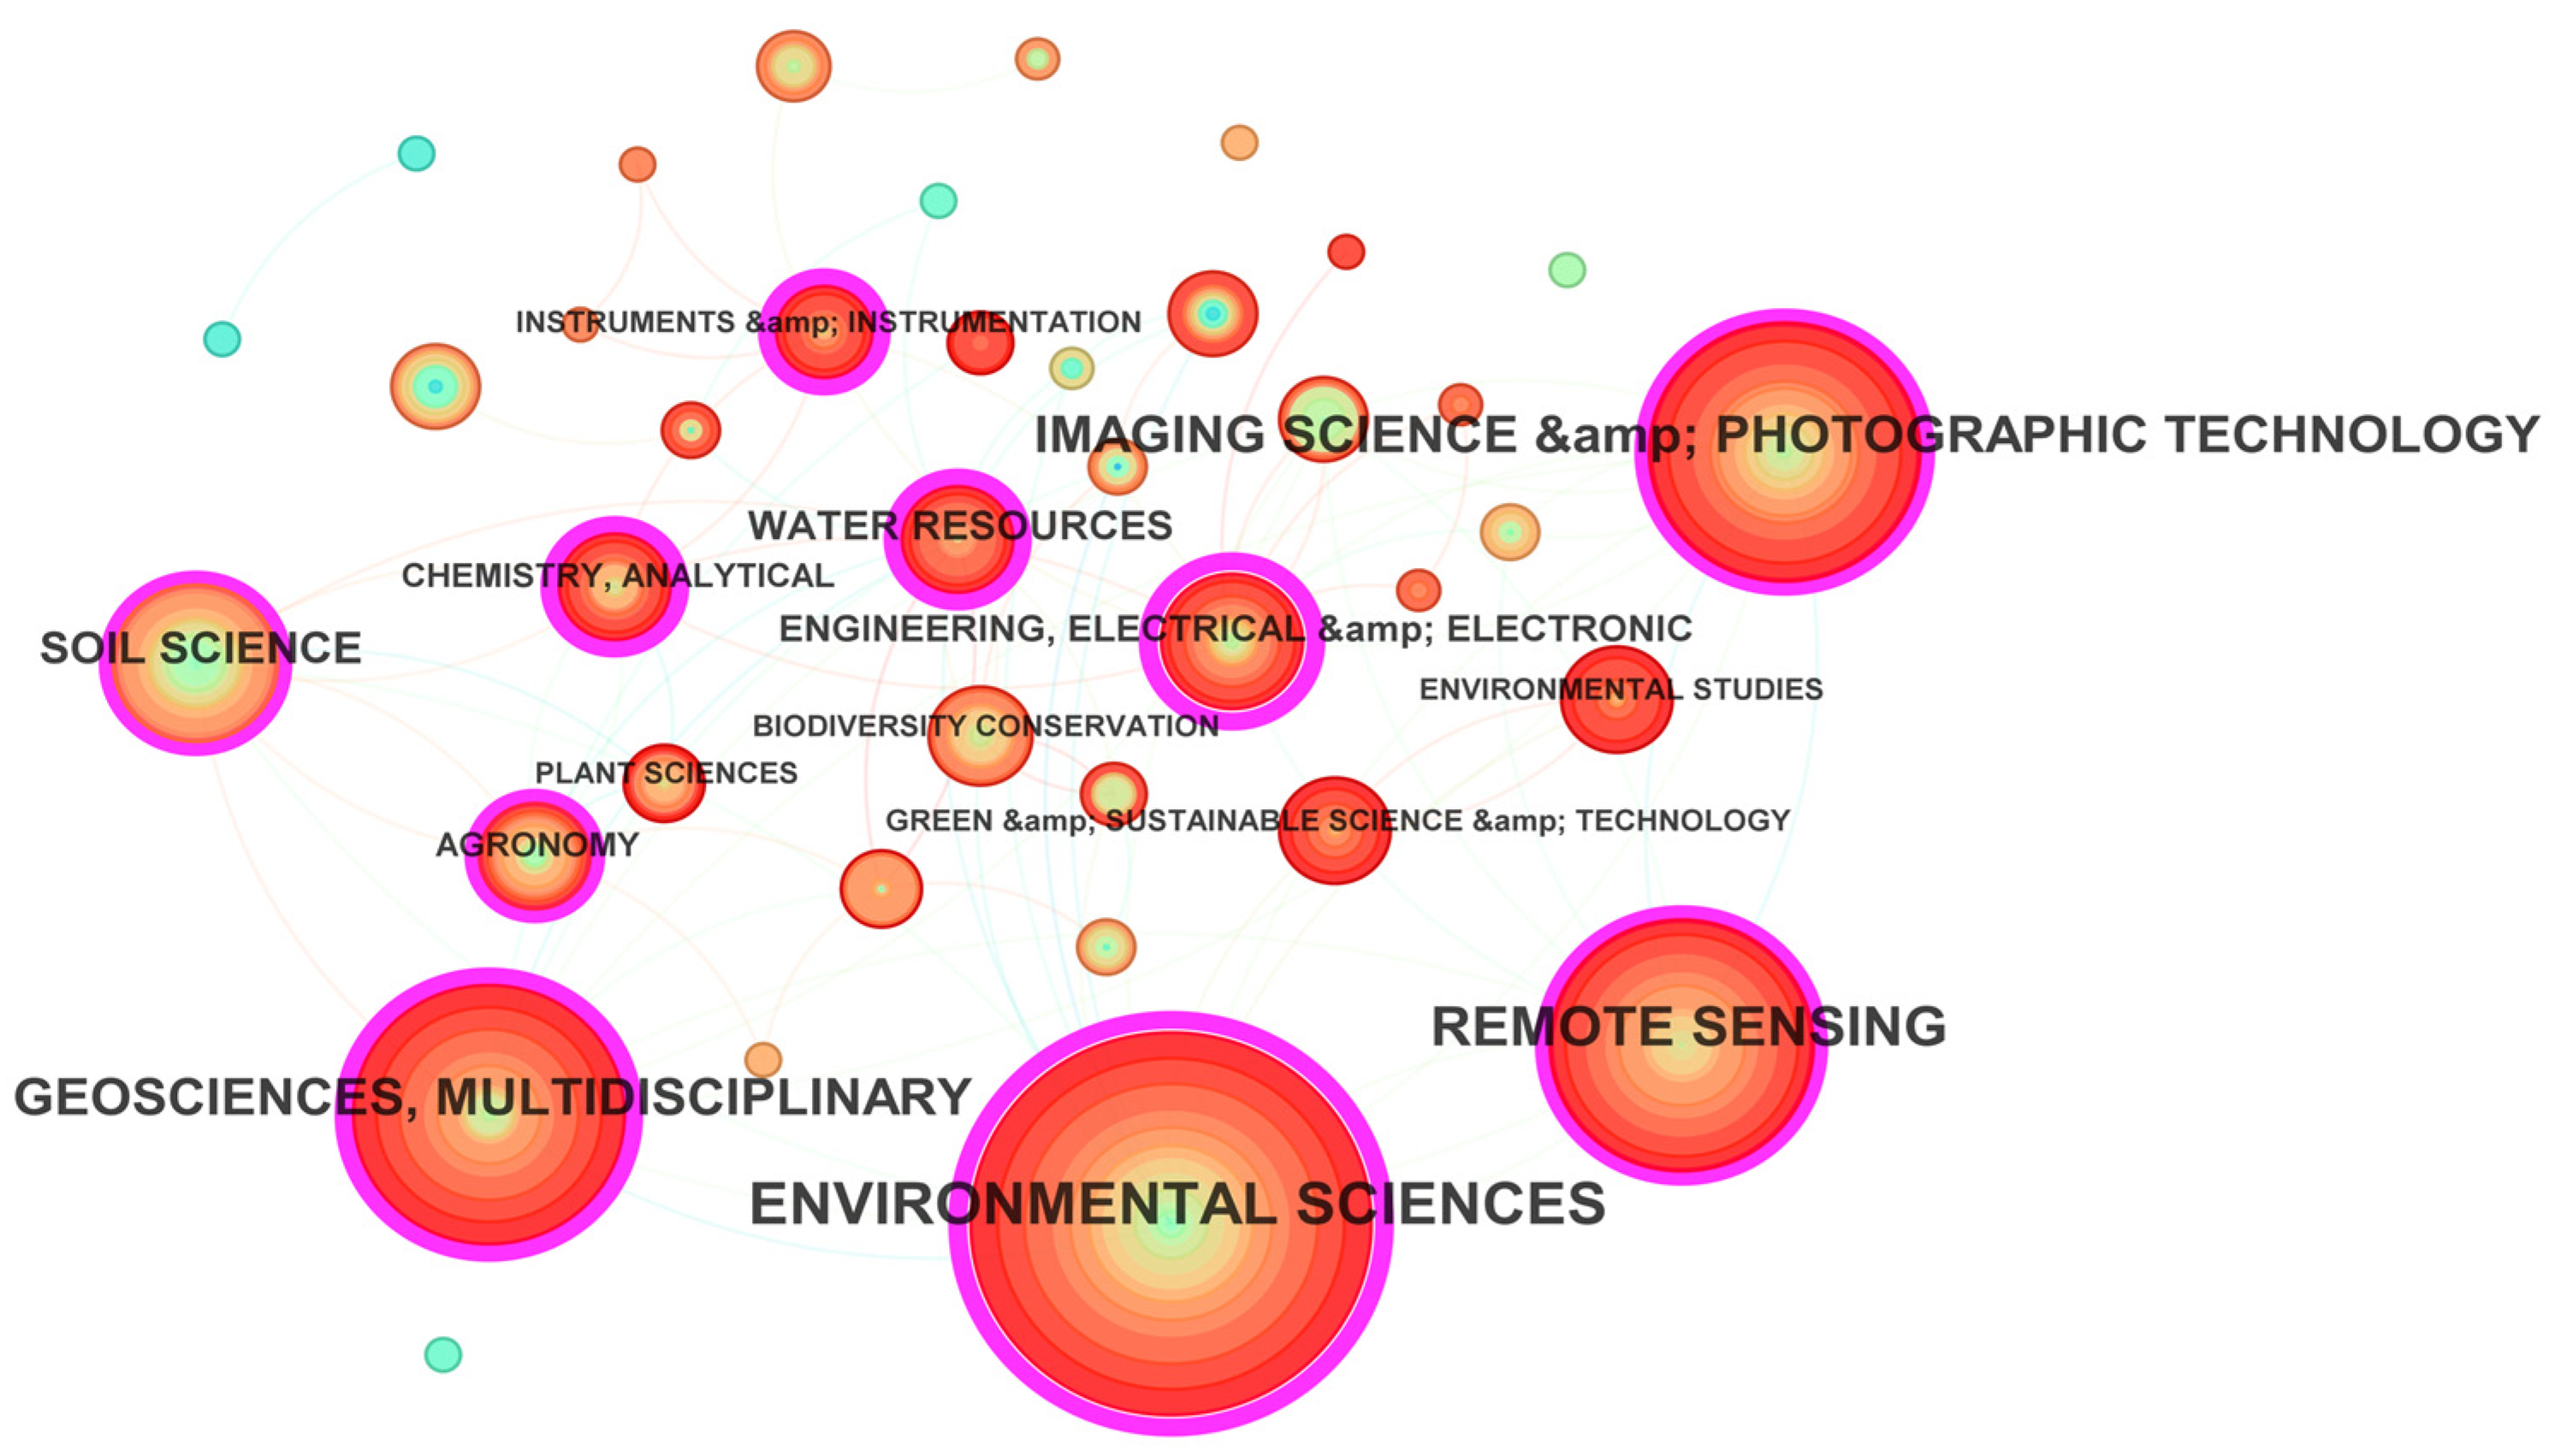
When conducting research field analysis in CiteSpace, the software categorizes research areas based on the features the of literature data, such as Web of Science categories and research directions. In the knowledge graph of research fields, one can observe the frequency of occurrence of 39 research areas and the cross-connections between them (
Figure 6 and
Table 4). Among these, environmental science has the highest frequency of publications and intermediary centrality, which is related to the predominant focus of this field on environmental issues such as soil salinization—a topic relevant to the remote sensing monitoring of soil salinity. Remote sensing ranks second in publication frequency but exhibits relatively lower intermediary centrality, indicating limited connections with other fields. Water resources and instruments and instrumentation show higher intermediary centrality, suggesting closer connections with other research domains. Since changes in soil moisture significantly affect soil salinity, it is reasonable that water resources—ranking second in intermediary centrality, with a value of 0.37—are closely associated with the study of soil salinity. The other top 10 research fields include chemistry, analytics, geosciences, and multidisciplinary, among others.
3.6. Study Region
With the increasing trend of global warming, the problem of soil salinization in middle- and low-latitude regions will become more and more obvious, becoming especially pronounced in China, the United States of America, Hungary, and Australia, as well as becoming more serious in the north and east of Africa, South America, the Middle East, Central Asia, and South Asia. Global soil salinization hotspots include numerous Central and West Asian nations, as well as Pakistan, China, the United States, India, Argentina, and Sudan [
27]. The three primary saline alkaline zones on Earth are the Songnen Plain in China, Victoria in Australia, and California in the United States.
China has a diverse range of saline soils with abundant resources spread across vast territories. For the study of saline soils in China, there are many different types to consider, including coastal saline soils in the eastern low plains, soda saline soils in the Songnen Plain in Northeast China, oasis saline soils in Xinjiang, silty saline soils in the irrigation area of the Hebei Plain (
Figure 6), tidal saline soils in the Huang-Huai-Hai Plain, alkaline saline soils in the Hexi Corridor, acidic sulfate saline soils in the southern coastal areas, and saline soils in the extremely arid regions of Qinghai and Xinjiang [
28].
Saline soils in China are mainly distributed in the northern arid and semi-arid areas, with a total area of 36.3 million hectares, accounting for nearly 4.88% of China’s available land area—significantly higher than the global average [
29]. Among them, saline alkaline land covers 7.6 million hectares of arable land, accounting for 6% of the arable land area, and is widely distributed in coastal and inland areas. A large part of this saline alkaline land, serving as reserve land, remains undeveloped. Through an analysis of research the literature, Inner Mongolia’s Hetao irrigation district [
30], Shandong’s Yellow River Delta [
31], the oasis and Aibi Lake in the Weigan River Kuqa River Basin in Xinjiang [
32], Yinchuan in Ningxia [
33], and the Songnen Plain in Northeast China were identified among the areas of high research interest, with secondary salinization being a hot topic. This is consistent with the findings of the China Geological Survey’s 2020 distribution survey of saline alkaline land in China. For further information, see the distribution map of China’s saline alkaline land in the He Jin article “The Earth’s Misery—Saline-Alkali Land” on the China Geological Survey’s website (
http://www.chegs.cgs.gov.cn/, accessed on 1 January 2024).
Outside of China, research areas include the Aral Sea in Central Asia [
34], the Nile River Basin in East Africa [
35], the Mediterranean coast of Europe (affected by factors such as groundwater extraction and rising sea levels), and Western Australia, which are consistent with the most influential countries. For more details, view the 2021 World Soil Salinization Distribution Map from the Food and Agriculture Organization of the United Nations.
3.7. Keyword Co-Occurrence Analysis
The keyword co-occurrence analysis method uses terms or noun phrases that appear together in a body of literature to determine the relationships between various topics in the field of reference. An association network composed of topic term pairs can be constructed by calculating their frequency of occurrence in a specific document within a corpus of literature. The number of nodes in the graph represents the total number of keywords, while the number of edges in the graph represents the number of links between keywords. A relationship exists between two keywords as long as they are found in the same document.
Figure 7 illustrates the clustering results of keywords in this research over the past 20 years, where keywords belonging to the same cluster are arranged in vertical columns. Moreover, the color gradient, from blue to yellow, represents the keywords’ average year of occurrence, from old to new, aiding in identifying the evolution of research hotspots within each cluster.
Based on the color characteristics of the keyword co-occurrence graph for the WoS database, the key terms that appeared during the initial phase from 2000 to 2007 included remote sensing, saline soil, Landsat, geographic information system (GIS), reflectance spectroscopy, etc. The amount of salt present in soil serves as a significant indicator of its salinization level, and remote sensing technology has increasingly been used to track soil salinization. During this period, the main focus was on identifying saline soils using optical satellites and GIS methods to understand the extent, area, and degree of soil salinization in a particular region. Among them, the main node was “remote sensing”, followed by “soil salinity”. Remote sensing extends several prominent paths from the node, with close connections to vegetation indices, spectral indices, factor analysis, and spectral reflectance, which are used in remote sensing studies for retrieving soil salinity information. Particularly emphasized is the keyword “water”. Significant differences in commonly used spectral indices over various moisture gradients are caused by the influence of soil moisture content on spectral reflectance in the near-infrared and infrared bands. Thus, soil moisture is seen as an important factor influencing the accuracy of soil salinity monitoring [
36]. During the period from 2007 to 2017, which was characterized by development, high-frequency keywords included vegetation, model, index, indices, spectroscopy, reflectance, salinity index, land degradation, vegetation index, water, area, Yellow River Delta, biomass, etc. The research started to shift from qualitative to quantitative during this time, and studies began looking at the connections between soil salinity, hyperspectral data, and land satellite data. During this time, researchers began examining the connection between spectral reflection characteristics and soil’s physico-chemical qualities (e.g., salinity index, conductivity), with the goal of using remote sensing images to dynamically monitor soil salinity. Alternative remote sensing indices for determining soil salinity in agricultural fields have been those linked to water stress or vegetation health. Plants’ health is hampered by salt stress, which in manifests symptoms akin to those of a water shortage. Significant growth patterns, spectral characteristics of salt-tolerant plants, or salt crusts and efflorescence that might be present in bare soil can all be used to infer high salt concentrations. A variety of salinity indices are available for the detection and mapping of soil salinity using multispectral and hyperspectral satellite sensors, much like vegetation indices. On the other hand, the color, roughness, salinity, and soil moisture all have significant impacts on surface reflectivity. Choosing one index may not be appropriate in every situation, because these indices do not always produce outcomes. In summary, the normalized difference vegetation index (NDVI), a reliable and error-free indicator, appears to be able to quickly evaluate the spatial patterns of vegetation health. Statistical techniques can be applied to link soil parameters with various indicators based on this criterion. Moreover, there are drawbacks when describing the productivity of saline alkaline soils in various locations using the productivity indicators obtained from remote sensing. During the period from 2018 to 2023, which experienced rapid development, high-frequency keywords included random forest, Sentinel 2, machine learning, climate change, moisture, etc. This indicates that machine learning and random forest methods combined with Sentinel-2 data are being applied in the remote sensing monitoring of soil salinity.
3.8. Analysis of Emerging Trends in Frontier-Stage Research
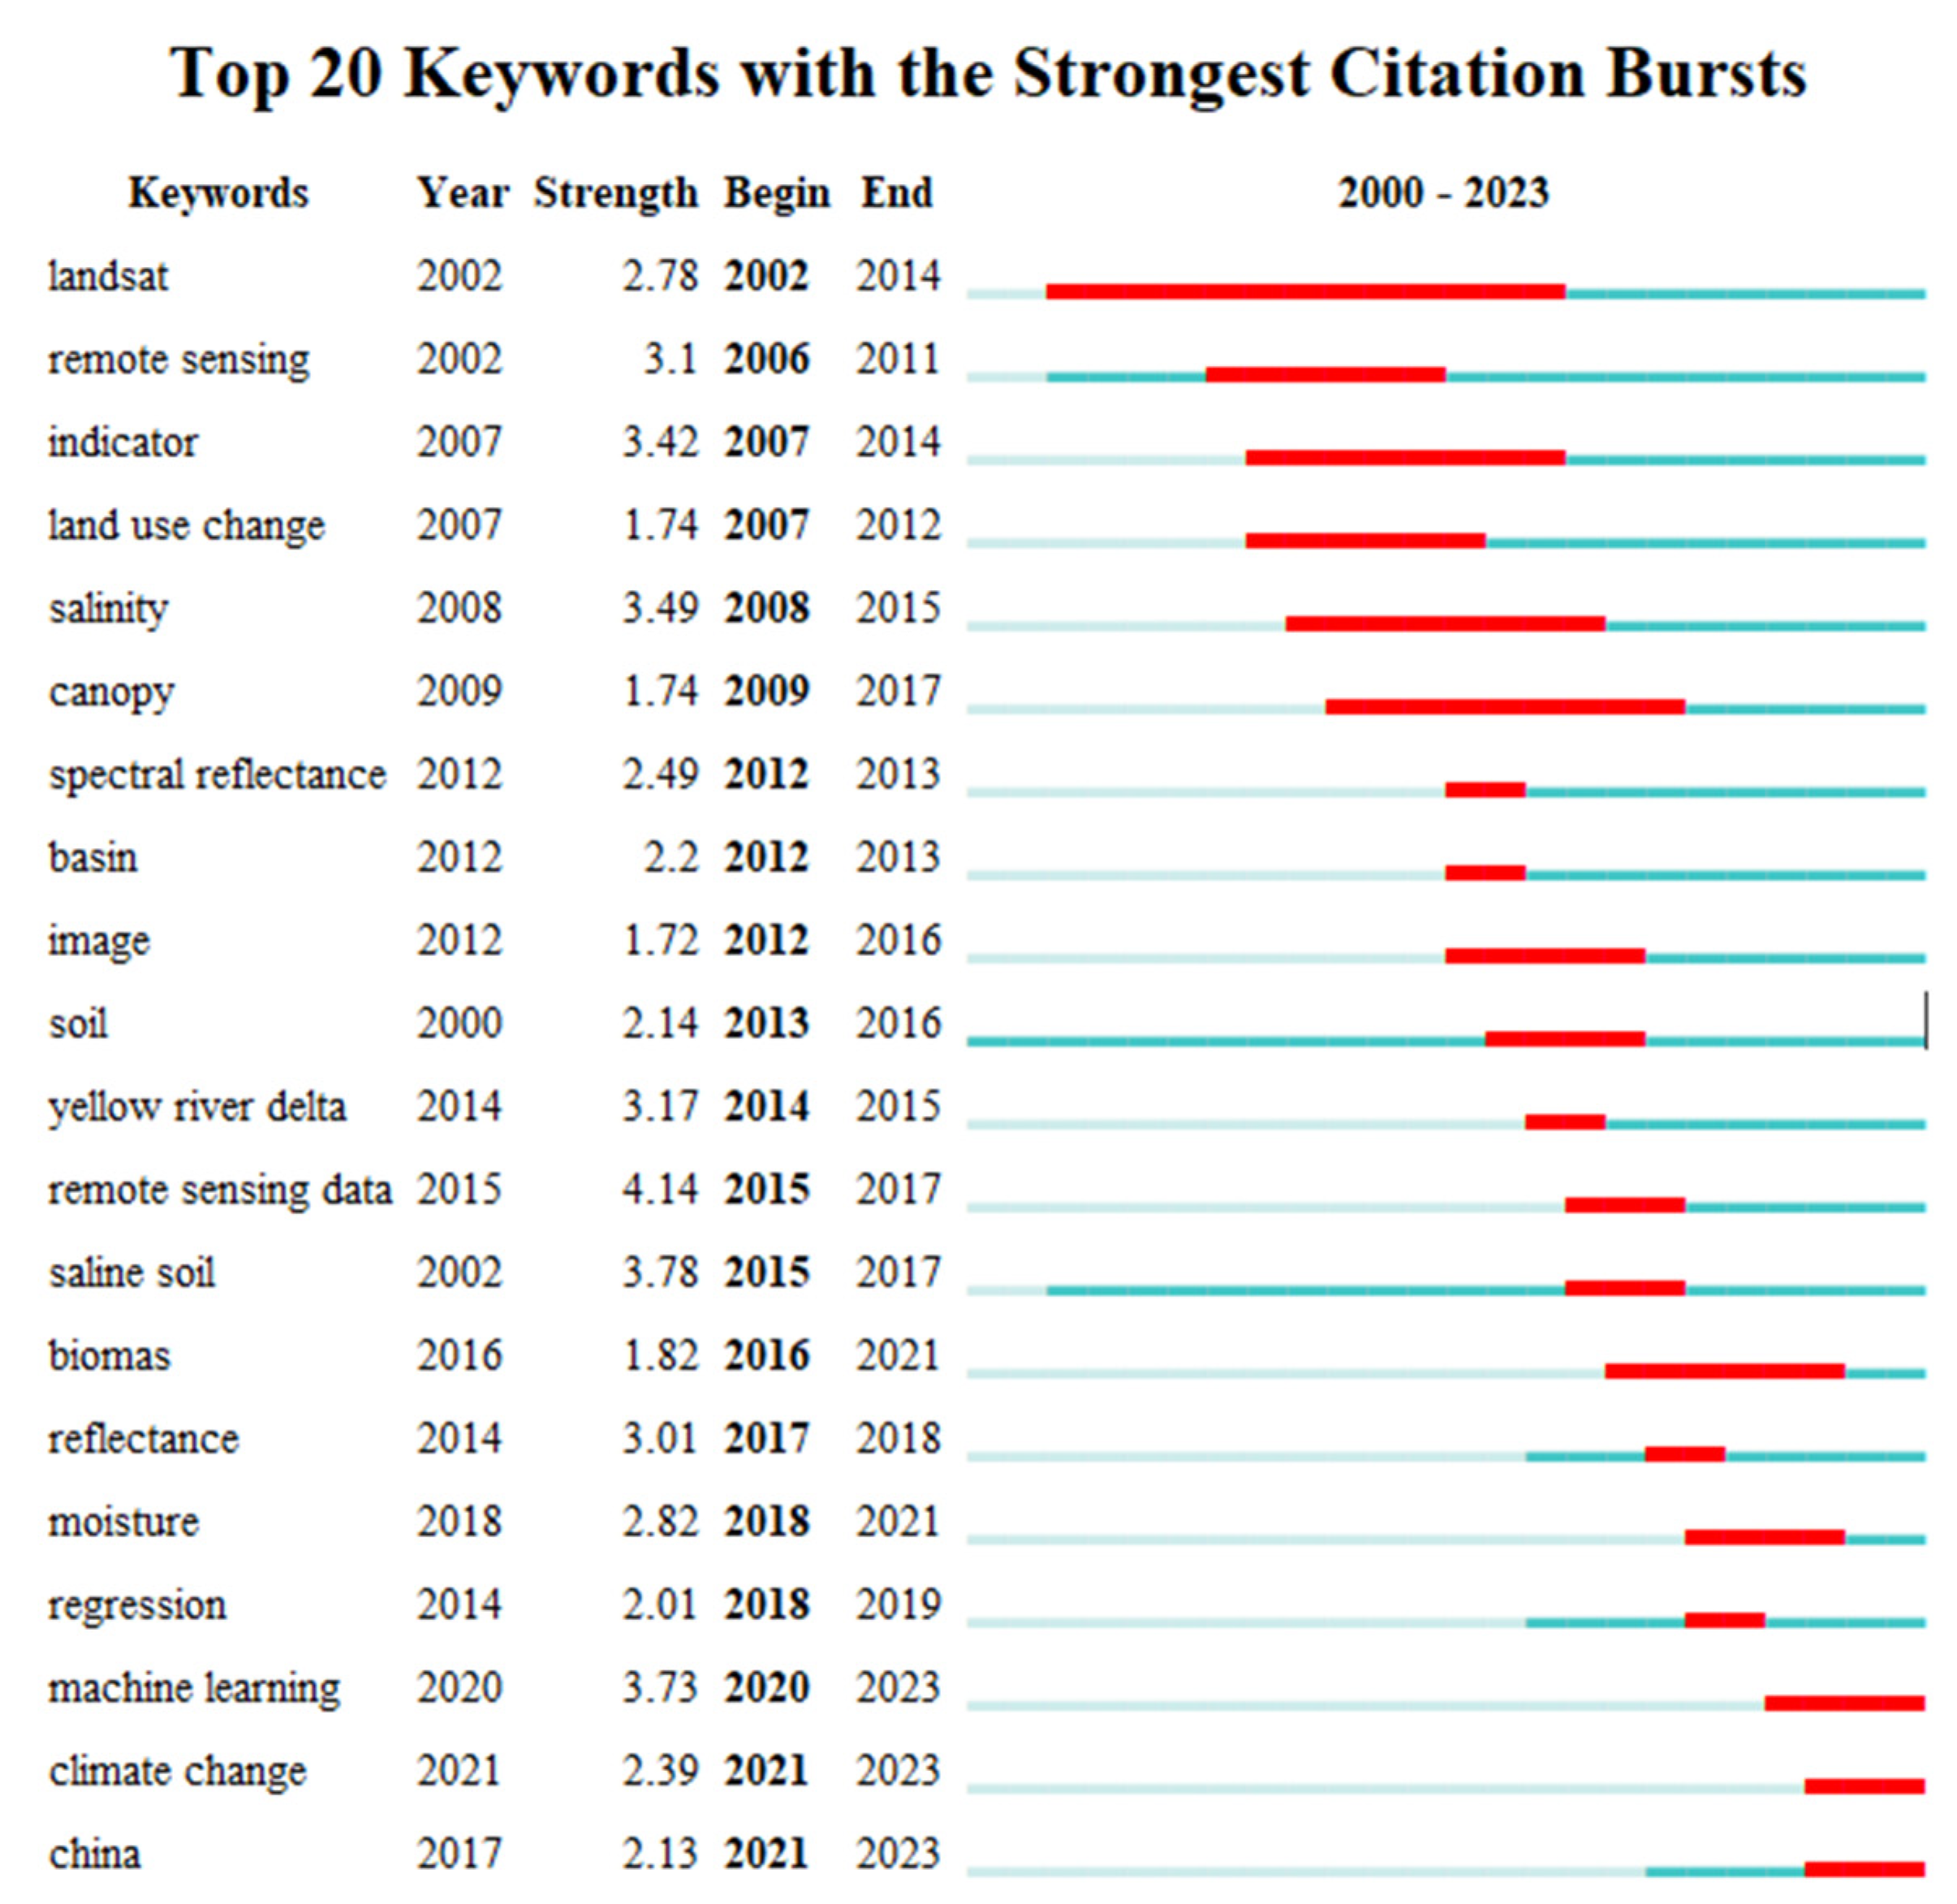
Keyword emergence analysis, aided by the burst detection function of CiteSpace software, divides time into one-year intervals to identify burst keywords. The red range indicates the period with the greatest frequency change, during which the keywords have the most significant impact [
37].
Figure 8 displays the first appearance year (Year), burst strength (Strength), burst start year (Begin), burst end year (End), and their positions on the timeline (with the red portion indicating the burst year). The keywords are arranged in chronological order according to their burst start time, with burst strength arranged from largest to smallest.
From
Figure 8, it can be observed that, for a rather long portion of the early and quite long period of research, soil salinity was inferred using remote sensing satellites such as Landsat. In 2014, the Yellow River Delta emerged as the main research area and entered the spotlight. In this section, the focus is on the keywords emerging in recent years, with the aim of identifying the research frontier. In order to increase the accuracy of inference, researchers in this phase started to account for the impact of external factors such as surface vegetation, soil moisture, and climate change on the outcomes of a remote sensing soil salinity retrieval. This is indicated by the appearance of keywords such as “biomass”, “moisture”, and “climate change” in 2016, 2018, and 2021, respectively. The term “machine learning” began to appear in 2021–2023, which suggests the developing trends and frontier dynamics of applying machine learning techniques to the remote sensing monitoring of soil salinization. It is clear from the keyword emergence analysis that machine learning and remote sensing are gradually becoming more and more important in research on remote sensing soil salinity inference. Among the keywords, those that appeared earlier but emerged in recent years may correspond to the emergence of new technologies or methods.
3.9. The Most Influential Articles
Based on the quantity of citations, the most important works from 2000 to 2023 are listed in this section. Interestingly, the top ten papers by number of citations in all databases match those that are exclusive to the Web of Science (WoS) database.
According to
Table 5, the paper by Metternicht and Zinck, which ranks first in citation count, discusses the potential and limitations of the remote sensing inversion of soil salinity. In this field of study, its early publication date has drawn attention. The article reviews a variety of sensors and techniques for the remote identification and mapping of salt-affected areas, including aerial photography, satellites, airborne multispectral sensors, microwave sensors, video imaging, airborne geophysics, hyperspectral sensors, and electromagnetic induction meters [
38]. The spectral behavior of salts, their spatial distribution on the terrain surface, temporal fluctuations in salinity, vegetation interference, and spectral confusion with other terrain surfaces are the difficulties associated with employing remote sensing data to map areas affected by salt. Spectral decomposition, maximum likelihood classification, fuzzy classification, band ratios, principal component analysis, and pertinent equations are some of the techniques that are covered. Finally, the paper presents an integrated method to simulate the spatiotemporal variability of salinity using various data fusion and data integration techniques. Daliakopoulos et al. [
27] outlined the drivers and pressures of soil salinity, key indicators, and the latest advances in monitoring, modeling, and mapping methods. Their report discusses how salinization affects soil functions, and it concludes by outlining Europe’s salinization situation. In order to support policies and strategies for safeguarding European soils, future research in the field of soil salinization should concentrate on the carbon dynamics of saline soils, further investigate soil properties through remote sensing, and coordinate and enhance soil salinity maps throughout Europe.
Farifteh et al. [
5] explored the possibility of predicting the soil’s salt concentration using partial least squares regression (PLSR) and artificial neural networks (ANNs) at three different scales, employing different datasets in four distinct study areas. The findings show that there is considerable potential for both approaches in terms of mapping and quantifying soil salinity. Performance measures indicate strong similarities between the two approaches, with PLSR showing a minor advantage. This implies that a linear function can be used to approximate the relationship between soil salinity and soil reflectance. Douaoui et al. [
39] analyzed the logistic regression method by combining remote sensing data with European Community ground measurement data in a plain plot in Algeria. Compared to pure regression methods, this approach significantly improved the accuracy of salinity estimation. By integrating remote sensing data with a ground monitoring network, this method allows for the more precise spatiotemporal monitoring of soil salinity in arid regions. Ben-Dor [
40] primarily expressed the potential and possibilities of using hyperspectral remote sensing technology for the quantitative analysis of soil properties, while also discussing the challenges faced and their possible resolution strategies. Through specific case studies, the paper validated the application value of this technology for monitoring soil salinity and other key soil properties, while also expressing expectations and directions for future technological developments in this field. Farifteh et al. [
4] outlined a conceptual framework for a method that combines optical remote sensing data with simulation models and geophysical survey results to economically and effectively predict different degrees (low, medium, severe) of salinization/alkalization. In this integrated method, combining data not only categorizes existing saline soils but also tracks salinization as a soil-forming process. Since the goal of this approach is to integrate data of various scales and types, data fusion and upgrading are crucial. Fan et al. [
41] studied the Yellow River Delta area, assessing the distribution maps of salinized soil over the previous 20 years by combining spatial models, field data obtained at three different times, and remote sensing imagery. Using the Kriging interpolation method, they analyzed the spatiotemporal dynamics of groundwater levels and total dissolved solids (TDSs) over nearly 20 years. The Kriging method, utilizing random subsamples of observations as a basis for validation, significantly improved the accuracy of the soil salinity predictions. An examination of spatial data correlation revealed a close relationship between groundwater dynamics and the distribution and evolution of salinized soil, with a higher TDS and rising groundwater levels being associated with worsening soil salinization.
Allbed et al. [
42] focused on an oasis in eastern Saudi Arabia, establishing various vegetation indices and soil salinity indices. The methods that worked best for determining the salinity of soil in heavily vegetated farmed fields were the soil-adjusted vegetation index (SAVI), the normalized difference salinity index (NDSI), and the salinity index (SI-T). The NDSI and SI-T had the strongest association connection with salinity in regions with less plant density and bare ground. The salinity of the soil in the area was effectively determined using vegetation and soil salinity indices that were taken from IKONOS satellite photography. Wang et al. [
43] examined the potential for utilizing Sentinel-2 MSI spectral bands and generated spectral indices to forecast the soil salinity of wetlands affected by salt in the Xinjiang region around Aibi Lake. The study found significant correlations between the newly proposed NDI and TBI4 spectral indices and soil salinity. By applying different algorithms, such as the random forest partial least squares regression model, the study successfully constructed high-accuracy soil electrical conductivity (EC) prediction model and produced high-resolution soil salinity maps. Abbas et al. [
44] focused on the upper Indus River basin in Pakistan, creating and utilizing salinization indices (S1–S4) based on remote sensing data and categorizing photos using the maximum likelihood approach. The majority of the salt-affected soil types in the region were saline soils. Poor irrigation channel management not only led to water resource waste but also caused soil degradation, with soil salinization causing irreversible losses to agricultural productivity and the regional economy.
The first and second papers primarily review the issues and developments in remote sensing inversion of soil salinity, while the seventh, ninth, and tenth papers focus on vegetation indices or salinity indices. Other papers primarily use different methods and remote sensing data to invert soil salinization information in various locations.
Table 5.
Top ten cited papers.
Table 5.
Top ten cited papers.
| Paper | DOI | Year | Times Cited, WoS Core | Times Cited, All Databases |
|---|
Metternicht, GI;
Remote sensing of environment | [38] | 2003 | 698 | 885 |
Daliakopoulos, IN;
Science of the total environment | [27] | 2016 | 402 | 433 |
Farifteh, J;
Remote sensing of environment | [5] | 2007 | 306 | 385 |
| Douaoui, AEK; Geoderma | [39] | 2006 | 302 | 344 |
| Ben-Dor, E; Advances in agronomy | [40] | 2002 | 291 | 334 |
| Farifteh, J;Geoderma | [4] | 2006 | 204 | 262 |
| Allbed, A; Geoderma | [42] | 2014 | 199 | 259 |
Fan, X;
Land degradation and development | [41] | 2011 | 175 | 195 |
| Wang, JZ; Geoderma | [43] | 2019 | 170 | 191 |
Abbas, A;
Physics and chemistry of the earth | [44] | 2013 | 159 | 189 |
4. Discussion
Since the 1990s, soil salinity retrieval by remote sensing has undergone tremendous developments. Initially, satellite remote sensing technology was utilized to provide evidence for the on-site measurements of soil salinization [
45]. Subsequently, advancements were made in utilizing optical satellite band information, spectral reflectance, and other remote sensing data for retrieval purposes. Additionally, retrieval accuracy has been further improved by integrating several remote sensing sources, such as microwave radar satellites and drones, and by improving the models and algorithms [
46,
47]. A bibliometric analysis of the literature related to the remote sensing retrieval of soil salinity indicated that universities and research institutions in China are leading in this field, with high research activity. In this section, we explore the research hotspots from six perspectives based on the keywords identified in
Section 3.
4.1. Utilizing Machine Learning Methods for Soil Salinity Retrieval
Machine learning has outstanding advantages in screening soil salt sensitive variables and mining hidden information in massive data. Researchers have begun to pay extensive attention to the application of machine learning in the remote sensing monitoring of soil salinization, which is consistent with the research results of Wang et al. [
48]. Currently, the machine learning methods used for soil salinity retrieval primarily include BP neural networks and random forests [
49]. Machine learning methods have been employed to construct estimation models for spectral characteristic parameters obtained by unmanned aerial vehicles (UAVs). The models with the best estimation accuracy were those that combined the elastic net regression algorithm with the extreme learning machine algorithm at a depth of 10–20 cm [
50]. The results indicated that their root-mean-square-error (RMSE) was 0.141% and their highest cross-validation coefficient of determination (R
2) was 0.783. Meanwhile, R
2 was 0.66 and the relative percent difference (RPD) was 2.59 for an inversion model based on the first-order fractional differentiation of optical remote sensing spectral bands [
51]. Additionally, a machine learning method combined with microwave data was utilized to flip the soil salinity model at a 0–10 cm depth, with the cubist model exhibiting the highest accuracy, with a validation set R
2 of 0.822 and an RMSE of 3.064 [
52]. The inversion of diverse remote sensing data can achieve a maximum inversion depth of 40 cm. In order to predict soil salinity in the Fraser Valley of British Columbia, Canada, Heung et al. [
53] assessed and contrasted machine learning algorithms, such as artificial neural networks, random forests, support vector machines, and multivariate logistic regression. Their study found that these machine learning models have advantages in predicting soil salinity, with the support vector machine algorithm achieving the highest accuracy of 72% for the large ROS group. In areas with abundant vegetation and mild-to- moderate salinization, machine learning techniques have proven to be dependable for the digital mapping of soil salinity [
54]. Particularly, the random forest regression model produced better estimation accuracy results [
55], with a validation set R
2 of 0.86, an RMSE of 1.83, and an RPD of 2.7. It is important to remember that machine learning depends on a huge number of training samples. Overfitting is a condition in which the training samples’ fitness is noticeably higher that of validation samples, and this must be taken into account when choosing the model and structural parameters. The advantages of machine learning in data fitting allow the quantitative relationship between soil salinity and multi-source remote sensing and GIS data to be fitted using suitable models. This will increase the accuracy of soil salinity assessment. Subsequent investigations may concentrate on the ongoing integration of machine learning with several remote sensing data sources for inversion [
56,
57].
4.2. Soil Salinity Retrieval Based on UAV Remote Sensing
For unmanned aerial vehicle (UAV) data, object-oriented classification methods can be employed to improve classification accuracy. Soil salinity may now be estimated in this way due to advances in quantitative remote sensing. The primary technique for determining soil salinity is the use of spectral indices, which have proven effective in removing background and noise effects, minimizing interference from internal and external sources, and improving the extraction of spectral absorption features. They also play an important role in fully and accurately exploiting spectral information and constructing high-precision, robust models [
58]. Yao et al. [
59] used machine learning to invert mulch-covered farmland using multispectral UAV data. With a validation set R
2 of 0.717 and an RMSE of 0.171, the model built with an extreme learning machine to measure surface soil salinity content at a depth of 0–20 cm fared the best. To create spectral indices for soil salinity at a depth of 0–10 cm, UAV spectral properties were divided into different degrees of mild, moderate, and severe salinization [
60]. The optimal model, based on grey relational analysis and a support vector machine, achieved an R
2 of 0.692 and an RMSE of 8.562. Zhang er al. [
61] utilized UAV satellite remote sensing using the dominant variable weighting method and multiscale transformation through multiple linear regression models to effectively improve the monitoring accuracy of surface soil salinity at a depth of 0–10 cm, with an R
2 of 0.420 and an RMSE of 0.219, achieving fusion inversion from UAV to airborne remote sensing. Chen, et al. [
62] created an improved TsHARP scale transformation approach to accomplish the upscale UAV satellite remote sensing monitoring of soil salinization. The model was based on GF-1 satellite remote sensing data and UAV multispectral remote sensing data. Most studies focus on surface soil, with a maximum inversion depth of up to 60 cm. Multiple linear regression models were used by Ivushkin, et al. [
63] to identify connections between vegetation indices, canopy temperature, and plant height derived from three separate UAV sensors that measured salinity, stomatal conductance, and real plant height, but the overall R
2 was low at 0.46. Utilizing UAV electromagnetic interference technology in conjunction with the random forest approach, Hu, et al. [
64] quantitatively evaluated the salinity of surface soil at a depth of 0–20 cm. The results showed that the prediction model established employing data from UAVs exceeded the model using GF-2 data, with an RMSE of 1.40 and RPD of 2.98.
In the future, the integration of comprehensive stereo satellites, drones, and ground-based data for surface information monitoring will be explored. Continuous experimental research can be conducted through an unmanned aerial vehicle remote sensing to infer soil salinity, salt ions, machine learning parameters, and model optimization under different vegetation classifications.
4.3. Soil Salinity Inversion Based on Data Assimilation
Data assimilation is one of the crucial methods for improving forecast accuracy by incorporating physical mechanisms. By assimilating the multiple sources of remote sensing and ground observation data into soil water/salt models, the simulation process can adjust the model parameters in a timely manner, correct the model trajectories in real-time, and obtain spatiotemporally consistent soil salinity data, thereby reducing the accumulated model errors and better representing the spatiotemporal variations in soil salinization. On the one hand, model simulation compensates for the limitations of remote sensing data, which can monitor but not predict. On the other hand, remote sensing data can provide more accurate input parameters for the model. Leveraging satellite remote sensing technology coupled with data assimilation principles can aid in rapidly determining the crop salinity conditions at the irrigation district scale and further assessing the regional soil salinization levels.
Articles on soil salinity inversion based on data assimilation have been published in recent years. Lin Lin [
65], who established equations for simulating solute transport in soil, including convection dispersion equations, proposed the earliest studies on the mechanism of water and salt transport in soil, both domestically and globally. A set of models that can accurately simulate the movement of salt and water in saturated and unsaturated porous media based on different solute transport equations, such as MODFLOW, MODPATH, SWAP, and HYDRUS, has been widely applied in different types of research [
66].Using data assimilation methods, with soil water/salt transport models as model operators and large-scale observation data as driving data, observational data are incorporated into the model using assimilation algorithms. For example, Yao et al. [
67] utilized ensemble Kalman filter algorithms to assimilate electromagnetic induction data into the HYDRUS-1D model, improving the spatiotemporal dynamic estimation accuracy of soil salinity. Ding Jianli et al. used ensemble Kalman filter methods to assimilate MODIS and Landsat TM data information into HYDRUS-1D. Assimilating remote sensing data for the HYDRUS-1D model and ensemble Kalman filter [
68] was superior to the single inversion of the HYDRUS-1D model or ensemble Kalman filter alone, but the assimilation effectiveness decreased with increasing soil sampling depth, with the best assimilation effect at 0–20 cm, and the depth of soil inversion could reach up to 60 cm below ground.
Currently, research on the scale transformation of the soil salinity movement is still immature, mainly because salt migration is based on soil’s hydrological processes, which are complex and have temporal and spatial dependencies. Future research should strengthen the integration of observation data at different scales, construct universal scale transformation functions, optimize the construction of assimilation systems [
69], and introduce machine learning to improve the models’ accuracy, and continuously study the coupling of multiple assimilation algorithms.
4.4. Remote Sensing Retrieval of Soil Salinity under Vegetation Cover
Current research on soil salinity inversion is mostly focused on bare soil, which can be inverted using various salinity indices via microwave remote sensing with penetration capability [
70]. However, as the distribution and health of vegetation can act as indicators of soil salinity levels, plant cover has an impact on soil salinity monitoring. Studies have shown that vegetation indices can be used to indirectly measure the salinity of soil [
71]. By analyzing the spectral information of vegetation under salt stress [
72], the optimal model for estimating soil salinity at depths of 0 to 60 cm was found to be the quantile regression model, with an R
2 of 0.636 and an RMSE of 0.249. Using particle filtering algorithms based on different vegetation cover percentages [
73], the optimal depth for indirect soil salinity inversion was found to be 20–40 cm, with an RMSE of 0.0422. The maximum depth of soil inversion reached 60 cm below ground. Subdividing the vegetation cover significantly improves the accuracy of soil salinity prediction. The best model for soil salinity inversion utilizing vegetation indicators for agricultural land with vegetation cover was determined to be the BPNN (back-propagation neural network) model, with a validation set R
2 of 0.836, an RMSE of 0.027, and an RPD of 2.100 [
47].
Different regions have different soil environments and varying degrees of vegetation cover, which pose challenges to the universality of models. Studies have shown that soil salinity inversion models suitable for the city of Yichun, Jilin Province, may not be suitable for saline–alkali paddy fields in Hotan County, Xinjiang [
74]. Rice fields, wheat fields, vegetable plots, and orchards are mainly distributed in areas with low salinity [
75], while drylands, dominated by cotton planting, are distributed in areas with higher salinity. Additionally, research indicates that vegetation cover has a greater impact on reflectance spectra than soil moisture. Furthermore, a number of other variables affect the soil’s salinity, including the amount and types of salt minerals present, soil color, surface roughness, soil texture, amount of organic matter, depth of groundwater, groundwater mineralization, geography [
76], and climate.
4.5. Reversal of Soil Salinity Ions
Not only can soil salinity be inversely estimated as a whole, but the individual ions responsible for the soil’s salinity can also be inferred. Zhang et al. [
77] conducted field-based, in situ spectral measurements of the soil and combined them with laboratory-determined pH values, EC, and soluble salt ion measurements. Based on the selection of spectral reflectance sensitive to various salt indicators and the optimal transformation methods, they used partial least squares regression modeling and stepwise regression analysis. The results showed similar patterns in the spectral characteristics of the soils with different types and amounts of salinization in the study area. They achieved the analysis of different salt ions, with the predictive model for SO
42− based on sensitive bands in the 0–5 cm layer reaching an R
2 of 0.9676 using partial least squares regression. However, this study was limited to the bare surface soil. For various soil salt ions, the same inversion model’s accuracy varies. Research indicates that soil salinity prediction models yield satisfactory results for total salt content, EC values, and Na
+, K
+, and Cl
− ions, but the accuracy of predicting pH values and Ca
2+ ions is not high, and the prediction accuracy for Mg
2+ ions groundwater depth, groundwater mineralization, topography, and climate is insignificant.
4.6. Monitoring Soil Salinization Using Remote Sensing Model Building Techniques
At the moment, the high-precision monitoring of soil salinization within regions is possible using remote sensing models for soil salinization inversion, which has also produced a wealth of research findings [
78]. The contents of such research mainly include the establishment of new spectral indices [
79], the coordinated use of different types of remote sensing data and scale conversion [
80], the improvement of mathematical modeling methods, and the optimization of model parameters. In order to characterize soil salinization within regions and reflect the interrelationships between the soil salinization status and its influencing factors, the development of remote sensing models for soil salinization monitoring will remain a research hotspot in the field. The establishment of the model typically includes steps such as obtaining measured soil salinity data, acquiring remote sensing images, extracting and selecting modeling factors, establishing the model, and verifying its accuracy, although there may be differences between different studies. The pixel values obtained from remote sensing product data are an important source of modeling factor data. Remote sensing data, climate factors, soil physicochemical properties, terrain factors, spatial locations, and vegetation factors used for modeling can be obtained through band calculation and corresponding remote sensing data acquisition. Gorji et al. [
81] used 25 remote sensing images to monitor agricultural land near Lake Tuz in Turkey over multiple time periods, producing a distribution map of soil salinity. They assessed the EC values of soil samples in the field, created five remote sensing indices of soil salinity, and then utilized regression analysis to link the measured data with the salinity indices produced from the remote sensing photos. The findings show how crucial remote sensing technology is for tracking and forecasting land salinization, which supports and ensures agricultural output. In the modeling process, different factors can be divided into different sets according to the modeling requirements. Their methods for model construction mainly include linear regression models and machine learning models. It is essential to consistently research and develop new model algorithms in order to increase the accuracy of model construction, which needs to be implemented through the corresponding modules of different mathematical analysis software platforms. Numerous research findings show that the modeling accuracy of machine learning models is often higher than that of linear models and that the accuracy of various models varies significantly between experimental trials. Future studies will concentrate on expanding these models’ applicability, making them more capable of reflecting the conditions of vegetation cover, and gathering data on the salinity of deep soil. This is consistent with the findings of Wang et al. [
82].
The following challenges will affect the development of the remote sensing inversion of soil salinity in the future, as determined by the examination and discussion of the six research hotspots in this section—(1) Machine learning-based soil salinity inversion: Large numbers of training samples are necessary for machine learning, and overfitting—a situation in which the training samples’ fitness greatly surpasses that of the validation samples—must be taken into account when choosing the model and its structural parameters; (2) Efficiency and scale of UAV-based remote sensing: UAV-based remote sensing for soil salinity inversion is efficient, more accurate, and cost-effective. Nevertheless, it is limited by problems specific to UAVs, which make it challenging to satisfy the demands of extensive area surveillance; (3) Soil salinity inversion based on data assimilation methods—Research on the scale conversion of soil salinity movement based on data assimilation methods is immature. This is primarily due to the complexity and spatiotemporal dependency of the driving factors of salt migration, which are based on soil hydrological processes; (4) Remote sensing inversion of soil salinity under vegetation cover: Variations in vegetation cover across different regions pose obstacles to the universality of models; (5) Remote sensing inversion of soil salinity ions: Current methods mainly focus on surface soil, and the accuracy of inversion varies for different salt ions. Although some salt ions have ideal results, the accuracy of inversion for certain ions remains unsatisfactory; (6) Construction of soil salinization monitoring models based on remote sensing: The applicability of models is affected by factors such as the research area or season, and a large number of modeling parameters can lead to significant errors. In general, future research priorities will include combining multi-element and multi-scale “space-ground” observation data of soil salinization, removing the impact of variables such as vegetation cover, and applying machine learning algorithms for multi-data fusion assimilation to create high-precision remote sensing models. This will help deduce the spatiotemporal evolution process of salinization and reveal the driving mechanisms behind it.
5. Conclusions and Outlook
5.1. Conclusions
This study utilized bibliometric visualization software to construct a knowledge map, providing a visual analysis of research on remote sensing inversion of soil salinity from 2000 to 2023. To comprehend the advancements in the remote sensing monitoring of soil salinization, a number of factors were visually analyzed, including the number of publications, authors, institutions, research fields, and keywords. In-depth discussions were conducted on the research hotspots identified through the keyword analysis, leading to the following conclusions:
- (1)
The overall trend of publication quantity in remote sensing inversion of soil salinity is increasing over time. Zhao, Gengxing was identified as the author with the highest publication quantity, while Metternicht, Gi was the most cited author.
- (2)
Regarding publication institutions, the International Institute for Geoinformatics Science and Earth Observation and the Chinese Academy of Sciences emerged as the primary publishing institutions. Notably, the United States and China have made major contributions. Influential journals in this field include “Remote Sensing” and “Geoderma”.
- (3)
Many fields have conducted research on the remote sensing monitoring of soil salinization, with the environmental field publishing the most frequently. This aligns with the environmental focus of the remote sensing monitoring of soil salinization, primarily addressing the environmental issue of soil salinization. Major research areas include the Hetao irrigation district in Inner Mongolia, Xinjiang, the Yellow River Delta, the Nile River Basin in Egypt, and the Mediterranean coast.
- (4)
Looking at development trends, keywords such as remote sensing and saline soil appeared with the highest frequency, primarily focusing on the identification, mapping, inversion, and prediction of soil salinity. The main objective is to propose a response mechanism for soil salinization issues. Furthermore, the emergence of keywords indicates a shift in the research frontier towards areas such as machine learning.
5.2. Outlook
Global soil degradation is primarily caused by soil salinization and secondary salinization, which are both influenced by climate change and human activity. Using bibliometric analysis, we found that since the year 2000, remote sensing technology has been crucial in tracking past changes, providing early warning, and keeping an eye on soil salinization—all of which have produced positive outcomes. Nevertheless, it must be acknowledged that there are still a number of significant gaps in our understanding of how salt affects soil inversion. Specifically, there are still a number of pressing problems that need to be resolved in order to obtain high-precision real-time data and the lengthy historical time series of soil salinity. The following are the future development directions for the remote sensing inversion of soil salinity, driven by advancements in computer modeling approaches and remote sensing technology:
- (1)
Unmanned aerial vehicle (UAV) technology: The advantages of UAV-based remote sensing include great mobility and high spatial resolution. Equipped with various sensors, UAVs can conduct real-time observations in key areas to obtain high-resolution and high-precision soil salinization monitoring data. Meanwhile, by integrating UAV hyperspectral data, near-ground hyperspectral data, and satellite remote sensing, salinization information can be comprehensively extracted to achieve the dynamic, large-scale, and accurate monitoring of soil salinization over extensive regions.
- (2)
Multivariate collaborative inversion of soil salinity: A more accurate representation of the spatiotemporal distribution of soil salinization can be achieved through the effective integration of visible near-infrared remote sensing, thermal infrared remote sensing, microwave remote sensing, topography, and meteorological data.
- (3)
Remote sensing has limited penetration depth. Currently, the deep soil’s salinity is mainly estimated through modeling using conductivity meters and surface remote sensing observation data. Surface soil salinity estimated by remote sensing can serve as the upper boundary condition to accurately predict the soil’s salinity profile based on soil hydrodynamics models. Additionally, variations in land types, soil wetness, groundwater depth, and soil types should be taken into consideration in studies on the possible use of remote sensing data for predicting soil salinity.
- (4)
The mechanisms behind variations in soil salinity can be uncovered by the use of long-term time-series soil salinity data. In order to investigate the origins of soil salinity and analyze its seasonal and interannual fluctuations, long-term time series data are essential.
- (5)
Using platforms such as Google Earth Engine (GEE, USA) and Pixel Information Expert Engine (PIE-Engine, China), it is now possible to monitor soil salinization on a broad spatial and temporal scale due to the advent of remote sensing cloud platforms.
- (6)
Future research paths for the dynamic monitoring and prediction of soil salinization will be made possible by combining remote sensing monitoring models of salinization with models of soil water and salt transport.
- (7)
To satisfy the demands of large-scale monitoring, unified quantitative inversion models of soil salinity at national or even worldwide scales must be established.
However, this study still has certain shortcomings. Firstly, the reliance on electronic databases as data sources may have resulted in the omission or the erroneous selection of literature, even when combined with WoS. To address this, it may be beneficial to incorporate more databases and utilize improved screening software. Secondly, the clustering and summarization of topics via the bibliometric software still require subjective judgment. Therefore, there is a need to improve intelligent algorithms to reduce the subjectivity of summarization. Additionally, increasing the flexibility of parameter settings in the visualization process of knowledge graphs is essential for enhancing the quality of the analysis. At the same time, the keyword network used in the bibliometric analysis of the research can be strengthened through the application of deep learning and natural language processing technology, the continuous development of which may help make the construction and analysis of the keyword networks more automated and precise in the future. Deep learning models can help identify keywords in the text and use them to construct the network structure, which in turn reveals the correlation between the documents.


