

Urban Green–Blue Space Utilization and Public Perceptions Amid the COVID-19 Pandemic: Insights from Northwest China


Abstract
1. Introduction
2. Methods
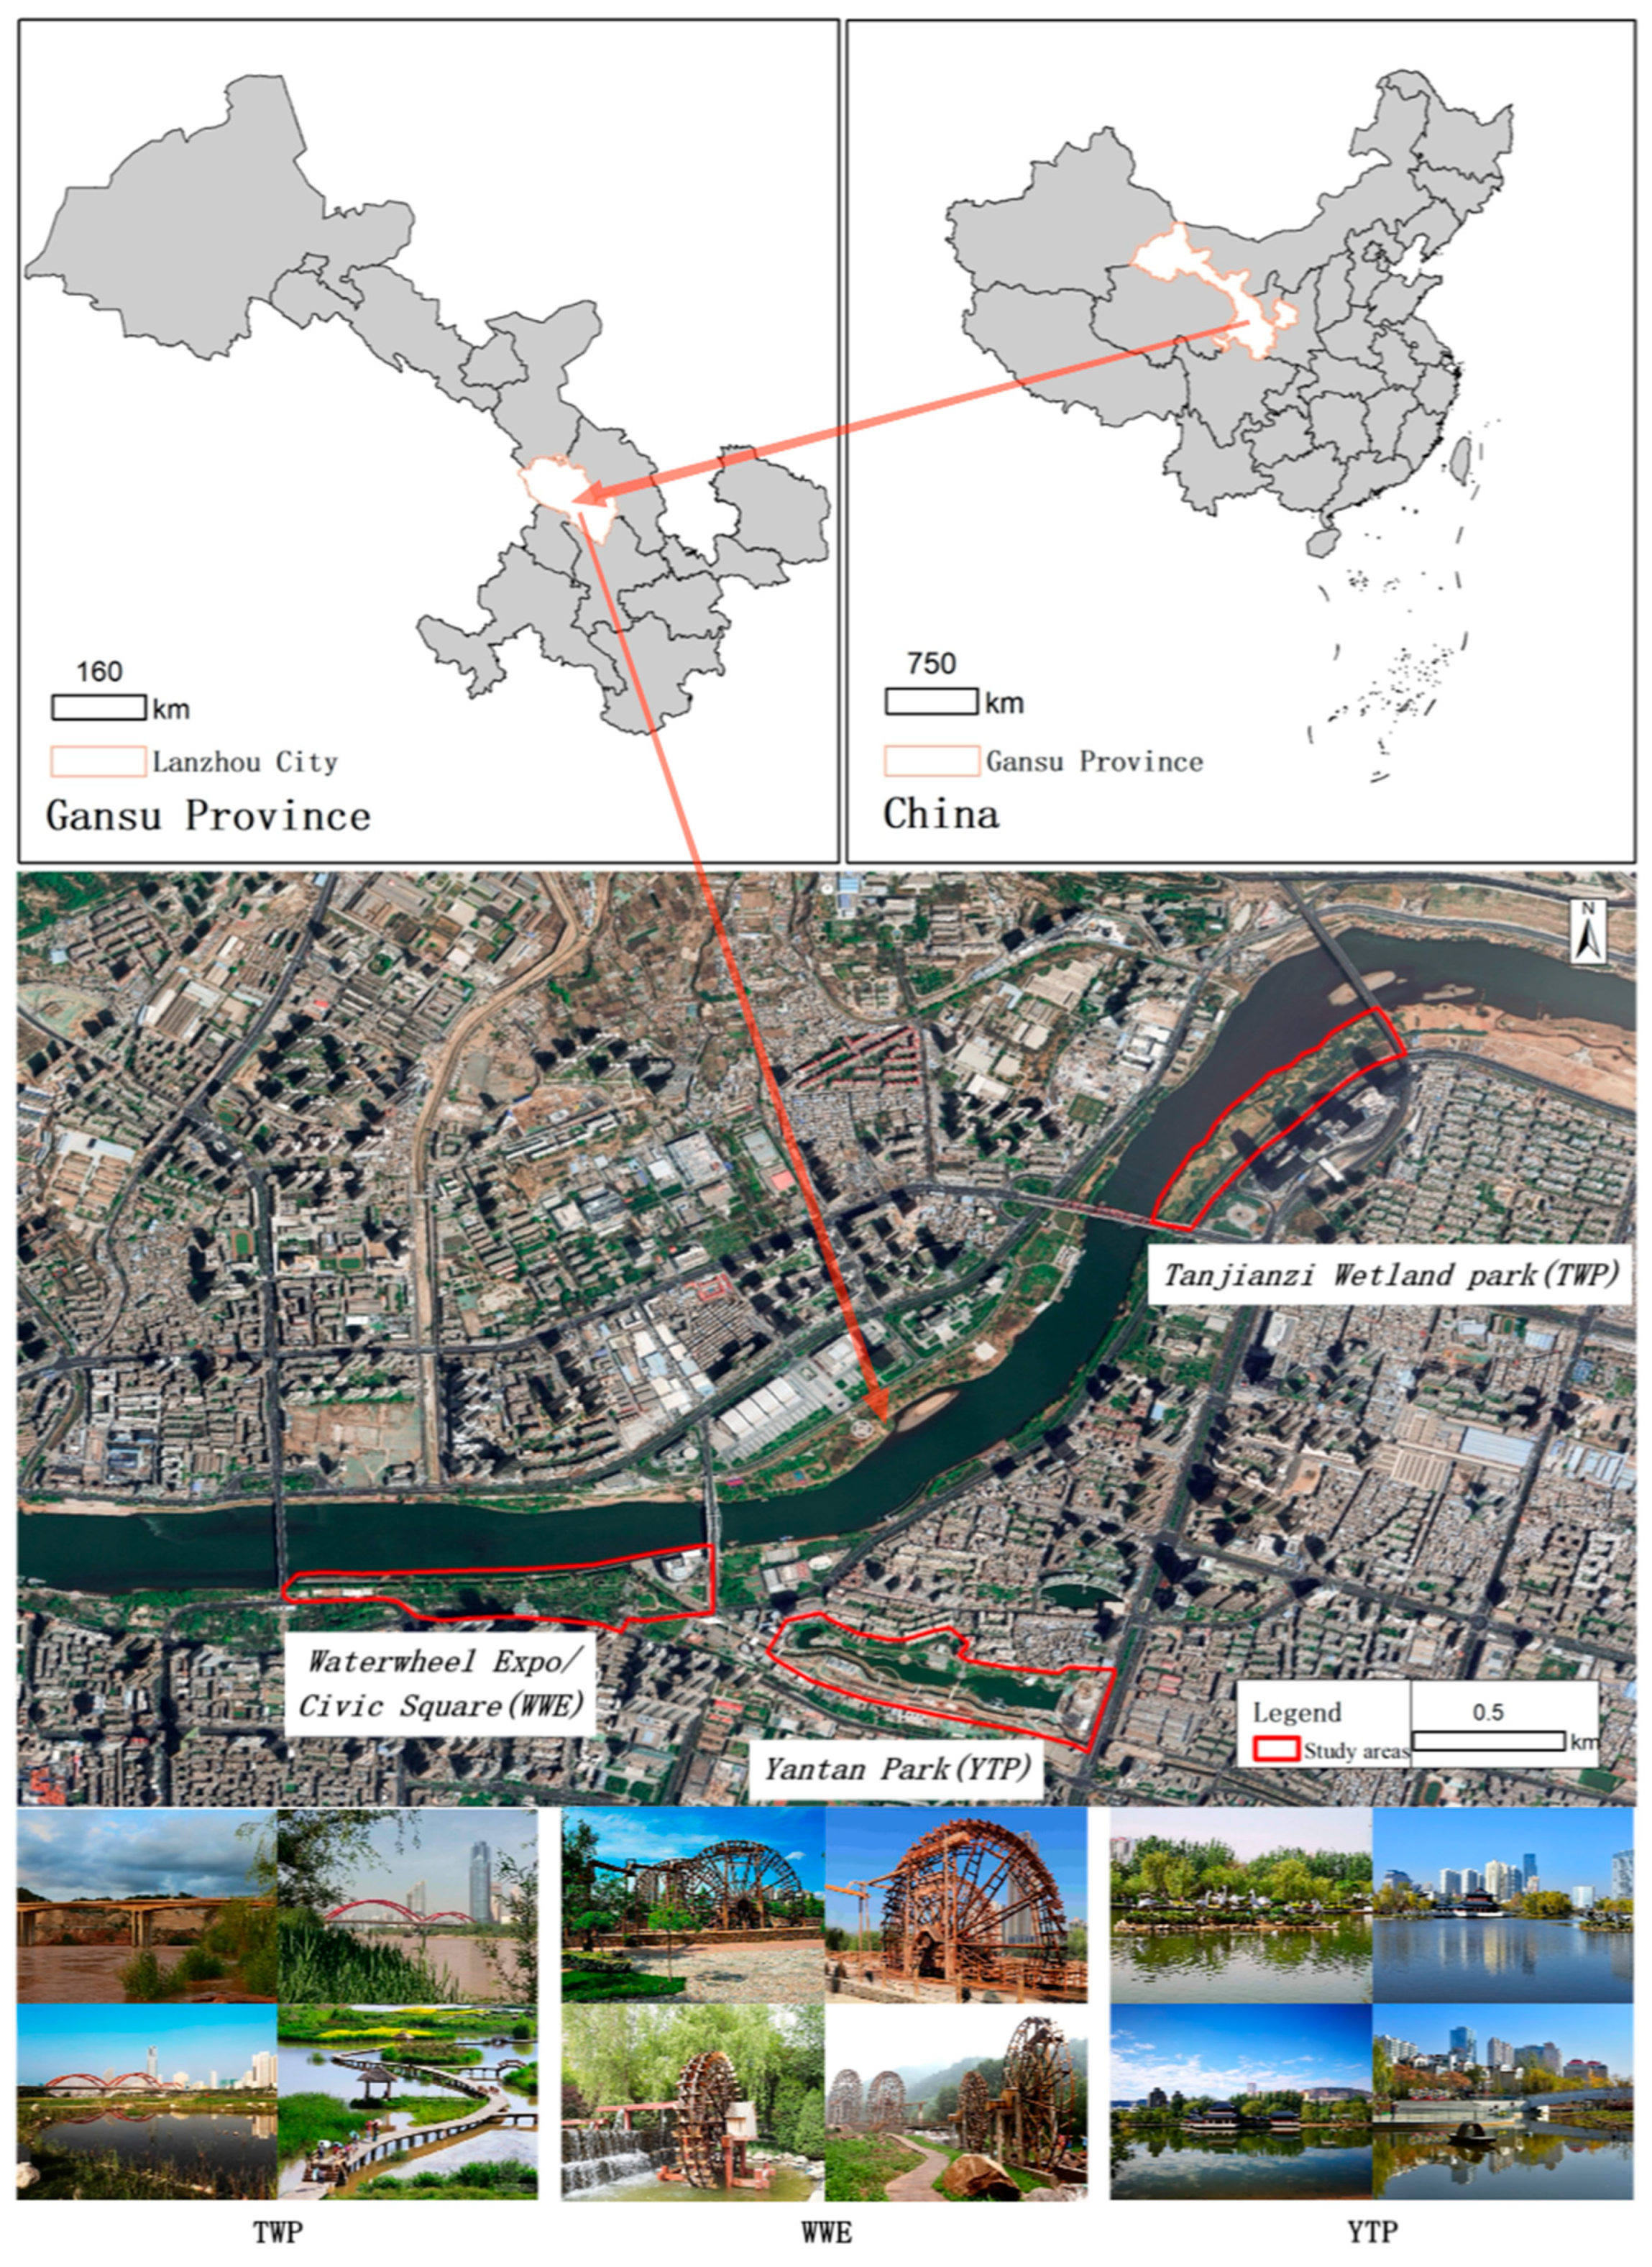
2.1. Study Area
2.2. Collection of Questionnaire Survey and Social Media Data
2.3. Data Analysis
3. Results
3.1. Sample Profile
3.2. Public Attitudes towards UGBS
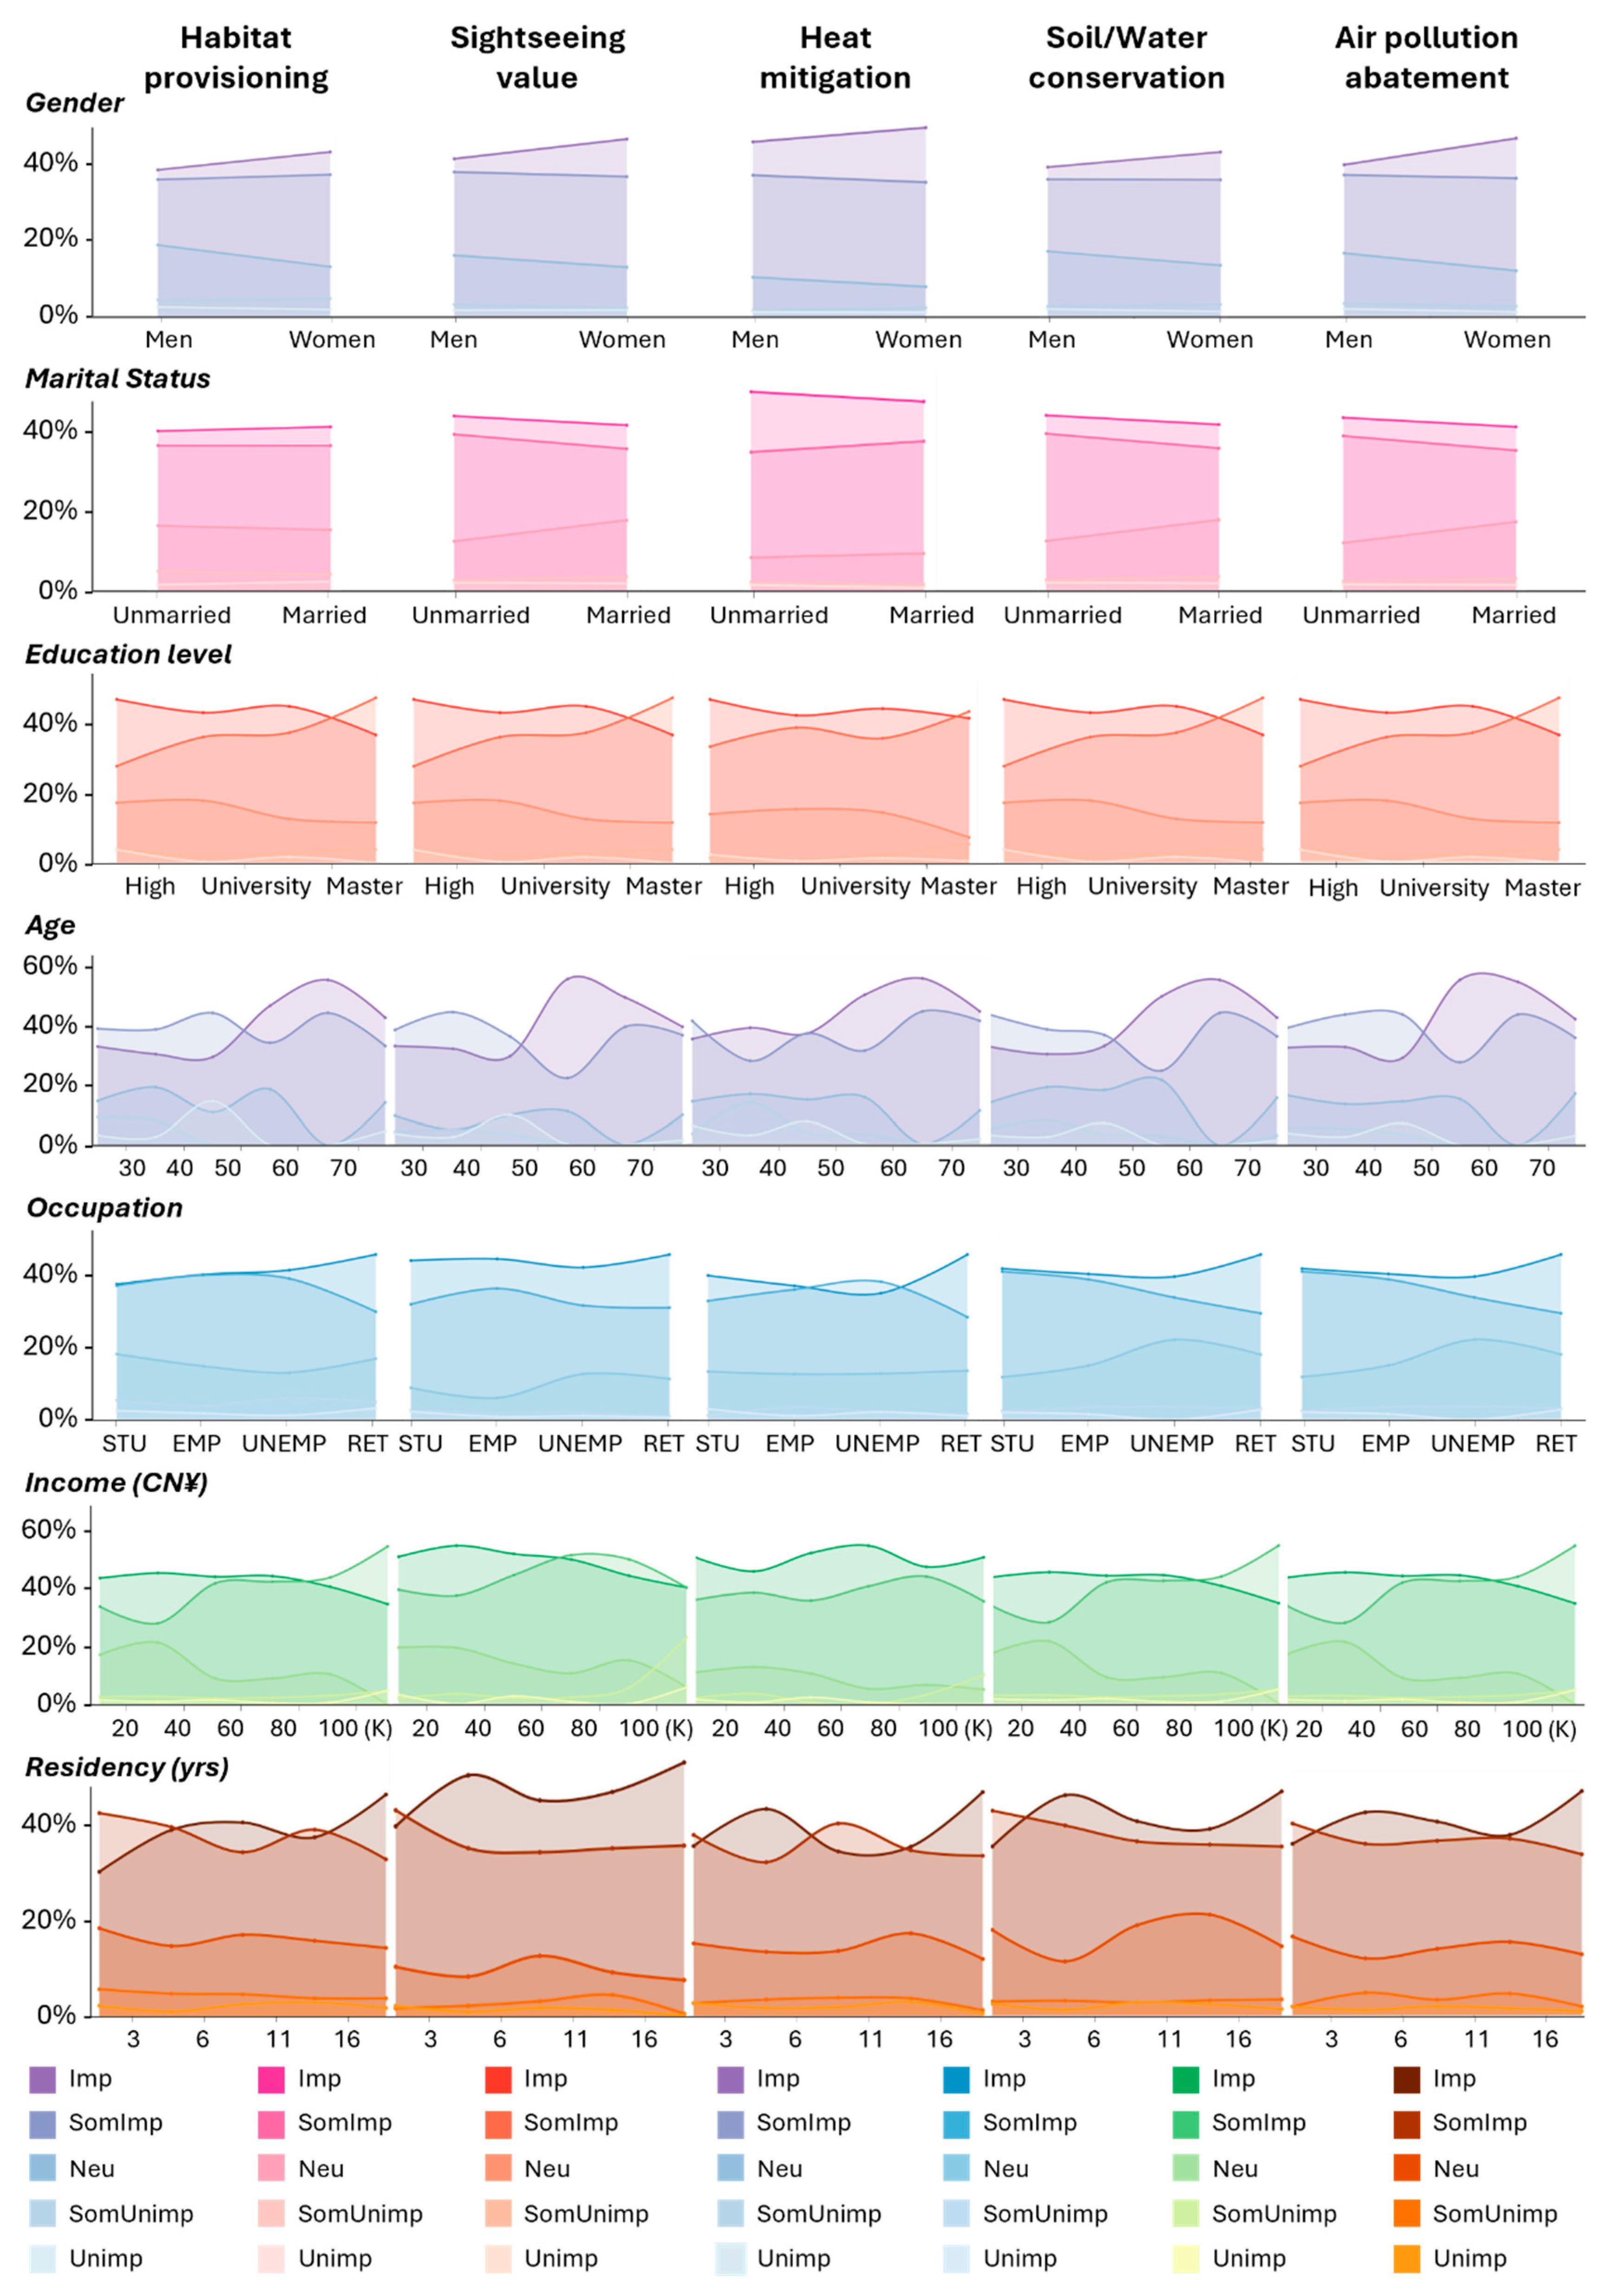
3.2.1. Functions of UGBS
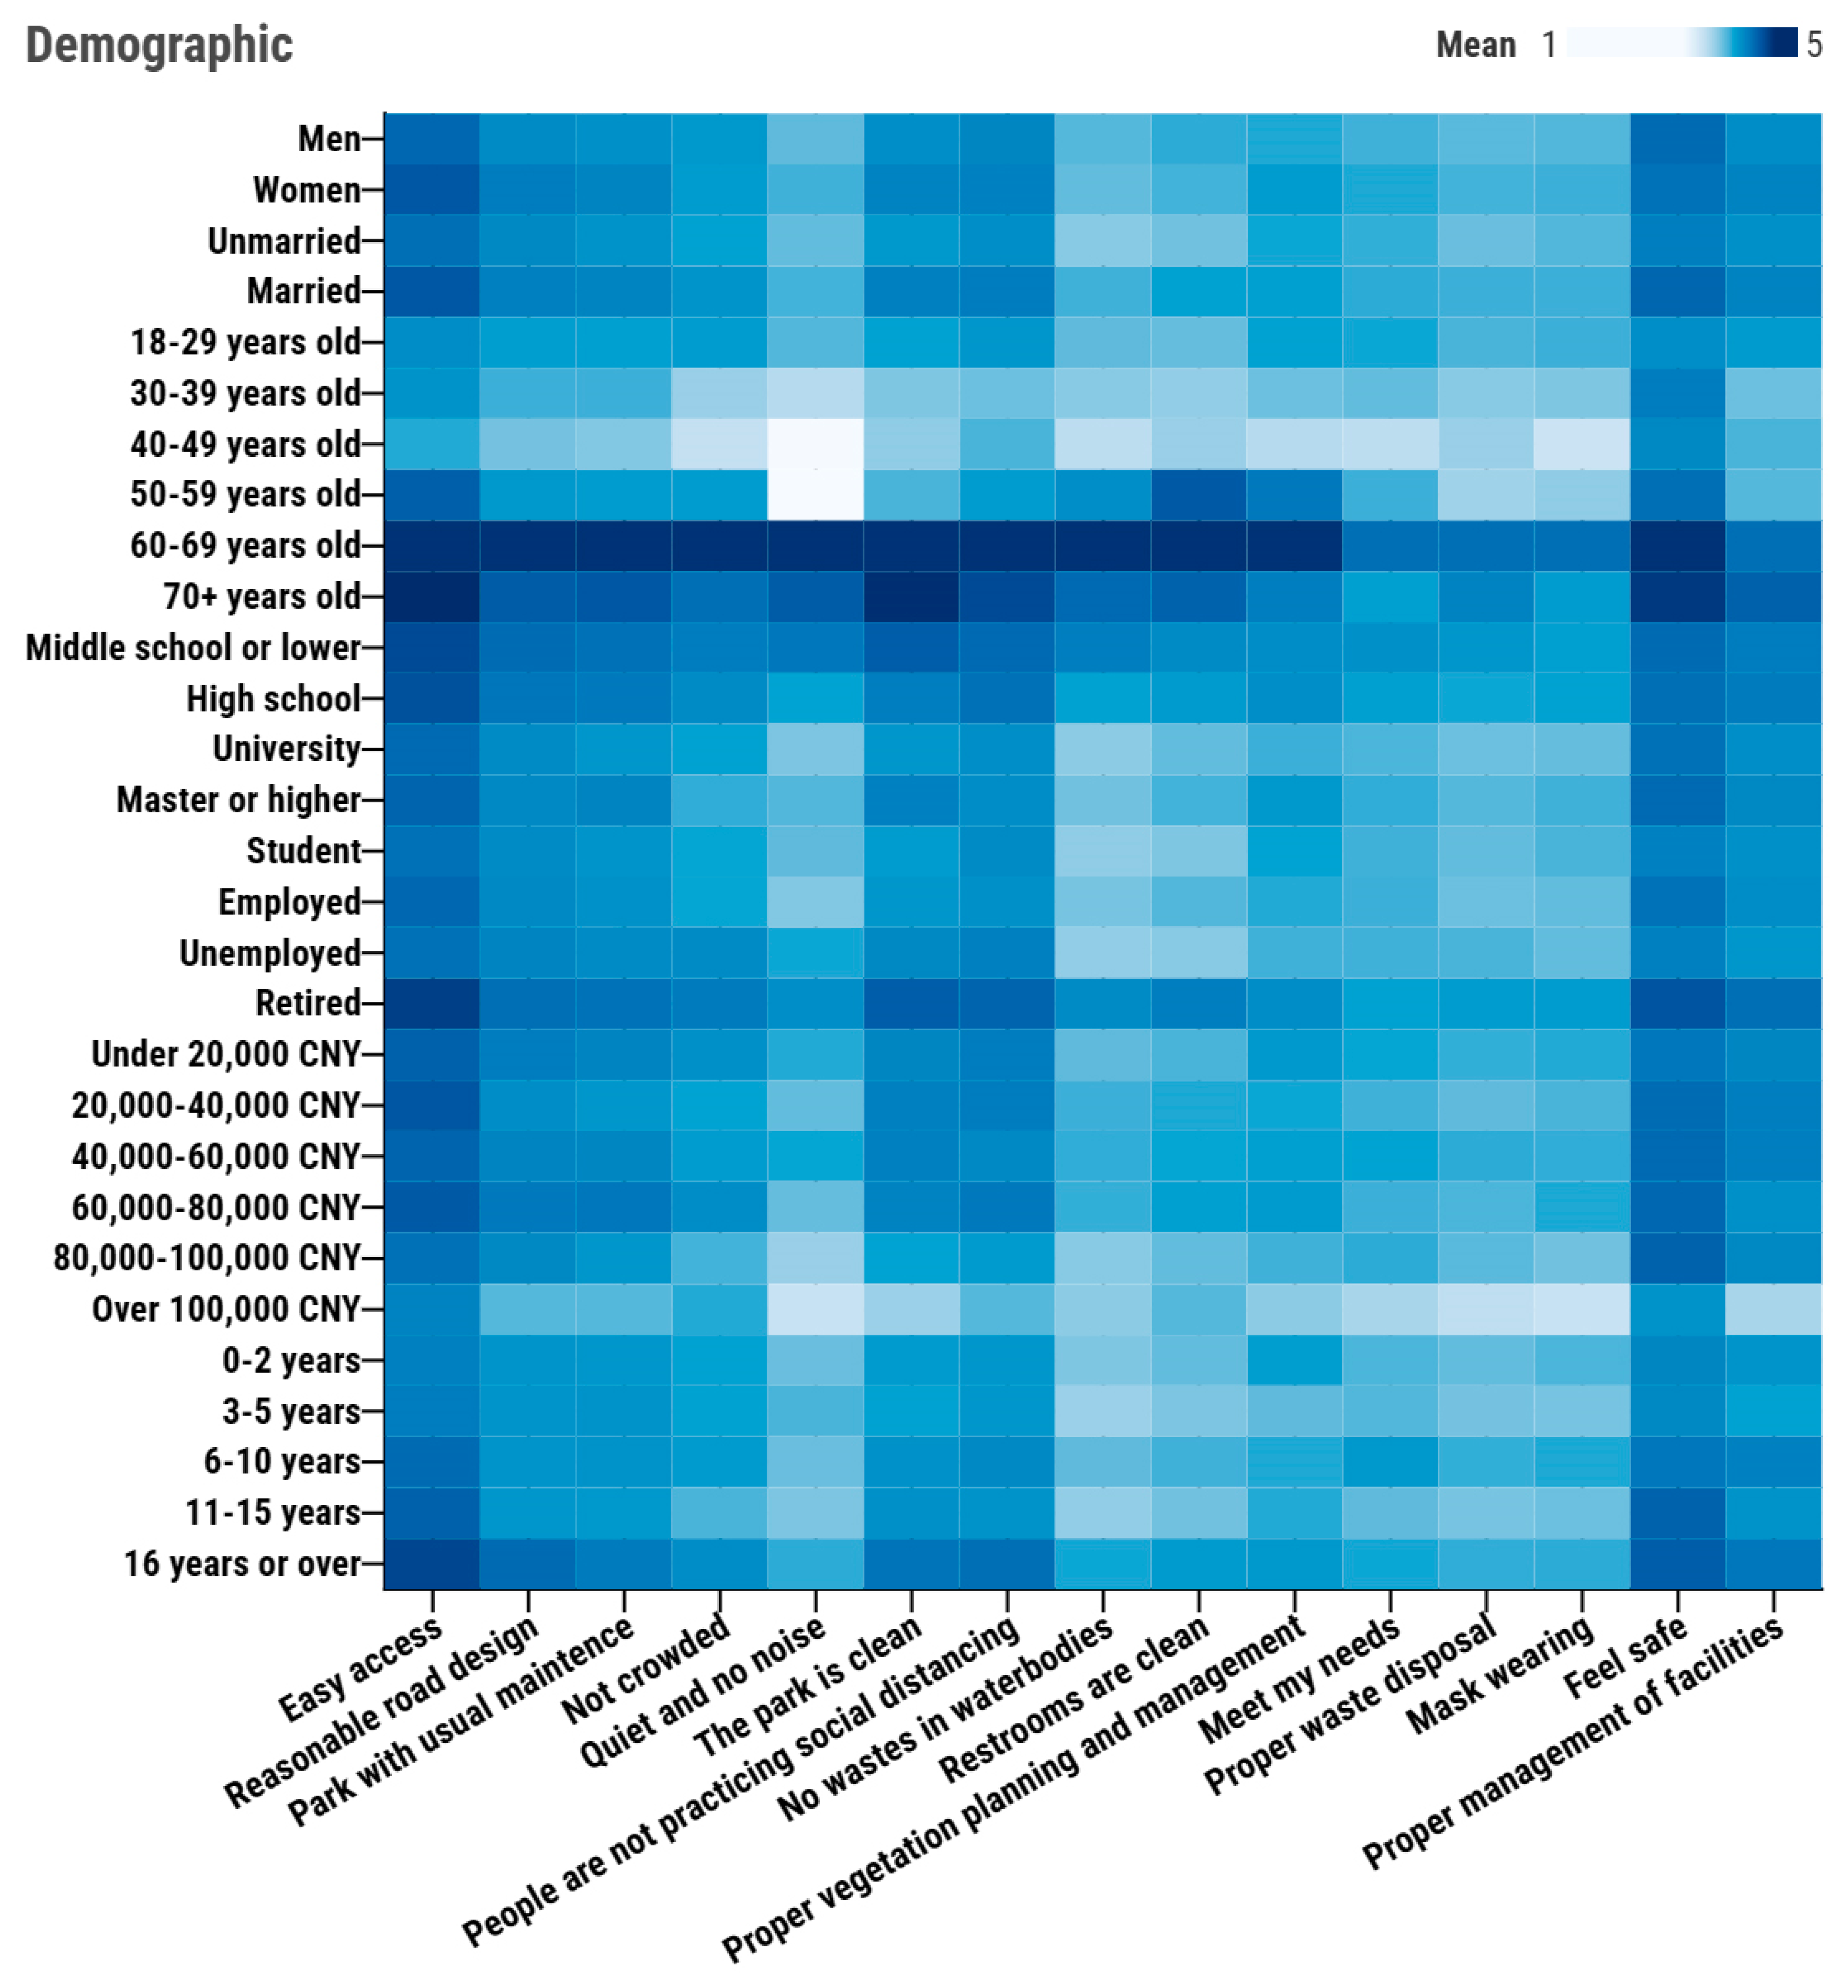
3.2.2. Conditions of UGBS
3.3. Reasons for Visiting UGBS during the Pandemic
3.4. UGBS Use during the Pandemic
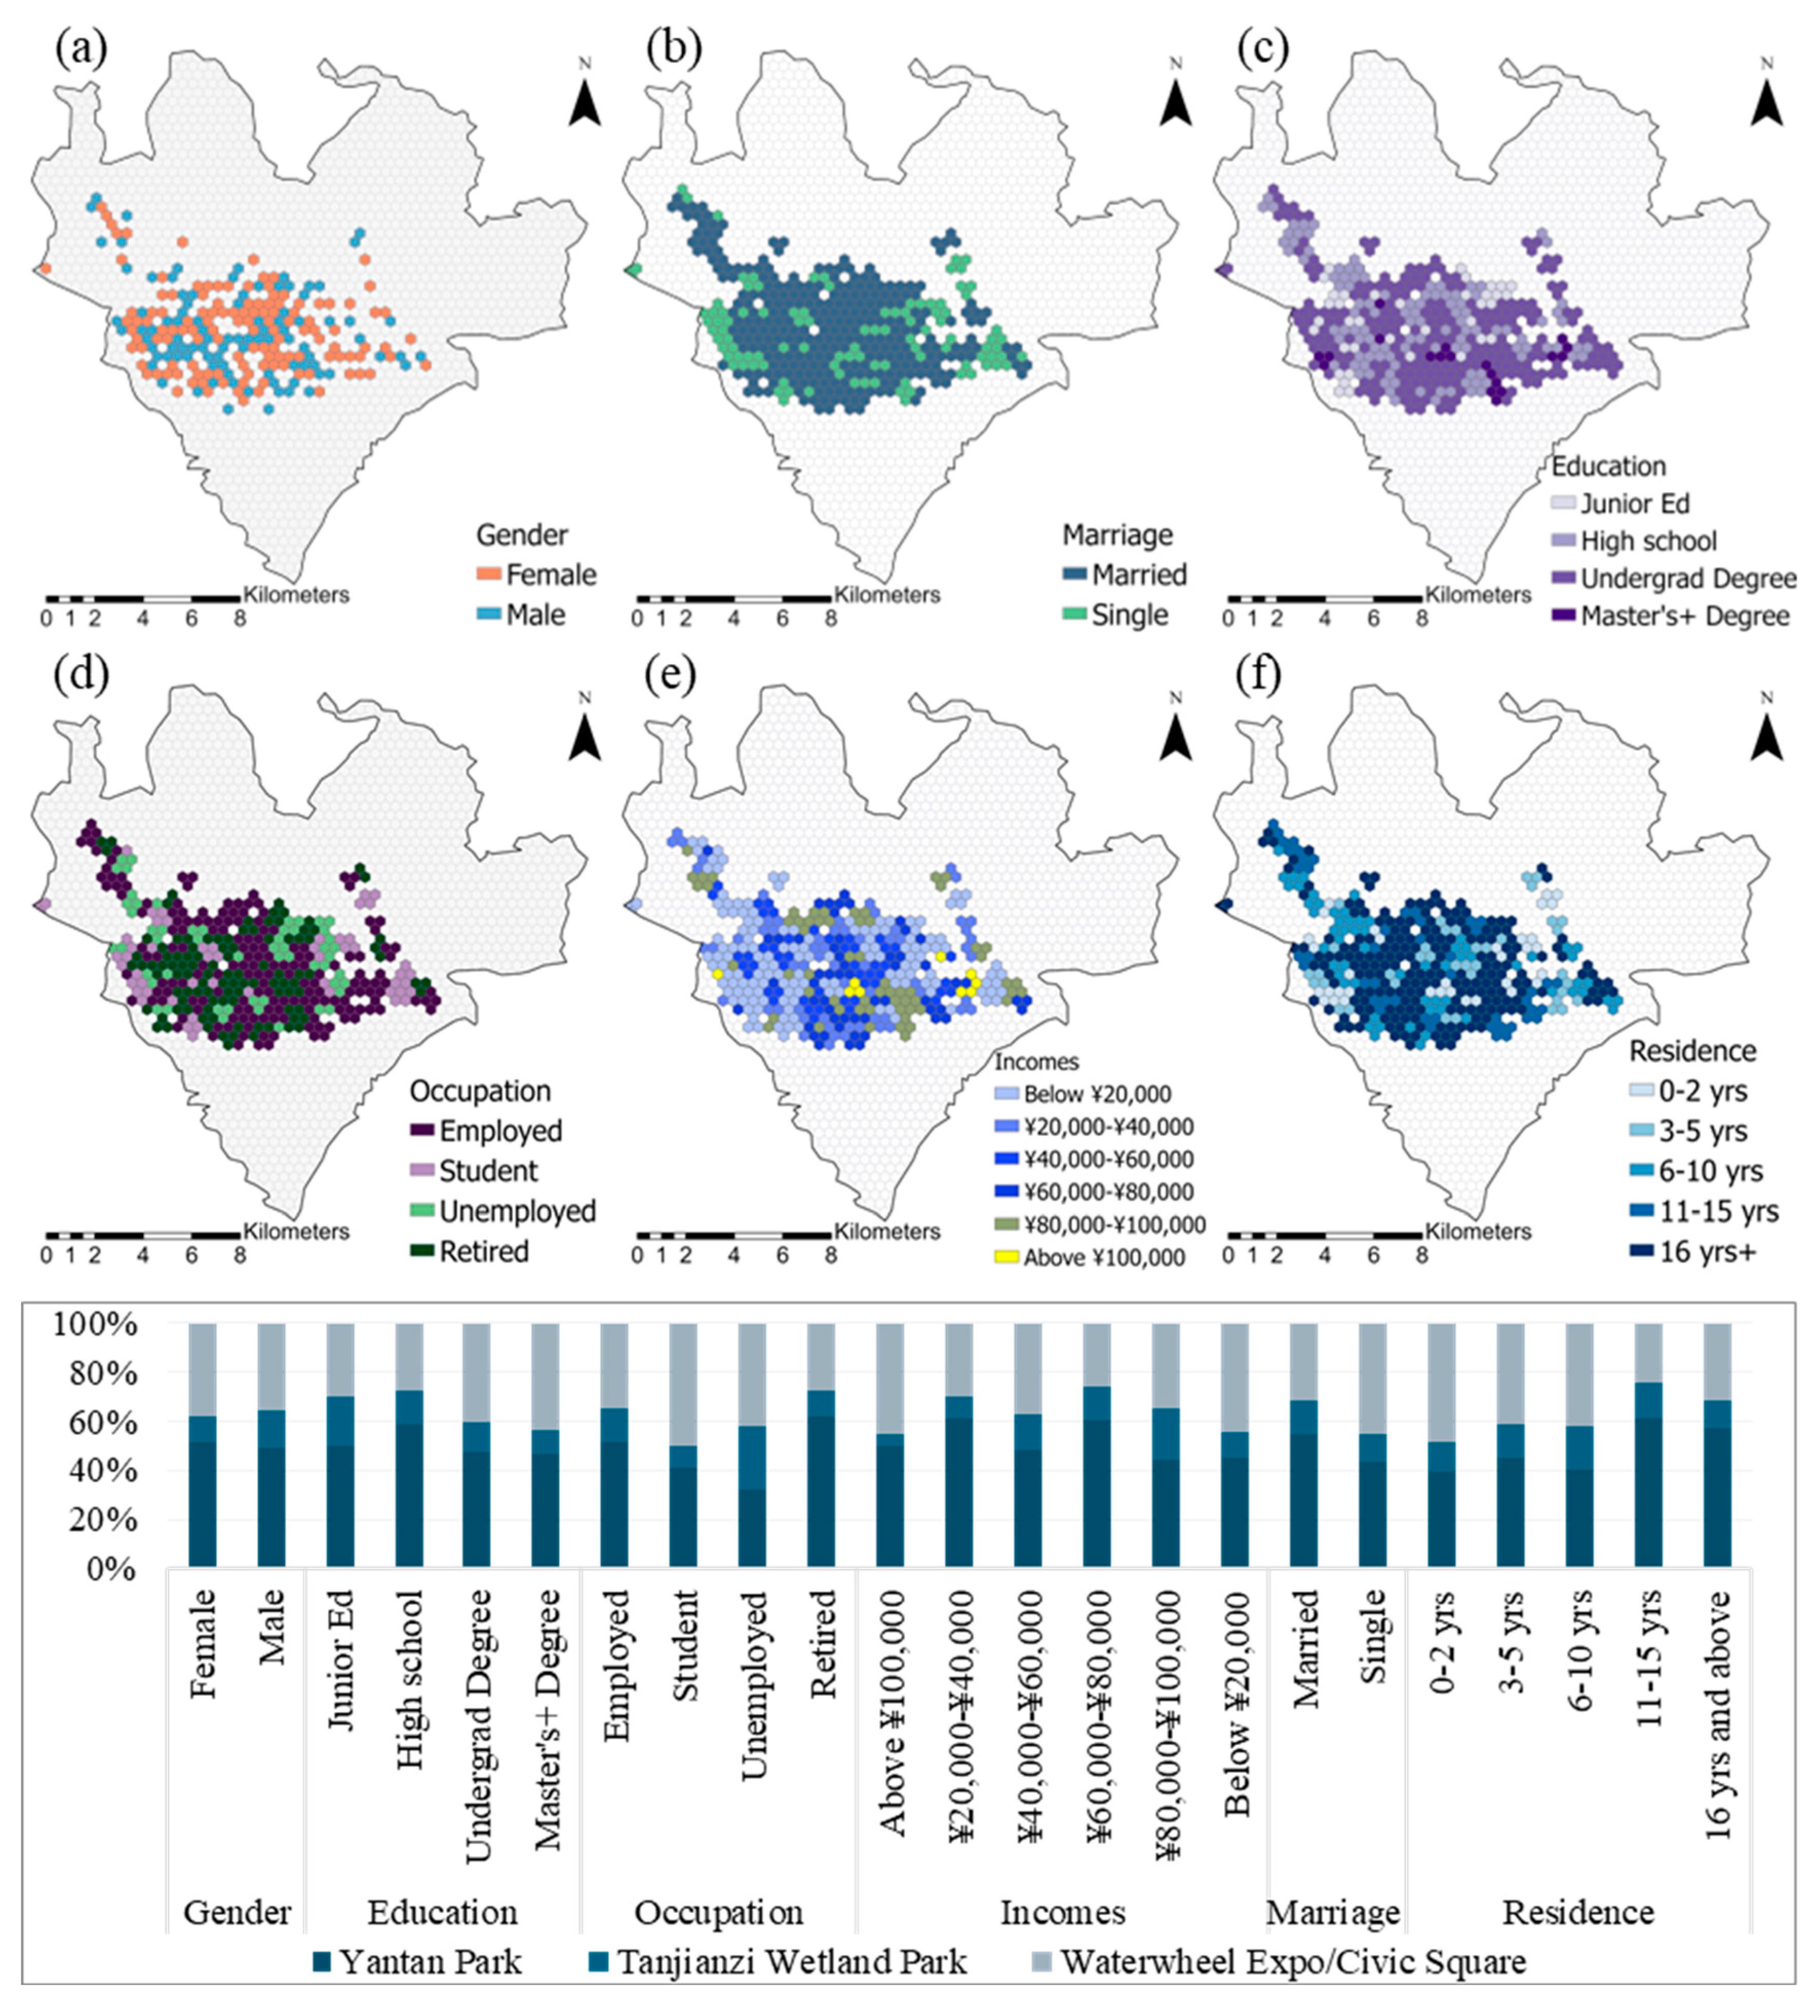
3.4.1. Demographic and UGBS Utilization
3.4.2. Visiting Dynamics in UGBS
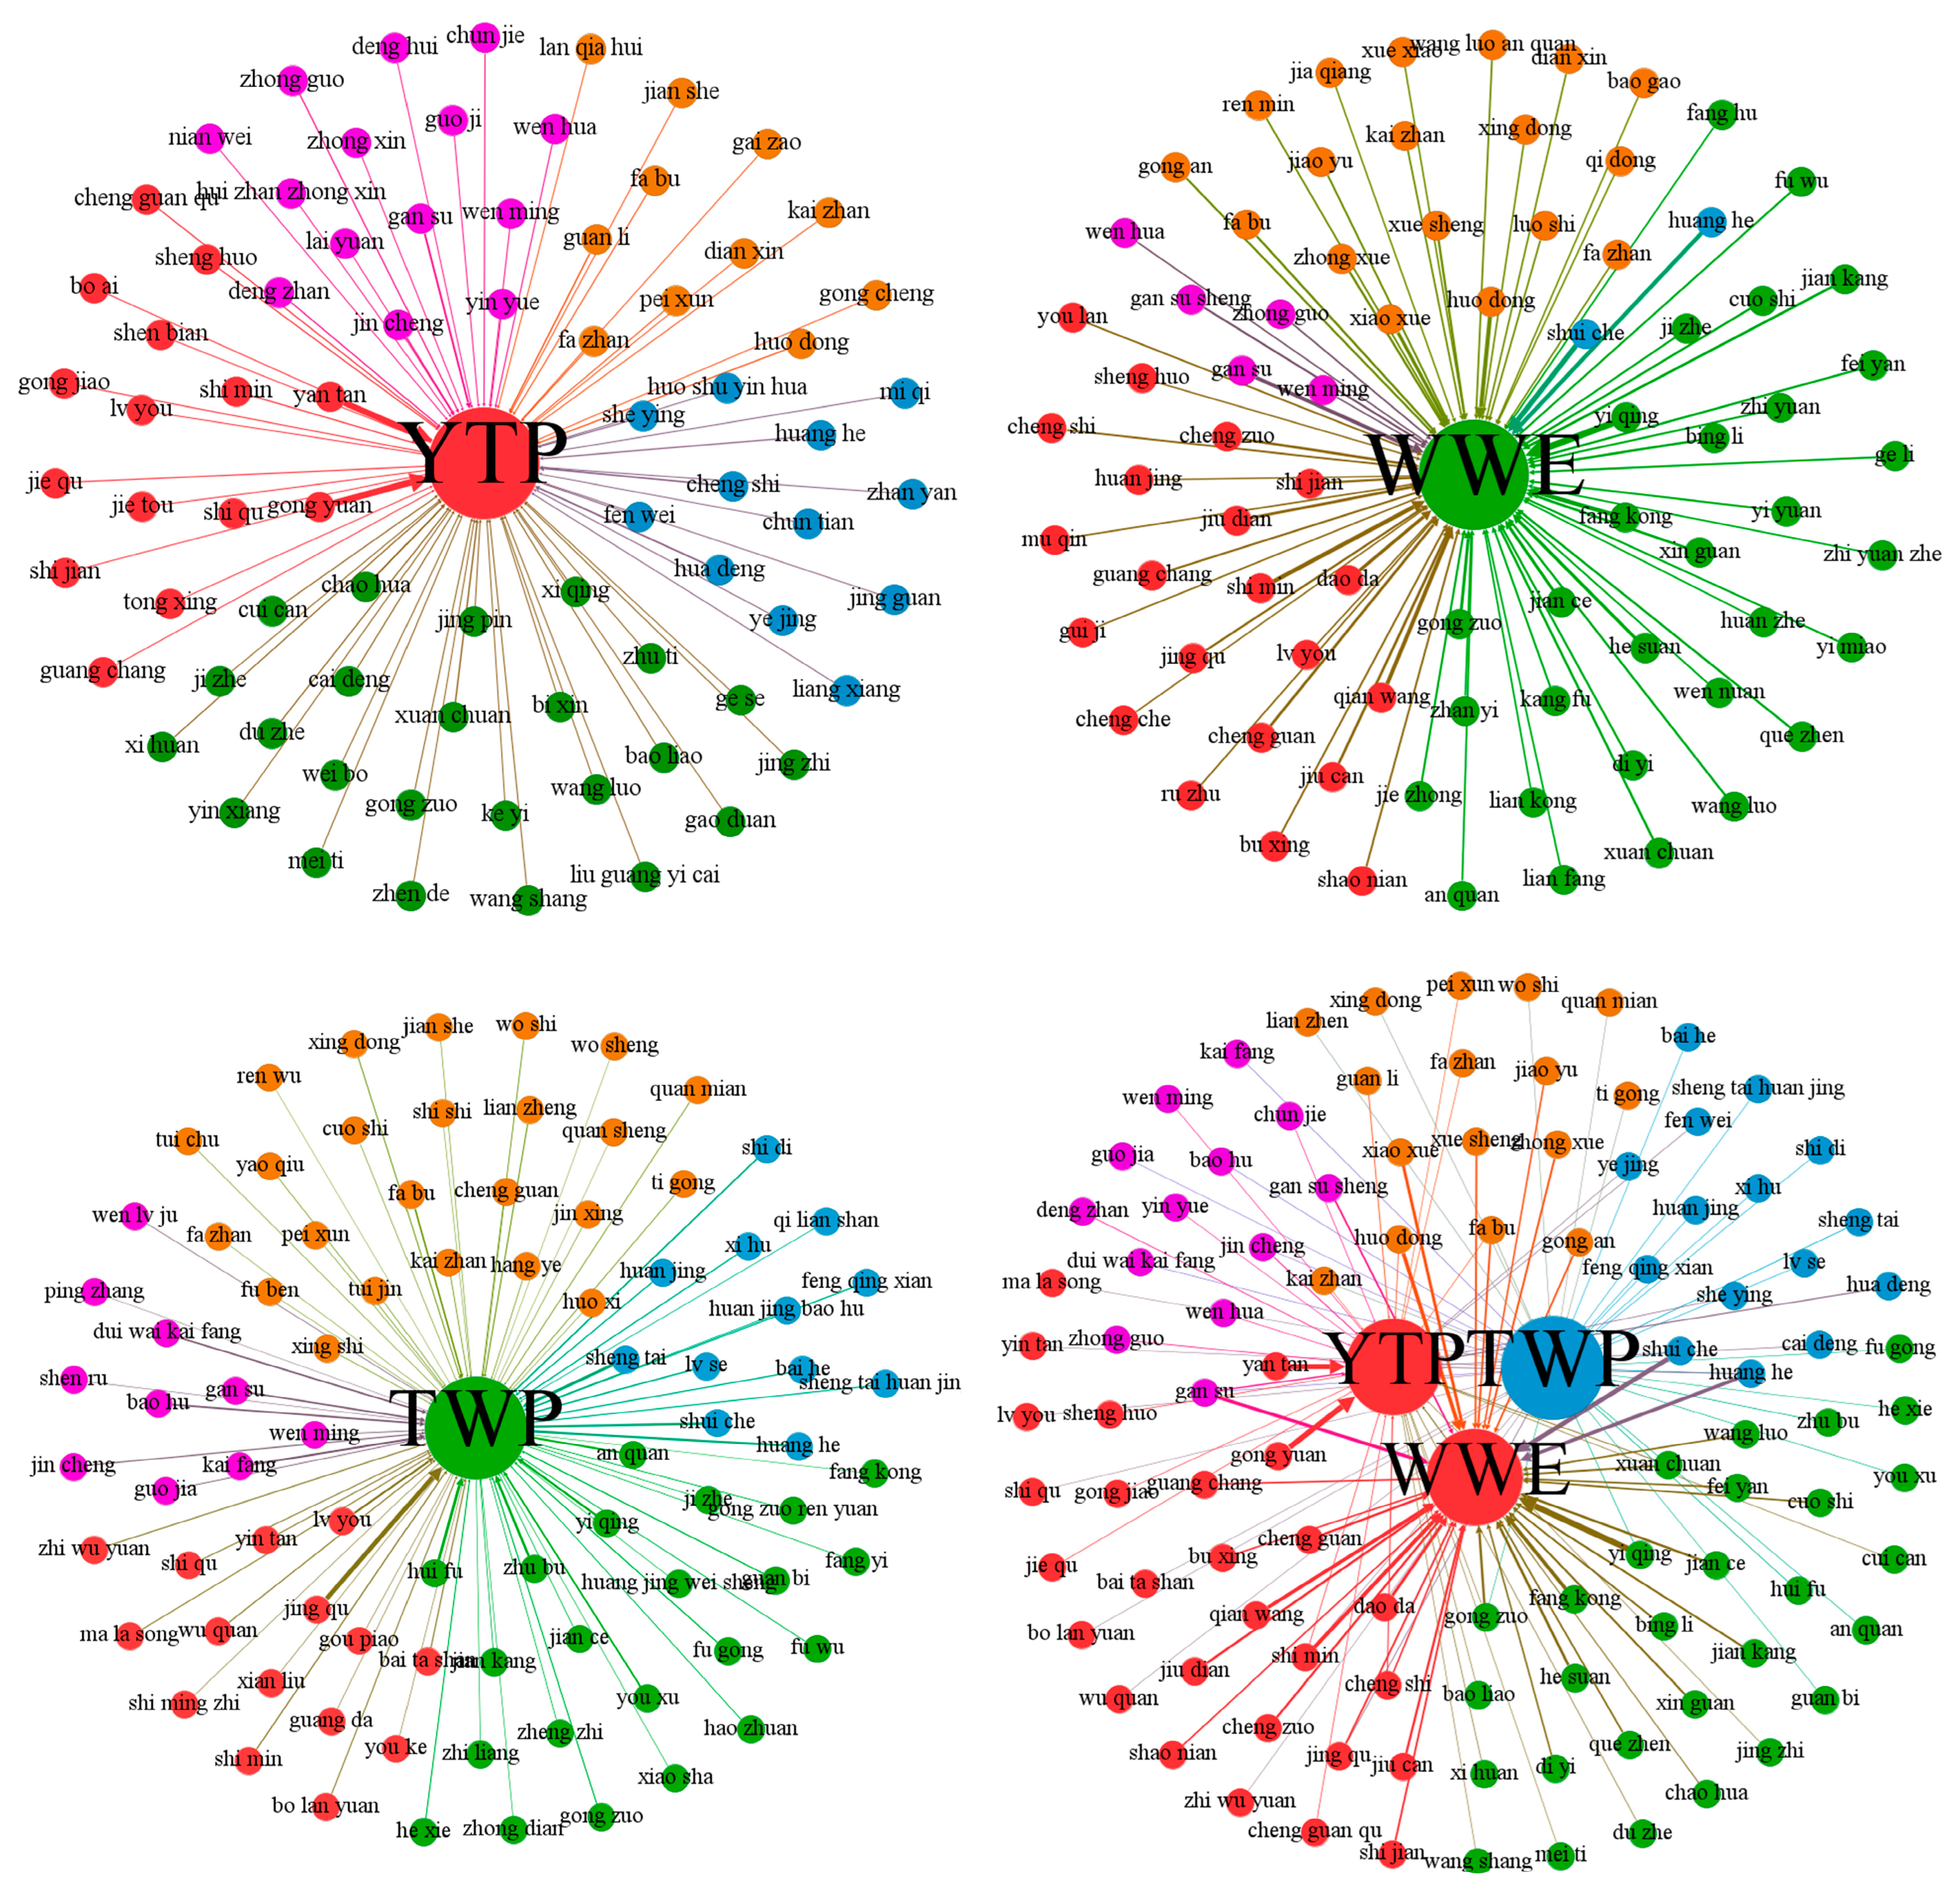
3.5. Social Network Analysis of UGBS Utilization during the Pandemic
4. Discussion
4.1. Pandemic UGBS Utilization and Attitudes across Demographics
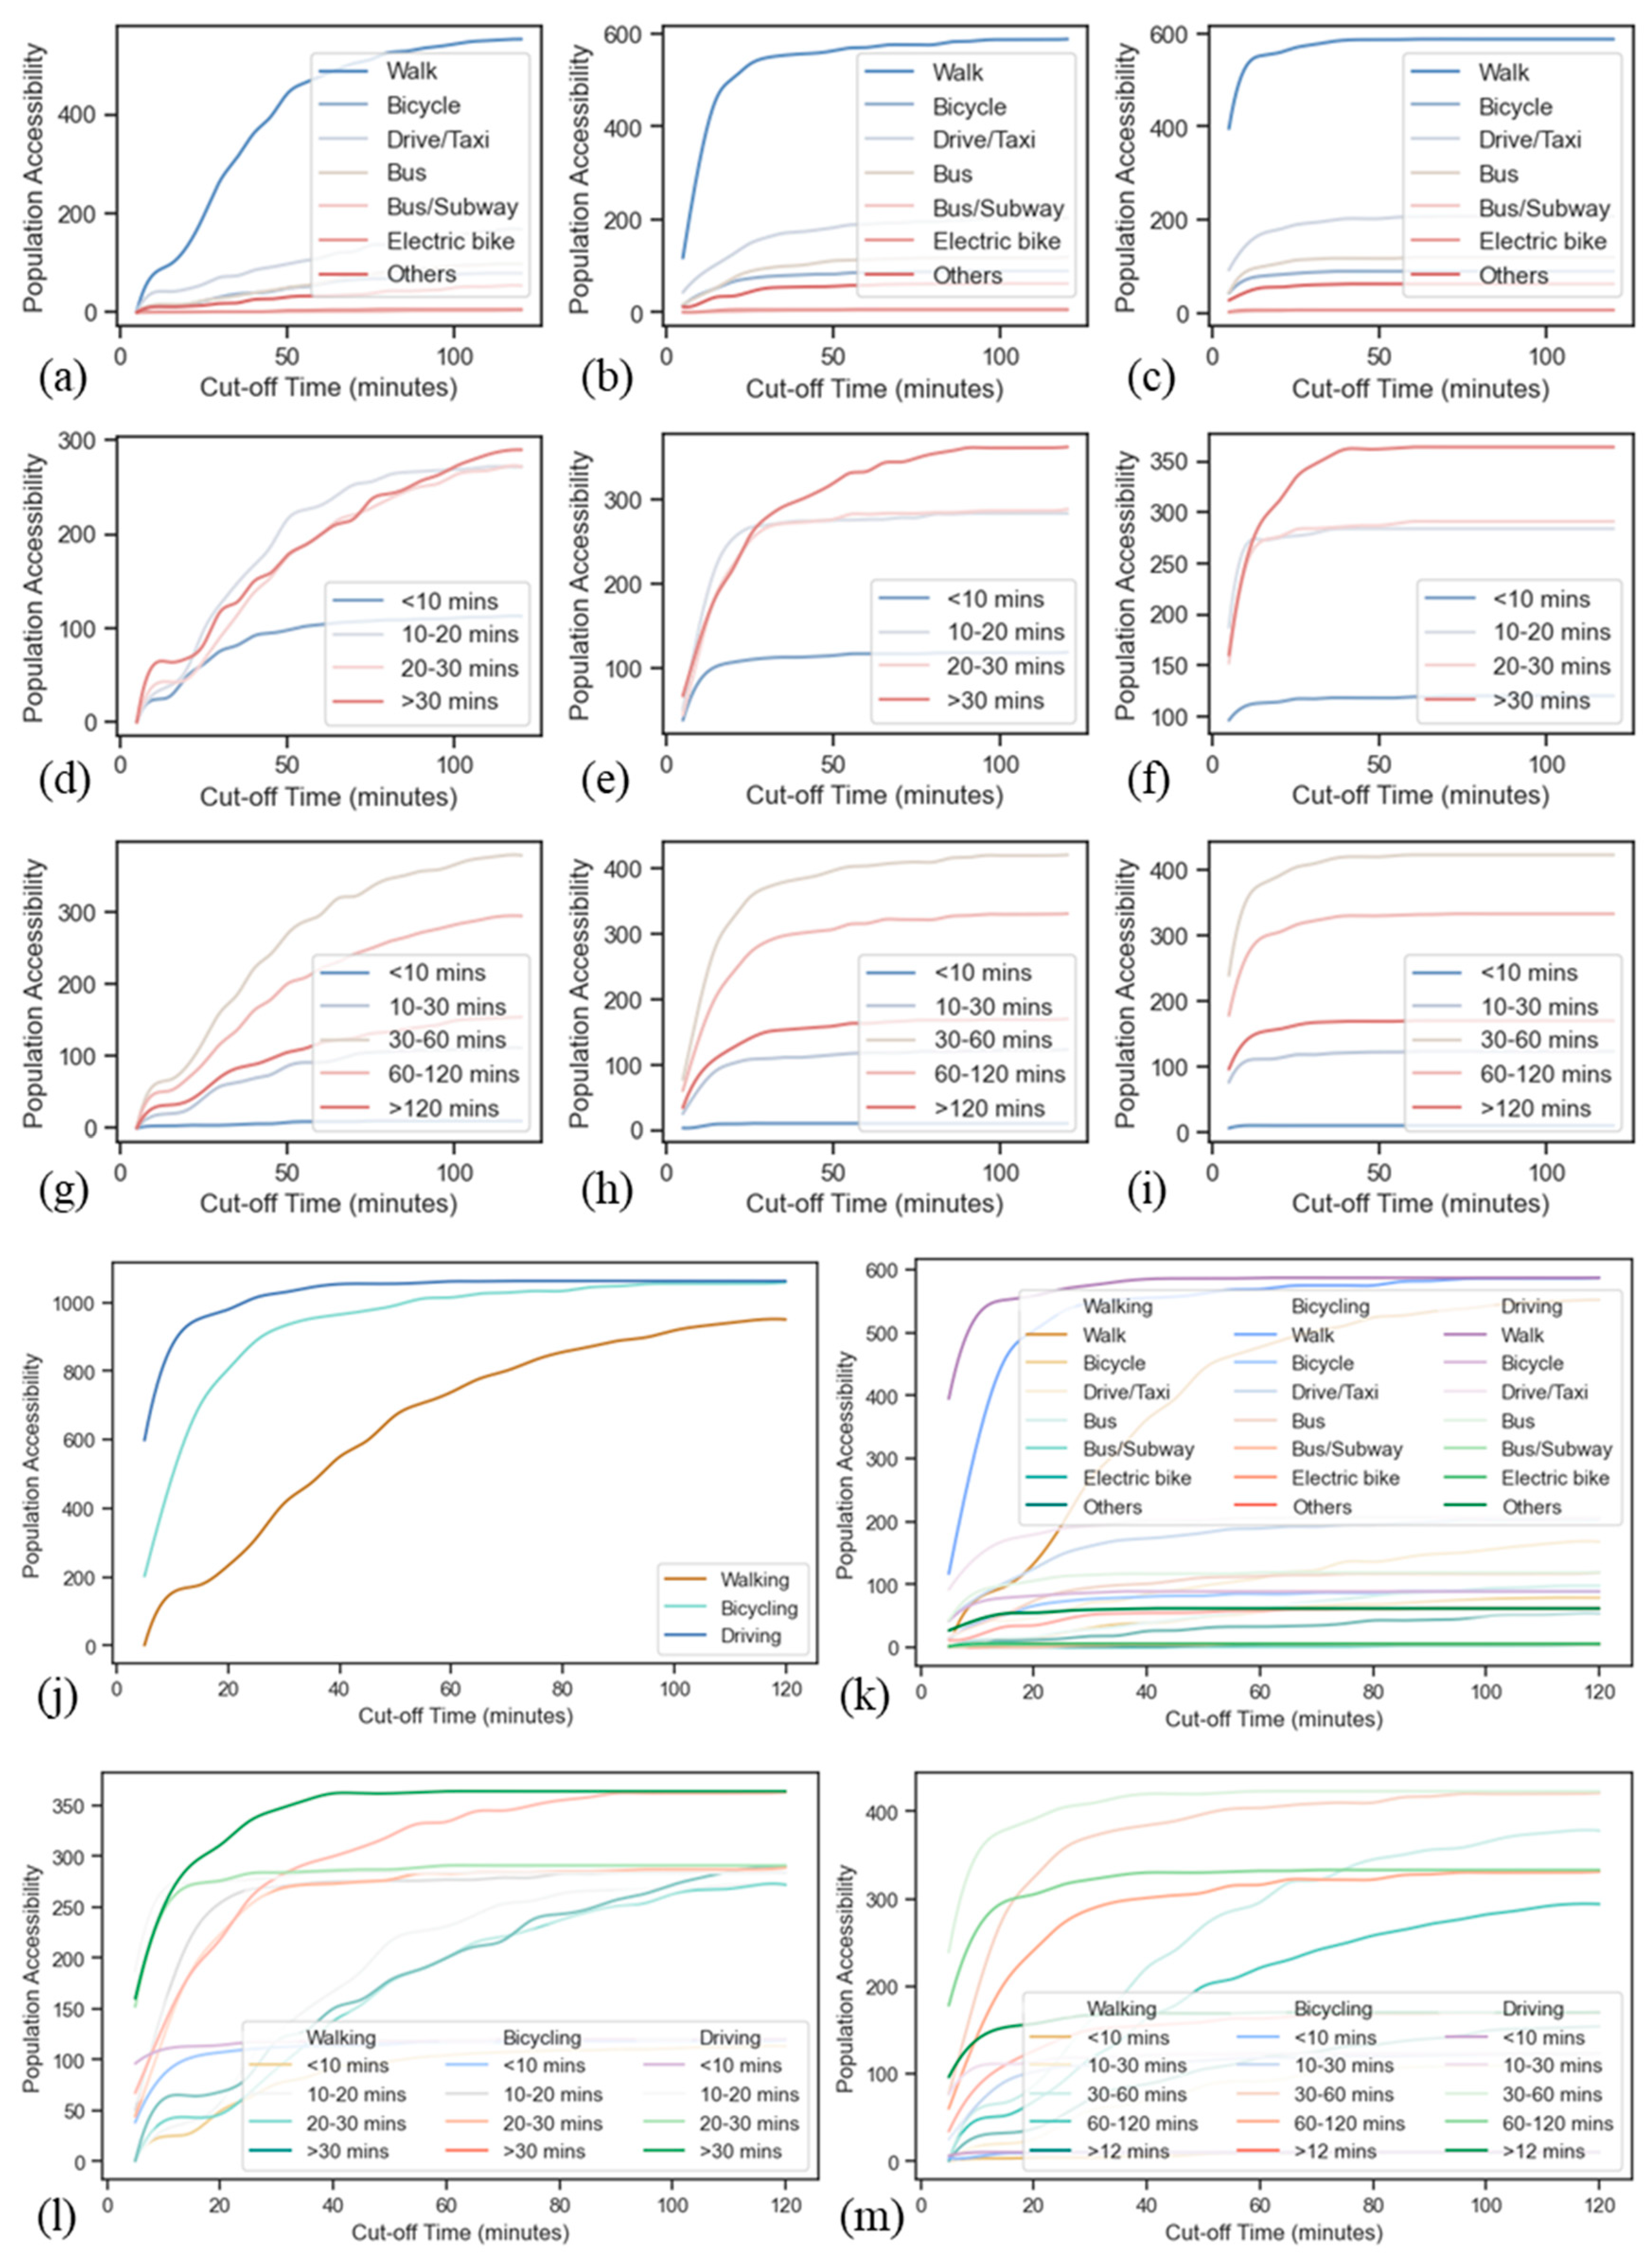
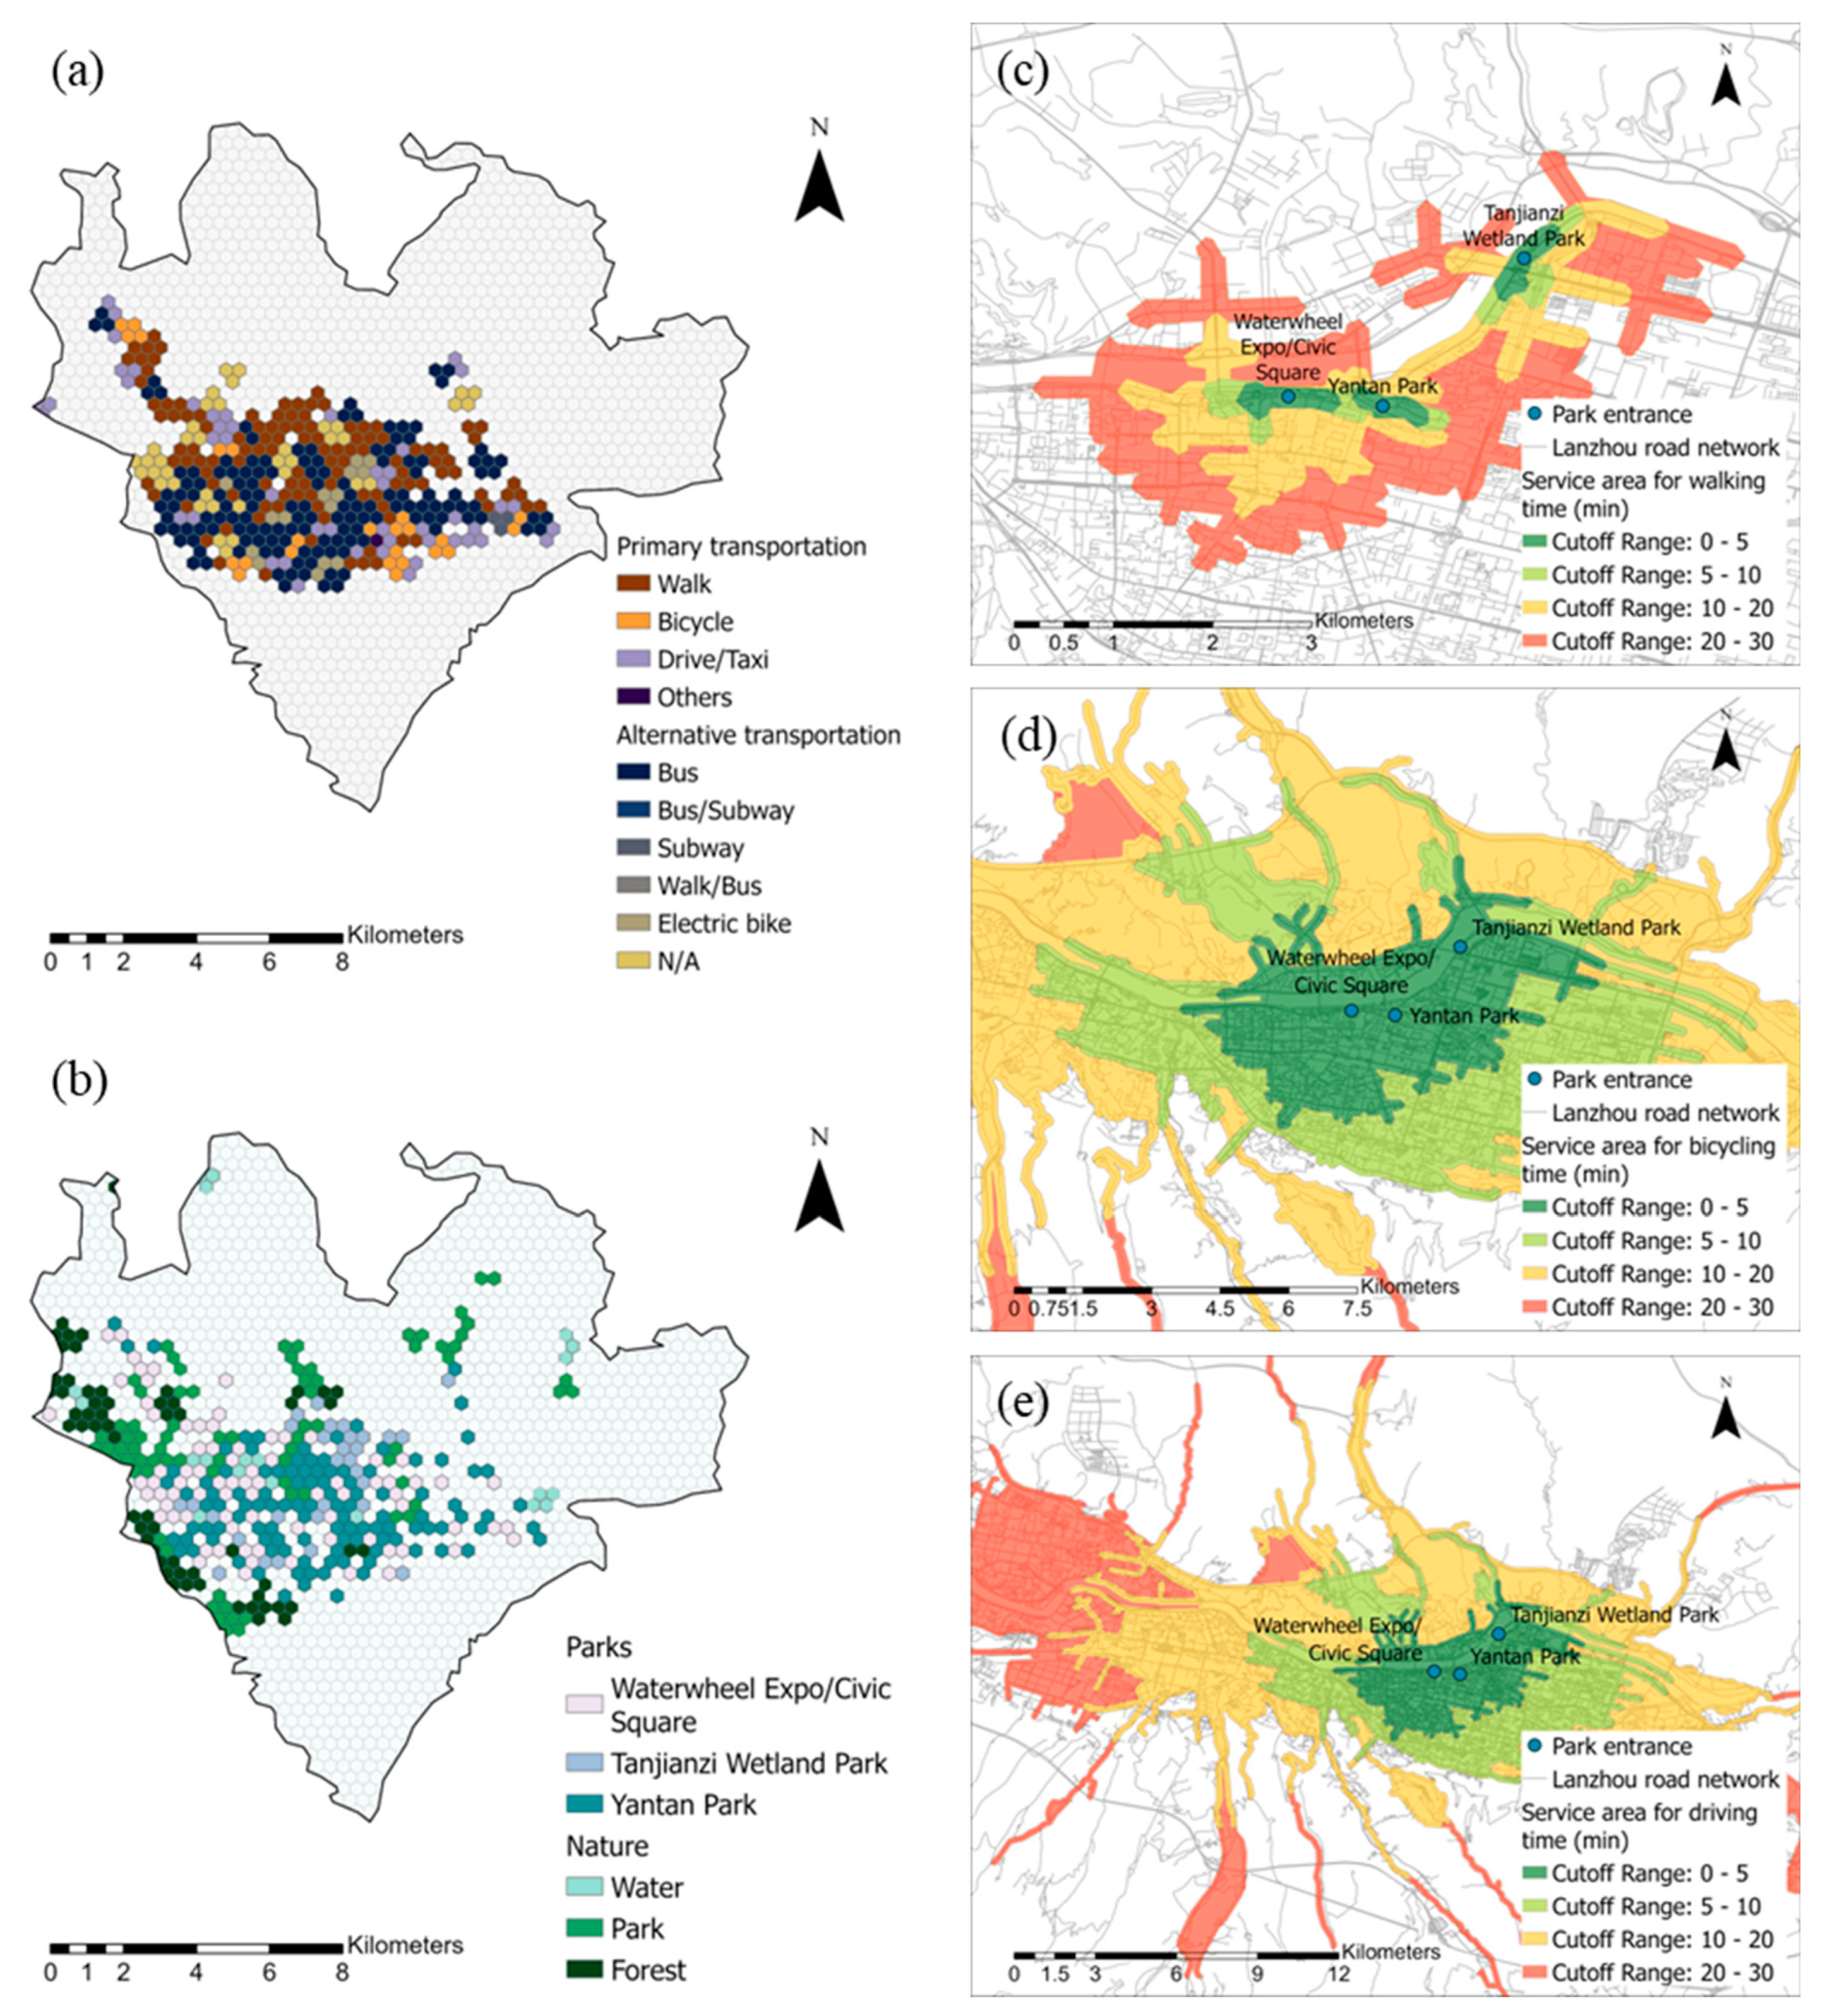
4.2. Transport and Visit Dynamics and UGBS Accessibility
4.3. Social Media and UGBS Visitation Trends
5. Conclusions
Author Contributions
Funding
Data Availability Statement
Conflicts of Interest
Appendix A. Classifications and Explanations of CES
| CES Value | Explanation |
| Aesthetic services | Connection to a specific locale; artistic portrayals of the natural world |
| Historical services | Historical documentation; cultural legacy, and symbolic engagements with the environment |
| Scientific and educational services | Rich material for on-site research and educational initiatives |
| Recreational services | Facilitation of leisure activities across varying environments, as well as experiencing the natural realm through alternative mediums. |
| Spiritual services | Appreciating and deriving spiritual benefits from particular locations, valuing and cherishing these places. |
References
- Labib, S.M.; Lindley, S.; Huck, J.J. Spatial dimensions of the influence of urban green-blue spaces on human health: A systematic review. Environ. Res. 2020, 180, 108869. [Google Scholar] [CrossRef] [PubMed]
- Poortinga, W.; Bird, N.; Hallingberg, B.; Phillips, R.; Williams, D. The role of perceived public and private green space in subjective health and wellbeing during and after the first peak of the COVID-19 outbreak. Landsc. Urban Plan. 2021, 211, 104092. [Google Scholar] [CrossRef] [PubMed]
- Reyes-Riveros, R.; Altamirano, A.; De La Barrera, F.; Rozas-Vásquez, D.; Vieli, L.; Meli, P. Linking public urban green spaces and human well-being: A systematic review. Urban For. Urban Green. 2021, 61, 127105. [Google Scholar] [CrossRef]
- Marselle, M.R.; Warber, S.L.; Irvine, K.N. Growing Resilience through interaction with nature: Can group walks in nature buffer the effects of stressful life events on mental health? Int. J. Environ. Res. Public Health 2019, 16, 986. [Google Scholar] [CrossRef] [PubMed]
- Bratman, G.N.; Hamilton, J.P.; Daily, G.C. The impacts of nature experience on human cognitive function and mental health. Ann. N. Y. Acad. Sci. 2012, 1249, 118–136. [Google Scholar] [CrossRef] [PubMed]
- Van Den Berg, A.E.; Maas, J.; Verheij, R.A.; Groenewegen, P.P. Green space as a buffer between stressful life events and health. Soc. Sci. Med. 2010, 70, 1203–1210. [Google Scholar] [CrossRef] [PubMed]
- Venter, Z.S.; Barton, D.N.; Gundersen, V.; Figari, H.; Nowell, M.S. Back to nature: Norwegians sustain increased recreational use of urban green space months after the COVID-19 outbreak. Landsc. Urban Plan. 2021, 214, 104175. [Google Scholar] [CrossRef]
- Haldane, V.; De Foo, C.; Abdalla, S.M.; Jung, A.-S.; Tan, M.; Wu, S.; Chua, A.; Verma, M.; Shrestha, P.; Singh, S.; et al. Health systems resilience in managing the COVID-19 pandemic: Lessons from 28 countries. Nat. Med. 2021, 27, 964–980. [Google Scholar] [CrossRef] [PubMed]
- Kharroubi, S.; Saleh, F. Are lockdown measures effective against COVID-19? Front. Public Health 2020, 8, 549692. [Google Scholar] [CrossRef]
- Saurabh, K.; Ranjan, S. Compliance and psychological impact of quarantine in children and adolescents due to COVID-19 pandemic. Indian J. Pediatr. 2020, 87, 532–536. [Google Scholar] [CrossRef]
- Labib, S.M.; Browning, M.H.; Rigolon, A.; Helbich, M.; James, P. Nature’s contributions in coping with a pandemic in the 21st century: A narrative review of evidence during COVID-19. Sci. Total Environ. 2022, 833, 155095. [Google Scholar] [CrossRef] [PubMed]
- Schnitzer, M.; Schöttl, S.; Kopp, M.; Barth, M. COVID-19 stay-at-home order in Tyrol, Austria: Sports and exercise behaviour in change? Public Health 2020, 185, 218–220. [Google Scholar] [CrossRef] [PubMed]
- Larson, L.R.; Mullenbach, L.E.; Browning, M.H.; Rigolon, A.; Thomsen, J.; Metcalf, E.C.; Reigner, N.P.; Sharaievska, I.; McAnirlin, O.; D’Antonio, A.; et al. Greenspace and park use associated with less emotional distress among college students in the United States during the COVID-19 pandemic. Environ. Res. 2022, 204, 112367. [Google Scholar] [CrossRef] [PubMed]
- Honey-Rosés, J.; Anguelovski, I.; Chireh, V.K.; Daher, C.; Konijnendijk van den Bosch, C.; Litt, J.S.; Mawania, V.; McCallh, M.K.; Orellanai, A.; Oscilowicza, E.; et al. The impact of COVID-19 on public space: An early review of the emerging questions–design, perceptions and ineq-uities. Cities Health 2021, 5, S263–S279. [Google Scholar] [CrossRef]
- Wolch, J.R.; Byrne, J.; Newell, J.P. Urban green space, public health, and environmental justice: The challenge of making cities ‘just green enough’. Landsc. Urban Plan. 2014, 125, 234–244. [Google Scholar] [CrossRef]
- Bosch, M.v.D.; Sang, O. Urban natural environments as nature-based solutions for improved public health—A systematic review of reviews. Environ. Res. 2017, 158, 373–384. [Google Scholar] [CrossRef] [PubMed]
- Slater, S.J.; Christiana, R.W.; Gustat, J. Peer Reviewed: Recommendations for keeping parks and green space ac-cessible for mental and physical health during COVID-19 and other pandemics. Prev. Chronic Dis. 2020, 17, E59. [Google Scholar] [CrossRef] [PubMed]
- Cheng, Y.; Zhang, J.; Wei, W.; Zhao, B. Effects of urban parks on residents’ expressed happiness before and during the COVID-19 pandemic. Landsc. Urban Plan. 2021, 212, 104118. [Google Scholar] [CrossRef]
- Derks, J.; Giessen, L.; Winkel, G. COVID-19-induced visitor boom reveals the importance of forests as critical in-frastructure. For. Policy Econ. 2020, 118, 102253. [Google Scholar] [CrossRef]
- Rice, W.L.; Pan, B. Understanding changes in park visitation during the COVID-19 pandemic: A spatial application of big data. Wellbeing Space Soc. 2021, 2, 100037. [Google Scholar] [CrossRef]
- Ugolini, F.; Massetti, L.; Calaza-Martínez, P.; Cariñanos, P.; Dobbs, C.; Ostoić, S.K.; Marin, A.M.; Pearlmutter, D.; Saaroni, H.; Šaulienė, I.; et al. Effects of the COVID-19 pandemic on the use and perceptions of urban green space: An international exploratory study. Urban For. Urban Green. 2020, 56, 126888. [Google Scholar] [CrossRef]
- Curtis, D.S.; Rigolon, A.; Schmalz, D.L.; Brown, B.B. Policy and environmental predictors of park visits during the first months of the COVID-19 pandemic: Getting out while staying in. Environ. Behav. 2022, 54, 487–515. [Google Scholar] [CrossRef]
- Mouratidis, K.; Yiannakou, A. COVID-19 and urban planning: Built environment, health, and well-being in Greek cities before and during the pandemic. Cities 2021, 121, 103491. [Google Scholar] [CrossRef]
- Hidalgo-Triana, N.; Picornell, A.; Reyes, S.; Circella, G.; Ribeiro, H.; Bates, A.; Rojo, J.; Pearman, P.; Vivancos, J.A.; Nautiyal, S.; et al. Perceptions of change in the environment caused by the COVID-19 pandemic: Implications for environmental policy. Environ. Impact Assess. Rev. 2022, 99, 107013. [Google Scholar] [CrossRef]
- Zhu, J.; Xu, C. Sina microblog sentiment in Beijing city parks as measure of demand for urban green space during the COVID-19. Urban For. Urban Green. 2020, 58, 126913. [Google Scholar] [CrossRef]
- Li, H.; Luo, W.; Hou, Y.; Xia, Y.; Yao, J.; Kang, N.; Deng, C.; Sun, H.; Chen, C. Factors affecting perceived health benefits and use behaviors in urban green spaces during the COVID-19 pandemic in southern China megacities. Front. Public Health 2021, 9, 759444. [Google Scholar] [CrossRef]
- Luo, S.; Xie, J.; Furuya, K. “We Need such a space”: Residents’ motives for visiting urban green spaces during the COVID-19 Pandemic. Sustainability 2021, 13, 6806. [Google Scholar] [CrossRef]
- Hou, Y.; Chen, C.; Lin, X.; Zhang, Z.; Liu, X.; Xie, J.; Guan, S. Do different types of urban streets lead to varying COVID-19 risk perceptions? An empirical study from a spatial heterogeneity perspective. Environ. Impact Assess. Rev. 2024, 104, 107336. [Google Scholar] [CrossRef]
- Sultana, R.; Selim, S.A. Residents’ perceptions of the role and management of green spaces to provide cultural ecosystem services in Dhaka, Bangladesh. Ecol. Soc. 2021, 26, 5. [Google Scholar] [CrossRef]
- Liang, X.; Lu, T.; Yishake, G. How to promote residents’ use of green space: An empirically grounded agent-based modeling approach. Urban For. Urban Green. 2021, 67, 127435. [Google Scholar] [CrossRef]
- Lanzhou Government. n.d. Introduction to Lanzhou. Lanzhou Government. Available online: http://www.lanzhou.gov.cn/col/col2/index.html# (accessed on 16 October 2023).
- Department of Natural Resource of Lanzhou. Lanzhou City Fourth Urban Master Plan. 2022. Available online: http://zrzyj.lanzhou.gov.cn/ (accessed on 16 October 2023).
- Wang, J.; Zhou, Y.; Zhang, W.; Evans, R.; Zhu, C. Concerns Expressed by chinese social media users during the COVID-19 pandemic: Content analysis of sina weibo microblogging data. J. Med. Internet Res. 2020, 22, e22152. [Google Scholar] [CrossRef]
- Dickinson, D.C.; Hobbs, R.J. Cultural ecosystem services: Characteristics, challenges and lessons for urban green space research. Ecosyst. Serv. 2017, 25, 179–194. [Google Scholar] [CrossRef]
- Gordon, J.E. Geoheritage, geotourism and the cultural landscape: Enhancing the visitor experience and promoting geoconservation. Geosciences 2018, 8, 136. [Google Scholar] [CrossRef]
- Gould, R.K.; Coleman, K.; Gluck, S.B. Exploring dynamism of cultural ecosystems services through a review of environmental education research. Ambio 2018, 47, 869–883. [Google Scholar] [CrossRef]
- Wang, P.; Li, N.; He, Y.; He, Y. Evaluation of Cultural Ecosystem Service Functions in National Parks from the Perspective of Benefits of Community Residents. Land 2022, 11, 1566. [Google Scholar] [CrossRef]
- Grima, N.; Jutras-Perreault, M.-C.; Gobakken, T.; Ørka, H.O.; Vacik, H. Systematic review for a set of indicators supporting the Common International Classification of Ecosystem Services. Ecol. Indic. 2023, 147, 109978. [Google Scholar] [CrossRef]
- Allam, Z.; Jones, D.S. Pandemic stricken cities on lockdown. Where are our planning and design professionals [now, then and into the future]? Land Use Policy 2020, 97, 104805. [Google Scholar] [CrossRef]
- Wen, J.; Kozak, M.; Yang, S.; Liu, F. COVID-19: Potential effects on Chinese citizens’ lifestyle and travel. Tour. Rev. 2020, 76, 74–87. [Google Scholar] [CrossRef]
- Lopez, B.; Kennedy, C.; Field, C.; McPhearson, T. Who benefits from urban green spaces during times of crisis? Perception and use of urban green spaces in New York City during the COVID-19 pandemic. Urban For. Urban Green. 2021, 65, 127354. [Google Scholar] [CrossRef]
- Richardson, E.A.; Mitchell, R. Gender differences in relationships between urban green space and health in the United Kingdom. Soc. Sci. Med. 2010, 71, 568–575. [Google Scholar] [CrossRef]
- Mayen Huerta, C.; Cafagna, G. Snapshot of the use of urban green spaces in Mexico city during the COVID-19 pandemic: A qualitative study. Int. J. Environ. Res. Public Health 2021, 18, 4304. [Google Scholar] [CrossRef]
- Zhu, Y.; Chen, Y. A study of noise exposure of traffic-type pocket parks in old urban districts based on audio-visual interaction. Appl. Acoust. 2023, 213, 109628. [Google Scholar] [CrossRef]
- Hong, D.Y.; Fan, Y.C. International comparisons of public perceptions and behaviors about climate change. Sociol. Rev. China 2013, 1, 3–15. [Google Scholar]
- Girma, Y.; Terefe, H.; Pauleit, S. Urban green spaces use and management in rapidly urbanizing countries:-The case of emerging towns of Oromia special zone surrounding Finfinne, Ethiopia. Urban For. Urban Green. 2019, 43, 126357. [Google Scholar] [CrossRef]
- Campagnaro, T.; Vecchiato, D.; Arnberger, A.; Celegato, R.; Da Re, R.; Rizzetto, R.; Semenzato, P.; Sitzia, T.; Tempesta, T.; Cattaneo, D. General, stress relief and perceived safety preferences for green spaces in the historic city of Padua (Italy). Urban For. Urban Green. 2020, 52, 126695. [Google Scholar] [CrossRef]
- Włodarczyk-Marciniak, R.; Sikorska, D.; Krauze, K. Residents’ awareness of the role of informal green spaces in a post-industrial city, with a focus on regulating services and urban adaptation potential. Sustain. Cities Soc. 2020, 59, 102236. [Google Scholar] [CrossRef]
- Kim, H.; Yang, S. Neighborhood walking and social capital: The correlation between walking experience and in-dividual perception of social capital. Sustainability 2017, 9, 680. [Google Scholar] [CrossRef]
- Berdejo-Espinola, V.; Suárez-Castro, A.F.; Amano, T.; Fielding, K.S.; Oh, R.R.Y.; Fuller, R.A. Urban green space use during a time of stress: A case study during the COVID-19 pandemic in Brisbane, Australia. People Nat. 2021, 3, 597–609. [Google Scholar] [CrossRef]
- Geneletti, D.; Cortinovis, C.; Zardo, L. Simulating crowding of urban green areas to manage access during lock-downs. Landsc. Urban Plan. 2022, 219, 104319. [Google Scholar] [CrossRef]
- Rigolon, A.; Yañez, E.; Aboelata, M.J.; Bennett, R. “A park is not just a park”: Toward counter-narratives to advance equitable green space policy in the United States. Cities 2022, 128, 103792. [Google Scholar] [CrossRef]
- Cui, N.; Malleson, N.; Houlden, V.; Comber, A. Using social media data to understand the impact of the COVID-19 pandemic on urban green space use. Urban For. Urban Green. 2022, 74, 127677. [Google Scholar] [CrossRef]


| Personal Characteristics | Index Value | Frequency | Ration% |
|---|---|---|---|
| Gender | Male | 824 | 48.3 |
| Female | 882 | 51.7 | |
| Age | 18–29 | 802 | 47.0 |
| 30–39 | 195 | 11.4 | |
| 40–49 | 146 | 8.5 | |
| 50–59 | 173 | 10.1 | |
| 60–69 | 49 | 2.9 | |
| 70+ | 341 | 20.0 | |
| Occupation | Student | 367 | 21.5 |
| Employed | 783 | 45.9 | |
| Unemployed | 128 | 7.5 | |
| Retired | 428 | 25.1 | |
| Education Level | Middle school or lower | 155 | 9.1 |
| High school | 427 | 25.0 | |
| bachelor | 969 | 56.8 | |
| Master or higher | 155 | 9.1 | |
| Marital status | Unmarried | 619 | 36.3 |
| Married | 1087 | 63.7 | |
| Residency length | 0–2 years | 306 | 17.9 |
| 3–5 years | 241 | 14.1 | |
| 6–10 years | 217 | 12.7 | |
| 11–15 years | 188 | 11.0 | |
| 16 years and more | 754 | 44.2 | |
| Annual income | Under 20,000 CNY | 686 | 40.2 |
| 20,000–40,000 CNY | 267 | 15.7 | |
| 40,000–60,000 CNY | 280 | 16.4 | |
| 60,000–80,000 CNY | 245 | 14.4 | |
| 80,000–100,000 CNY | 196 | 11.5 | |
| Over 100,000 CNY | 32 | 1.9 |
| Demographic Variables Significantly Associated with the Visiting Reasons | Chi Square (χ2) | Cramér’s V | |
|---|---|---|---|
| Walking/jogging | 50–59 years old | 11.8 * | 0.214 |
| Close to nature | Women Unmarried 18–29 years old University level Student Under 20,000 CNY income 0–2 years residency | 5.7 * 41.2 *** 26.0 *** 24 *** 56.8 *** 20.7 *** 33.6 *** | 0.109 0.290 0.319 0.222 0.341 0.211 0.262 |
| Just to relax | Unmarried University level Student Over 100,000 CNY income 0–2 years residency | 32.5 *** 27.0 *** 44.8 *** 16.0 ** 21.4 *** | 0.258 0.235 0.303 0.186 0.209 |
| Exercise | Master level or higher Student | 8.5 * 13.2 ** | 0.132 0.164 |
| Accompanying children | Married 30–39 years old Employed 80,000–100,000 CNY income 11–15 years residency | 34.4 *** 57.2 *** 45 *** 22.6 *** 29.6 *** | 0.265 0.473 0.303 0.221 0.246 |
| Play (football, skating...) | Unmarried University level Student Under 20,000 CNY income | 11.7 *** 14.5 *** 27.5 *** 14.5 * | 0.155 0.172 0.237 0.177 |
| Meet friends/relatives | Unmarried University level Student | 13.4 *** 10.6 * 11.1 * | 0.166 0.148 0.151 |
| Riding a bicycle | Men Unmarried 18–29 years old Student Under 20,000 CNY income | 8.0 ** 25 *** 11.9 * 32.7 *** 19.0 ** | 0.128 0.226 0.216 0.259 0.202 |
| Others | / | / | / |
Disclaimer/Publisher’s Note: The statements, opinions and data contained in all publications are solely those of the individual author(s) and contributor(s) and not of MDPI and/or the editor(s). MDPI and/or the editor(s) disclaim responsibility for any injury to people or property resulting from any ideas, methods, instructions or products referred to in the content. |
© 2024 by the authors. Licensee MDPI, Basel, Switzerland. This article is an open access article distributed under the terms and conditions of the Creative Commons Attribution (CC BY) license (https://creativecommons.org/licenses/by/4.0/).
Share and Cite
Wang, Y.; Li, F.; Liu, D.; Zhang, Z. Urban Green–Blue Space Utilization and Public Perceptions Amid the COVID-19 Pandemic: Insights from Northwest China. Land 2024, 13, 540. https://doi.org/10.3390/land13040540
Wang Y, Li F, Liu D, Zhang Z. Urban Green–Blue Space Utilization and Public Perceptions Amid the COVID-19 Pandemic: Insights from Northwest China. Land. 2024; 13(4):540. https://doi.org/10.3390/land13040540
Chicago/Turabian StyleWang, Yuliang, Feifei Li, Dan Liu, and Zilong Zhang. 2024. "Urban Green–Blue Space Utilization and Public Perceptions Amid the COVID-19 Pandemic: Insights from Northwest China" Land 13, no. 4: 540. https://doi.org/10.3390/land13040540
APA StyleWang, Y., Li, F., Liu, D., & Zhang, Z. (2024). Urban Green–Blue Space Utilization and Public Perceptions Amid the COVID-19 Pandemic: Insights from Northwest China. Land, 13(4), 540. https://doi.org/10.3390/land13040540