Abstract
The utilization of Social Media Data (SMD) from location-based services offers a wealth of information to analyze changes in human emotional perception influenced by high-density built environments. This study aimed to examine the impact of high-density built environment factors on human emotion perception. First, a set of indicators for high-density built environments was established. Subsequently, Natural Language Processing (NLP) was employed to analyze SMD for sentiment identification and classification. Finally, the Multi-scale Geographically Weighted Regression (MGWR) model was utilized to investigate the spatial differentiation of human emotional perception in high-density built environments. The findings revealed that positive emotions display spatial variations in high-density built environments. Additionally, positive emotions were found to be influenced by multiple variables, with different variables simultaneously affecting individuals’ positive emotions. Specific built environment indicators showed positive correlations with Open Space Ratio (OSR), Green Space Ratio (GSR), POI Functional Density (PFD), and Road Network Density (RND), while negative correlations with Floor Space Index (FSI), Ground Space Index (GSI), Building Average Layer (BAL), Water Index (WI), and Space Syntax Integration (SSI) were observed. Normalized Difference Vegetation Index (NDVI), POI Functional Mixture (PFM), Space Syntax Choice (SSC), and Population Density (PD) exhibited mixed results in different spatial contexts. This research on human perception provides insights for refined urban design and governance, addressing the limitations of top-down approaches in dense urban renewal.
1. Introduction
Human perception of the living environment is influenced by psychological needs, generating emotions that are regulated by the human nervous system and serve as fundamental representations of mental activities [1,2], and changes in vision [3], time [4], spatial environments [5], and other factors can lead to fluctuations in emotions. The significance of emotions to humans cannot be overstated, influencing the way people perceive the past, present, and future. Early research on emotions in the humanities and social sciences spanned disciplines such as anthropology [6], sociology [7,8], philosophy [9], political science [10], and race, gender, and cultural studies [11]. Scholars from diverse fields have adopted an interdisciplinary approach to explore emotions. With the emergence of the ‘spatial turn’ in contemporary cultural theory, the spatial aspect of emotions has gained prominence [12]. In the 1960s, some scholars began to explore the issue of human spatial perception from interdisciplinary fields such as environmental psychology and environmental behavior. The relationship between the urban built environment and individuals became a focal point of discussion during this period. Representative outcomes of this era include topics such as city image [13], genius loci [14], place attachment [15], place identity [16], and more. Various fields including architecture, urban planning, geography, and psychology are currently engaged in studying human emotions, with a particular focus on the interplay between individuals, emotions, and spaces [17]. Research topics range from emotions in ecological environments and climate change, intimate spaces, politics and emotions, education and emotions, sense of place and belonging, race and emotions, special populations and emotions, etc. [18]. As humanism progresses, an increasing number of scholars recognize the importance of paying attention to emotional perception in urban space research. This research can contribute to the improvement of the urban built environment, enhancing the quality of public spaces, addressing issues of social-spatial inequality, and promoting residents’ well-being [19,20,21].
Meanwhile, the density of the built environment in which humans reside is continually increasing, particularly in China. A report from the United Nations Human Settlements Programme predicted that, by 2030, over 60% of the global population will reside in urban areas, with 43 cities expected to have a total population exceeding ten million, one-fifth of which will be in China [22]. High-density built environments have become one of the primary spatial characteristics of urban development in China, especially in main urban areas. Influenced by factors such as land prices, development costs, and investment returns, urban spaces often exhibit higher density, greater intensity, more three-dimensional construction, and more complex systems. The iterative evolution of spatial forms and structural patterns has accelerated. The concept of the “Compact City” posits that high-density construction is conducive to promoting sustainable urban development [23], improving transportation, conserving energy [24], and enhancing the efficiency of public resource allocation [25]. However, high-density urban development may also diminish the quality of the living environment. For instance, the dense construction of high-rise buildings can worsen urban ventilation conditions, exacerbating the urban heat island effect [26]. Extensive development of hard surfaces can disrupt natural ecological environments, leading to severe traffic congestion during peak hours. The lack of public activity spaces contributes to decreased community awareness [27], and high-frequency interactions among the population may result in psychological health issues such as anxiety, tension, and irritability [28].
With the rapid urbanization in China, the complexity of the built environment is increasing. While limited research has been conducted on emotional perception in high-density built environments, there is a growing discussion on how individuals perceive these environments and their impact on human emotions [29]. Moreover, benefiting from the rapid development of Geographic Information System (GIS) and the proliferation of social media data (SMD) in research methodologies, new pathways have emerged in the study of emotional perception. In terms of built environments, traditional spatial morphology research methods based on human-scale measurements face challenges in adapting to the trends of urban scale enlargement, spatial complexity, and the diversification of factors. Issues such as weak scale perception, limited data samples, and singular analysis approaches have arisen. However, GIS can facilitate comprehensive and precise quantitative analysis of high-density built environments through techniques such as big data processing and visualization [30], spatial morphology assessment [31,32], ecological environment monitoring [33], spatial element identification [34], and spatial statistical research [35]. In terms of emotional perception, traditional research methods typically fall into two categories: first, by constructing subjective indicators such as cognition and employing methods like questionnaire surveys to obtain respondents’ emotional perceptions [36] and second, by collecting textual information such as travelogues and interviews from travel websites and inferring people’s emotions towards cities or places through text analysis [37]. In recent years, the utilization of location-tagged street view images, semantic information from social media, and machine learning datasets created through perceptual crowdsourcing, intelligent recognition, and image segmentation, enables large-scale quantification of spatial perceptions [38,39,40]. In the age of the Internet, an increasing number of people choose to express subjective evaluations of objective things online, tending to share their feelings on social networks. Individuals’ perceptions of material spaces are gradually disseminated in internet-sharing communities. The use of SMD based on location-based services provides large amounts of information for describing changes in residents’ emotions brought about by the urban built environment. Meanwhile, Natural Language Processing (NLP) methods have shown tremendous potential in sentiment analysis research using SMD [41,42,43]. Taking the example of “sign-in” data from social media platforms, the data are conveyed in textual form, expressing individuals’ perceptions of things and including emotional evaluations, location tags, and other information. These data can effectively capture the diverse viewpoints of various groups towards the urban built environment. It has the capability to reflect the real-time behaviors of a large population, serving as a record of individuals’ interactions with physical spaces during their online activities [44].
This study proposes a research approach that combines GIS and Opinion Mining (OM) to explore the relationship between quantitative indicators of high-density built environments and people’s emotional perception in the main urban area of Wuhan. This study aims to explore two questions regarding urban space: First, what is the relationship between quantitative indicators of high-density built environments and people’s emotional perception? Second, can spatial differentiation characteristics be found in the high-density built environment indicators that affect emotional perception? First, this research establishes a comprehensive system of indicators for high-density built environments using diverse data to evaluate and measure spatial morphology and typological features of the study area. Then, NLP techniques are applied to sentiment result identification in SMD, revealing the emotional types and proportions of different population groups in various neighborhoods. Finally, a Multi-scale Geographically Weighted Regression (MGWR) model is used to explore spatial differentiation characteristics of population emotional perception and high-density built environments. The significance of this study lies in the quantitative analysis that examines how objective environments influence subjective perceptions, addressing the top-down singularity in urban renewal processes. It provides scientific insights and references for the implementation of refined urban design and governance.
2. Materials and Methods
2.1. High-Density Built Environment Indicators and Hypothesis
For the factors influencing human perception in the urban built environment, some research indicates that areas with high floor space index and mixed urban functions can increase the visual burden on individuals, leading to heightened feelings of tension [45]. Other studies suggest a positive correlation between open space, green landscapes in the city, and people’s positive emotions [46]. Additionally, factors such as building height, road network density, and population density also have a certain impact on human perception [47]. The ‘5Ds’ index system proposed by Ewing et al. has sparked significant research on the correlation between residents’ perceptions and the built environment [48]. In this study, five major categories—Urban Form, Green Environment, Urban Function, Transportation, and Population Density—were selected as primary indicators for quantitative analysis of high-density built environments. Thirteen influencing factors, including Floor Space Index (FSI), Ground Space Index (GSI), Open Space Ratio (OSR), Building Average Layer (BAL), Green Space Ratio (GSR), Normalized Difference Vegetation Index (NDVI), Water Index (WI), POI Functional Mixture (PFM), POI Functional Density (PFD), Road Network Density (RND), Space Syntax Integration (SSI), Space Syntax Choice (SSC), and Population Density (PD), were used as secondary indicators (Table 1). These factors were analyzed separately, and all data were normalized. The hypothesis posits a significant relationship between the chosen high-density built environment indicators and the perception of human emotions, which will be further verified.
The quantitative indicators of Urban Form were based on an indicator system called “Spacemate”, established by Professor Meta Berghauser Pont, to assess the correlation between building density and urban fabric [49]. He combined FSI, GSI, OSR, and BAL in blocks to represent building capacity intensity, block density, open space proportion, and building height, respectively. Through these four dimensions, it effectively distinguishes the spatial characteristics of different urban block forms and environments, avoiding the limitations of using a single building density indicator to describe the density status of blocks and urban environments [50,51]. The Greening Environment quantitative indicators encompassed three secondary indicators: GSR, WI, and NDVI. The type of green space in the GSR was selected from the Chinese standard for classification of urban green space [52], which included green space within the four categories of urban construction land: park green space, protective green space, square space, and subsidiary green space. The WI represents the difference between the minimum distance from the neighborhood to the surrounding adjacent waters within a specific range; a higher value indicates a better waterfront environment. This index was utilized to convey the ecological quality of the neighborhood and its surrounding natural environment [53]. The NDVI quantifies the state of vegetation growth by measuring the difference between near-infrared and red light, reflecting the radiative quantification of the relative abundance and activity of green living vegetation, and is widely used in quantitative studies of vegetation cover [54]. Urban Function quantitative indicators were analyzed quantitatively through Point of Interest (POI) data. First, kernel density analysis was employed to identify the clustering patterns of POI features, studying their spatial functional density and distribution characteristics [55]. Second, information entropy was utilized to calculate the functional diversity of POIs, where higher entropy values indicated a greater variety of land use types with different functions [56]. POI classifications included restaurants, scenic spots, public facilities, shopping malls, transportation nodes, finance facilities, educational institutions, culture facilities, business, life services, sports and leisure, medical services, government institutions, and accommodation services. The quantitative indicators of Transportation consisted of RND, SSI, and SSC. RND reflected the efficiency and capacity of urban road traffic [57]. Spatial Syntax was proposed by British scholar Bill Hillier in the 1970s, and the basic principle is to describe the quantitative relationship between spaces with mathematical topological relations, which can be used to interpret the way and degree of influence of urban spatial morphology on human spatial behaviors [58]. Among them, SSI is the degree of agglomeration or disagglomeration between an element and other elements in a spatial system. It measures the ability of a space to attract arrival traffic as a destination. A higher degree of integration implies better accessibility within the space, facilitating the accumulation of pedestrian traffic. SSC, the frequency of an element in a spatial system as the shortest topological distance between two nodes, reflects the likelihood of a space being penetrated; the higher the degree of choice, the more likely a space is to be penetrated by vehicle flows [59,60]. Population Density is an indicator reflecting the degree of population concentration within a certain area and directly influencing residents’ perception of the living environment. While lower population density contributes to increased residential comfort, it is unfavorable for intensive mixed land use and sustainable transportation [61]. Conversely, higher population density leads to a decrease in per capita public resources, and the dense population and activities can also create a sense of oppression for residents [62].

Table 1.
Calculation and statistics of influencing factors.
Table 1.
Calculation and statistics of influencing factors.
| Indicator | Calculation Method | Formula | Reference | |
|---|---|---|---|---|
| Primary Indicator | Secondary Indicator | |||
| Urban Form | FSI (Floor Space Index) | Ratio of gross floor area to site area | Berghauser, P. (2004) [49] | |
| is the sum of all floor areas in the block, and is the area of the block. | ||||
| GSI (Ground Space Index) | Ratio of building base area to site area | |||
| is a building in the block, is the building base area of the th building, and is the area of the block. | ||||
| OSR (Open Space Ratio) | Ratio of open space area to site area | |||
| is a building in the block, is the building base area of the th building, and is the area of the block. | ||||
| BAL (Building Average Layer) | Average Layer of buildings in the block | |||
| is a building in the block, is the number of layers in the th building, and is the number of buildings in the block. | ||||
| Green Environment | GSR (Green Space Ratio) | Ratio of green space area to site area in the block | - | |
| is the sum of the areas of the various types of green spaces in the blocks, and is the area of the block. | ||||
| NDVI (Normalized Difference Vegetation Index) | Calculated based on the reflectance of light in the visible and near-infrared portions of the electromagnetic spectrum. | Jin, K. (2020) [54] | ||
| is the reflectance in the near-infrared spectrum, and is the reflectance in the red spectrum. | ||||
| WI (Water Index) | Minimum distance from the block to the surrounding water | Wang, J. (2016) [53] | ||
| takes the value of 3000 m search radius, and is the closest distance to the water. | ||||
| Urban Function | PFM (POI Functional Mixture) | Ratio for each type of POI function point | Xue, B. (2018) [55] | |
| is the number of POI types in the block, and is the ratio of the number of types of th POIs in the block to the total number. | ||||
| PFD (POI Functional Density) | Kernel density at each POI functional point | Miaoyi, L.I. (2018) [56] | ||
| is the POI data point density fraction (points/km2) for a facility point within a block, is the sum of the values of the POI points for that facility point within the block, and is the area of the block (km2). | ||||
| Transportation | RND (Road Network Density) | Ratio of road length to site area in a block | Jenelius, E. (2009) [57] | |
| is the sum of the lengths of all types of roads in the block, and is the area of the block. | ||||
| SSI (Space Syntax Integration) | The ratio of the generalized distance to the generalized distance from the line segment to all other line segments | Hillier and Iida’s (2005) [59] | ||
| is the shortest path between line i and line k. r = 500 m | ||||
| SSC (Space Syntax Choice) | Ratio of the number of times the shortest path crosses an axis to the shortest path | Xia, X. (2013) [60] | ||
| is the shortest path between line segment and line segment , and is the shortest path between line segment and line segment that contains line segment . r = 500 m | ||||
| PD (Population Density) | Ratio of residential population in a block-to-block area | Burton, E (2002) [61] Shen, Y. (2019) [62] | ||
| is total population in the block, and is the area of the block (km2). | ||||
2.2. Study Area
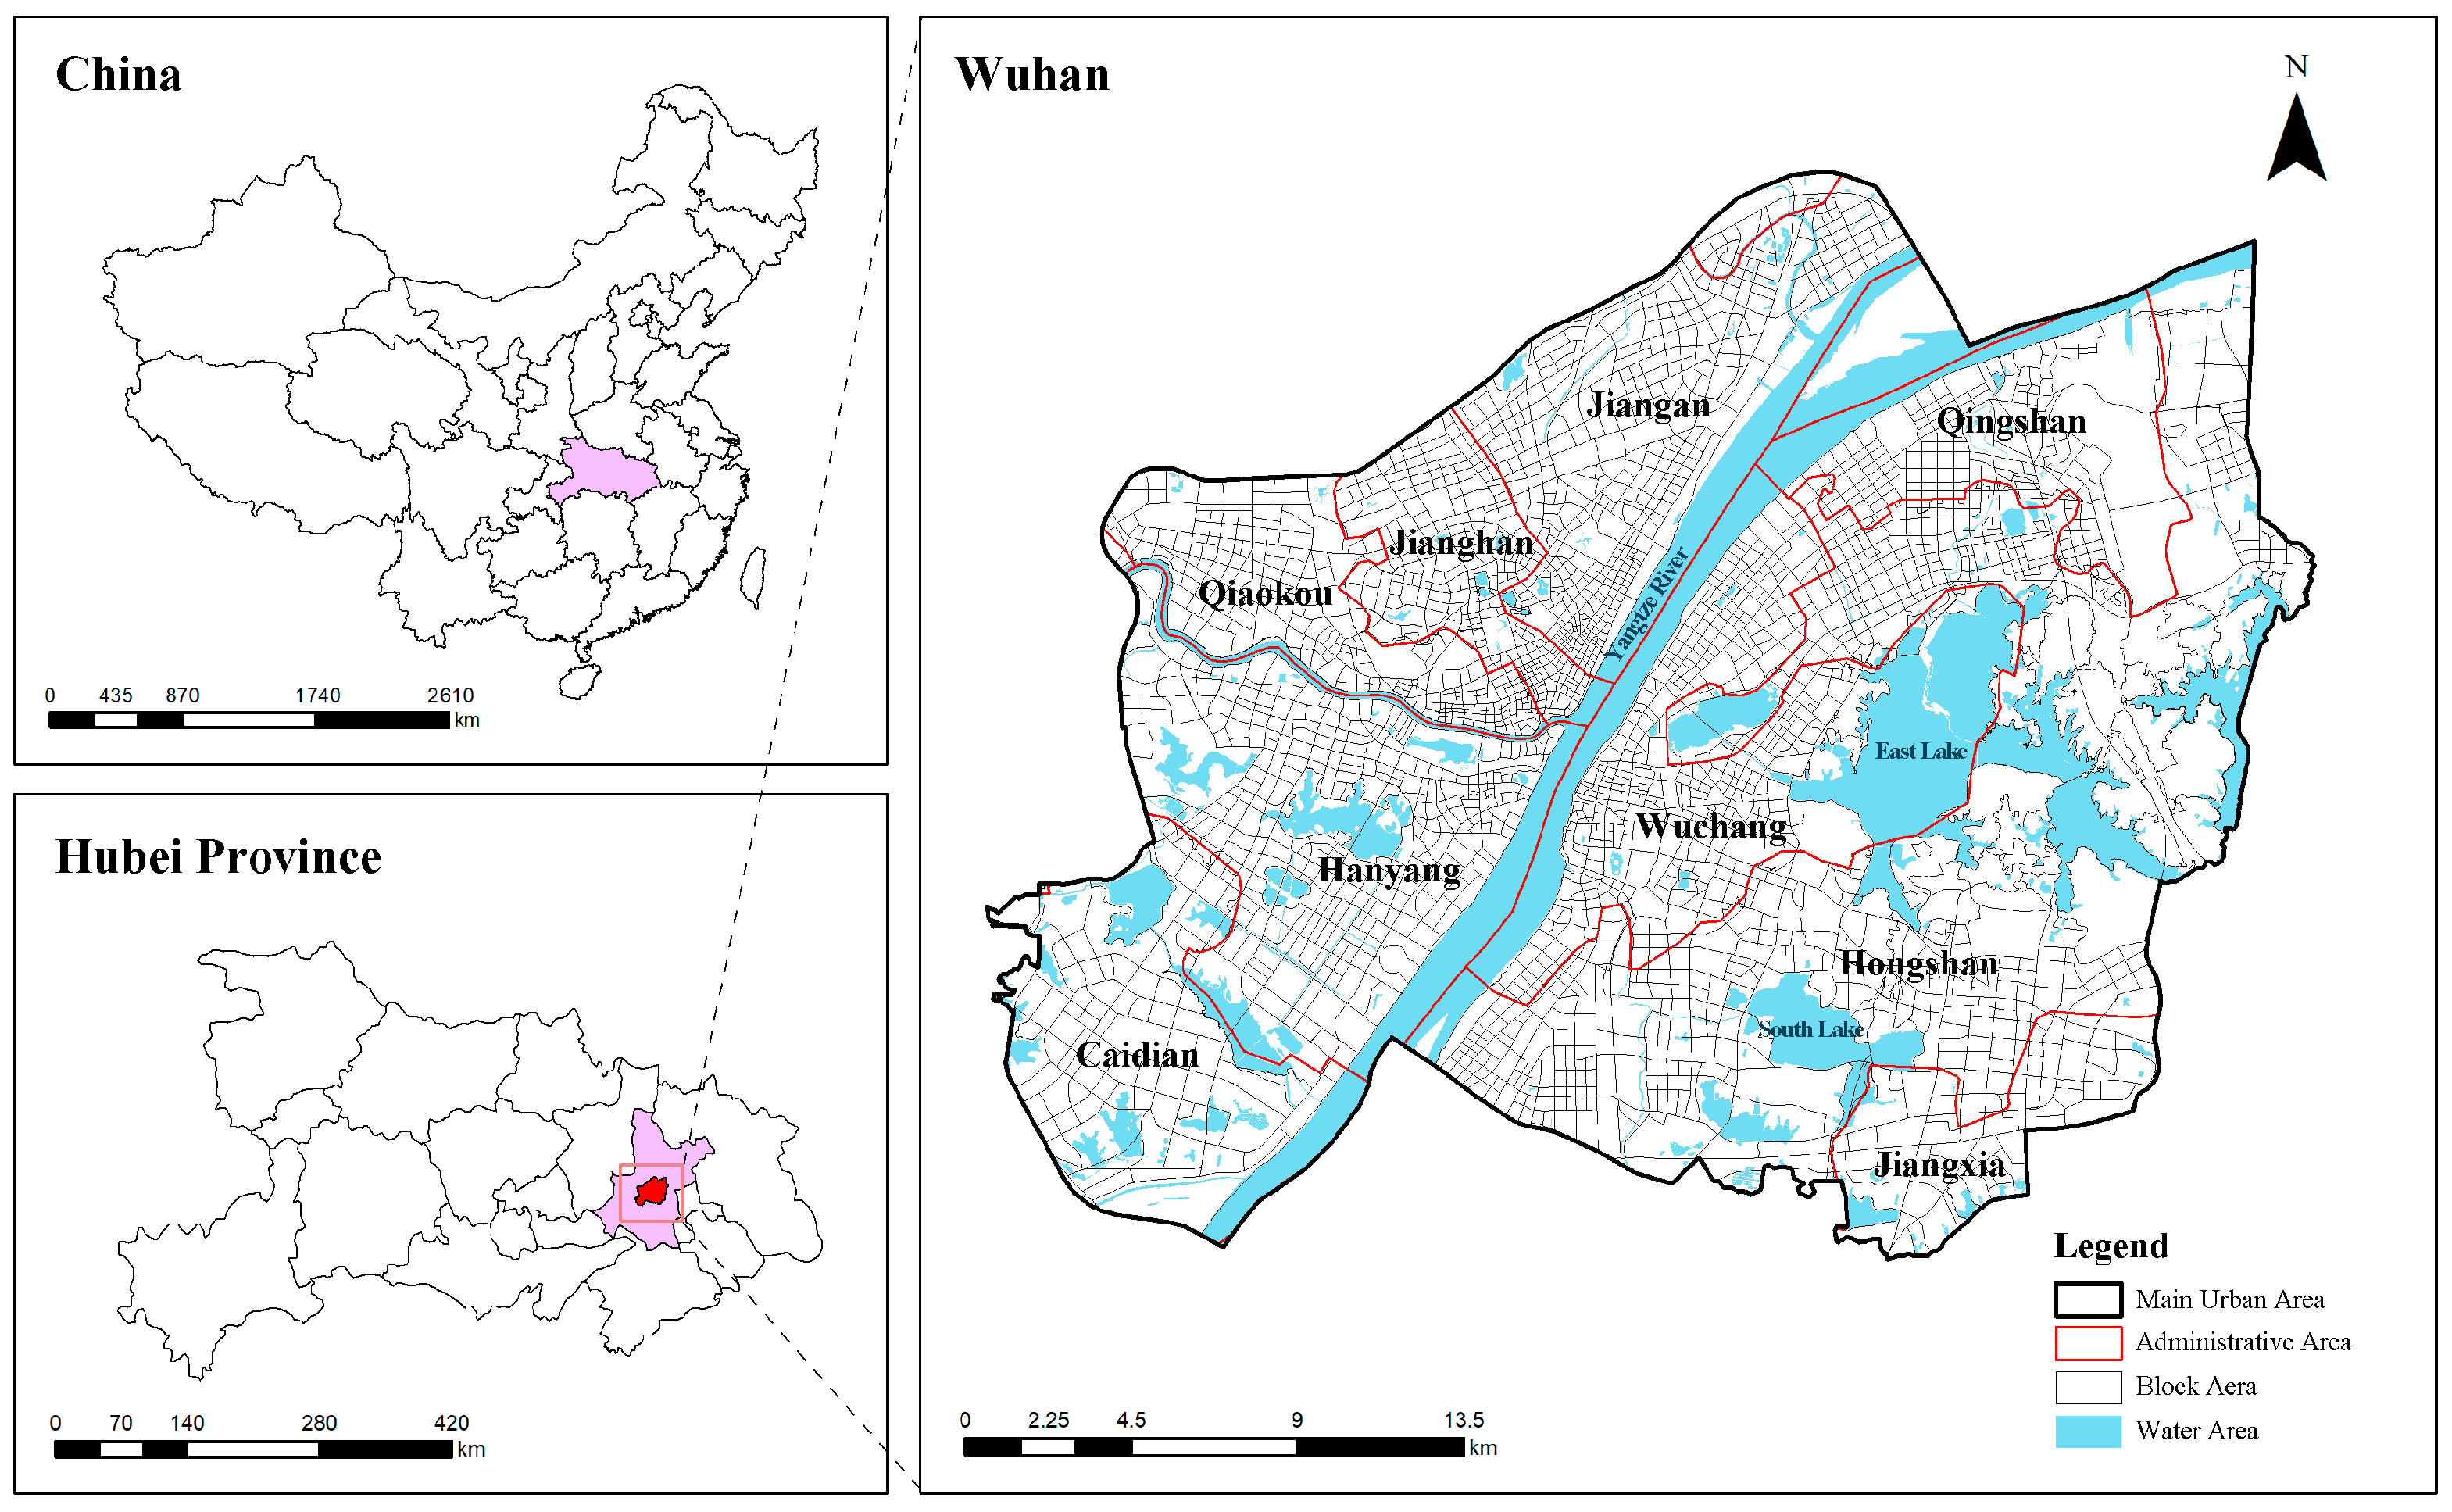
Wuhan is recognized by the United Nations as one of the world’s “Design Capital”, and it is also a nationally renowned historical and cultural city, as well as the central city and the only sub-provincial city in the central region of China. This research used all the blocks in the main urban area of Wuhan as the research objects, covering an area of approximately 690 square kilometers, with a total of 2665 blocks. This included eight administrative districts: Hanyang District, Jiang’an District, Jianghan District, Qiaokou District, Wuchang District, Hongshan District, Qingshan District, and Jiangxia District. The total population is approximately 7.1 million, accounting for about 52% of the total population of Wuhan. This area is home to a large number of migrants and has the highest population density and the most intense urban development in Wuhan. It is also an area with a highly concentrated urban vitality. Therefore, the main urban area of Wuhan can serve as a typical case for studying the perception of emotions in high-density built environments (Figure 1).
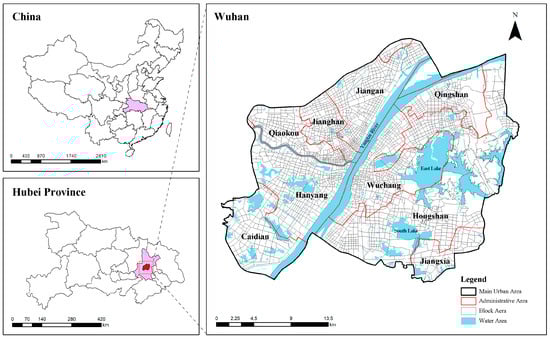
Figure 1.
Study Area.
2.3. Data Resources
2.3.1. Built Environment Data
The built environment data were comprised of six categories: Buildings Vector data, Green Space and Water Space Vector data, NDVI data, POI data, Road Network data, and Population data. The Building Vector data and Road Network data were sourced from the Open Street Map platform, while the Green Space and Water Space Vector data were obtained from the National Geomatics Information System of China. The NDVI data (250 m) were provided by the Resource and Environment Science and Data Center of China, and the POI data were collected from the Baidu Maps platform. The Population data were obtained from the statistical data of the seventh population census of the Wuhan Municipal People’s Government by the Wuhan Geomatics Institute (Table 2).
Table 2.
Statistics of data sources.
2.3.2. Emotional Perception Data
First, the emotional perception data were extracted using a Python program by searching the Weibo platform for the keyword “Wuhan sign-in” and obtaining a large number of geospatial information, which referred to data associated with geographical locations within the content. The geospatial information included details such as the geographical coordinates (latitude and longitude) of the location from which a post or message was published. When users on Weibo choose to share their location or tag a specific place in their posts, this geospatial information becomes part of the metadata associated with the content. It enables users to provide context about where they are or what they are experiencing. These data, collected from approximately 300,000 Weibo sign-in posts from 11 March 2021 to 8 December 2023, include text content, titles, posting time, likes, comments, and other details. Since Weibo data cover a wide range of information, in order to accurately reflect the impact of urban built environments on people’s emotions, the study used a “keyword filtering” method (keywords examples: buildings, streets, neighborhoods, parks, green spaces, urban environment, etc.) to clean the Weibo data. Irrelevant public opinion, entertainment, advertising, and commercial data were removed, leaving 15,888 valid Weibo posts related to urban built environments and geographical locations. Finally, the spatial distribution of emotional perception data was processed, analyzed, and mapped using ArcGIS 10.8.
2.4. Methods
2.4.1. Research Framework
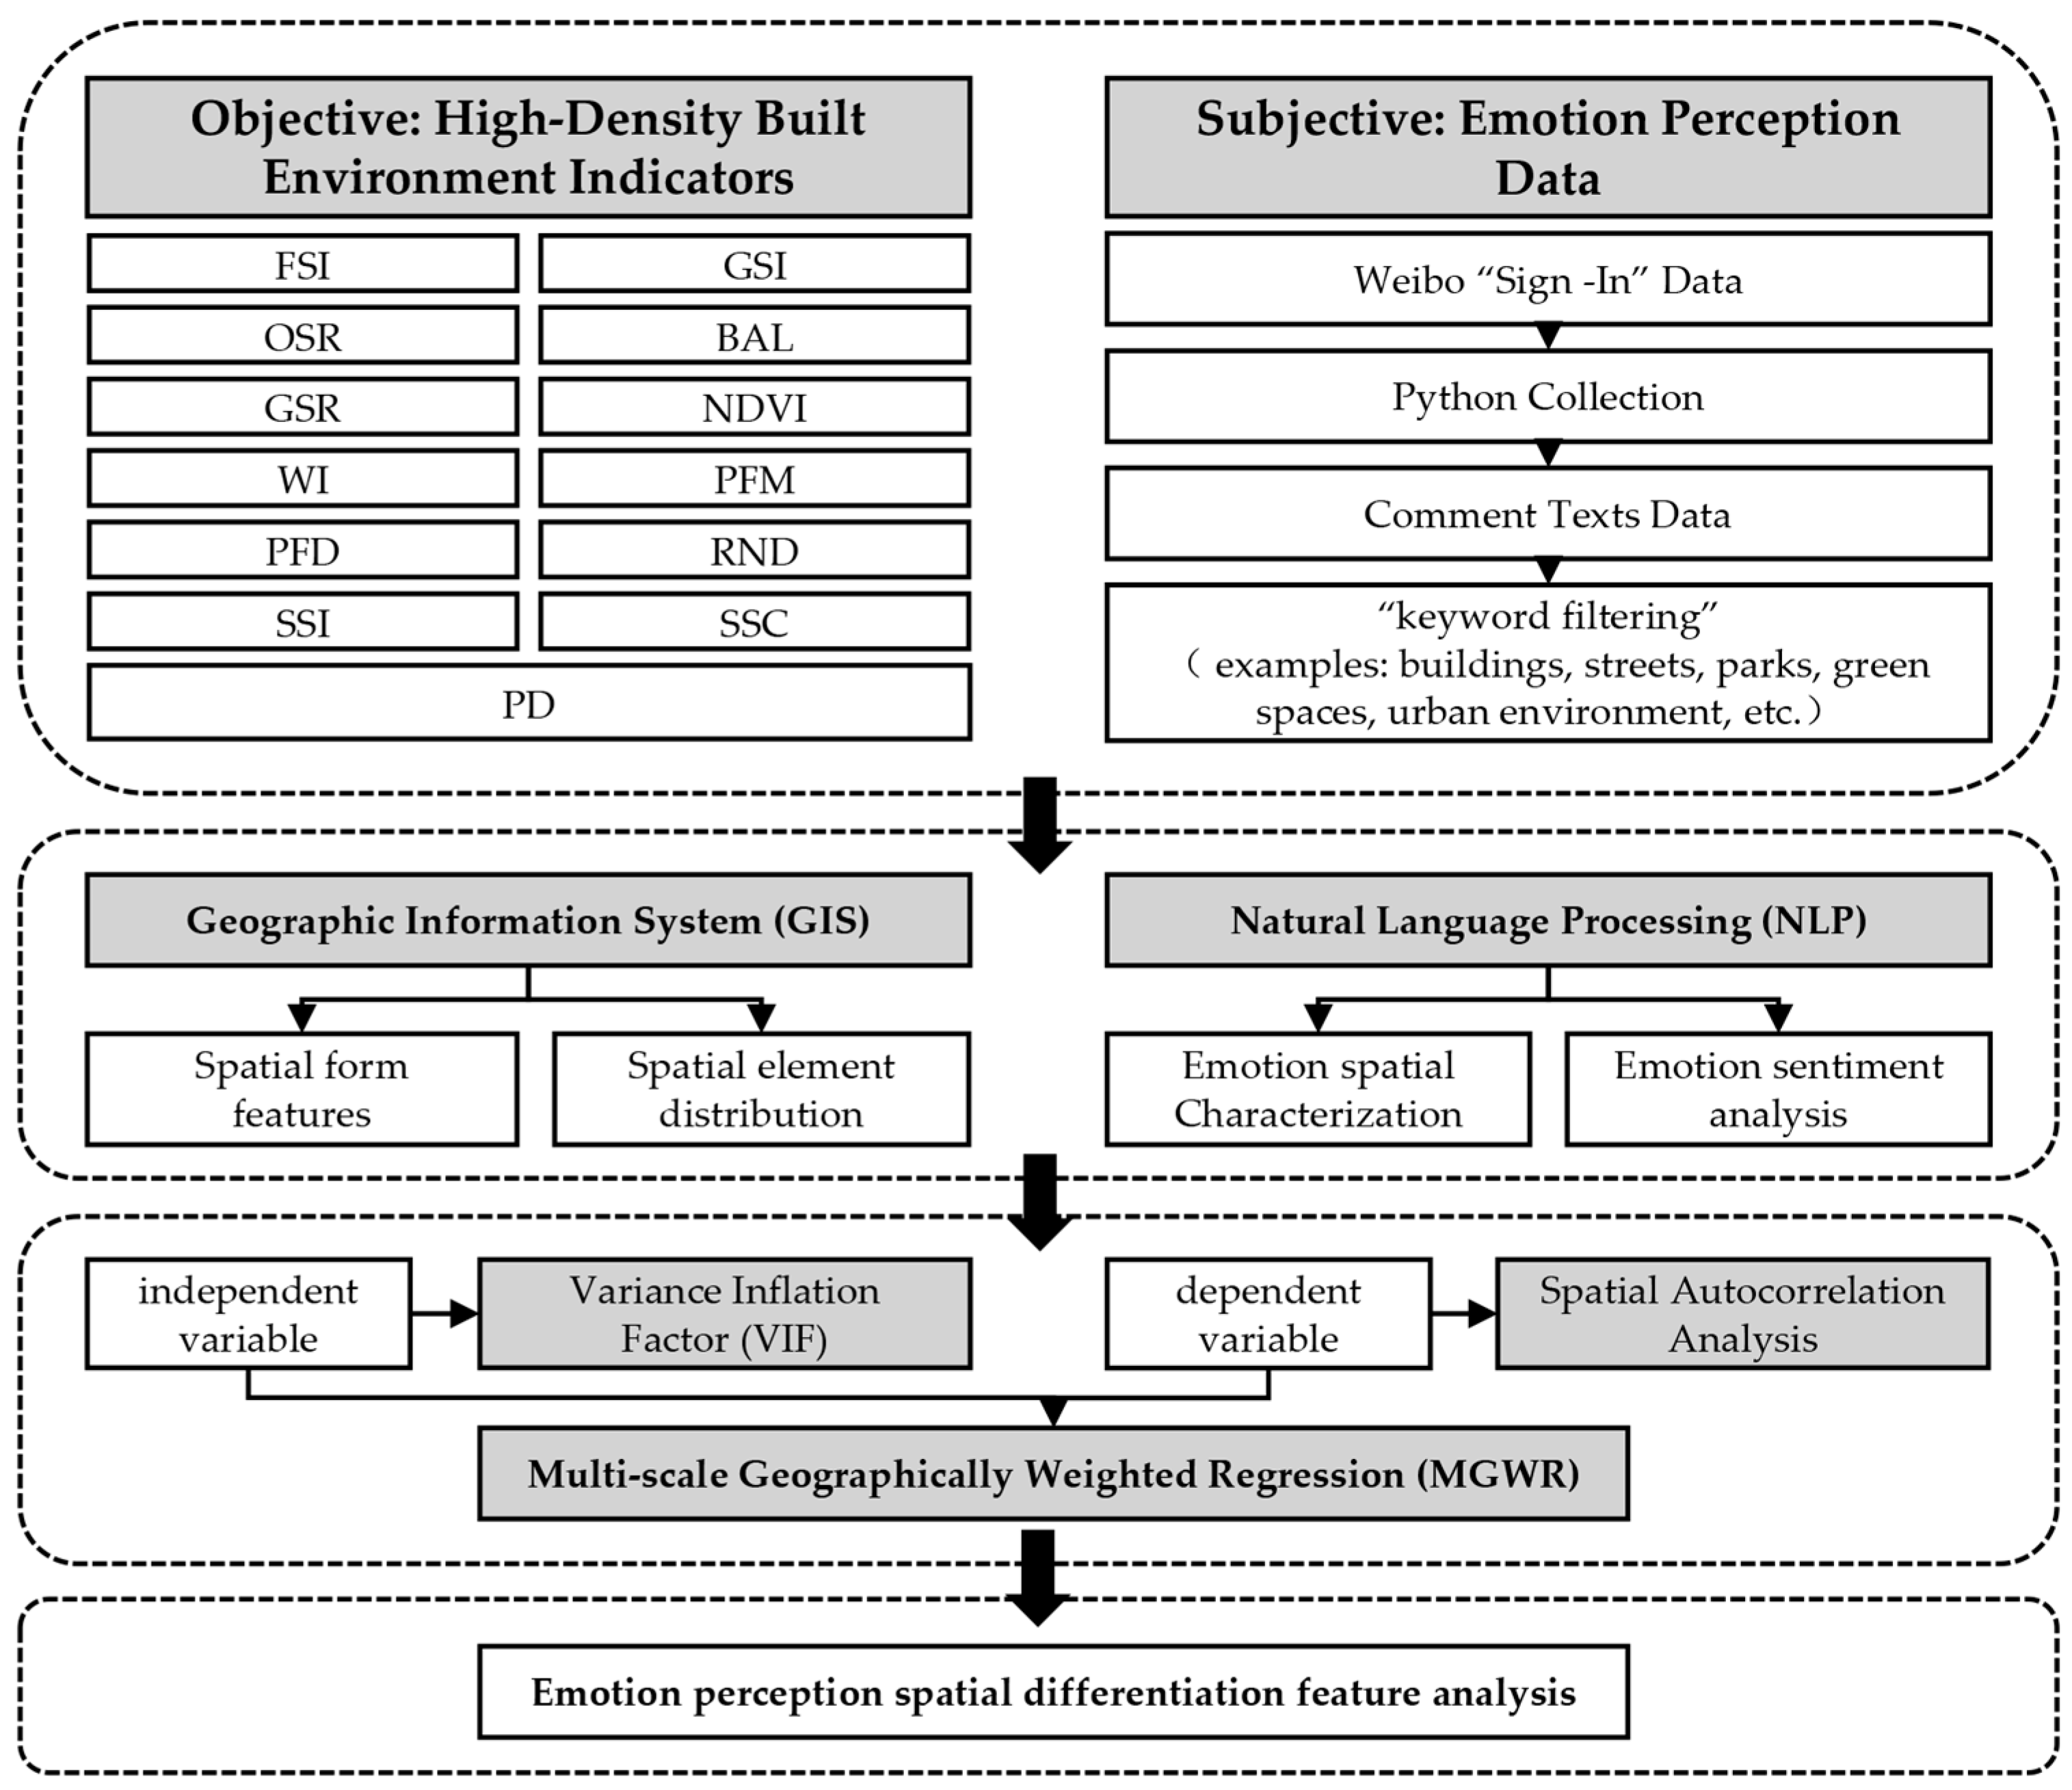
This study used GIS to analyze urban spatial environmental and population data. It was used to develop an indicator system for high-density built environments at the block level, validating multicollinearity. Additionally, utilizing NLP, this research examined SMD, evaluating subjective perceptions of the urban built environment through sentiment analysis of semantic expressions. Spatial autocorrelation analysis was then performed based on the spatial distribution characteristics of the study area. Subsequently, this study established the MGWR model, with objective high-density built environment indicators as independent variables and human emotional perception data as dependent variables. These variables were then subjected to regression analysis to investigate the spatial differentiation features of human emotional perception (Figure 2).
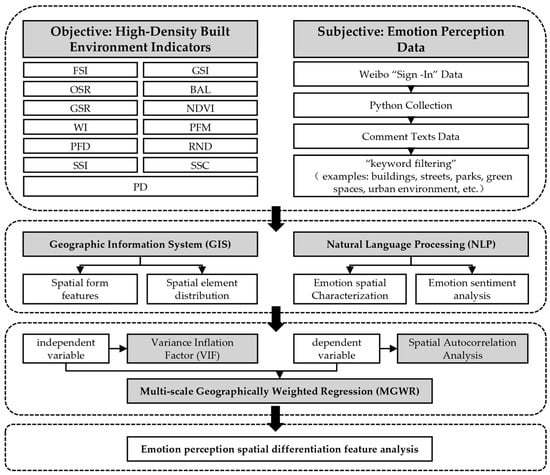
Figure 2.
Research frame.
2.4.2. Emotional Perception Classification
Natural Language Processing (NLP) is a field of artificial intelligence and computational linguistics that focuses on the interaction between computers and human language, which is used to extract meaning, sentiment, and context from the text. In the realm of emotion classification, the initial stages of research often simplify emotions into positive or negative categories for easier measurement. However, as studies have advanced, additional types of emotions have been incorporated. Drawing from existing literature on emotion classification [63] and data features [64], this study identified five main types of emotions: joy, affection, distress, anger, and disgust. Joy and affection are typically classified as positive emotions, whereas distress, anger, and disgust are categorized as negative emotions (Table 3). First, this research utilized a corpus dataset of 15,888 Weibo texts and applied the jieba library along with the Baidu stop word list to segment the texts, eliminating numerical values, English characters, and irrelevant terms. Subsequently, employing the TF-IDF model, the texts were transformed into vectors. The TfidfVectorizer function from the sklearn library was employed to convert each Weibo text into a TF-IDF vector. Following this, a subset of 1500 texts was randomly chosen from the corpus dataset at a rate of 10% and annotated based on their emotional content to establish a training set. A model for emotion classification was then developed using the random forest algorithm. The Random Forest Classifier function from the sklearn model was utilized to create the emotion classification model and predict the emotional categories of the remaining unannotated data [65]. Lastly, the ratio of individuals perceiving positive and negative emotions within each neighborhood in relation to the total Weibo statistical population of the neighborhood was calculated to determine the positive and negative emotion values of each neighborhood.
Table 3.
Example of Weibo emotion classification.
2.4.3. Spatial Autocorrelation Analysis
This study employed spatial autocorrelation to analyze the perception of positive and negative emotions separately in the population within block areas. Spatial autocorrelation was primarily applied to the distribution patterns of geographical elements, including both global and local spatial autocorrelation [66]. Using ArcGIS 10.8, this paper utilized Moran’s I to investigate the spatial autocorrelation of emotional perceptions in the population in the urban main area of Wuhan. Additionally, the Local Indicators of Spatial Association (LISA) was employed to explore the spatial clustering characteristics of emotional perceptions in the study area.
Global spatial autocorrelation analysis is commonly employed for spatial aggregation data analysis. Moran’s I is an indicator used to evaluate spatial autocorrelation, with values ranging from −1 to 1. Moran’s I closer to 1 indicates that spatial units are more clustered, suggesting an overall pattern of spatial aggregation and positive correlation. Conversely, Moran’s I closer to −1 indicates a more dispersed overall spatial distribution, suggesting a negative correlation. When the Moran’s I value is close to 0, the overall distribution is random, indicating no significant spatial influence. A significance level of p < 0.05 indicates the rejection of the null hypothesis, confirming the existence of spatial autocorrelation. The formula is given below:
where is the total number of study areas, and are the values of an attribute feature at areas and , respectively, is an element in spatial weight matrix that is used to denote the neighboring relationship of spatial regions at positions, is the mean of all attribute values, and is the sample variance.
Local spatial autocorrelation indicators can be used to measure the degree of the local spatial association between the center areas and the surrounding areas by examining the distribution pattern of individual entry attribute values in the heterogeneous space. LISA values were divided into four quadrants, including the High-High, Low-High, Low-Low, and High-Low. The formula is given below:
where and are the values normalized to areas and , respectively, is the spatial weight between features and , is the mean of the corresponding attribute, and is the sample variance.
2.4.4. Multi-Scale Geographically Weighted Regression (MGWR) Model
This study employs the Multi-scale Geographically Weighted Regression (MGWR) model, which is an optimized version of the Geographically Weighted Regression (GWR) model, to empirically analyze the human perception of the high-density built environment in the main urban area of Wuhan. Prior to establishing the model, it is necessary to validate the multicollinearity among the independent variables. Multicollinearity refers to a strong correlation between explanatory variables, which may interfere with the regression results and significance. Using ArcGIS 10.8 for the multicollinearity test of Urban Form, Green Environment, Urban Function, Transportation, and Population Density variables, the Variance Inflation Factor (VIF) was adopted as the screening indicator because it is a crucial metric for multicollinearity tests. Variables with VIF > 7.5 were excluded to reduce the impact of inter-variable correlation on the results. The formula is given below:
where represents the coefficient of determination for the th independent variable obtained from a regression model.
GWR is a spatial statistical technique used for exploring and modeling spatially varying relationships between a dependent variable and independent variables across different locations. GWR is particularly useful when the relationships between variables vary across space, violating the assumption of global stationarity in traditional regression models. The formula is given below:
where is the dependent variable for observation , and are location-specific coefficients, is the value of the jth independent variable for observation , is the error term, and represents the spatial coordinates of observation .
MGWR is primarily applied in studies related to soil pollution [67], the distribution of transportation facilities and travel behavior [68], urban built environment ventilation [26], block vitality assessment [35], etc. However, it has been rarely employed in studies related to emotional perception.
MGWR is an extension of GWR, allowing for the consideration of multiple scales or bandwidths in the estimation of spatial relationships. While GWR focuses on capturing spatially varying relationships at a single fixed bandwidth, MGWR introduces the concept of multiple bandwidths to accommodate variations in the spatial scale of relationships across the study area [69]. MGWR transforms GWR into a Generalized Additive Model (GAM) and utilizes a backfitting algorithm. Through an iterative process, it directly associates individual response variables with predictor variables [70]. The formula for MGWR is as follows:
where denotes the scale parameter for observation , and the remaining parts are the same as those described for GWR.
3. Results
3.1. Overview of Data Quantification
3.1.1. High-Density Built Environment
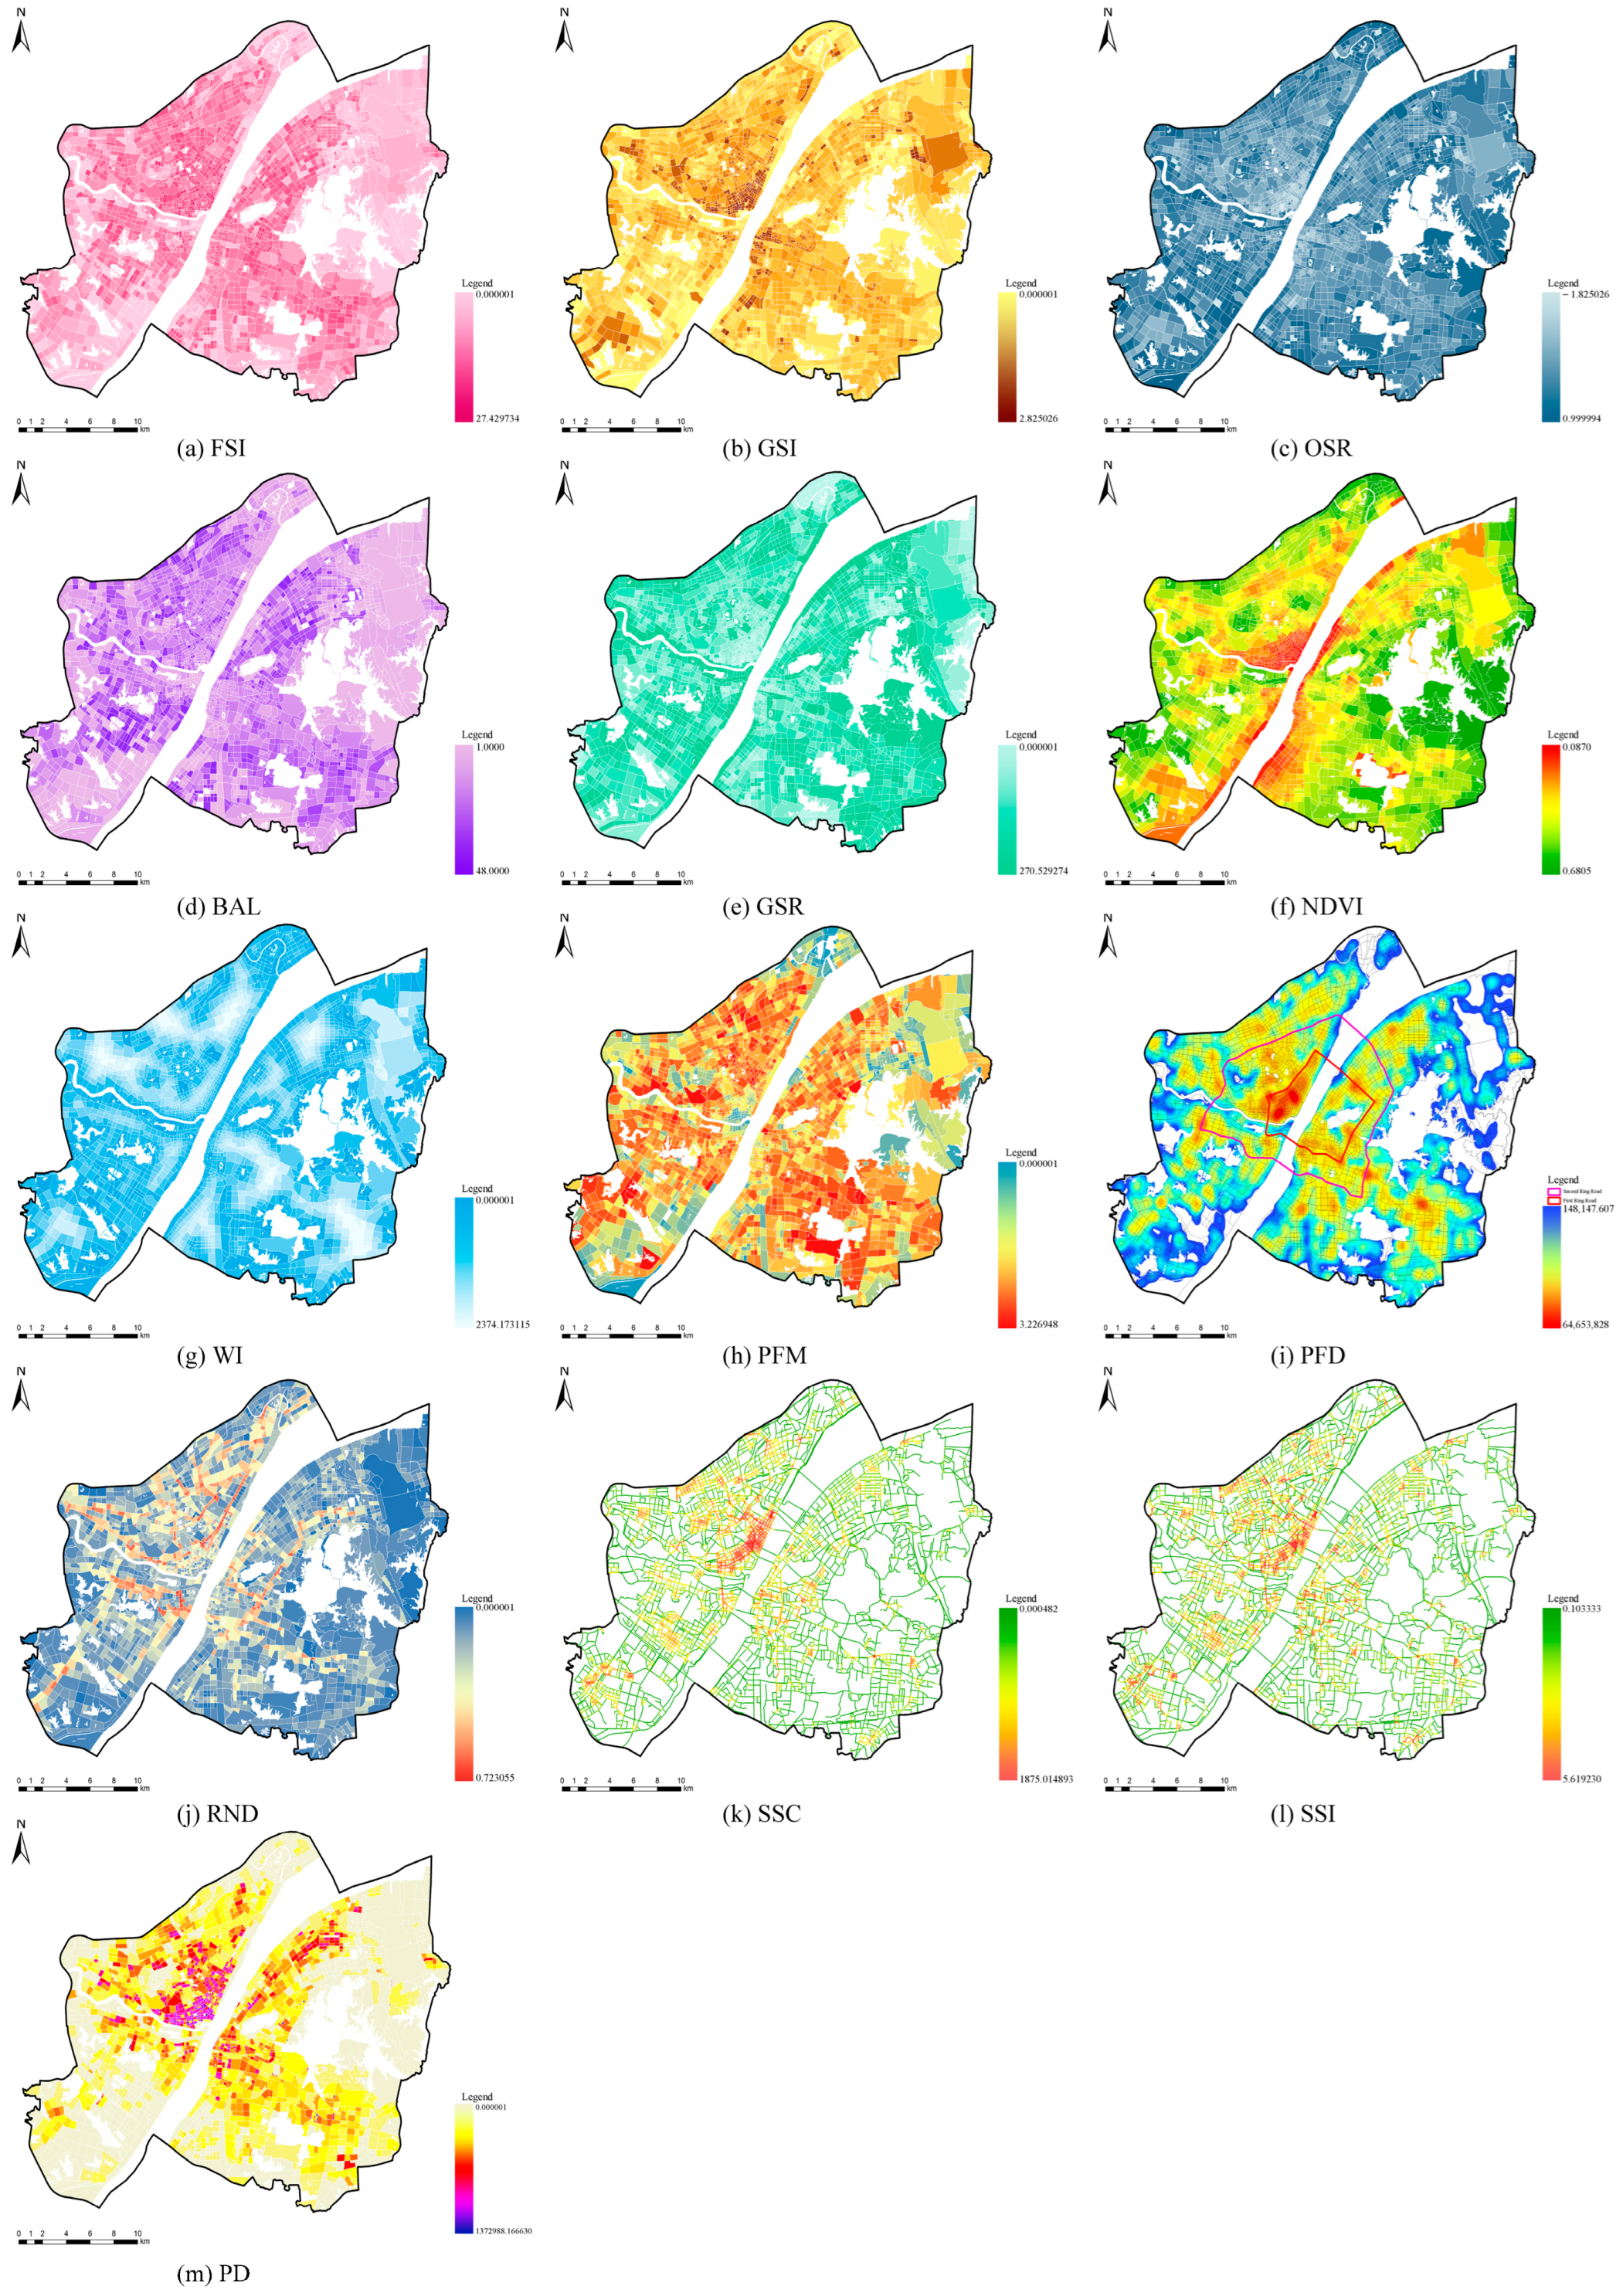
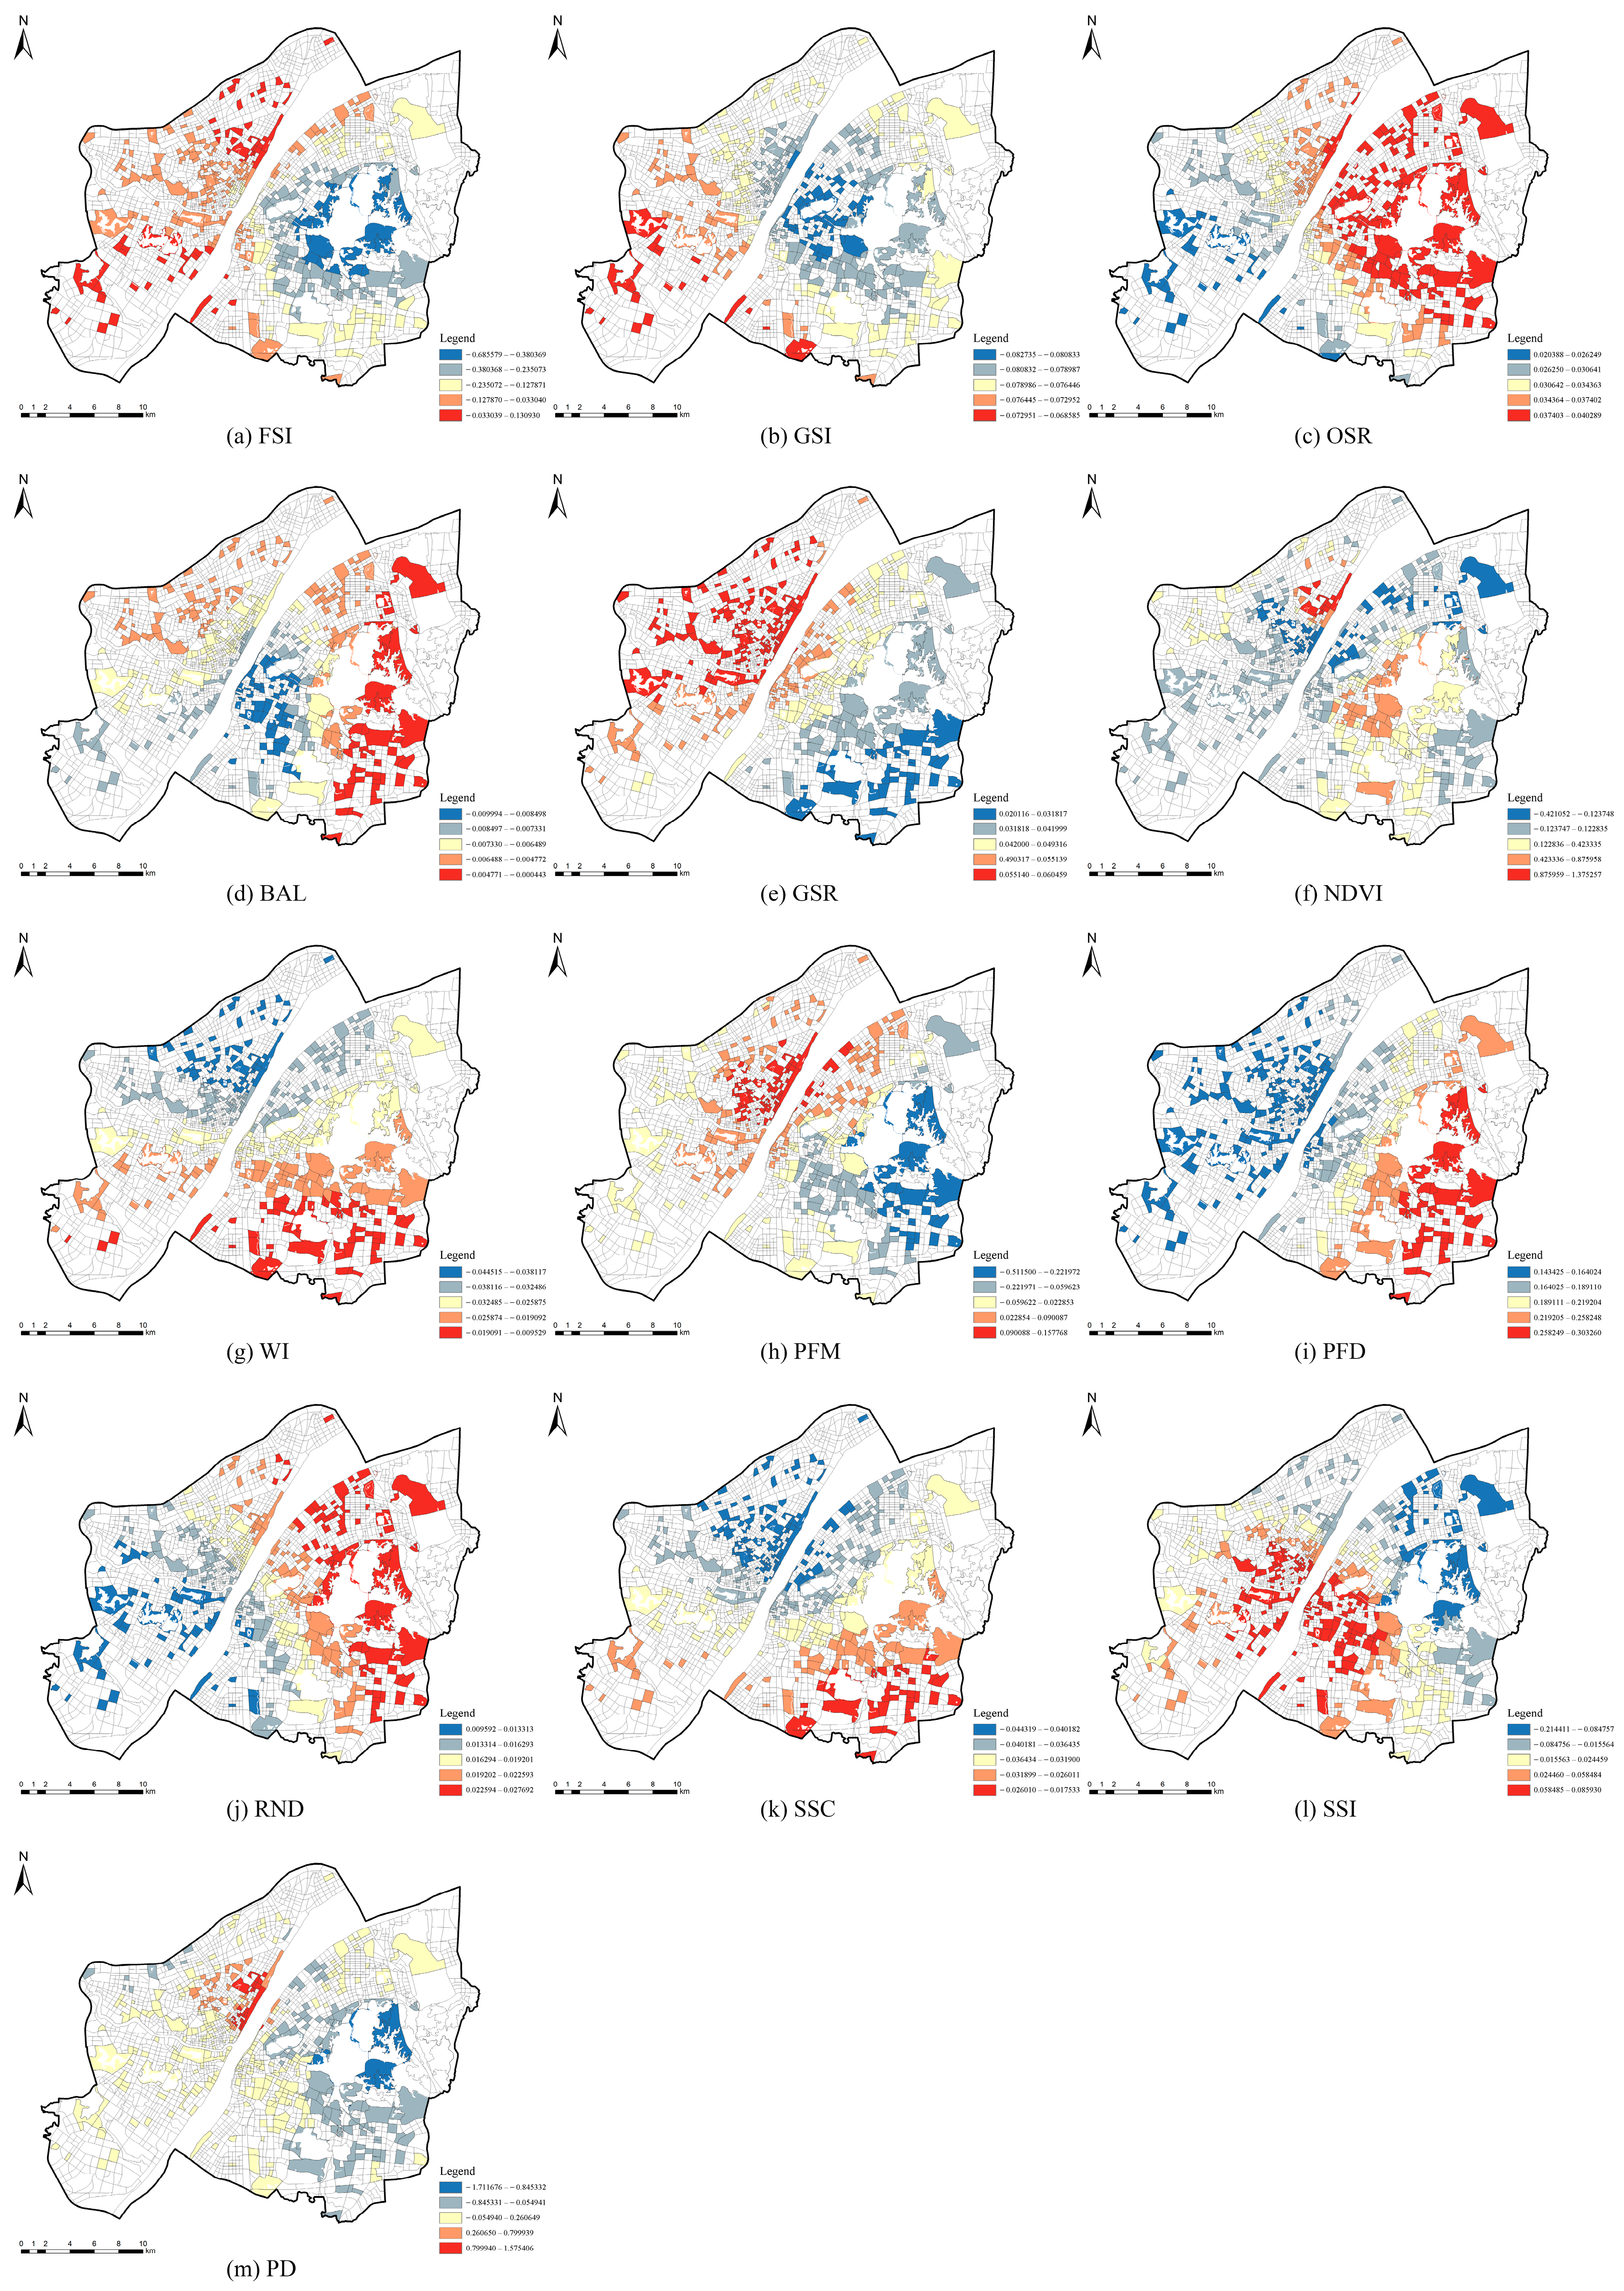
We conducted a quantitative analysis of the high-density built environment indicators in the main urban area of Wuhan and described the spatial distribution characteristics (Figure 3).

Figure 3.
Spatial distribution characteristic map of respective variables: (a) FSI, (b) GSI, (c) OSR, (d) BAL, (e) GSR, (f) NDVI, (g) WI, (h) PFM, (i) PFD, (j) RND, (k) SSC, (l) SSI, and (m) PD.
In terms of Urban Form indicators, the blocks with higher FSI were mainly distributed linearly along the banks of the Yangtze River and the city’s main roads, while areas with lower FSI, such as the Wugang Industrial Area, Nan’anzui Area, and East Lake Scenic Area, exhibited block and circular distributions (Figure 3a); GSI and OSR showed an inverse relationship. The Hankow Hanzheng Street and Wuchang Liangdao Street are historical areas in Wuhan. These areas had a higher GSI and a smaller OSR, exhibiting a certain fan-shaped feature (Figure 3b,c); blocks with higher BAL were mainly concentrated in residential areas, such as the Hanyang Sixin area, the Hankow Houhu area, the Wuchang South Lake area, Hongshan Yuanlin Road, and Guanggu Avenue area, and exhibited a concentric decreasing pattern around the rail transit stations (Figure 3d). In terms of Green Environment indicators, blocks with higher GSR were mainly distributed in the areas near mountains and waters, such as along the Yangtze River, Han River, East Lake, South Lake, Sha Lake, and other regions. In contrast to the GSI, the GSR was lower in the Hankow Hanzheng Street and Wuchang Liangdao Street areas (Figure 3e); blocks with higher NDVI were mainly distributed along the East Lake, which is primarily composed of natural scenic areas with less urban development. The NDVI was lower in the Hanzheng Street area, Wuchang Riverside area, and Baishazhou area (Figure 3f); the distribution of rivers and lakes in Wuhan was dense, with most blocks having a higher WI. However, the WI was lower in the Zhongnan Road area of Wuchang, the Guanggu Business District area, Renhe Road area, and the Houhu area of Hankou, as well as the Gutian Road area and Changgang Road area (Figure 3g). In terms of Urban Function indicators, blocks with high PFM were mostly located near water, mainly distributed in the southern area of South Lake, the northern area of the Han River, and the Sanjiao Lake area (Figure 3h); kernel density revealed that blocks with high PFD were concentrated within the Second Ring Road, particularly in the historical area of Hankow (Figure 3i). In terms of Transportation indicators, the blocks with higher RND were located along Liberation Avenue in Hankow, Zhongbei Road in Wuchang, and Yingwu Avenue in Hanyang (Figure 3j). According to the calculations of the integration and choice degrees based on Space Syntax within a radius of 500 m, the distribution showed some similarities. Specifically, the highest indicators were found within the region enclosed by Jianghan Avenue, Wuhan Avenue, Liberation Avenue, and Wusheng Road (Figure 3k,l). Blocks with higher PD were mainly concentrated at the intersection of the Yangtze River and the Han River, which marks the origin of urban development in Wuhan (Figure 3m).
3.1.2. Spatial Characterization of Emotional Perception
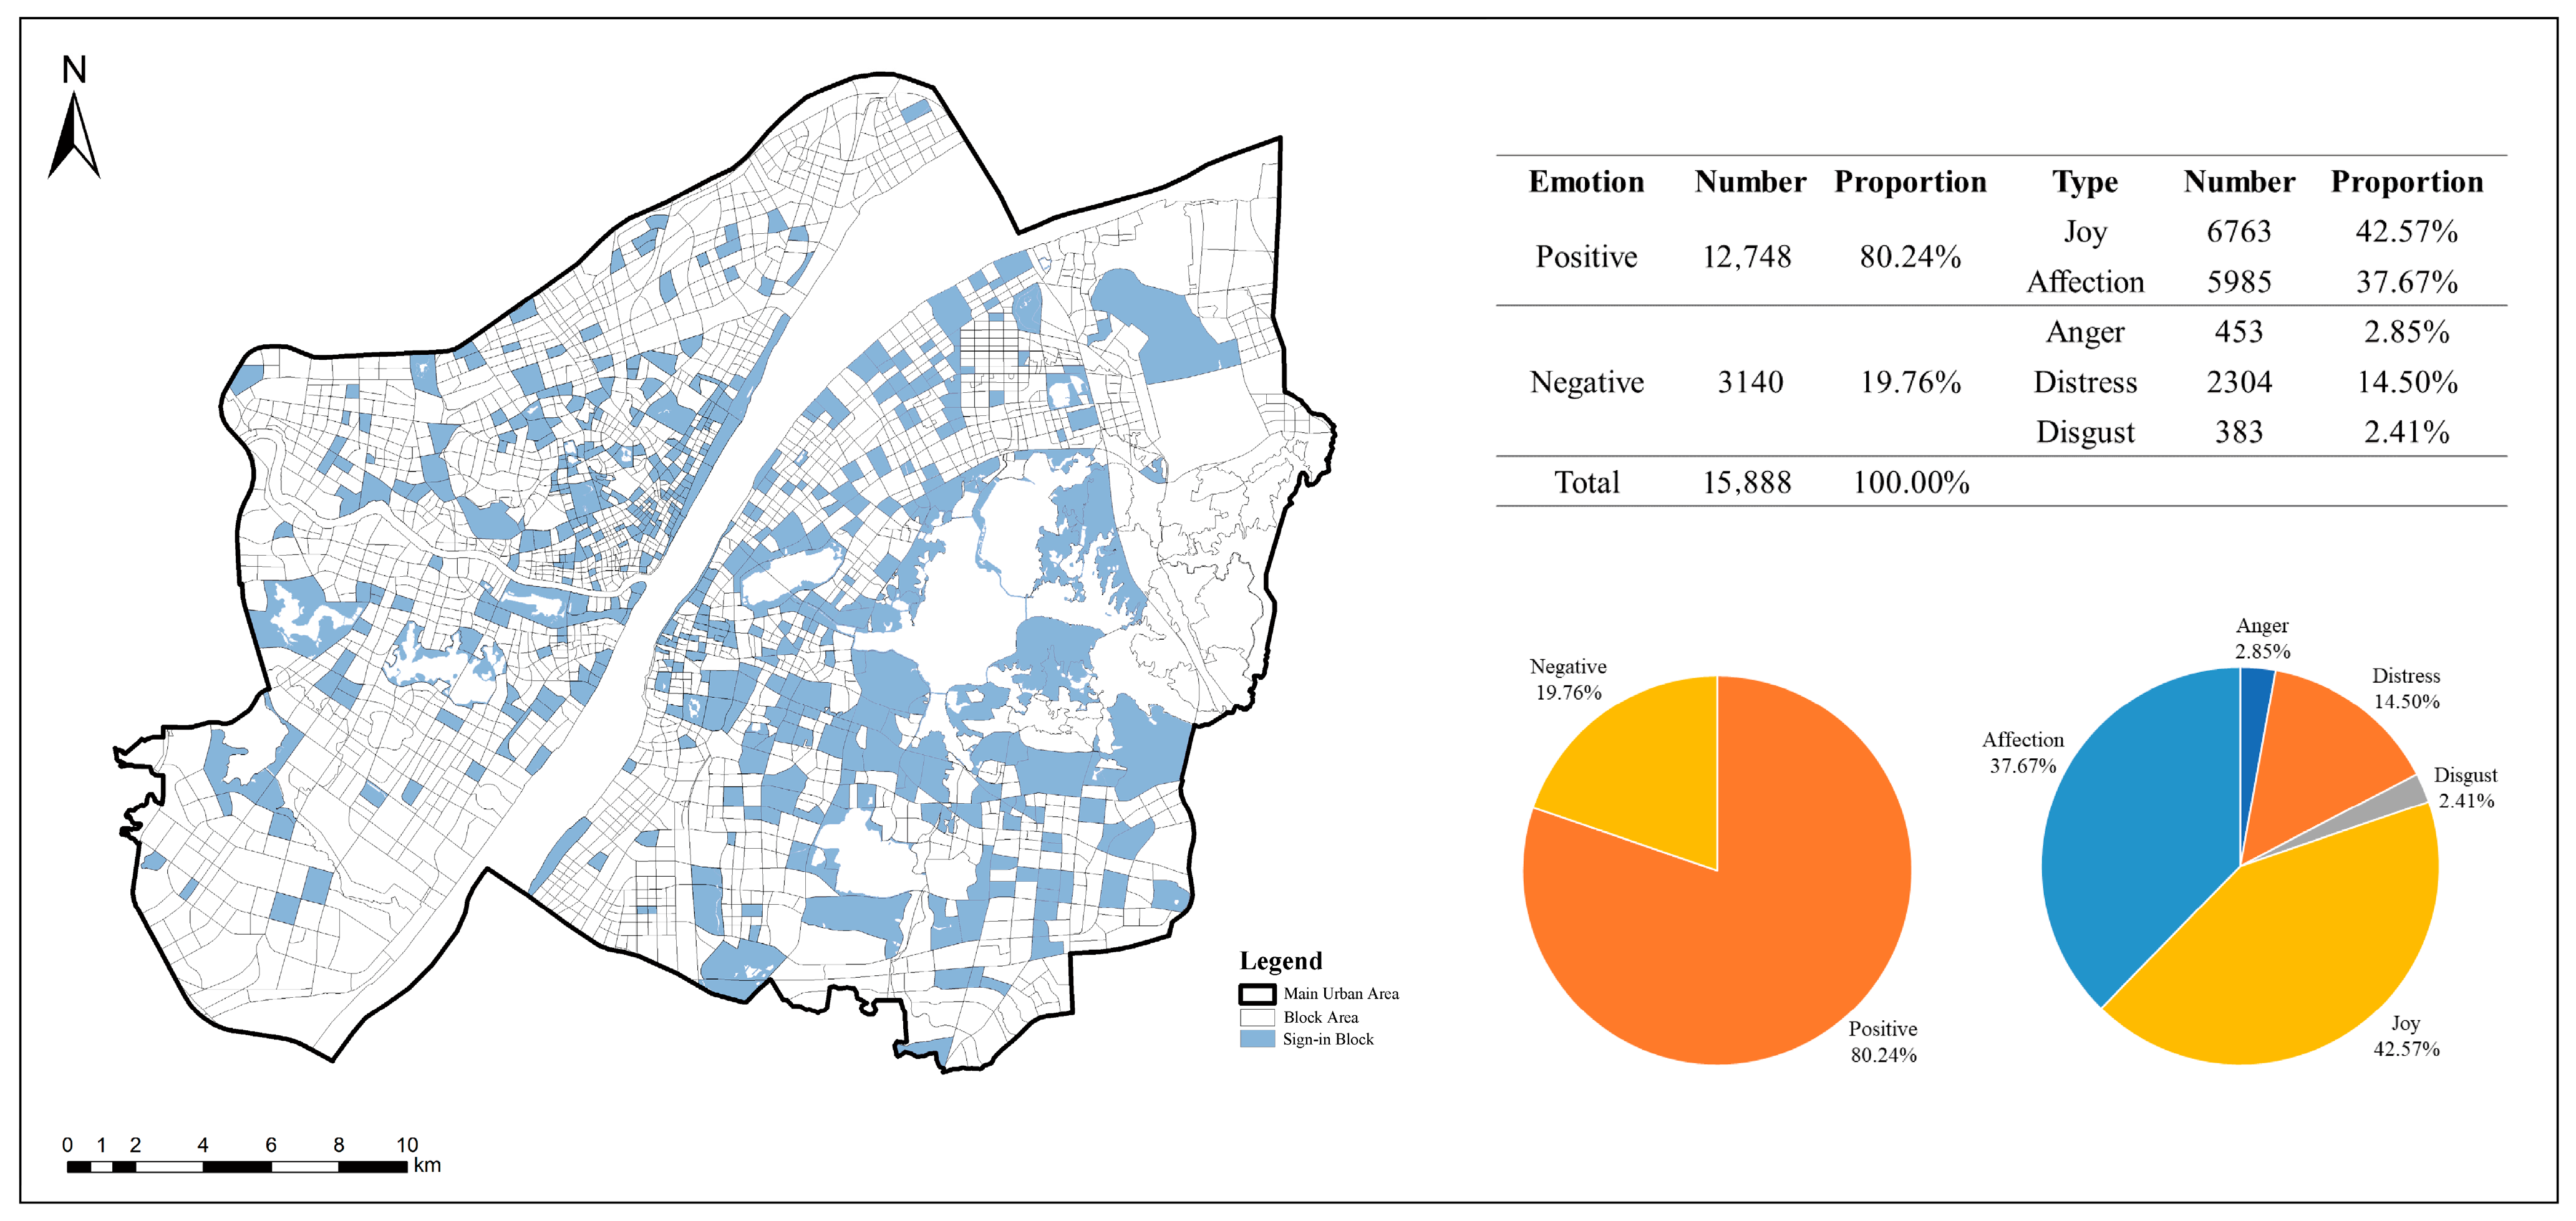
Our research findings indicate that, among a total of 2665 blocks, the dataset contained 15,888 emotion-tagged sign-in data with POI information distributed across 526 blocks (Figure 4). Within these blocks, 486 were linked to positive emotions, while 168 were linked to negative emotions. The analysis of emotion types revealed that 12,748 instances of sign-in data were associated with positive emotions, representing 80.24% of the dataset. Specifically, there were 6763 instances of joy (42.57%) and 5985 instances of affection (37.67%). Conversely, there were 3140 instances of sign-in data linked to negative emotions, making up 19.76% of the total dataset. Within this category, there were 453 instances of anger (2.85%), 2304 instances of distress (14.5%), and 383 instances of disgust (2.41%).

Figure 4.
Emotion sign-in map in block and data statistics.
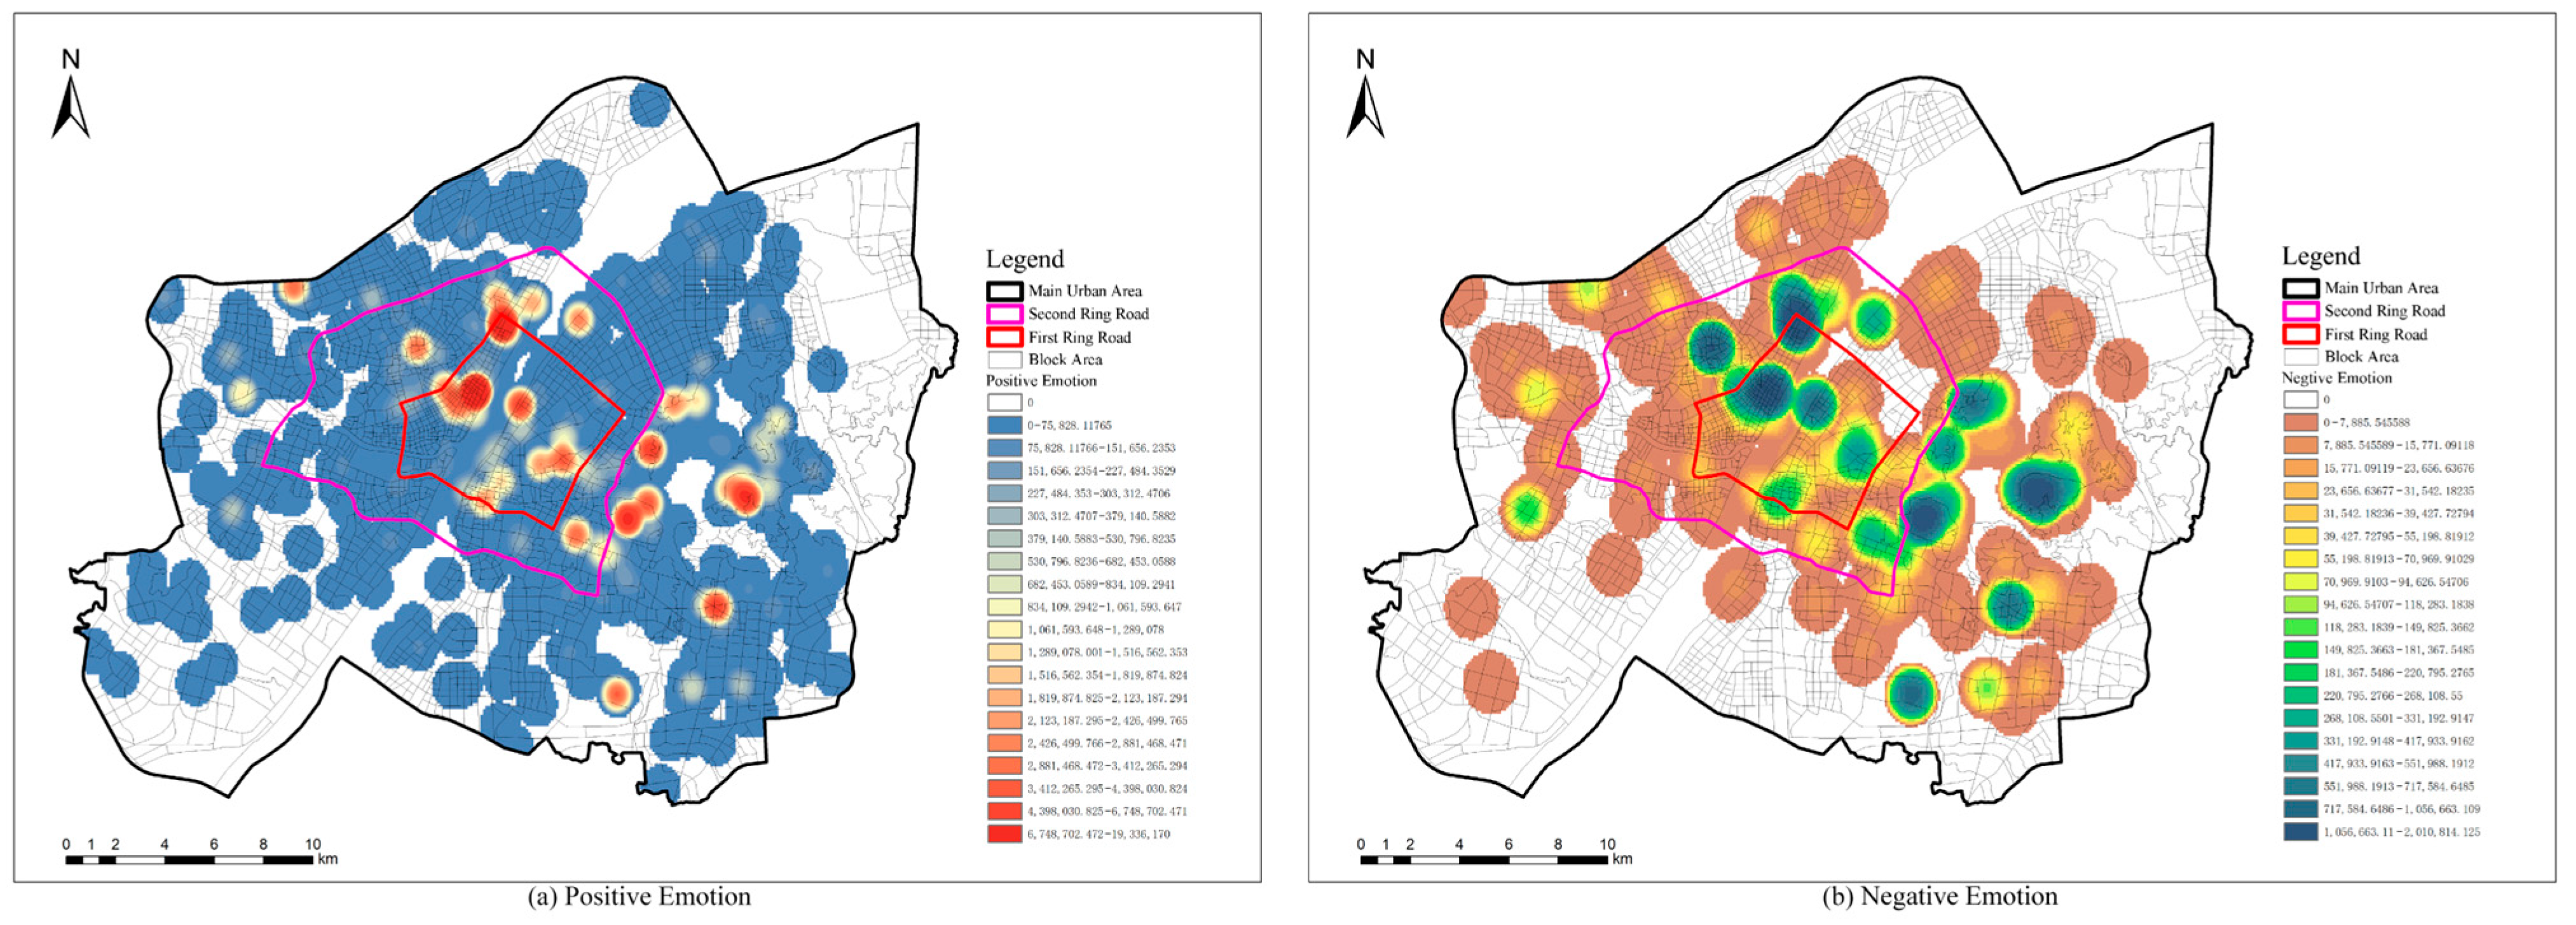
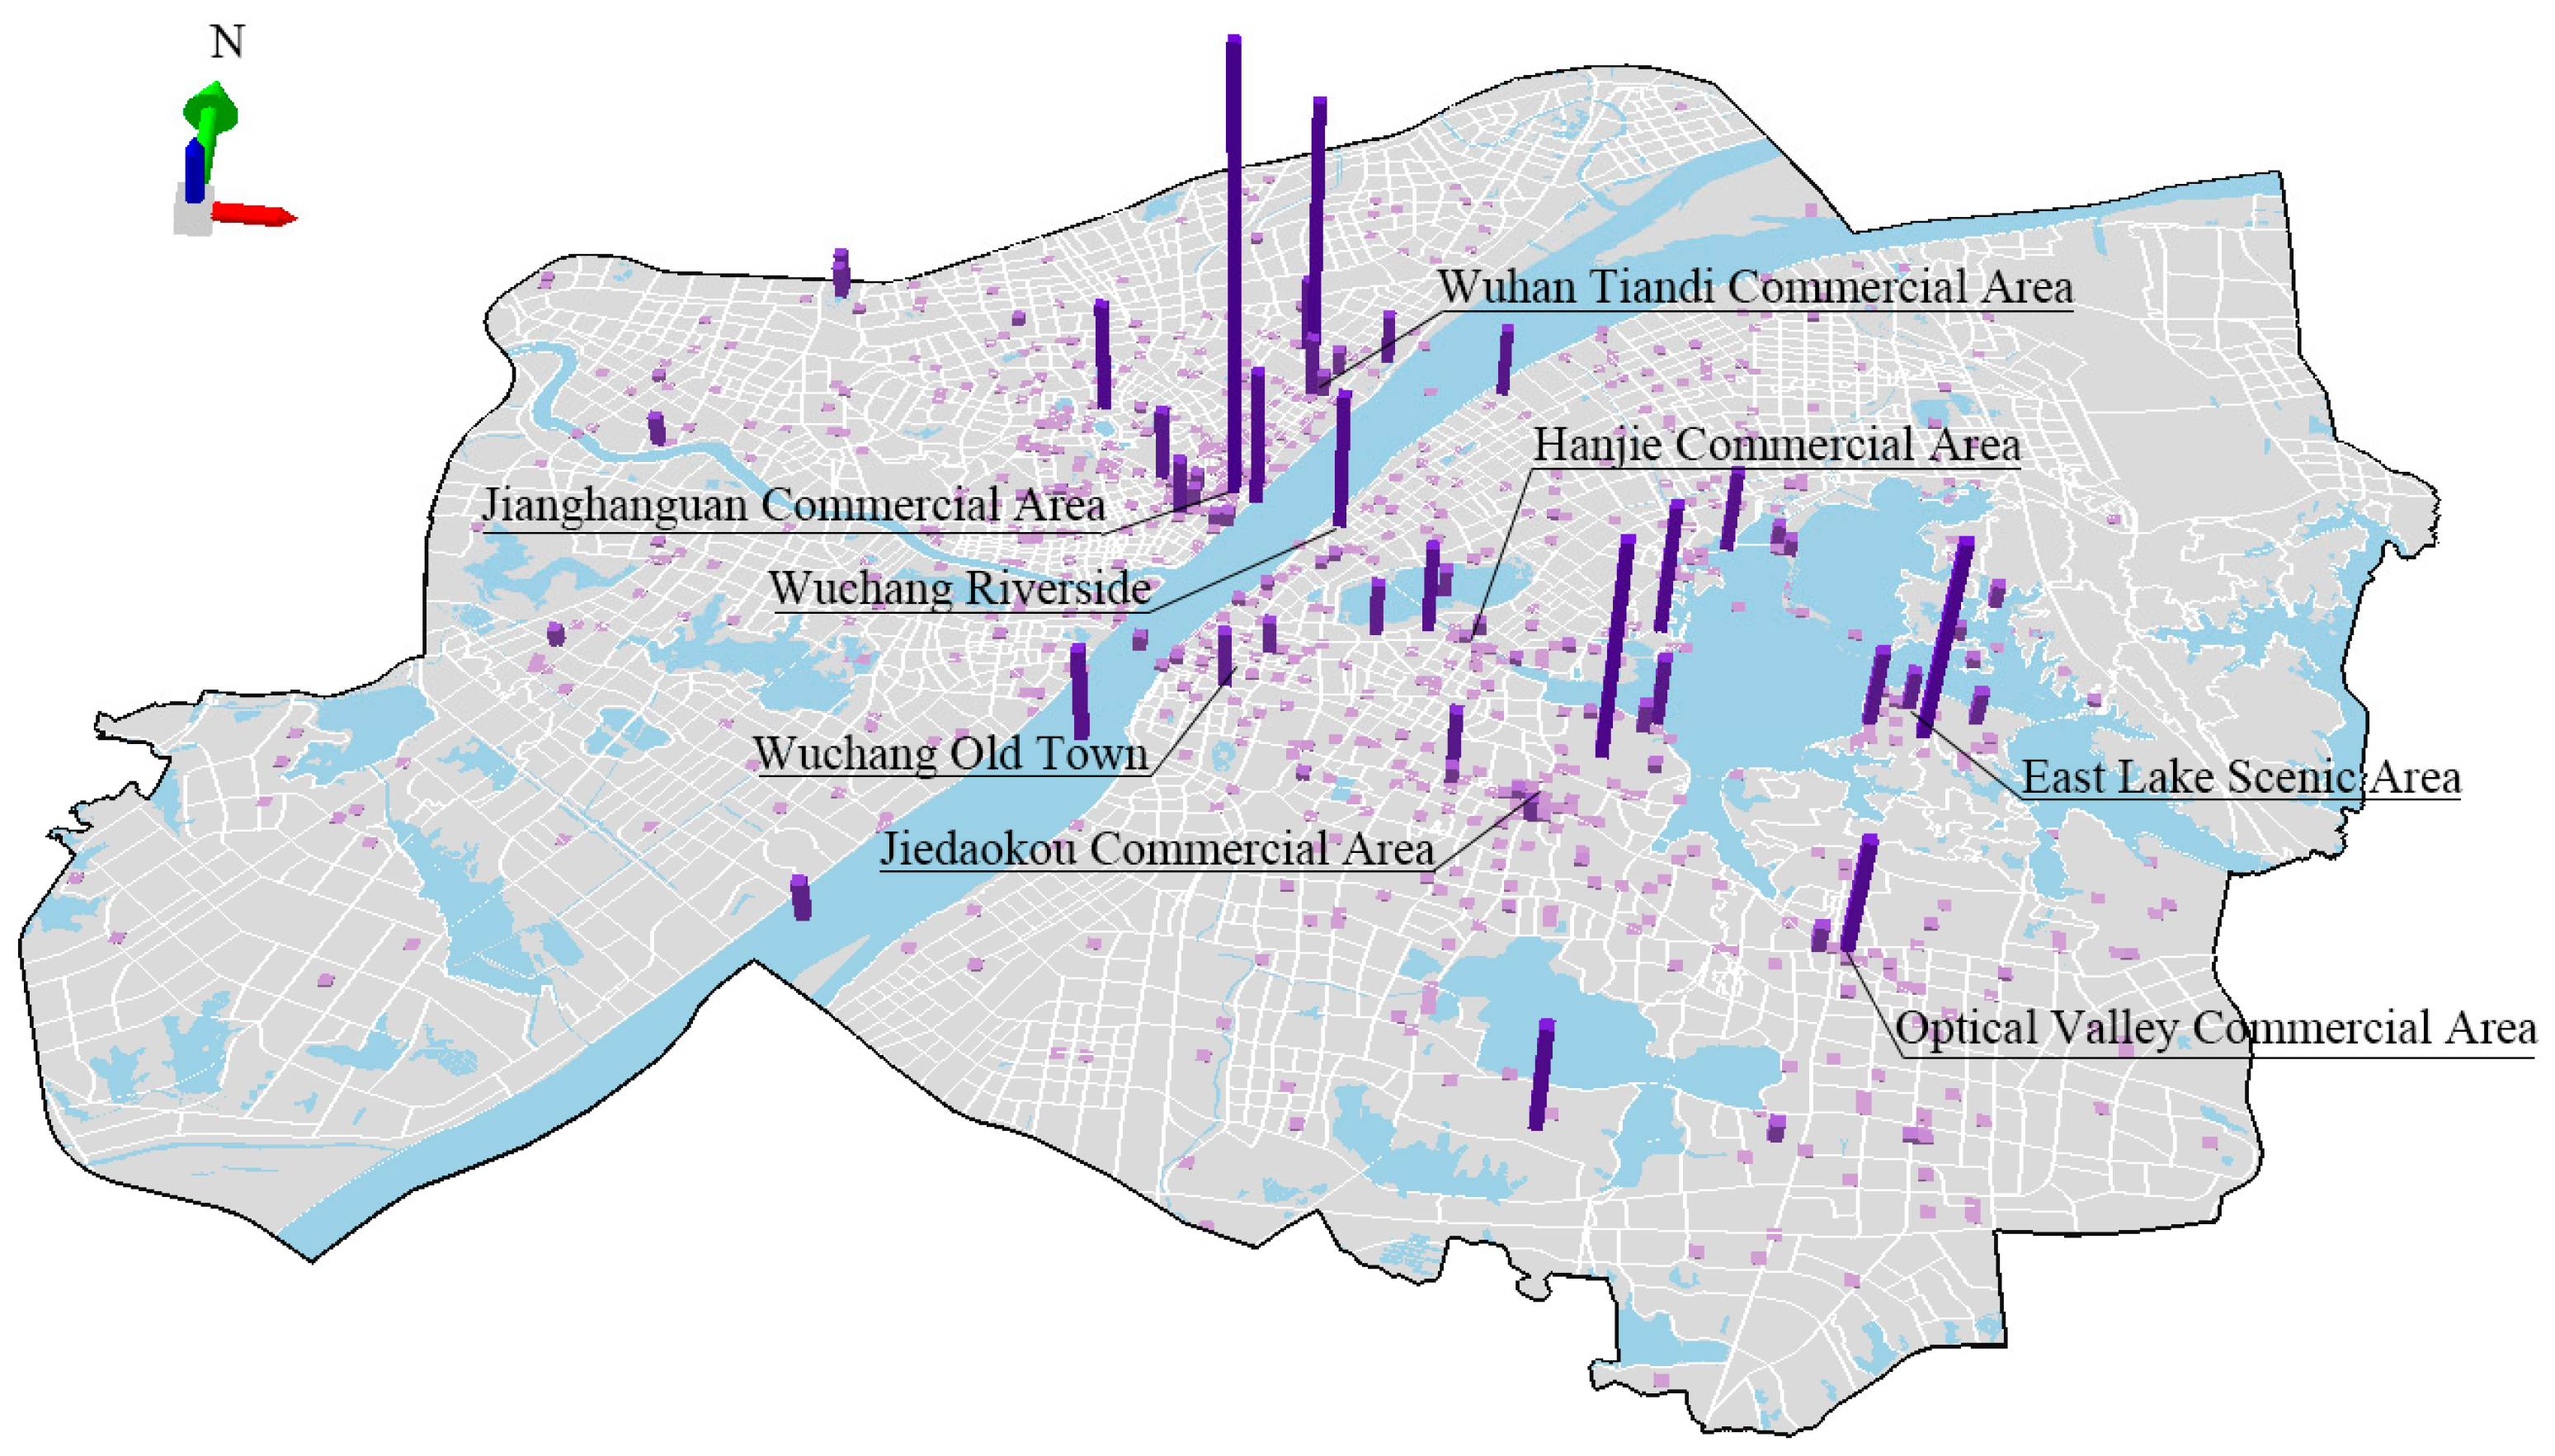
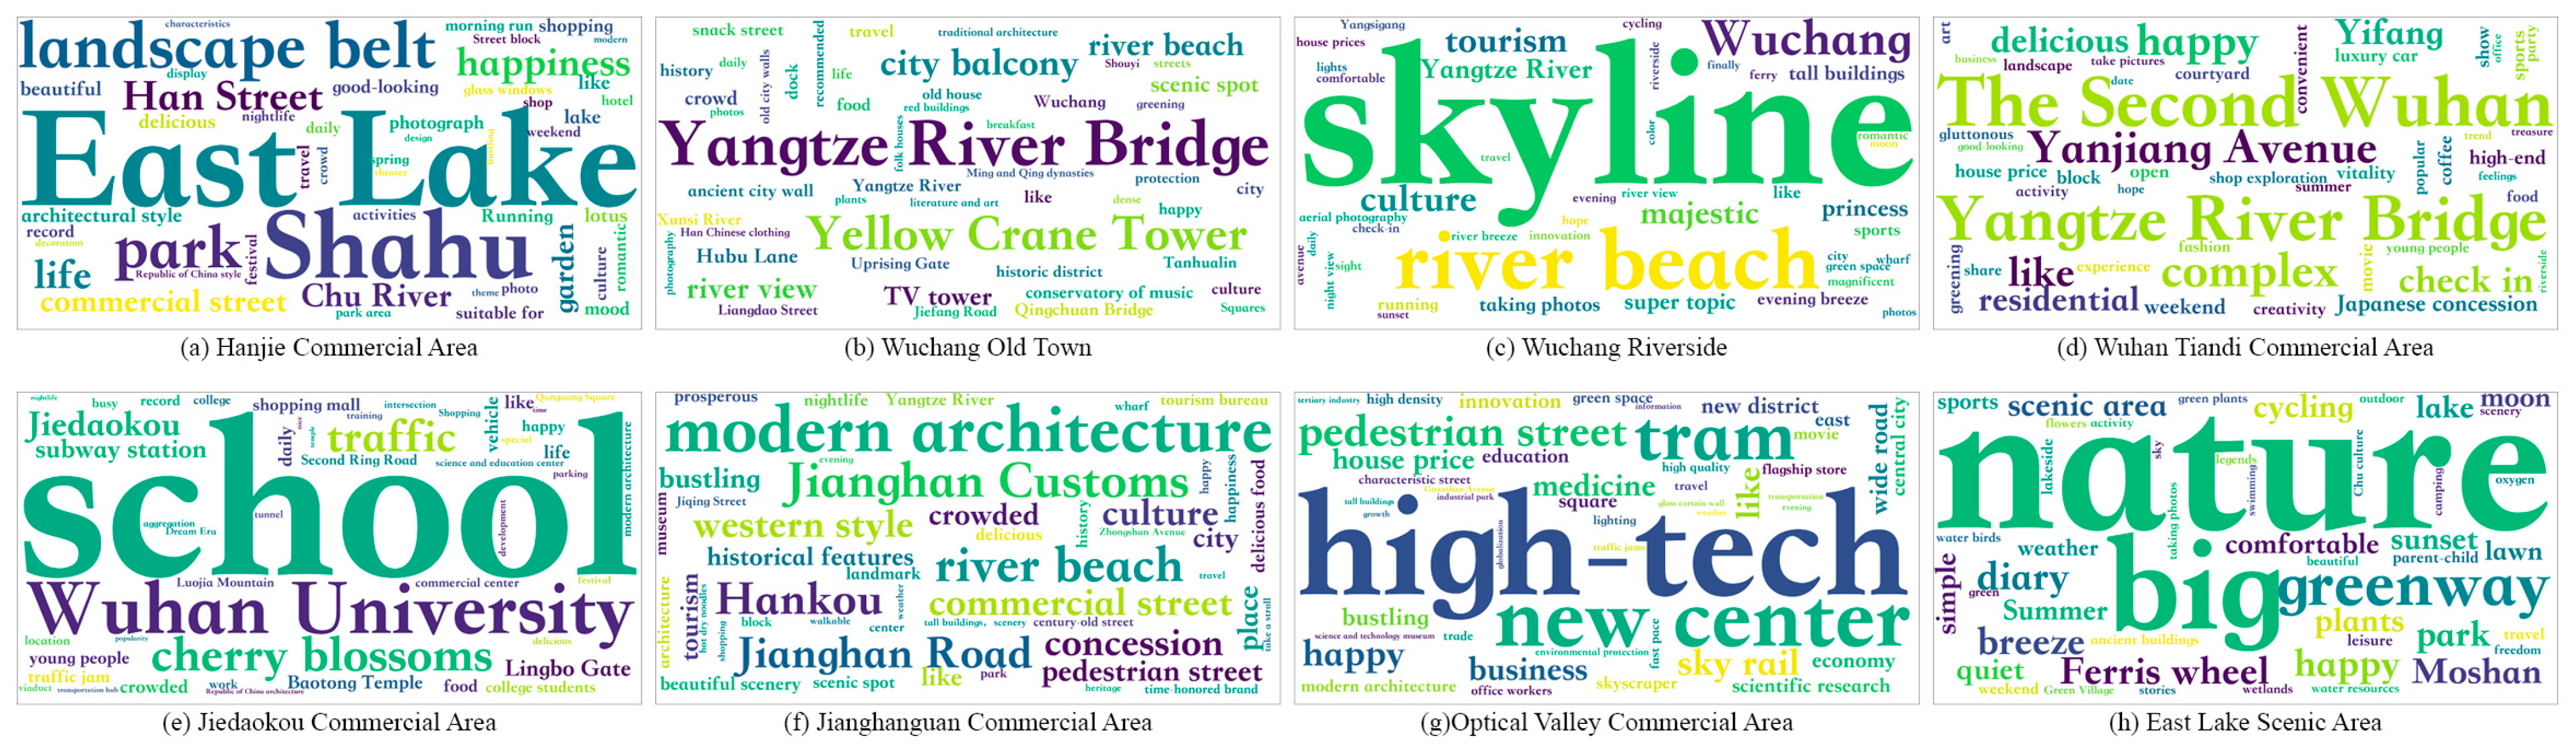
According to the sign-in data with the spatial information in GIS, a kernel density map was generated to further analyze the spatial distribution structure of human emotional perception (Figure 5). Overall, the spatial distribution of emotion-tagged POIs showed a scattered pattern within the Second Ring Road and the East Lake surrounding area, without distinct boundaries or path features. The POIs were primarily concentrated in the old town, commercial districts, natural scenic areas, and university campuses. A three-dimensional heatmap was created based on the frequency of sign-in at the POIs. By sorting the sign-in frequency of emotion-tagged POIs and grouping them based on similar locations, it was discovered that Jianghanguan Commercial Area, Wuhan Tiandi Commercial Area, East Lake Scenic Area, Jiedaokou Commercial Area, Optics Valley Commercial Area, Wuchang Riverside, Hanjie Commercial Area, and Wuchang Old Town were the high-frequency sign-in areas (Figure 6), It is worth noting that the amount of sign-in data in Jianghanguan Commercial Area were significantly higher than other regions. This area is a renowned tourist attraction in Wuhan, attracting a large number of visitors who leave location-tagged comments to show their presence. Therefore, this region had the most significant impact on spatial data, potentially leading to a certain bias in the perception of emotions.

Figure 5.
Emotion kernel density map: (a) Positive emotion and (b) negative emotion.
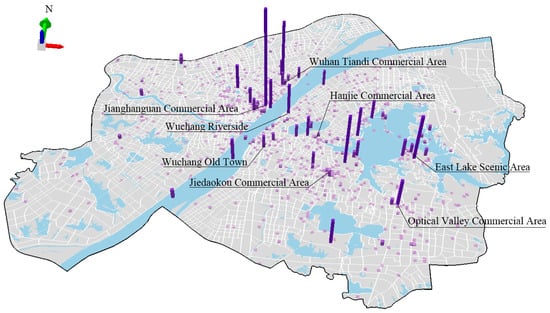
Figure 6.
Sign-in POI three-dimensional heat map.
In order to gain further insights into the specific opinions of the eight high-frequency sign-in areas, it is necessary to analyze the semantics of the sign-in texts to extract typical user opinions. Based on the similarity of comment viewpoints and their relevance to spatial elements, clustering was performed to group the opinions of each activity space, and a word cloud was generated (Figure 7). The results indicate that users generally have positive impressions of various regions in Wuhan, resulting in similar comment viewpoints for each type of activity space. Specifically, users showed a high level of appreciation for natural environments such as the East Lake Scenic Area and Wuchang Riverside, with predominantly positive comments. The typical opinions of historical and cultural districts like Wuchang Old Town and Jianghanguan Commercial Area highlight the vibrant street atmosphere and high-density street network, which can lead to a sense of congestion. Wuhan Tiandi Commercial Area and Hanjie Commercial Area, as commercial districts, received comments mostly related to shopping, with a diverse range of commercial spaces that bring a sense of enjoyment, although the high-density environment can feel slightly overwhelming. For the Optics Valley Commercial Aera, which is further from the city center, comments often mentioned a liking for its “high-tech” atmosphere, convenient transportation, and high-rises. Opinions about the Jiedaokou Commercial Area, which is near universities, were generally positive.

Figure 7.
Word Cloud of comments in the hot spots: (a) Hanjie Commercial Area, (b) Wuchang Old Town, (c) Wuchang Riverside, (d) Wuhan Tiandi Commercial Area, (e) Jiedaokou Commercial Area, (f) Jianghanguan Commercial Area, (g) Optical Valley Commercial Area, and (h) East Lake Scenic Area.
3.2. Regression Model Results
3.2.1. Spatial Clustering Features of Emotional Perception
The results reveal that Moran’s Index for the positive emotion indicator in the main urban areas of Wuhan was 0.009, with a z-score of 3.062 and a p-value of 0.002, demonstrating a significant level of 0.01. This suggests a spatial positive correlation among the positive emotion indicators at the block level (Figure 8a). On the other hand, Moran’s Index for the negative emotion indicator was 0.004, with a z-score of 1.396 and a p-value of 0.163, indicating that the distribution of negative emotions at the block level is random (Figure 8b). Therefore, this study focuses solely on investigating the relationship between positive emotions and high-density built environments.
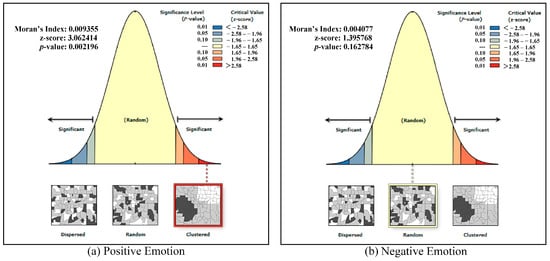
Figure 8.
Results of global spatial autocorrelation analysis: (a) Positive Emotion and (b) negative emotion.
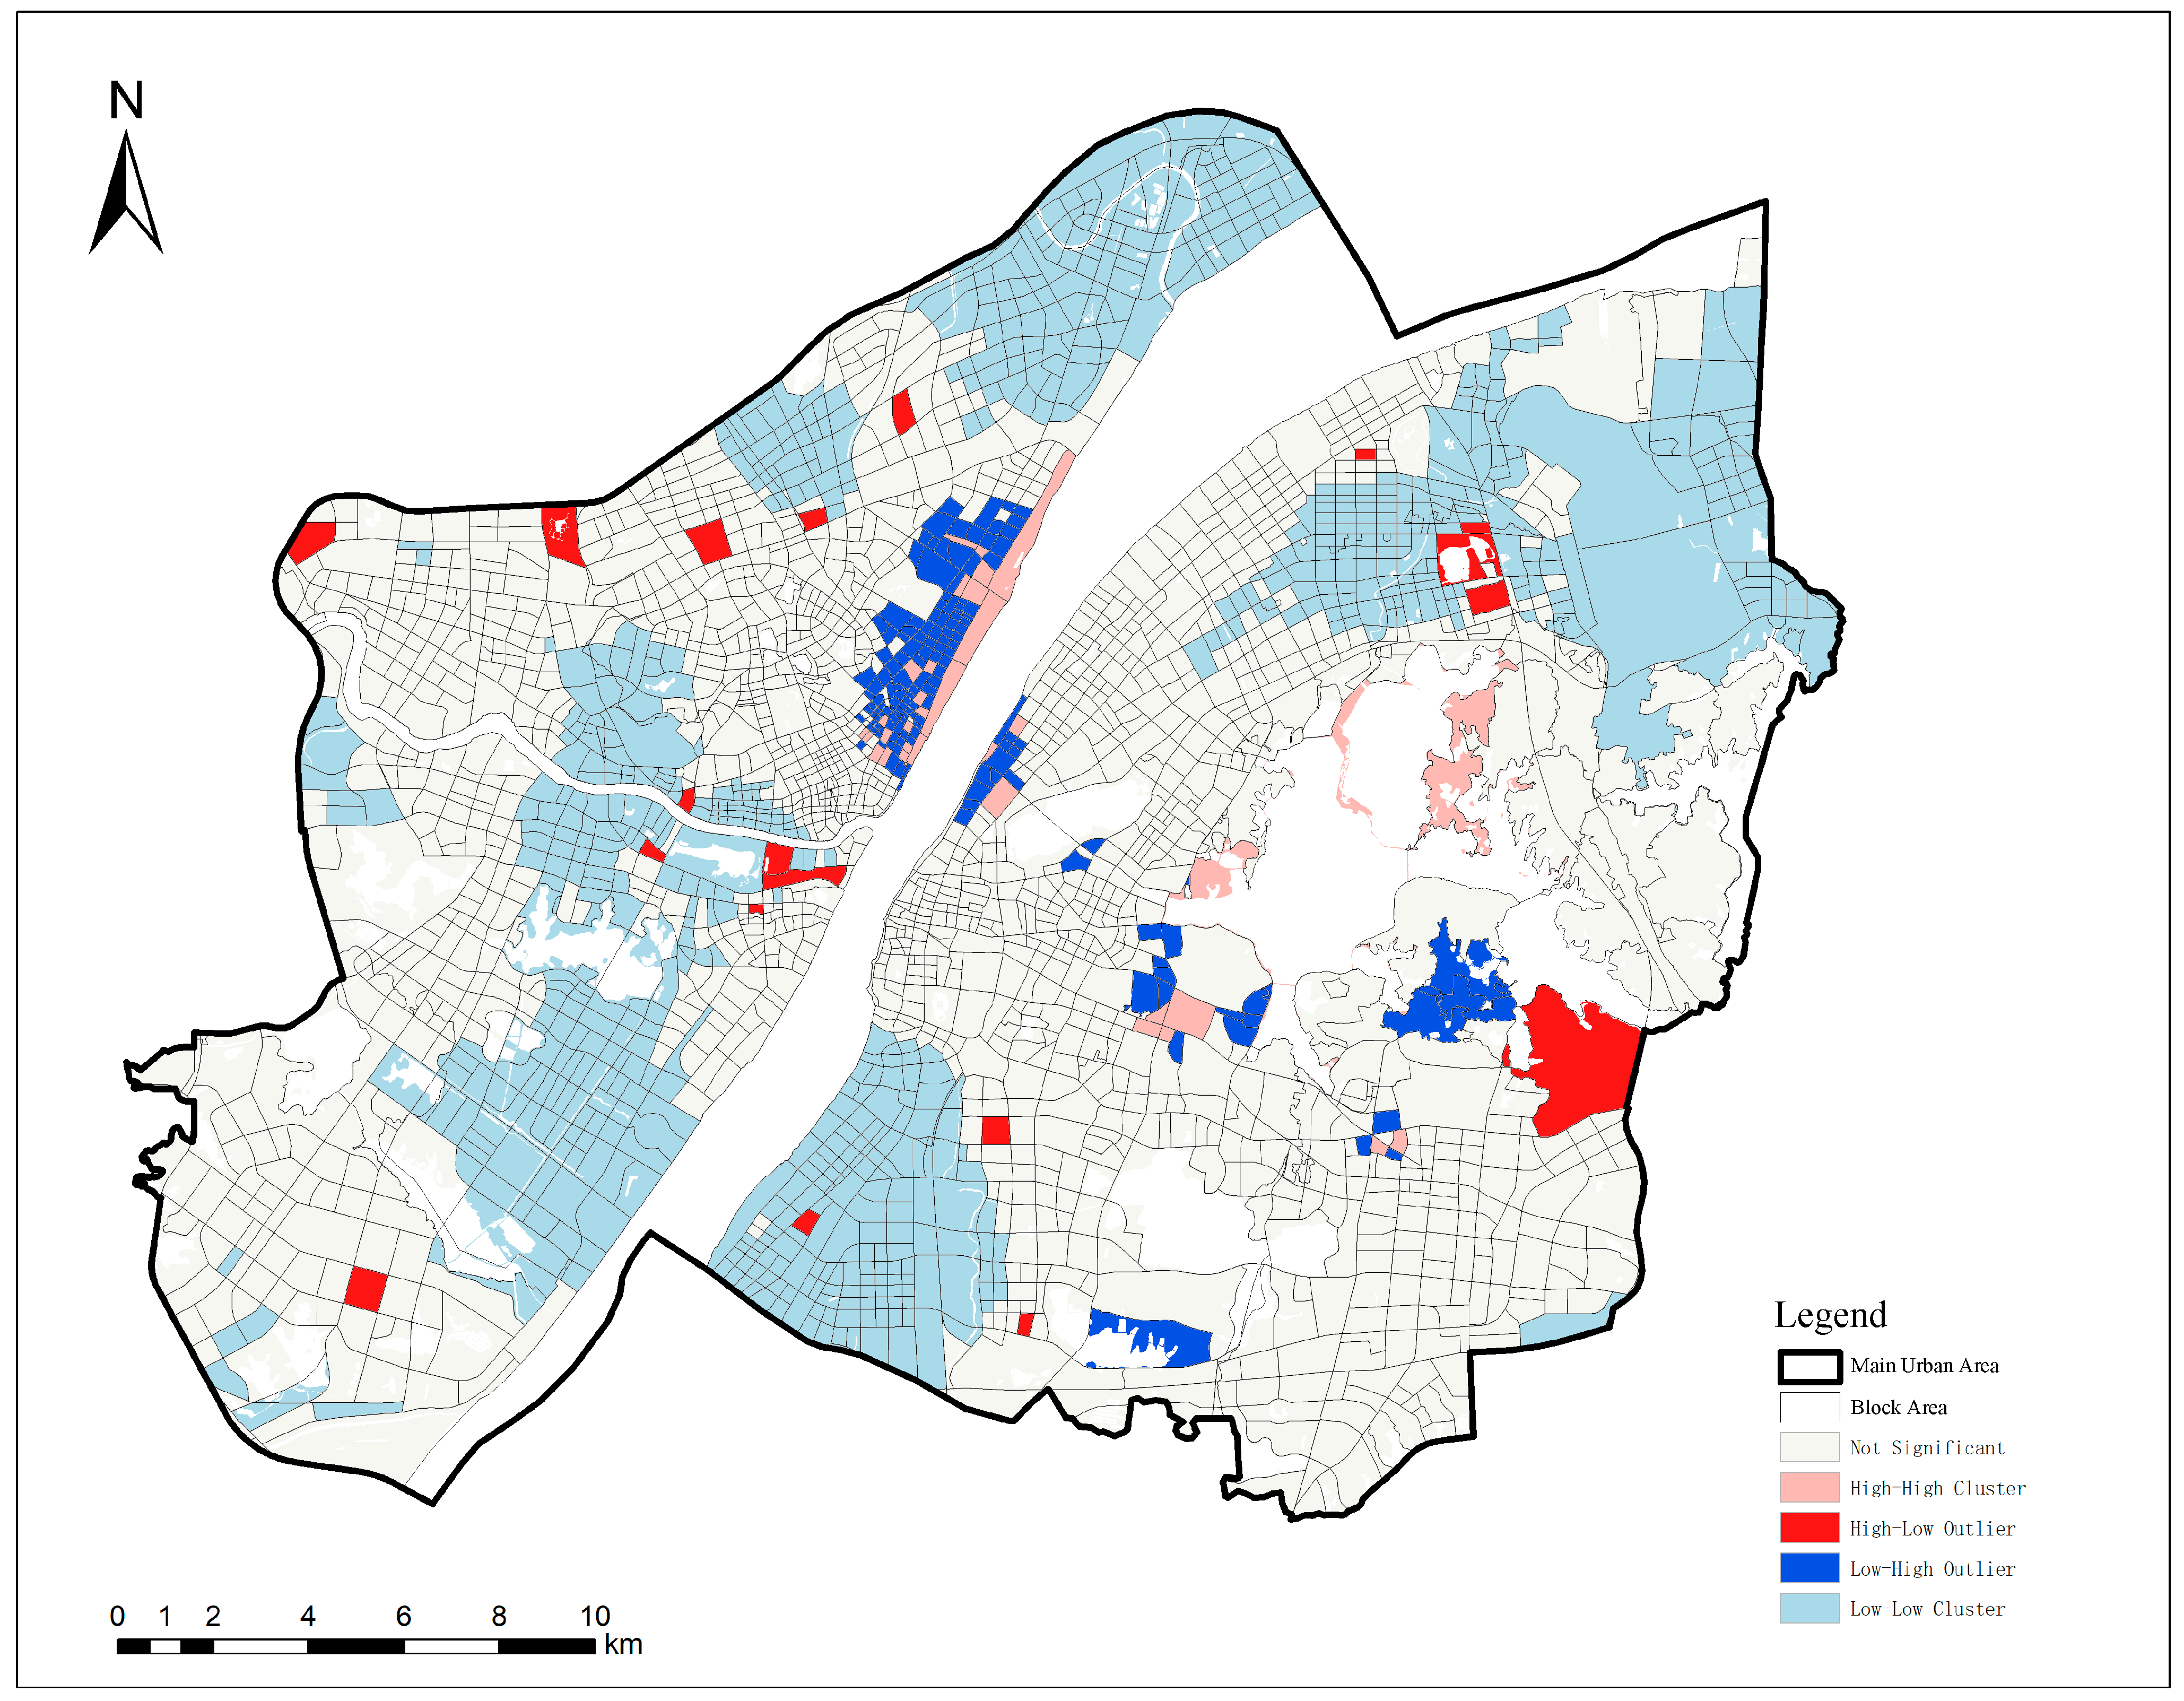
To further investigate the characteristics of clustering effects, this study utilizes Local Indicators of Spatial Association (LISA) analysis to examine the spatial patterns and features of positive emotions in the block-level distribution within the main urban areas of Wuhan (Figure 9). The results show a significant spatial autocorrelation in the distribution of positive emotions among 1018 blocks. The spatial distribution demonstrates an uneven state, revealing four different types of cluster distributions: “high-high”, “low-low”, “high-low”, and “low-high”. In addition, there is a strong interdependence among the neighborhoods. Specifically, 30.3% of the blocks exhibited a “low-low” cluster distribution feature, indicating that these areas have low positive emotion values, affecting the surrounding blocks with similarly low positive emotion values. These blocks were mainly located in the fringe areas of the main urban area, dominated by industrial areas such as the Wugang industrial area, the Baishazhou industrial area, and the Hanyang Economic Development Zone. On the other hand, 1.3% of the blocks exhibited a “high-high” cluster distribution feature, indicating that these areas have high positive emotion values, influencing the surrounding blocks with similarly high positive emotion values. These blocks were primarily situated in commercial and waterfront areas, such as the Jiedaokou commercial area, Optics Valley commercial area, Hankow riverside, and the area around East Lake Scenic. Other “high-low” and “low-high” clusters were sporadically distributed in the transitional zones between clustered areas.
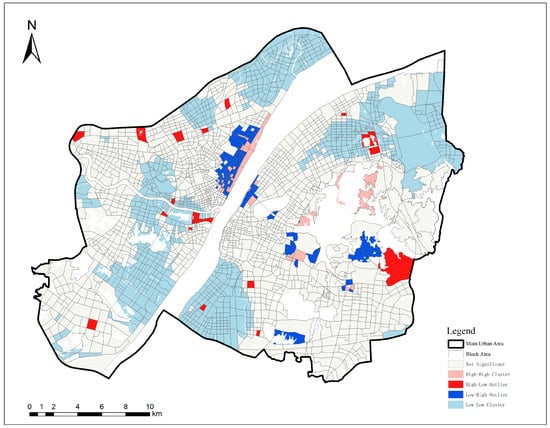
Figure 9.
LISA agglomeration of the positive emotion block.
3.2.2. Independent Variable Screening
In order to avoid bias in the estimation results due to the mutual influence of factors, it is necessary to test each factor and select the optimal ones as variables for the construction of the MGWR model. In this study, we used Ordinary Least Squares (OLS) regression analysis with 13 explanatory variables and the positive emotion values of the blocks as the dependent variables. The results show that the Variance Inflation Factor (VIF) values of all 13 explanatory variables are less than 7.5, indicating the absence of multicollinearity issues among the variables. Therefore, we used all variables as explanatory variables for model construction (Table 4).
Table 4.
Statistics of collinearity test results of variables.
3.2.3. Regression Coefficients and Spatial Distribution of Explanatory Variables of the MGWR Model
- (1)
- MGWR Regression Model Results
According to Table 5, the goodness-of-fit measures for the MGWR model indicate an R2 value of 0.504 and an adjusted R2 value of 0.400. In terms of optimal bandwidth, the population density and NDVI have relatively smaller bandwidths of 44 and 52, respectively, suggesting that their effects on positive emotions operate at a smaller scale. FSI, PFM, and SSI have slightly larger bandwidths of 122, 126, and 277, respectively. The optimal bandwidths for the other variables are all greater than 400, indicating that their influence is on a more global scale.
Table 5.
Results of MGWR.
- (2)
- Descriptive Statistics of Standardized Regression Coefficients
The coefficients’ standard deviations reflect the variation in the relationship between positive emotions and explanatory variables. According to Table 6, the variables with larger standard deviations are PD, NDVI, FSI, and PFM, indicating greater variation in their effects. Conversely, the coefficients of other explanatory variables have smaller degrees of variation. In terms of the absolute values of the coefficient means, the three factors that had the largest overall impact on positive emotions are PFD, PD, and NDVI, in that order. The absolute values of the medians show that PFD had the largest overall impact on positive emotions. In terms of significance, only PFD had a significant impact on positive emotions across all blocks. NDVI, PD, FSI, PFM, and SSI had significant impacts on positive emotions in some blocks, but not all blocks. On the other hand, GSI, OSR, BAL, GSR, WI, RND, and SSC did not have a significant impact on positive emotions in any of the blocks.
Table 6.
Descriptive statistical results of standardized regression coefficients of explanatory variables for MGWR model.
- (3)
- Spatial Heterogeneity of Regression Coefficients
Spatial visualization of the MGWR coefficient regression results yielded the following findings (Figure 10a):
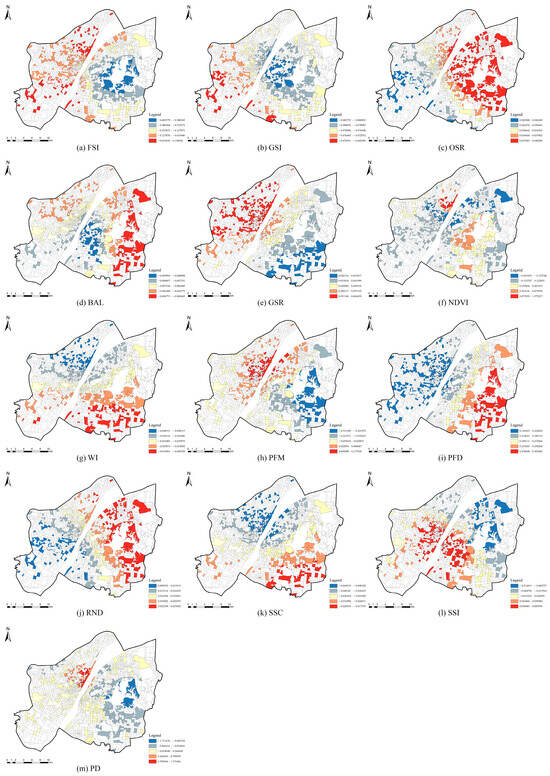
Figure 10.
Spatial distribution of standardized regression coefficients for the MGWR model: (a) FSI, (b) GSI, (c) OSR, (d) BAL, (e) GSR, (f) NDVI, (g) WI, (h) PFM, (i) PFD, (j) RND, (k) SSC, (l) SSI, and (m) PD.
In terms of Urban Form variables, FSI was generally negatively correlated with positive emotions. However, in the eastern part of the research area, the correlation was significant. In contrast, in the northwestern and southwestern parts of the research area, there was a positive correlation between FSI and positive emotions, with coefficient values ranging from −0.686 to 0.131 (Figure 10a). GSI and BAL were both negatively correlated with positive emotions. In the central part of the research area, the correlations were significant. However, the coefficient range for GSI was between −0.083 and −0.069, decreasing towards the western part, while the coefficient range for BAL was between −0.011 and −0.004, decreasing towards the eastern part (Figure 10b,d). OSR was significantly positively correlated with positive emotions in the eastern part of the research area, with coefficient values ranging from 0.020 to 0.040. Moreover, there was a strong spatial heterogeneity, with a rapid decrease from east to west (Figure 10c).
In the Green Environment variables, GSR was positively correlated with positive emotions, with coefficient values decreasing from west to east and ranging from 0.060 to 0.020 (Figure 10e). NDVI showed a unique pattern. In the northern and eastern parts of the research area, it was significantly positively correlated with positive emotions, with coefficient values ranging from 0.123 to 1.375, exhibiting significant fluctuations. However, in the western and southern parts, it was significantly negatively correlated with positive emotions, with coefficient values ranging from −0.421 to −0.124, showing relatively smaller fluctuations (Figure 10f). WI was negatively correlated with positive emotions, with coefficient values decreasing from south to north and ranging from −0.045 to −0.010 (Figure 10g).
In the Urban Function variables, PFM exhibited two types of correlations with positive emotions. In the eastern part of the research area, it was negatively correlated with positive emotions, with coefficient values ranging from −0.512 to −0.060, showing significant fluctuations (Figure 10h). Conversely, in the western part of the research area, it was positively correlated with positive emotions, with coefficient values ranging from 0.023 to 0.158 (Figure 3h). PFD was positively correlated with positive emotions, with coefficient values decreasing from east to west and ranging from 0.143 to 0.303 (Figure 10i).
In the Transportation variables, RND was positively correlated with positive emotions, with coefficient values decreasing from south to north and ranging from 0.010 to 0.028 (Figure 10j). SSI was negatively correlated with positive emotions, with coefficient values decreasing from east to west and ranging from −0.044 to −0.018 (Figure 10k). SSC also exhibited two types of correlations with positive emotions. In the eastern part of the research area, it was negatively correlated with positive emotions, with coefficient values ranging from −0.214 to −0.016. Conversely, in the western part of the research area, it was positively correlated with positive emotions, with coefficient values ranging from 0.024 to 0.086 (Figure 10l).
PD also showed two types of correlations with positive emotions. In the central part of the research area, it was positively correlated with positive emotions, with significant clusters of blocks. The coefficient values ranged from 0.260 to 1.575, showing significant fluctuations. In contrast, in the eastern part of the research area, it was negatively correlated with positive emotions, with significant clusters of blocks. The coefficient values ranged from −1.712 to −0.055, also exhibiting significant fluctuations (Figure 10m).
4. Discussion
4.1. Interpretation of the Effects of Spatial Heterogeneity of Variables
4.1.1. Urban Form
Overall, FSI was negatively correlated with positive emotions, particularly in the eastern areas where the Wuchang and Hongshan districts are located. These regions encompass a large number of lakes such as East Lake, South Lake, and Sha Lake. The development intensity of land in these lakeside areas is relatively low, resulting in better natural and ecological landscapes. A study by Lan et al. (2021) further validates these findings, indicating that natural conditions can positively impact individuals’ physical and mental well-being by reducing anxiety and distress [71]. Moreover, in the Erqi area of Hankow and the Sanjiaohu area of Hanyang, the FSI is negatively correlated with positive emotions. This may be attributed to these areas being designated as key control zones in urban design, where new construction considers natural environmental factors and human perceptual needs. Positive emotions display a negative correlation with GSI and BAL but a positive correlation with OSR, indicating that reduced urban development may be advantageous for fostering positive emotions. The presence of open spaces and lower building heights can contribute to a more expansive view and alleviate feelings of confinement. These results align with those of Wang et al. (2022) [72]. In the Wuchang Riverside area, GSI and BAL demonstrate notable trends due to their historical significance and strict height regulations for new constructions within the Wuchang Ancient City. Similarly, OSR and FSI exhibit consistent patterns, particularly in the eastern lakeside regions.
4.1.2. Green Environment
GSR was positively correlated with positive emotions, with spatial heterogeneity observed between the western and eastern regions. The western areas (Qiaokou, Jianghan, and Jiang’an districts) have more developed land and fewer urban green spaces, leading to a stronger correlation. Conversely, the eastern areas (Wuchang and Hongshan districts) feature large lakes and mountains, resulting in a weaker correlation. In regions with limited green spaces, the impact of GSR on positive emotions was more pronounced. NDVI showed a dual relationship with positive emotions, being significantly positively correlated in the Erqi Riverside Business District, Gutian area, the area along East Lake, and the area along South Lake, which have large urban parks and green spaces. However, there was a significant negative correlation in other areas, with substantial differences that may be attributed to variations in people’s spatial perceptions. In densely built-up areas where architecture dominates urban spaces, individuals perceive the city as primarily serving functional purposes, with vegetation playing a secondary role [73]. On the contrary, in natural scenic areas, people visit with the specific purpose of experiencing the natural environment, including sights, sounds, and ecological elements [74]. WI was negatively correlated with positive emotions, possibly due to Wuhan’s abundant rivers and lakes, leading to widespread water coverage that is easily accessible and not considered a scarce resource within the city. In contrast, areas with less water coverage can accommodate more extensive urban development, providing greater urban service advantages.
4.1.3. Urban Function
PFM also exhibited two types of correlations with positive emotions. It shows a positive correlation with positive emotions in areas along both sides of the Yangtze River, known for scenic spots and commercial districts. Conversely, in the Optics Valley High-tech Zone and Jiedaokou area, it exhibited a negative correlation. This is due to the different characteristics of these areas, the former being industrial and high-tech features and the latter being research and development hubs. Commercial areas with a high functional mixture tend to elicit higher positive emotions due to convenient services and entertainment, while research and development areas have a quieter environment, leading to lower positive emotions. PFD showed a positive correlation with positive emotions, especially in the eastern region where universities dominate. This is because students in this region may face transportation challenges and a limited activity range; thus, a higher functional density improves convenience and reduces travel costs [75].
4.1.4. Transportation
RND was positively correlated with positive emotions, especially in the eastern region. This relationship can be explained by the geographical features of the eastern region, which include numerous water bodies and mountains. These geographical characteristics make it more difficult to build roads, leading to lower road network density and less convenient transportation. In this region, higher road network density was associated with improved positive emotions due to the enhanced convenience it offers for travel and commuting. SSI and SSC primarily assess the accessibility and permeability of motorized lanes, reflecting the ease of reach and navigability for vehicles. SSI showed a negative correlation with positive emotions, particularly in the Hankou Historic District and Wuchang Ancient City areas. This is because higher integration in these areas results in easier access for motorized vehicles, leading to congestion and lower positive emotions among pedestrians. This finding aligns with the research conducted by Ahmed (2023) [76]. Conversely, lower vehicular traffic and a focus on pedestrian movement in an area tended to evoke more positive emotions. SSC showed two distinct correlations with positive emotions. In the central region of the study area, SSC was positively correlated due to the concentration of urban service functions and high demand for commuting, especially during rush hour. This is facilitated by the presence of a long tunnel and multiple bridges across the Yangtze and Han Rivers, enhancing navigability and transportation convenience, thereby boosting positive emotions [77]. Conversely, in the eastern region, SSC was negatively correlated with positive emotions, likely due to lower traffic demand and fewer visitors. The Qingshan District in the eastern region, known for heavy industries like steel manufacturing, lacks diversity in functions, suffers from environmental pollution, and is not considered an attractive destination for visitors.
4.1.5. Population Density
PD demonstrated correlations with positive emotions in two distinct ways. In the central region of the study area, PD showed a positive correlation with positive emotions, leading to significant clusters of blocks. This phenomenon can be attributed to the area’s popularity as a tourist destination, drawing in a large number of visitors. The presence of tourists and various activities organized by businesses create a vibrant atmosphere, fostering positive emotions among individuals. Conversely, in the eastern region of the study area, PD was negatively correlated with positive emotions, resulting in significant clusters of blocks as well. The eastern region is home to the East Lake Nature Reserve, where individuals seek solace in the natural environment and tranquility. They prefer less crowded spaces, which contributes to lower positive emotions associated with higher population density in this particular area.
4.2. Limitation of Social Media Data
While social media data provide a vast amount of data for various research purposes, they also come with certain limitations, such as missing demographic information, keyword censorship, location data scarcity, fluctuations in social media behavior, and privacy concerns [78]. These constraints may introduce biases in the research results. In this study, it was difficult to obtain detailed personal information of Weibo users, or the related information lacked authenticity, e.g., regarding gender, age, education, income, birthplace, and so on. Different individuals have varied perceptions of the built environment and the results of Weibo data cannot represent the whole population. However, according to the 2020 Weibo User Development Report [79], we can infer the general demographic profile. Weibo has approximately 511 million monthly active users, with 224 million daily active users, of which 48% were born in the 1990s, 30% in the 2000s, and 22% in the 1980s or earlier, with a male-to-female ratio of 1:1.2. This sample bias leads to research findings that only reflect the emotional perceptions of individuals in that age group. This is also one of the reasons why spaces are associated with higher education institutions and cultural and entertainment centers, where young people gather. However, this does not diminish the research potential of the method because the advantage of big data research lies in its ability to make macroscopic and large-scale trend assessments. To mitigate the impact of demographic information on the results, further research could incorporate micro-level data, such as survey questionnaires and physio-psychological measurements, to enrich the study findings.
5. Conclusions
This study, grounded in a human-centric perspective and quantifying SMD through NLP, investigated people’s perceptions in the main urban areas of Wuhan, which are high-density built environments. By examining the relationship between quantifiable indicators of high-density built environments and emotional perception, this research explored how the objective environment influences subjective experiences. The results indicate the following: First, positive emotions exhibit spatial differentiation in high-density built environments. Furthermore, it was found that positive emotions are influenced by multiple variables, with different variables simultaneously affecting individuals’ positive emotions. Second, concerning specific built environment indicators, positive emotions are positively correlated with OSR, GSR, PFD, and RND. Conversely, they are negatively correlated with FSI, GSI, BAL, WI, and SSI. NDVI, PFM, SSC, and PD exhibit ambivalence in different spatial contexts.
This research has applications in planning practices. Planners may refer to the findings of this quantitative study on urban space for optimizing urban spatial layouts, addressing residents’ psychological health concerns, and alleviating the “urban diseases” resulting from rapid urban development. There are four urban planning strategies that may contribute to generating positive emotion in increasingly dense built environments:
- Increasing public open spaces in high-density residential areas to provide ample outdoor activity areas and simultaneously adding vegetation can help regulate micro-climates, ultimately enhancing feelings of comfort.
- Planning mixed-use developments around transportation nodes and scenic areas, as well as strengthening the layout of public service facilities to enhance functional diversity.
- Increasing road network density in the peripheries of central urban areas to improve accessibility, while restricting vehicle traffic in central urban areas.
- Controlling construction scale and limiting building height in old towns and surrounding areas, preserving sufficient view corridors.
However, this study only offers a preliminary investigation of the relationship between human emotional perception and high-density built environments on a large scale by using social media text data. As urban areas globally undergo increasing densification, it is beneficial to explore various aspects of people’s lived experiences in relation to density and determine their psychological impacts. Future research must delve into micro-scale environmental factors like urban images, block morphology, architectural features, and open spaces, employing advanced methods like deep learning, physiological monitoring technology, and virtual simulation technology to reveal the intricate relationships between human perception and built environments.
Author Contributions
Conceptualization, W.L. and D.L.; methodology, D.L.; software, D.L.; validation, W.L. and D.L.; formal analysis, D.L.; investigation, C.G.; resources, D.L.; data curation, Y.M.; writing—original draft preparation, D.L.; writing—review and editing, D.L.; visualization, C.G.; supervision, W.L.; project administration, W.L.; funding acquisition, W.L. All authors have read and agreed to the published version of the manuscript.
Funding
This work was supported by the National Natural Science Foundation of China under Grant No. 52078397.
Data Availability Statement
The data presented in this study are available on request from the corresponding author. The data are not publicly available due to privacy restrictions.
Conflicts of Interest
The authors declare no conflicts of interest.
References
- Izard, C.E. Human Emotions; Springer Science & Business Media: Berlin, Germany, 2013; ISBN 978-1-4899-2209-0. [Google Scholar]
- Wierzbicka, A. Human Emotions: Universal or Culture-Specific? Am. Anthropol. 1986, 88, 584–594. [Google Scholar] [CrossRef]
- Salesses, P.; Schechtner, K.; Hidalgo, C.A. The Collaborative Image of The City: Mapping the Inequality of Urban Perception. PLoS ONE 2013, 8, e68400. [Google Scholar] [CrossRef] [PubMed]
- Golder, S.A.; Macy, M.W. Diurnal and Seasonal Mood Vary with Work, Sleep, and Daylength Across Diverse Cultures. Science 2011, 333, 1878–1881. [Google Scholar] [CrossRef] [PubMed]
- Tuan, Y.-F. Space and Place: The Perspective of Experience; University of Minnesota Press: Minneapolis, MN, USA, 1977; pp. 1–7. [Google Scholar]
- Milton, K. Loving Nature: Towards an Ecology of Emotion; Routledge: London, UK, 2002. [Google Scholar]
- Hochschild, A.R. The Commercialization of Intimate Life; University of California Press: Berkeley, CA, USA, 2003. [Google Scholar]
- Chodorow, N.J. The Power of Feeling; Yale University Press: New Haven, CT, USA, 1999. [Google Scholar]
- Nussbaum, M.C. Upheavals of Thought: The Intelligence of Emotions; Cambridge University Press: Cambridge, UK, 2003. [Google Scholar]
- Marcus, G.E. The Sentimental Citizen: Emotion in Democratic Politics; Pennsylvania State University Press: University Park, PA, USA, 2002. [Google Scholar]
- Ahmed, S. The Cultural Politics of Emotion; Edinburgh University Press, Routledge: New York, NY, USA, 2004. [Google Scholar]
- Davidson, J.; Milligan, C. Embodying Emotion Sensing Space: Introducing Emotional Geographies. Soc. Cult. Geogr. 2004, 5, 523–532. [Google Scholar] [CrossRef]
- Lynch, K. The Image of the City; MIT Press: Boston, MA, USA, 1960. [Google Scholar]
- Norberg-Schulz, C. Genius Loci: Towards a Phenomenology of Architecture (1979). Hist. Cities Issues Urban Conserv. 2019, 8, 31. [Google Scholar]
- Gerson, K.; Stueve, A.; Fischer, C.S. Attachment to place. In Networks and Places: Social Relations in the Urban Setting; The Free Press: New York, NY, USA, 1977; pp. 139–161. [Google Scholar]
- Proshansky, H.M. The City and Self-Identity. Environ. Behav. 1978, 10, 147–169. [Google Scholar] [CrossRef]
- Jia, J.; Zhen, F.; Xi, G. A Review on Emotional Geography: Its Progress and Enlightenment. World Reg. Stud. 2016, 25, 123–136. [Google Scholar]
- Zhu, H.; Gao, Q. Review on “Emotional Turn” and Emotional Geographies in Recent Western Geography. Geogr. Res. 2015, 34, 1394–1406. [Google Scholar]
- Plunz, R.A.; Zhou, Y.; Carrasco Vintimilla, M.I.; Mckeown, K.; Yu, T.; Uguccioni, L.; Sutto, M.P. Twitter Sentiment in New York City Parks as Measure of Well-Being. Landsc. Urban Plan. 2019, 189, 235–246. [Google Scholar] [CrossRef]
- Zheng, Y.; Jizhen, L.; Bingrong, L.; Min, C. Perception and Evaluation of Cityscape Characteristics Using Semantic Analysis on Microblog in the Main Urban Area of Chongqing Municipality. Prog. Geogr. 2017, 36, 1058–1066. [Google Scholar]
- Shelton, T.; Poorthuis, A.; Zook, M. Social Media and the City: Rethinking Urban Socio-Spatial Inequality Using User-Generated Geographic Information. Landsc. Urban Plan. 2015, 142, 198–211. [Google Scholar] [CrossRef]
- UN-Habitat. International Guidelines on Urban and Territorial Planning; United Nations Human Settlements Programme: Nairobi, Kenya, 2015. [Google Scholar]
- Hu, L. A Study on Diagrammatic Assessment Approaches to the Sustainable Morphology of Urban Density. Master’s Thesis, University of Hong Kong, Hong Kong, China, 2011. [Google Scholar]
- Resch, E.; Bohne, R.A.; Kvamsdal, T.; Lohne, J. Impact of Urban Density and Building Height on Energy Use in Cities. Energy Procedia 2016, 96, 800–814. [Google Scholar] [CrossRef]
- Bardhan, R.; Kurisu, K.; Hanaki, K. Does Compact Urban Forms Relate to Good Quality of Life in High Density Cities of India? Case of Kolkata. Cities 2015, 48, 55–65. [Google Scholar] [CrossRef]
- Yang, J.; An, R.; Tong, Z.; Liu, Y. Exploring the Relationship between Built Environment and Ventilation Potential in Wuhan, A Multi-Scale Geographically Weighted Regression Analysis. J. Nanjing Norm. Univ. Sci. Ed. 2023, 4, 29–39. [Google Scholar]
- Douglas, E. Examining the Relationship between Urban Density and Sense of Community in the Greater Vancouver Regional District. Cities 2022, 130, 103870. [Google Scholar] [CrossRef]
- Beixiang, S.; Malwin, S.; Junyan, Y. Study on the Quality Improvement of Built Environment in High Density Urban Areas under the Background of Post Smart City Transformation. Int. Urban Plan. 2021, 36, 16–21. [Google Scholar]
- Zhang, Q.; Xu, H.; Huang, Q. A Review of the Interactive between People and the Built Environment. Archit. J. 2016, 2, 118–124. [Google Scholar]
- Shi, B.; Yang, J. Large Scale Spatial Morphology Analysis Method Based on GIS Platform: Take the Height, Density and Intensity of the Metropolitan Central Districts as Example. Urban Plan Int. 2019, 34, 111–117. [Google Scholar] [CrossRef]
- Wang, J. A Research into the Large-Scaled Spatial Forms of Cities Based on Urban Design. Sci. China Ser. E Technol. Sci. 2009, 52, 2486–2496. [Google Scholar] [CrossRef]
- Zhou, A.; Guo, H. Coherence Measure of Spatial Morphology Based on GIS and Space Syntax. Geomat. Spat. Inf. Technol. 2016, 39, 170–172. [Google Scholar]
- Liu, S.; Li, T.; Chen, H.; Zhang, J.; Tian, G.; Cai, D. Research on the Simulati on of NDVI Dynamic Monitoring Based on Temporal GIS. Res. Soil Water Conserv. 2006, 13, 165–166+169. [Google Scholar]
- Zhang, J.; Shi, W.; Xiu, C. Urban Research Using Points of Interest Data in China. Sci. Geogr. Sin. 2021, 41, 140–148. [Google Scholar]
- Fan, L.; Zhang, D. Research on the Influence Mechanism and Spatial Heterogeneity Characteristics of Block Vitality in Beijing: Based on Multi-Scale Geographically Weighted Regression. City Plan. Rev. 2022, 46, 27–37. [Google Scholar]
- Wang, F.; Yan, L.; Xiong, X.; Wu, B. A Study on Tourist Cognition of Urban Memory in Historic Sites: A Case Study of Alley Nanluogu Historic Site in Beijing. Acta Geogr. Sin. 2012, 67, 545–556. [Google Scholar]
- Liang, J.; Jiang, S.; Tao, L. Empirical Research on the Relationship between Spatial-Temporal Behavior and Emotion of Tourists Based on Semantic Analysis of online Travel Blogs and GIS Visualization: A Case of Beijing. Hum. Geogr. 2020, 35, 152–160. [Google Scholar]
- Zhang, F.; Zhou, B.; Liu, L.; Liu, Y.; Fung, H.H.; Lin, H.; Ratti, C. Measuring Human Perceptions of a Large-Scale Urban Region Using Machine Learning. Landsc. Urban Plan. 2018, 180, 148–160. [Google Scholar] [CrossRef]
- Rossetti, T.; Lobel, H.; Rocco, V.; Hurtubia, R. Explaining Subjective Perceptions of Public Spaces as a Function of the Built Environment: A Massive Data Approach. Landsc. Urban Plan. 2019, 181, 169–178. [Google Scholar] [CrossRef]
- Verma, D.; Jana, A.; Ramamritham, K. Machine-Based Understanding of Manually Collected Visual and Auditory Datasets for Urban Perception Studies. Landsc. Urban Plan. 2019, 190, 103604. [Google Scholar] [CrossRef]
- Fan, L.; Zhang, D. Research on Spatial Perception of Urban Image Hotspots under New Social Media: Take the Note Data of Beijing Xiaohongshu as an Example. Urban Dev. Stud. 2022, 29, 1–8. [Google Scholar]
- Cui, L.M.; Qu, L.Y.; He, D. Evaluating Emotional Perception of Spatial Hotspots via Deep Learning: A Case Study of Shanghai. Hum. Geogr. 2021, 36, 121–130. [Google Scholar]
- He, H.; Ding, H.; Sun, R. Spatiotemporal Analysis of Residential Happiness in Urban Functional Zones Based on Social Sensing. Acta Ecol. 2023, 43, 2298–2309. [Google Scholar]
- Wang, B.; Zhen, F.; Zhang, H. The Dynamic Changes of Urban Space-Time Activity and Activity Zoning Based on Check-in Data in Sina Web. Sci. Geogr. Sin. 2015, 35, 151–160. [Google Scholar]
- Wu, Y.; Dong, W.; Zhang, W. Research on Influencing Factors of Built Environment Perception in Neighborhoods: Evidence from Behavioral Experiment. City Plan. Rev. 2022, 46, 99–109. [Google Scholar]
- Figueiredo, M.; Eloy, S.; Marques, S.; Dias, L. Older People Perceptions on the Built Environment: A Scoping Review. Appl. Ergon. 2023, 108, 103951. [Google Scholar] [CrossRef]
- Larkin, A.; Gu, X.; Chen, L.; Hystad, P. Predicting Perceptions of the Built Environment Using GIS, Satellite and Street View Image Approaches. Landsc. Urban Plan. 2021, 216, 104257. [Google Scholar] [CrossRef] [PubMed]
- Ewing, R.; Cervero, R. Travel and the Built Environment. J. Am. Plan. Assoc. 2010, 76, 265–294. [Google Scholar] [CrossRef]
- Berghauser Pont, M.; Haupt, P. Spacemate: The Spatial Logic of Urban Density; Delft University Press Science: Delft, The Netherlands, 2004. [Google Scholar]
- Berghauser Pont, M.; Haupt, P. The Spacemate: Density and the Typomorphology of the Urban Fabric. In Urbanism Laboratory for Cities and Regions: Progress of Research Issues in Urbanism 2007; IOS Press: Amsterdam, The Netherlands, 2007; pp. 11–26. Available online: http://arkitekturforskning.net/na/article/download/167/130 (accessed on 2 October 2023).
- Berghauser Pont, M.; Haupt, P. The Relation between Urban form and Density. Urban Morphol. 2007, 11, 62–65. [Google Scholar] [CrossRef]
- CJJ/T85-2017; Standard for Classification of Urban Green Space. Ministry of Housing and Urban-Rural Development of the People’s Republic of China: Beijing, China, 2017.
- Wang, J.; Zhu, A.; Wang, M. Correlating Physical Forms of Riparian Zones in Urban Parks with Effective Eco-Services Provision of Water Self-Purifi Cation: A Case Study of Shanghai Mengqing Park. Landsc. Archit. 2016, 8, 118–127. [Google Scholar]
- Jin, K.; Wang, F.; Han, J.; Shi, S.; Ding, W. Contribution of Climatic Change and Human Activities to Vegetation NDVI Change over China during 1982–2015. Acta Geogr. Sin. 2020, 75, 961–974. [Google Scholar]
- Xue, B.; Xiao, X.; Li, J. POI-Based Analysis on Retail ’s Spatial Hot Blocks at a City Level: A Case Study of Shenyang, China. Econ. Geogr. 2018, 38, 36–43. [Google Scholar]
- Miaoyi, L.I.; Yan, M.A.; Sun, X.; Wang, J.; Dang, A. Application of Spatial and Temporal Entropy Based on Multi-Source Data for Measuring the Mix Degree of Urban Functions. City Plan. Rev. 2018, 42, 97–103. [Google Scholar]
- Jenelius, E. Network Structure and Travel Patterns: Explaining the Geographical Disparities of Road Network Vulnerability. J. Transp. Geogr. 2009, 17, 234–244. [Google Scholar] [CrossRef]
- Jin, D.; Hillier, B. Spatial Syntax and Urban Planning; Southeast University Press: Nanjing, China, 2007. [Google Scholar]
- Hillier, B.; Iida, S. Network and Psychological Effects in Urban Movement. In Spatial Information Theory; Cohn, A.G., Mark, D.M., Eds.; Lecture Notes in Computer Science; Springer Berlin Heidelberg: Berlin/Heidelberg, Germany, 2005; Volume 3693, pp. 475–490. ISBN 978-3-540-28964-7. [Google Scholar]
- Xia, X. A Comparison Study on a Set of Space Syntax Based Methods: Applying Metric, Topological and Angular Analysis to Natural Streets, Axial Lines and Axial Segments. Master’s Thesis, University of Gävle, Gävle, Sweden, 2013. [Google Scholar]
- Burton, E. Measuring Urban Compactness in UK Towns and Cities. Environ. Plan. B Plan. Des. 2002, 29, 219–250. [Google Scholar] [CrossRef]
- Shen, Y.; Fu, X. Impact of the Built Environment and Perceived Neighborhood Characteristics on Residents Satisfaction: Evidence from the Shanghai Suburbs. Prog. Geogr. 2019, 38, 686–697. [Google Scholar]
- Guo’an, Y.; Yinghong, D. On the Categorical and Dimensional Approaches of the Theories of the Basic Structure of Emotions. Nankai J. Philos. Lit. Soc. Sci. Ed. 2013, 58, 140–150. [Google Scholar]
- Zhou, H.; Huang, M.; Zhang, T.; Zhu, X.; Liu, B. Emotional Chatting Machine: Emotional Conversation Generation with Internal and External Memory. In Proceedings of the AAAI Conference on Artificial Intelligence, New Orleans, LA, USA, 2–7 February 2018; Volume 32. [Google Scholar]
- You, M.; Zhong, Y.; Zou, P. Analysis on Text Sentiment Based on Sklearn. Appl. IC 2022, 39, 92–93. [Google Scholar]
- Chen, Y. An Analytical Process of Spatial Autocorrelation Functions Based on Moran’s Index. PLoS ONE 2021, 16, e0249589. [Google Scholar] [CrossRef] [PubMed]
- Wu, Z.; Liu, Y.; Feng, X.; Chen, Y.; Yan, Q. Analysis of Local Influencing Factors of Cadmium Pollution in Soil by Using Multi-Scale Geographically Weighted Regression. J. Geo-Inf. Sci. 2023, 25, 573–587. [Google Scholar]
- Huang, F.; Tang, J.; Lin, H.; Han, S.; Zhao, P. Built Environment Effects on the Spatio-Temporal Distribution of Shared Bikes Based on Multi-Scale Geographic Weighted Regression. Geogr. Res. 2023, 42, 2405–2418. [Google Scholar]
- Zhang, Y.; Teoh, B.K.; Zhang, L. Exploring Driving Force Factors of Building Energy Use and GHG Emission Using a Spatio-Temporal Regression Method. Energy 2023, 269, 126747. [Google Scholar] [CrossRef]
- Fotheringham, A.S.; Yang, W.; Kang, W. Multiscale Geographically Weighted Regression (MGWR). Ann. Am. Assoc. Geogr. 2017, 107, 1247–1265. [Google Scholar] [CrossRef]
- Lan, W.; Duan, J.; Yang, B.; Li, J.; Jiang, Y. A Public Perception-Oriented Evaluation Model of Urban Spatial Identity and Its Empirical Research: Taking the Main Urban Area of Wuhan as an Example. City Plan. Rev. 2021, 45, 67–76. [Google Scholar]
- Wang, Y.; Zhou, Q.; Yang, X. Discussion on Urban Space Types Based on Perception/Wang Yirui, Zhou Qinghua, Yang Xiaodan, Nan Jiabo, Cheng Ming. Planners 2022, 38, 135–140. [Google Scholar]
- Zhou, G.; Li, C.; Li, M.; Zhang, J.; Liu, Y. Agglomeration and Diffusion of Urban Functions: An Approach Based on Urban Land Use Conversion. Habitat Int. 2016, 56, 20–30. [Google Scholar] [CrossRef]
- Arnberger, A.; Eder, R. Are Urban Visitors’ General Preferences for Green-Spaces Similar to Their Preferences When Seeking Stress Relief? Urban For. Urban Green. 2015, 14, 872–882. [Google Scholar] [CrossRef]
- Chen, X. Statistical and Activity-Based Modeling of University Student Travel Behavior. Transp. Plan. Technol. 2012, 35, 591–610. [Google Scholar] [CrossRef]
- Ahmed, U.; Moeckel, R. Impact of Life Events on Incremental Travel Behavior Change. Transp. Res. Rec. J. Transp. Res. Board 2023, 2677, 594–605. [Google Scholar] [CrossRef]
- Ren, Z.; Fusco, G.; Lownes, N.; Zhu, J. Entropy-Based Diversity Quantification of Multimodal Transportation Systems: Physical Infrastructure Perspective versus Travel Behavior Perspective. J. Urban Plan. Dev. 2022, 148, 04022029. [Google Scholar] [CrossRef]
- Ilieva, R.T.; McPhearson, T. Social-Media Data for Urban Sustainability. Nat. Sustain. 2018, 1, 553–565. [Google Scholar] [CrossRef]
- 2020 Weibo User Development Report. Available online: https://data.weibo.com/report/reportDetail?id=456 (accessed on 15 October 2023).

Disclaimer/Publisher’s Note: The statements, opinions and data contained in all publications are solely those of the individual author(s) and contributor(s) and not of MDPI and/or the editor(s). MDPI and/or the editor(s) disclaim responsibility for any injury to people or property resulting from any ideas, methods, instructions or products referred to in the content. |
© 2024 by the authors. Licensee MDPI, Basel, Switzerland. This article is an open access article distributed under the terms and conditions of the Creative Commons Attribution (CC BY) license (https://creativecommons.org/licenses/by/4.0/).