1. Introduction
The Russian Federation uses ad valorem land tax, the main purpose of the collection of which should be the sustainable development of the territory, and the focus of this work will be the mechanisms for decision making in this field. The money from this land tax goes to the government’s budget, which should mainly finance the development and reconstruction of local infrastructure. Infrastructural transformations, in turn, change the market prices for land, thereby affecting the results of cadastral valuation. In this case, the value of cadastral cost will have a regulatory character, allowing stimulation of the real-estate market as a whole to increase the investment attractiveness of the territory, becoming that irreplaceable economic lever of real-estate management, which will allow the realization of sustainable and effective development of the territory, increasing the general standard of living for its citizens.
The development of infrastructure for settlements undoubtedly increases the value of land, but the value of a land plot depends not only on its characteristics and location, but also on how the surrounding territory is used [
1]. For instance, investment in the industrial and transport sector creates agglomeration external effects (externalities) [
2], which has a negative impact on the living conditions of the local population, increasing the noise level in the territory of residence [
3].
The European Commission and the World Health Organization have paid much attention to noise pollution in this area, as recent studies reflect the significant damage to urban populations caused by the effects of local infrastructure development. For example, according to the latest data from the European Environment Agency (EAOC), the number of deaths due to anthropogenic noise exposure is about 12,000 annually. Noise is also a cause of cardiovascular disease, affecting approximately 48,000 cases annually. In addition, noise from various modes of transportation is a strong irritant to the nervous system. According to the given statistics, more than six million people do not have the luxury of a good night’s sleep in a noise-free environment, and for this reason, more than twelve thousand schoolchildren fall behind in their school programs [
4].
It is difficult to assess the willingness of real-estate buyers to pay for a favorable environmental situation using mathematical methods in our country [
5]. Experience shows that the establishment of statistical relationships in this group of factors often does not have the ability to explain such a dependence [
6], which indicates a weak market reaction to the negative sides of agglomeration effects.
In both the previous and the new rounds of cadastral assessments, budgetary institutions do not take into account the anthropogenic noise impact in the process of calculating the cadastral value, due to the complexity of preparing the initial information and the lack of a legislative framework for mandatory monitoring the impact of noise on human habitats. The existing elaborations of noise maps for individual territories were created for a specific date for the actual assessment of the anthropogenic impact of the urban environment on the ecological situation, which leaves much to be desired in the territory of St. Petersburg [
7,
8]. However, due to the lack of periodicity of such works and their insignificant coverage of the whole territory of settlements, the obtained data do not find practical implementation in the cadastral assessment of real-estate objects.
Recent discussions have focused on sustainable development goals [
9,
10], as well as on the need to include factors describing negative environmental impacts in real-estate taxation [
2]. One of the problems of this development is noise pollution, which is a problem in many parts of the world, which has prompted researchers to study this issue. For example, in Europe, there is the Directive 2002/49/EC, which regulates the application of noise pollution assessment methods as well as containing regulation for reducing technogenic harm. Foreign researchers have sufficient data at their disposal to successfully take into account the economic effect of the proximity of noise sources based on noise maps of the territory. For instance, Swedish scientists show that the Noise Abatement Program has triggered a 10–12 percent average increase in property prices [
11]. Polish scientists have deduced the NDSI (Noise Depreciation Sensitivity Index), showing the percentage change in property prices per dB increase in noise level [
12,
13]. Italian researchers in a case study identified a decrease in the value of real estate by about 0.3% per unit of noise pollution (dB) [
14]. The issue of noise estimation in the calculation of real-estate cost was also raised by Seoul scientists who proposed their own noise assessment formula, the results of which show that increasing the equivalent level of continuous sonic pressure dB by one unit reduces the real-estate value by 0.53% [
15]. In the USA, the negative noise impact of airports on housing prices has been revealed, the value of which changes by about 2% per noise pollution unit [
16].
The lack of legislative initiatives for the mandatory monitoring of the effects of noise on human habitats has been revealed in the Russian Federation. From the point of view of real-estate assessment, this problem is important, as peace and quiet are the main components in the choice of housing options for individuals. To solve the problem put forward, the purpose of this work is to substantiate the methods of accounting for noise impact when modelling the cadastral value of land for residential development using the created noise maps of St. Petersburg.
2. Materials and Methods
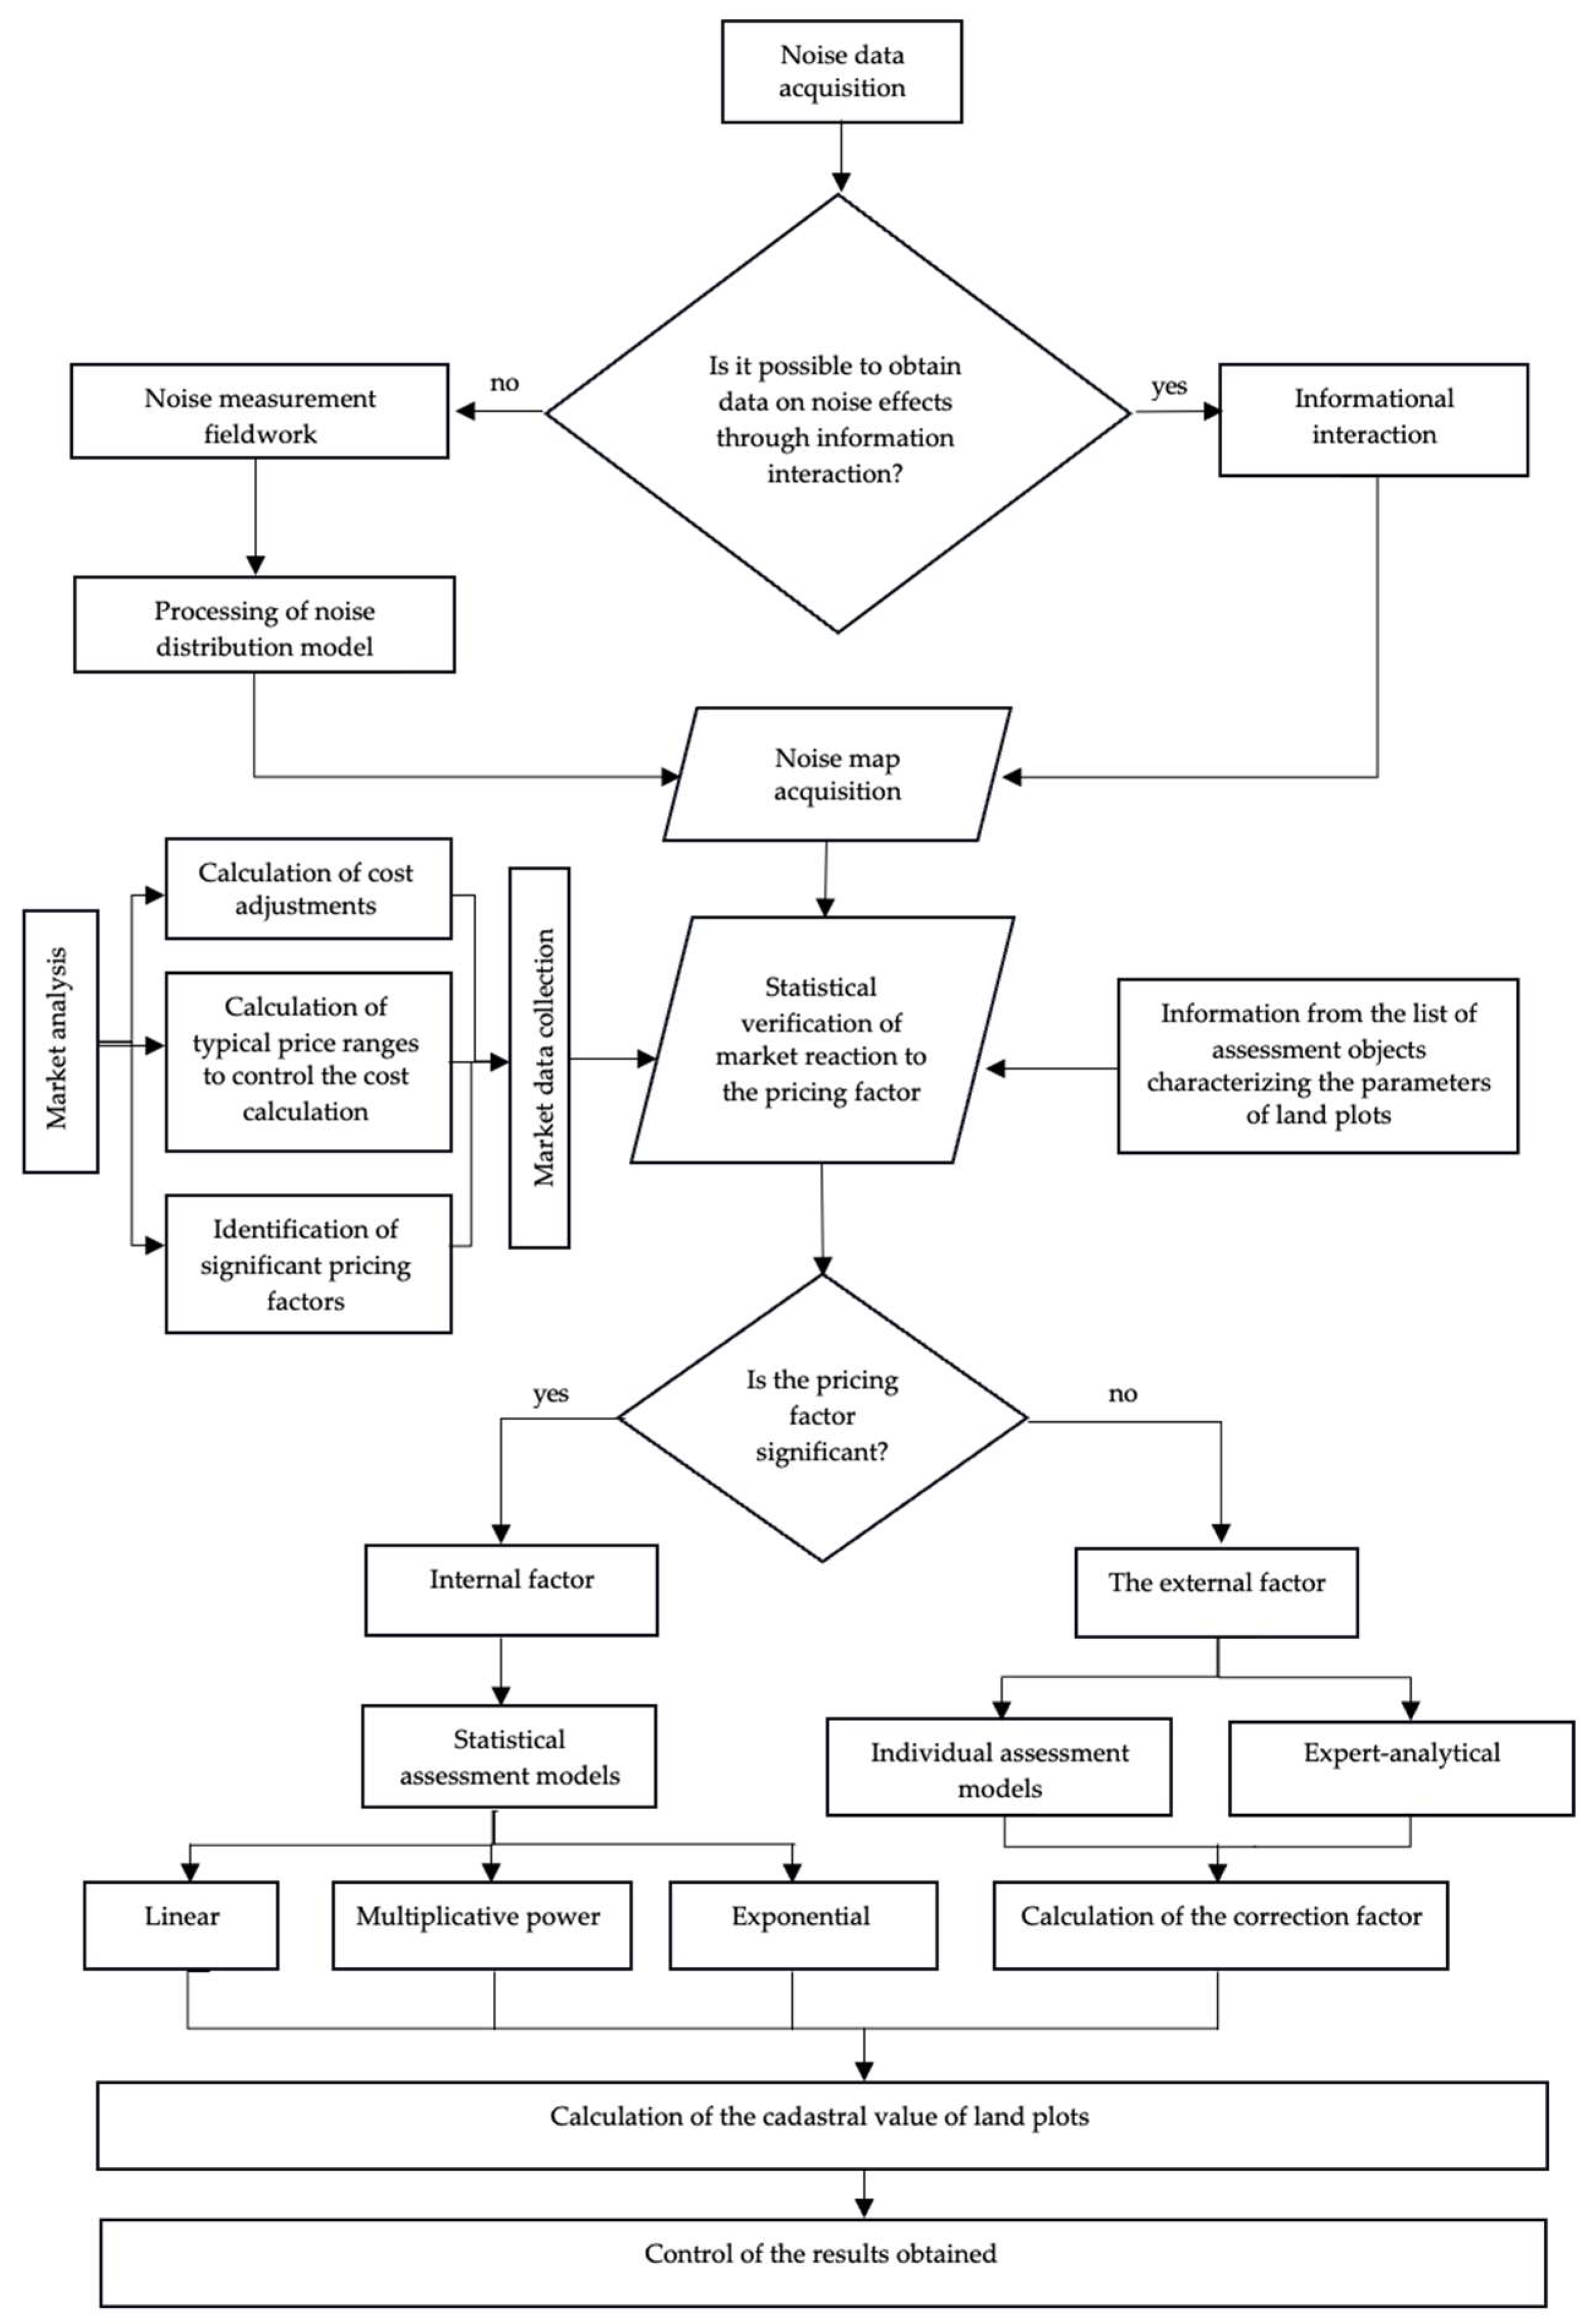
An analysis of existing studies has shown that the environmental group of factors has a weak reaction to the price of real-estate objects. However, there have been no studies of the impact of technogenic noise pollution on the value of land plots in St. Petersburg. In this regard, we propose a methodology for calculating the cadastral value of land plots taking into account technogenic noise impact, described in the form of a block scheme (
Figure 1). This methodology can be defined by the following enlarged sequence of actions:
- (1)
Preparation of initial data on noise pollution: This stage assumes implementation either through obtaining data from specialized state services, or by conducting measurements of the noise indicator in the study area. The result is a noise map.
- (2)
Statistical verification of the market reaction to noise impact: Based on the results of the analysis of the market of land plots for residential development, an information base is prepared (offers for sale and completed transactions, as well as the values of price-forming factors), which is used to test statistical hypotheses about the impact of noise on the value.
- (3)
If there is a market reaction, regression models of cadastral value estimation are used to take into account technogenic noise impact, which will allow the inclusion of it as a new pricing factor.
- (4)
If there is no market reaction, both individual valuation models and expert analytical methods are used. This allows us to calculate a correction factor for the existing cadastral value of the land plot.
Verification of the existence of a land plot market reaction to noise impact is carried out by means of statistical analyses. The fundamental basis of most statistical methods is normal distribution. Practical experience of mass real-estate valuation shows that parameterized cost models perform the best [
17,
18], which encourages specialists to perform initial verification of the normal distribution.
In addition to the analysis of descriptive statistics, there are quite a large number of criteria for testing the normality of distribution. In this study, we used the following criteria: Shapiro–Wilk criterion, Epps–Palli criterion, D’Agostino criterion, Anderson–Darling criterion, Kolmogorov–Smirnov criterion, Lilliefors criterion, Kramer–Mises–Smirnov criterion, chi-square criterion, Harké–Bera test, asymmetry criterion, and kurtosis criterion. As an example, let us take a closer look at the Anderson–Darling criterion. It performs testing of simple hypotheses about the belonging of an analyzed sample to a completely known law (about the agreement of the empirical distribution and the theoretical law , i.e., to test hypotheses of a type with a known vector of parameters of the theoretical law).
The marginal distribution of statistics for the Anderson–Darling criterion is described with the following equation (Formula (1)):
In the above equation, n is the sample size, and are elements of the sample ranked in ascending order.
To quantify the degree of connectivity, a correlation coefficient is calculated, but it assumes a normal distribution of the data. Non-parameterized models use the Spearman–Kendall rank correlation coefficient, which is a universal measure of closeness as it is not related to the normal distribution of the original data and can also estimate the presence of non-linear, but monotonous connections [
19].
In the case of the statistical significance of the impact of noise on the cost of land, it is possible to include it in the economic–mathematical model of cadastral valuation as a new price-generating factor.
The state cadastral valuation guidelines provide three types of statistical models, for which the cadastral value calculation process is carried out as follows:
- (1)
Linear model (Formula (2)):
- (2)
Multiplicative power model (Formula (3)):
- (3)
Exponential model (Formula (4)):
In Equation (4),
is the model value of the dependent variable,
are pricing factors,
are model coefficients, and
is the mathematical constant (Euler number) [
20].
However, the methodological guidelines do not provide a description of the factor “noise impact” in the approximate list of price-forming factors of land plots, as it is specified as a factor of the external environment of land plots [
20]. Since the noise pollution factor has the characteristics of a sound wave, its measurement units are expressed similarly to the equivalent sound pressure level, namely in equivalent decibels (dBA) [
21].
The basic initial information held by the budget institution “City Cadastral Assessment Department” does not contain data on noise indicators in the territory of Saint Petersburg [
22]; therefore, it is necessary to implement interdepartmental information interaction with the Service for Supervision of Consumer Rights Protection and Human Welfare in the City of St. Petersburg, as it has data on the monitoring of physical factors within the framework of the state report [
23].
Noise is derivative of sound, a physical phenomenon. Such a process is described by the oscillation of a wave in an inelastic, solid medium. GOST R 53187-2008 divides the concepts of noise into the following categories: noise in the environment, general noise, noise of a separate source, intermittent noise, tonal noise, and impulsive noise. For monitoring in urban areas, the parameters of equivalent sound level as well as maximum sound level are used. Within the framework of this study, the value of equivalent sound level was chosen, as it takes into account all noise sources into a single indicator with correction for the different human perceptions of high and low frequencies, as the hearing organ distinguishes not the difference between, but the multiplicity of changes in absolute values of sound pressure. The equivalent sound level indicator is calculated on the basis of measured frequencies with a specialized device—the first class noise meter “Ecofizika-110A”, which allows noise monitoring of the environment. Prior to field measurements, the contractor prepares a map showing the approximate location of the measurement points. Such location is justified by sources of noise from transportation infrastructure (planes, trains, highways, etc.). The methodology described in GOST R 53187-2008 does not give clear instructions for determining the position of the device installation for the purposes of territory mapping. The minimum requirements are not less than three points, at a distance of 2 m from the external envelope of buildings or at the nearest point to the noise source boundary of the sites. However, a note is given stating that the results of measurements should provide a tolerance of 5 dBA for the differences in measured values between neighboring points.
It does not make sense to take noise into account as a relative indicator reflecting the distribution of noise pollution over the object area of the assessment due to the presence of a set of vertical structures (walls, additional buildings, fences, etc.) or objects of natural origin, which significantly reduce the propagation of sound waves. Elementary paths of noise propagation in the presence of vertical obstacles are described by the CNOSSOS-EU model [
24]. Optimization of the obtained data is implemented using the pole method theory that uses the triangulation surface as the base [
25], as well as with the help of GRID-models [
26], thus opening up possibilities for applying cloud computing of heavy-weight models [
27].
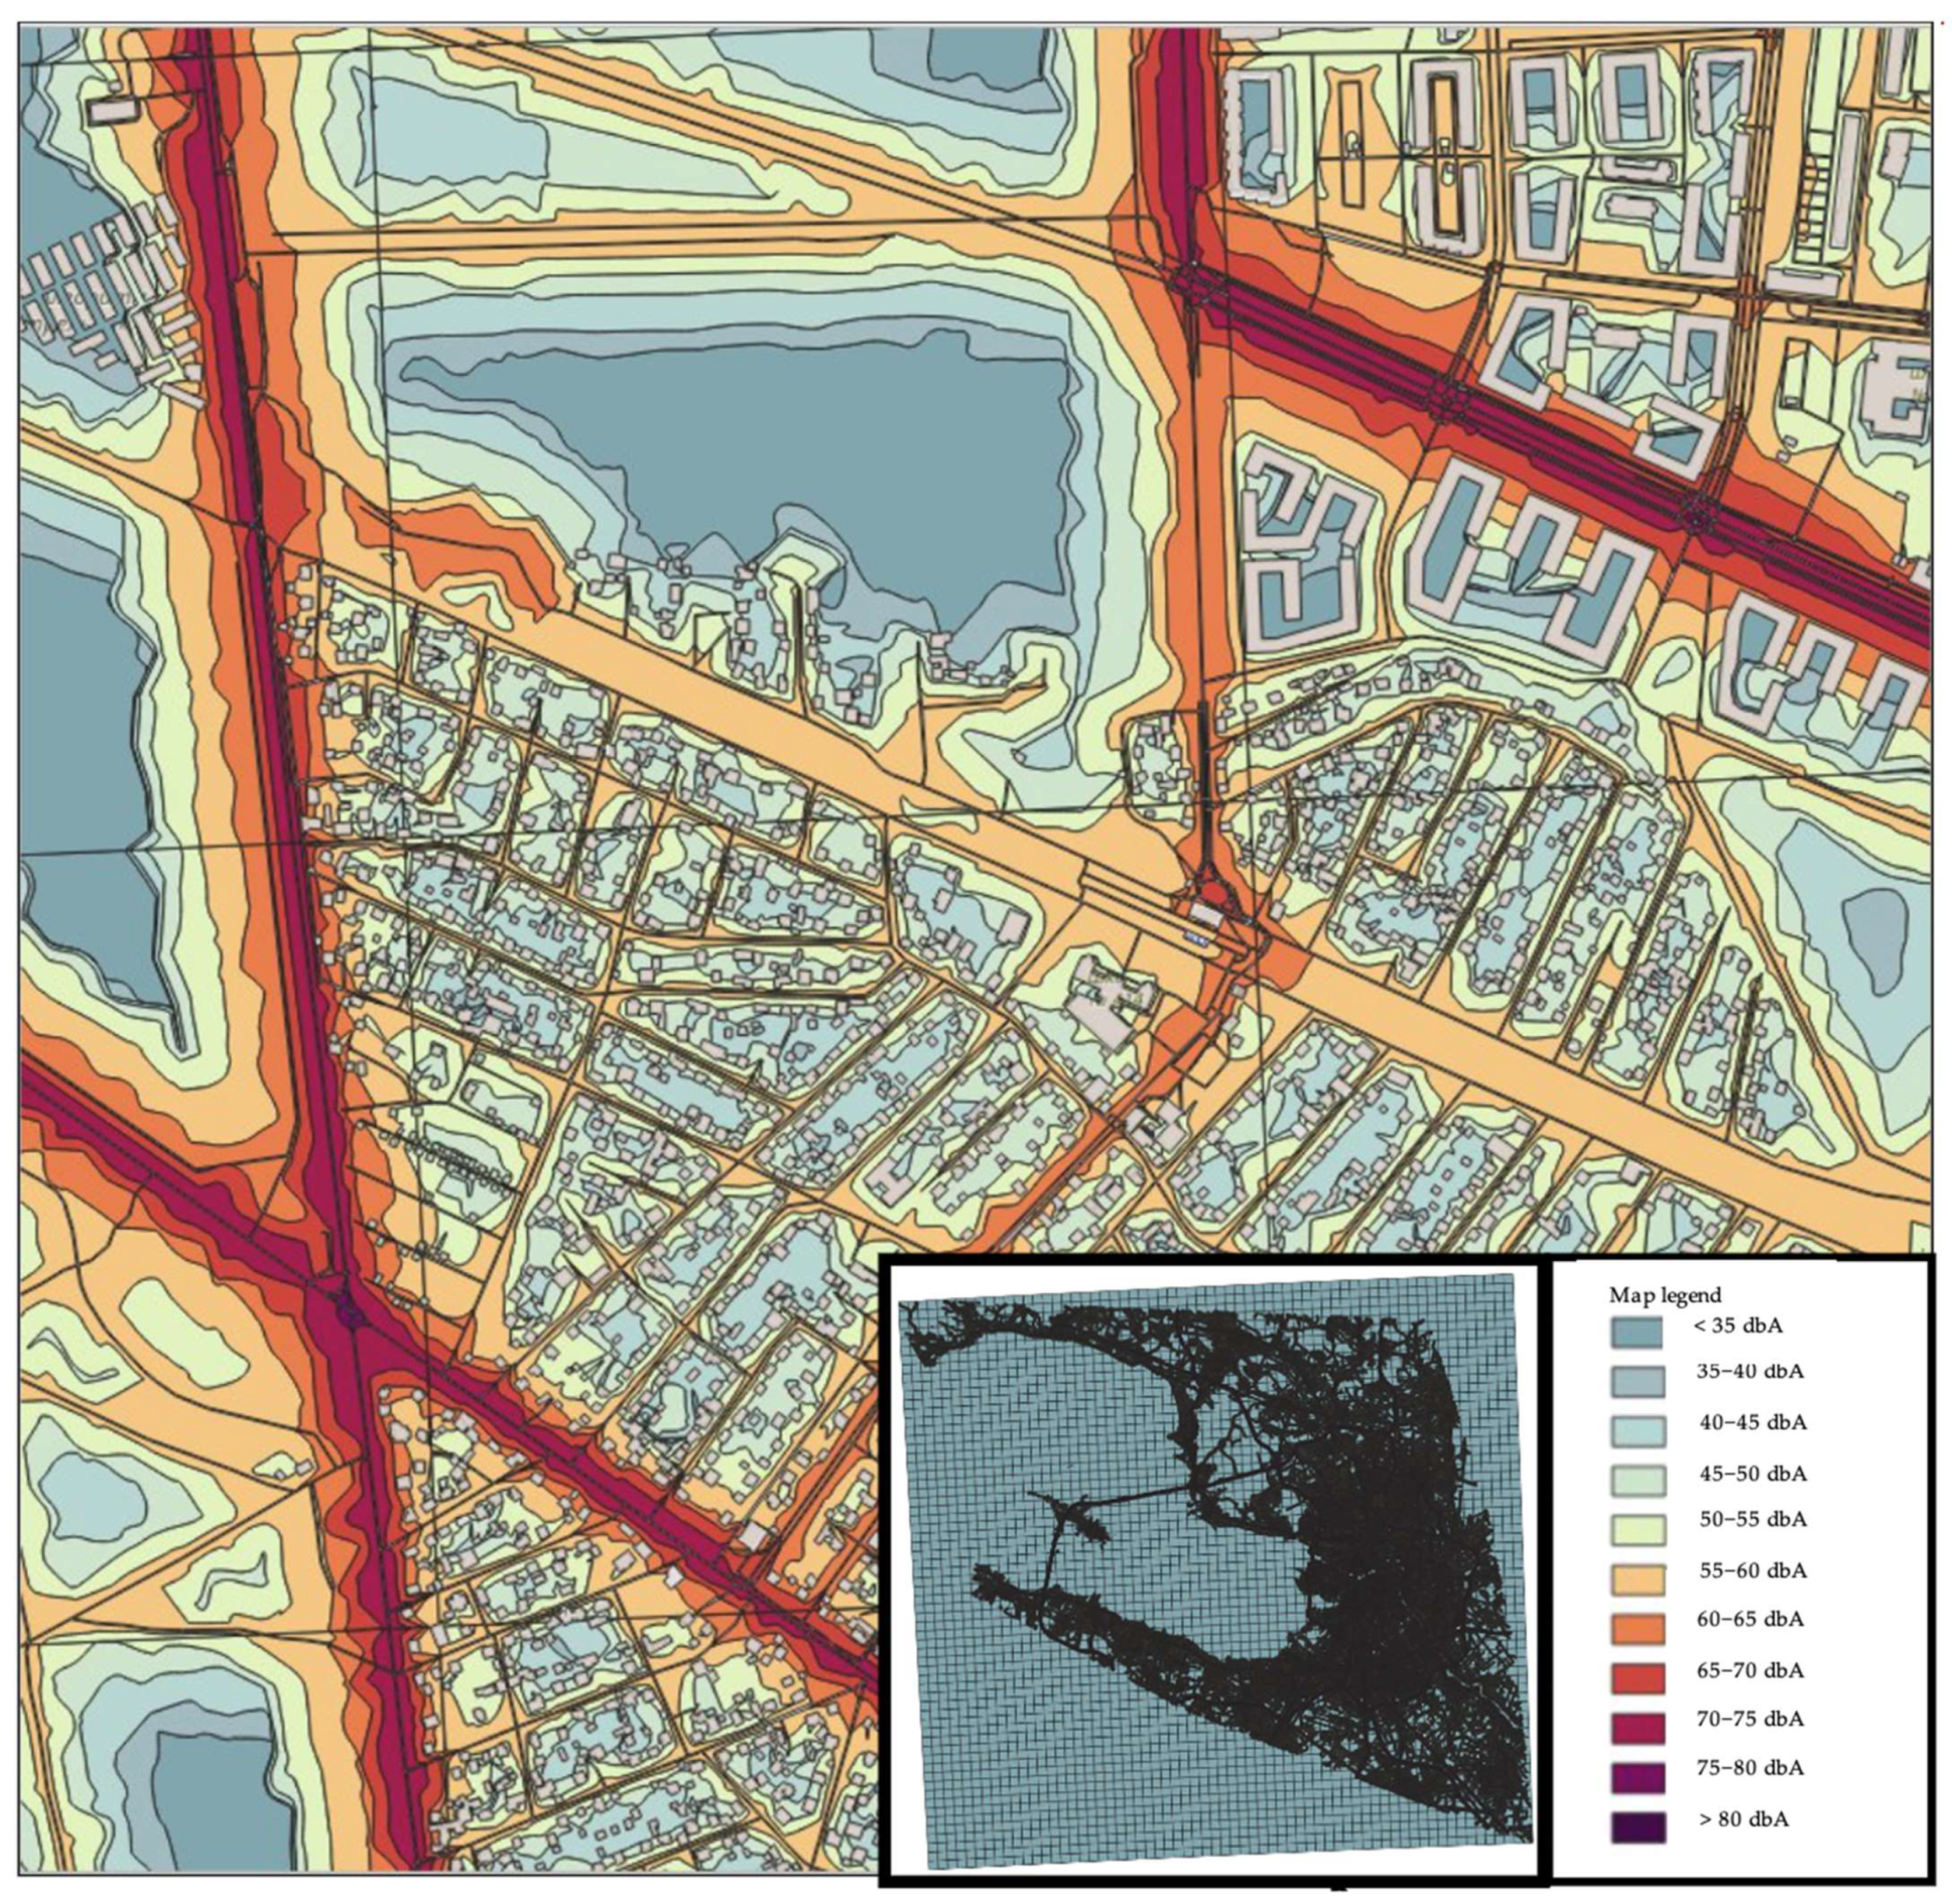
As part of this study, a noise map of St. Petersburg was prepared (
Figure A1).
The lack of market response necessitates the internalization of negative environmental externalities through state regulation of land redistribution or redistribution of the tax burden between land rightholders and rightholders of objects that create noise.
Redistribution of this tax burden can be realized through the cadastral value by introducing a correction factor for noise impact on the cadastral value of the assessment object. This coefficient can be obtained by means of individual assessment methods, which will allow the study of the extreme values of changes in the value of land plots [
28].
The method of paired sales is proposed as a method of individual assessment. A paired sale means the sale of two objects, ideally being an exact copy of each other except for one parameter (e.g., location), the presence of which explains the difference in the price of these objects.
The initial data are offers for the sale of land plots in the following market segments: individual residential development, gardeners’ non-commercial development, and cottage farming, as well as data on noise pollution of the territory in the form of a noise map. The source of our initial data was the CIAN property sale/lease aggregator, which we used to collect market information on land plot sale offers from 2016 to 2023 in the amount of 953 pcs. Considering the differentiation on the terms of the transaction of the original sample of data, the following types of adjustments were introduced: adjustment for the type of announcement (transaction/sale), adjustment for the urgency of the sale, adjustment for the date of the transaction/sale, and discount for the size of the land plot.
From the proposals, in addition to information on the terms of the transaction, the values of the following price-generating factors were collected: proximity to local centers, proximity to social infrastructure facilities, proximity to water bodies, greenery in the valuation object’s surroundings, availability of engineering infrastructure, and the presence of encumbrances (land use restrictions). For correct identification of the object, a search of the cadastral number of the land plot was also carried out.
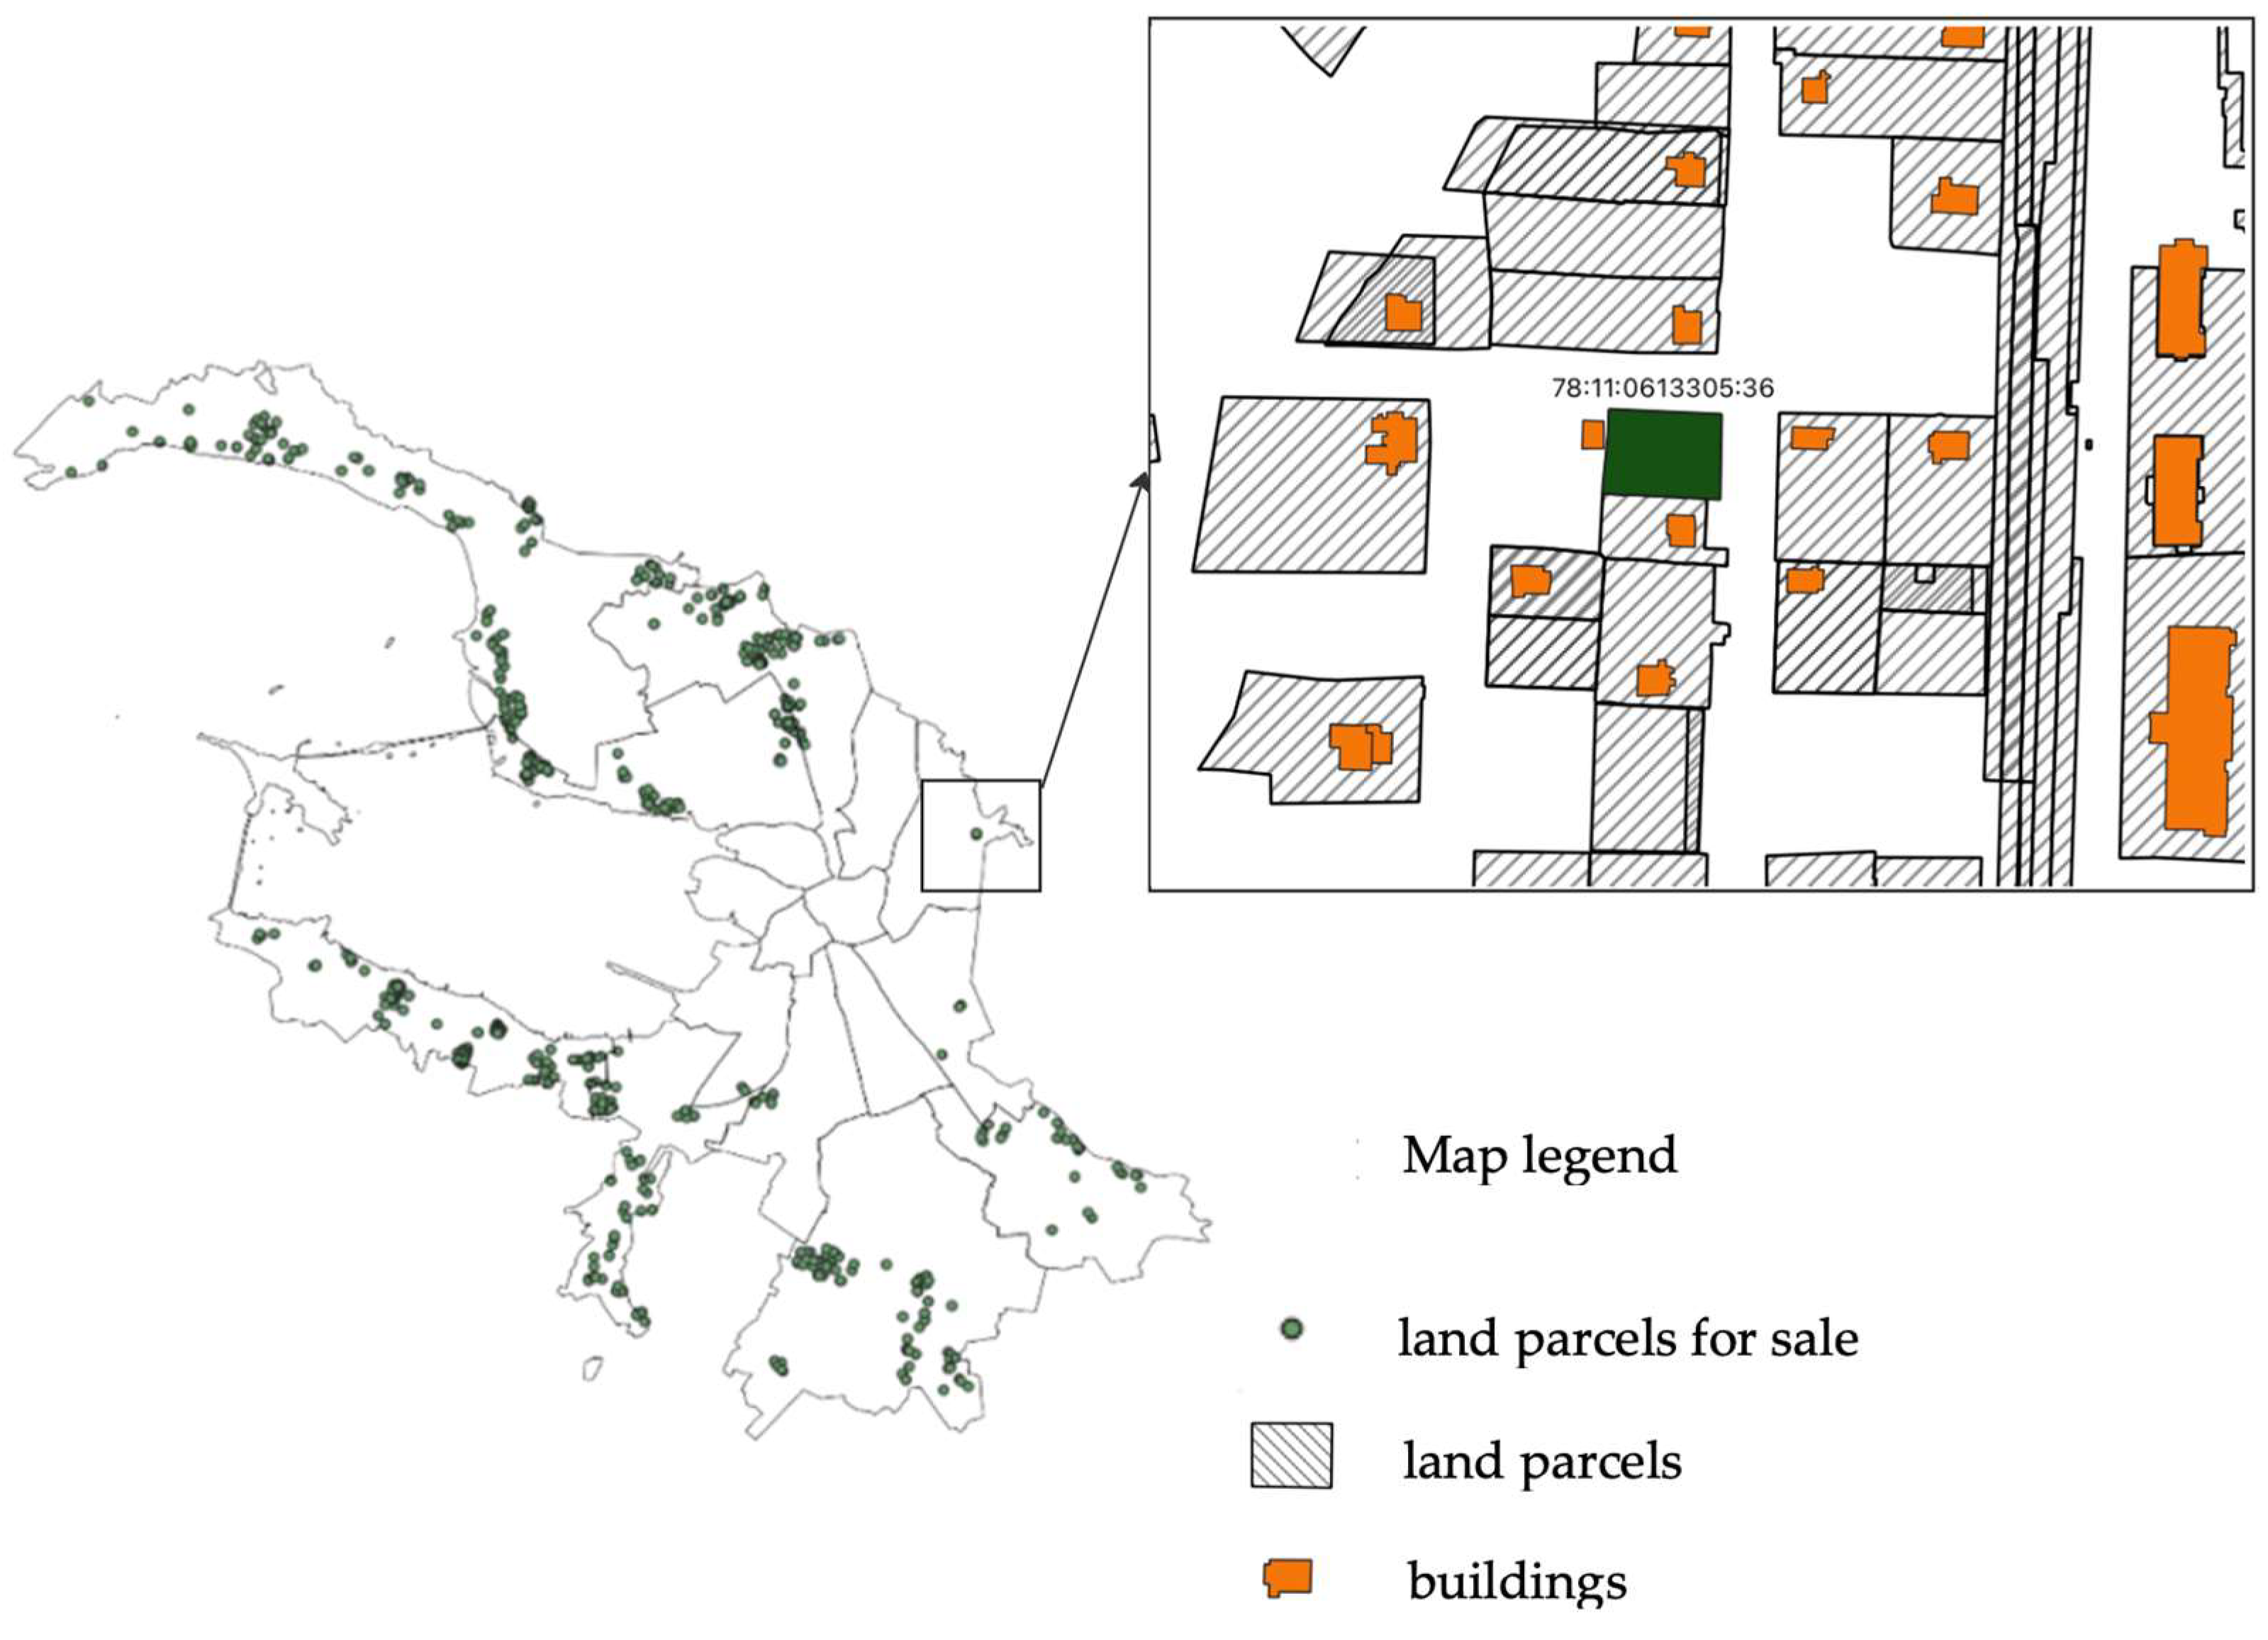
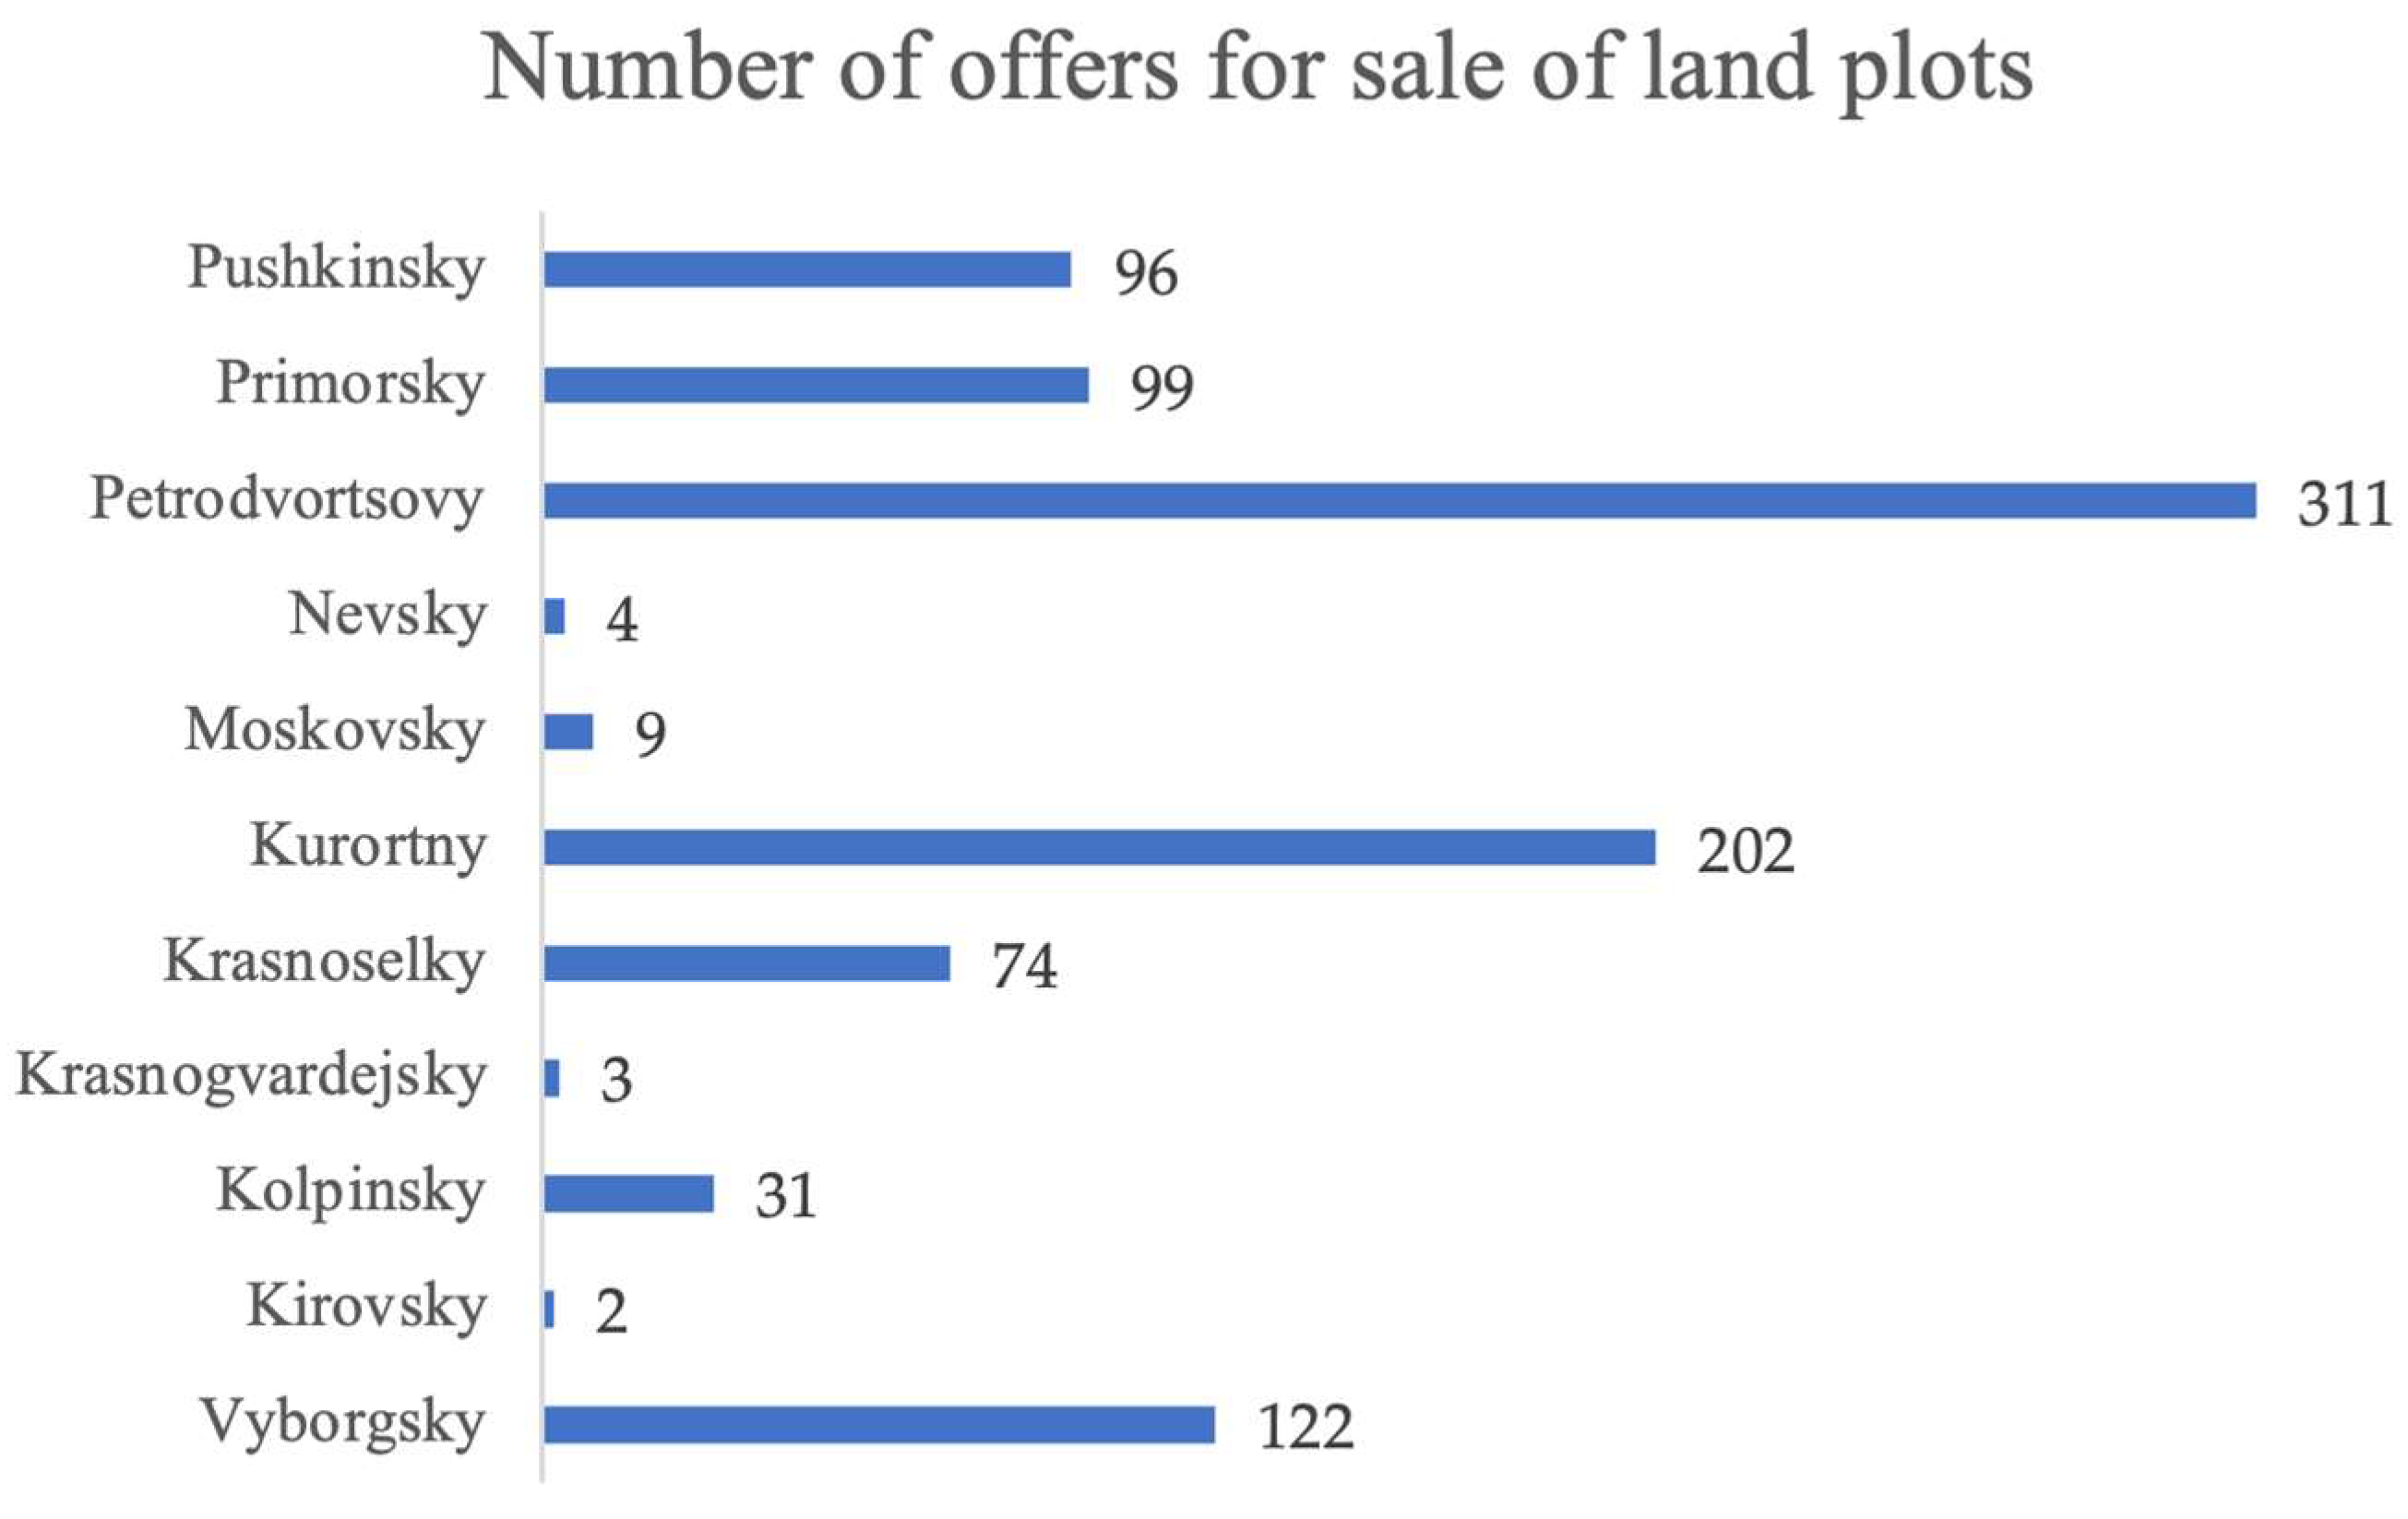
The distribution of the market data for the territory is presented in
Figure 2, and, sorted into administrative districts, in
Figure 3.
During the analyzed period, the market of plots for individual residential construction was closely connected with the market of plots for gardeners’ non-commercial development and horticulture and, in fact, formed a single whole with it, which allows them to be combined into one segment of the real-estate market.
To the greatest extent, the price of land is influenced by its location: remoteness from the city, and town-planning restrictions. At the same time, the majority of transactions now take place with plots located outside the Ring Road, as there is practically no free land within the city boundaries. Lack of engineering provision reduces the cost of the plot by a quarter on average. The third-most important factor in price formation is the area of the plot [
31].
To control further determination of the cost, the main ranges for this market segment were determined, which were as follows:
According to the results of our analysis, it was concluded that the market of plots for low-rise residential development was quite active in the analyzed period. The land market for this market segment had a sufficient number of offers, as well as there being open information on transactions, which allows the application of the comparative approach for the assessment of such objects.
3. Results
The development of a mechanism of noise factor accounting and regulation on the basis of this market (first introducing noise accounting into the taxation process, and simultaneously creating an information field about noise pollution for people to access via market entities) is necessary for civilized transaction processes and fair taxation. Therefore, it is necessary to use a gradation value of the qualitative factor of the noise indicator to the object of the assessment, because the provision of access to information on the presence of high levels of sound (audibility of cars, aircraft, railway transport, industrial zones, etc.) in the territory negates the transaction costs of buyers and sellers to collect information on the external environment of a facility, which, in turn, will allow them to take into account the characteristics of the negative environmental situation.
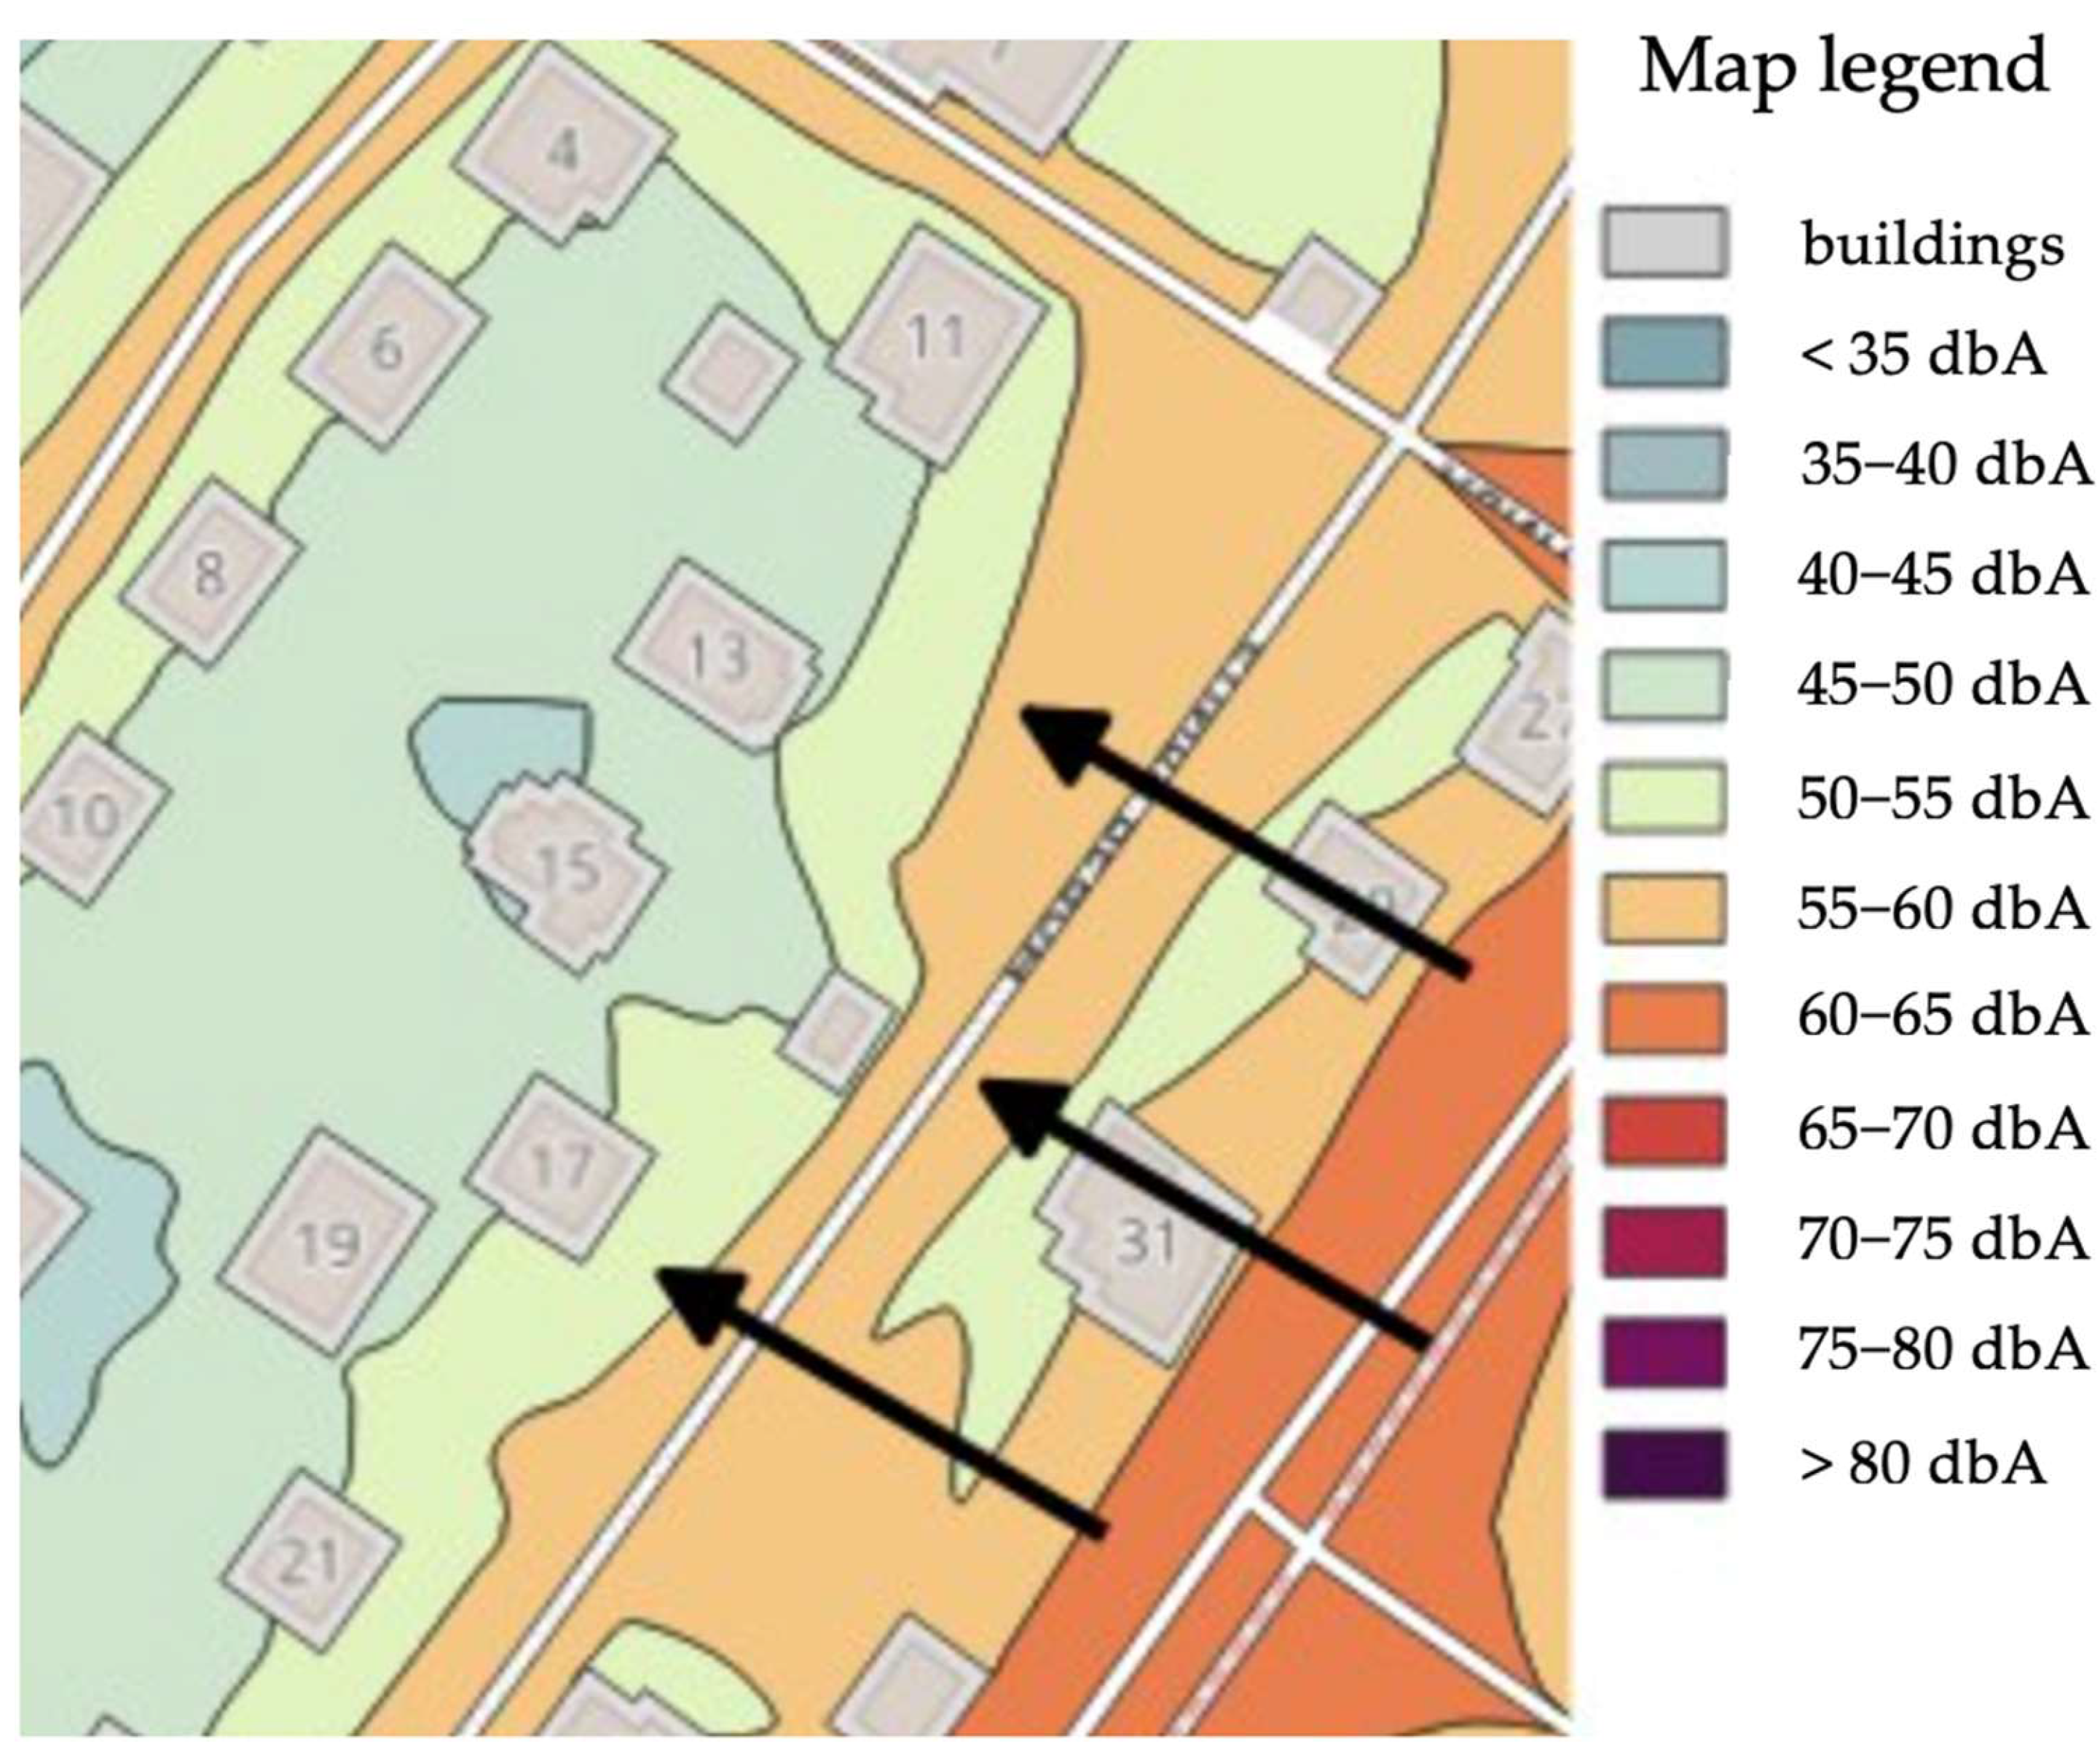
Consider the example of noise propagation from motorways in the gardening and horticultural development of St. Petersburg, which is presented in
Figure 4. The illustration shows that the presence of structures on the propagation path of sound waves from motorways affects the geometric shape of the isoline, which is a reflection of a certain sound pressure level indicator.
As a gradation of the noise indicator, both foreign and domestic scientists suggest using the scale presented in
Table 1 [
32,
33].
In order to implement the algorithm for assigning a gradation value to the qualitative factor of the noise indicator, it is necessary to have a spatial representation of the data. The initial information for the procedure of noise factor value preparation is presented in
Figure A1, reflecting the geoinformation layer of noise pollution.
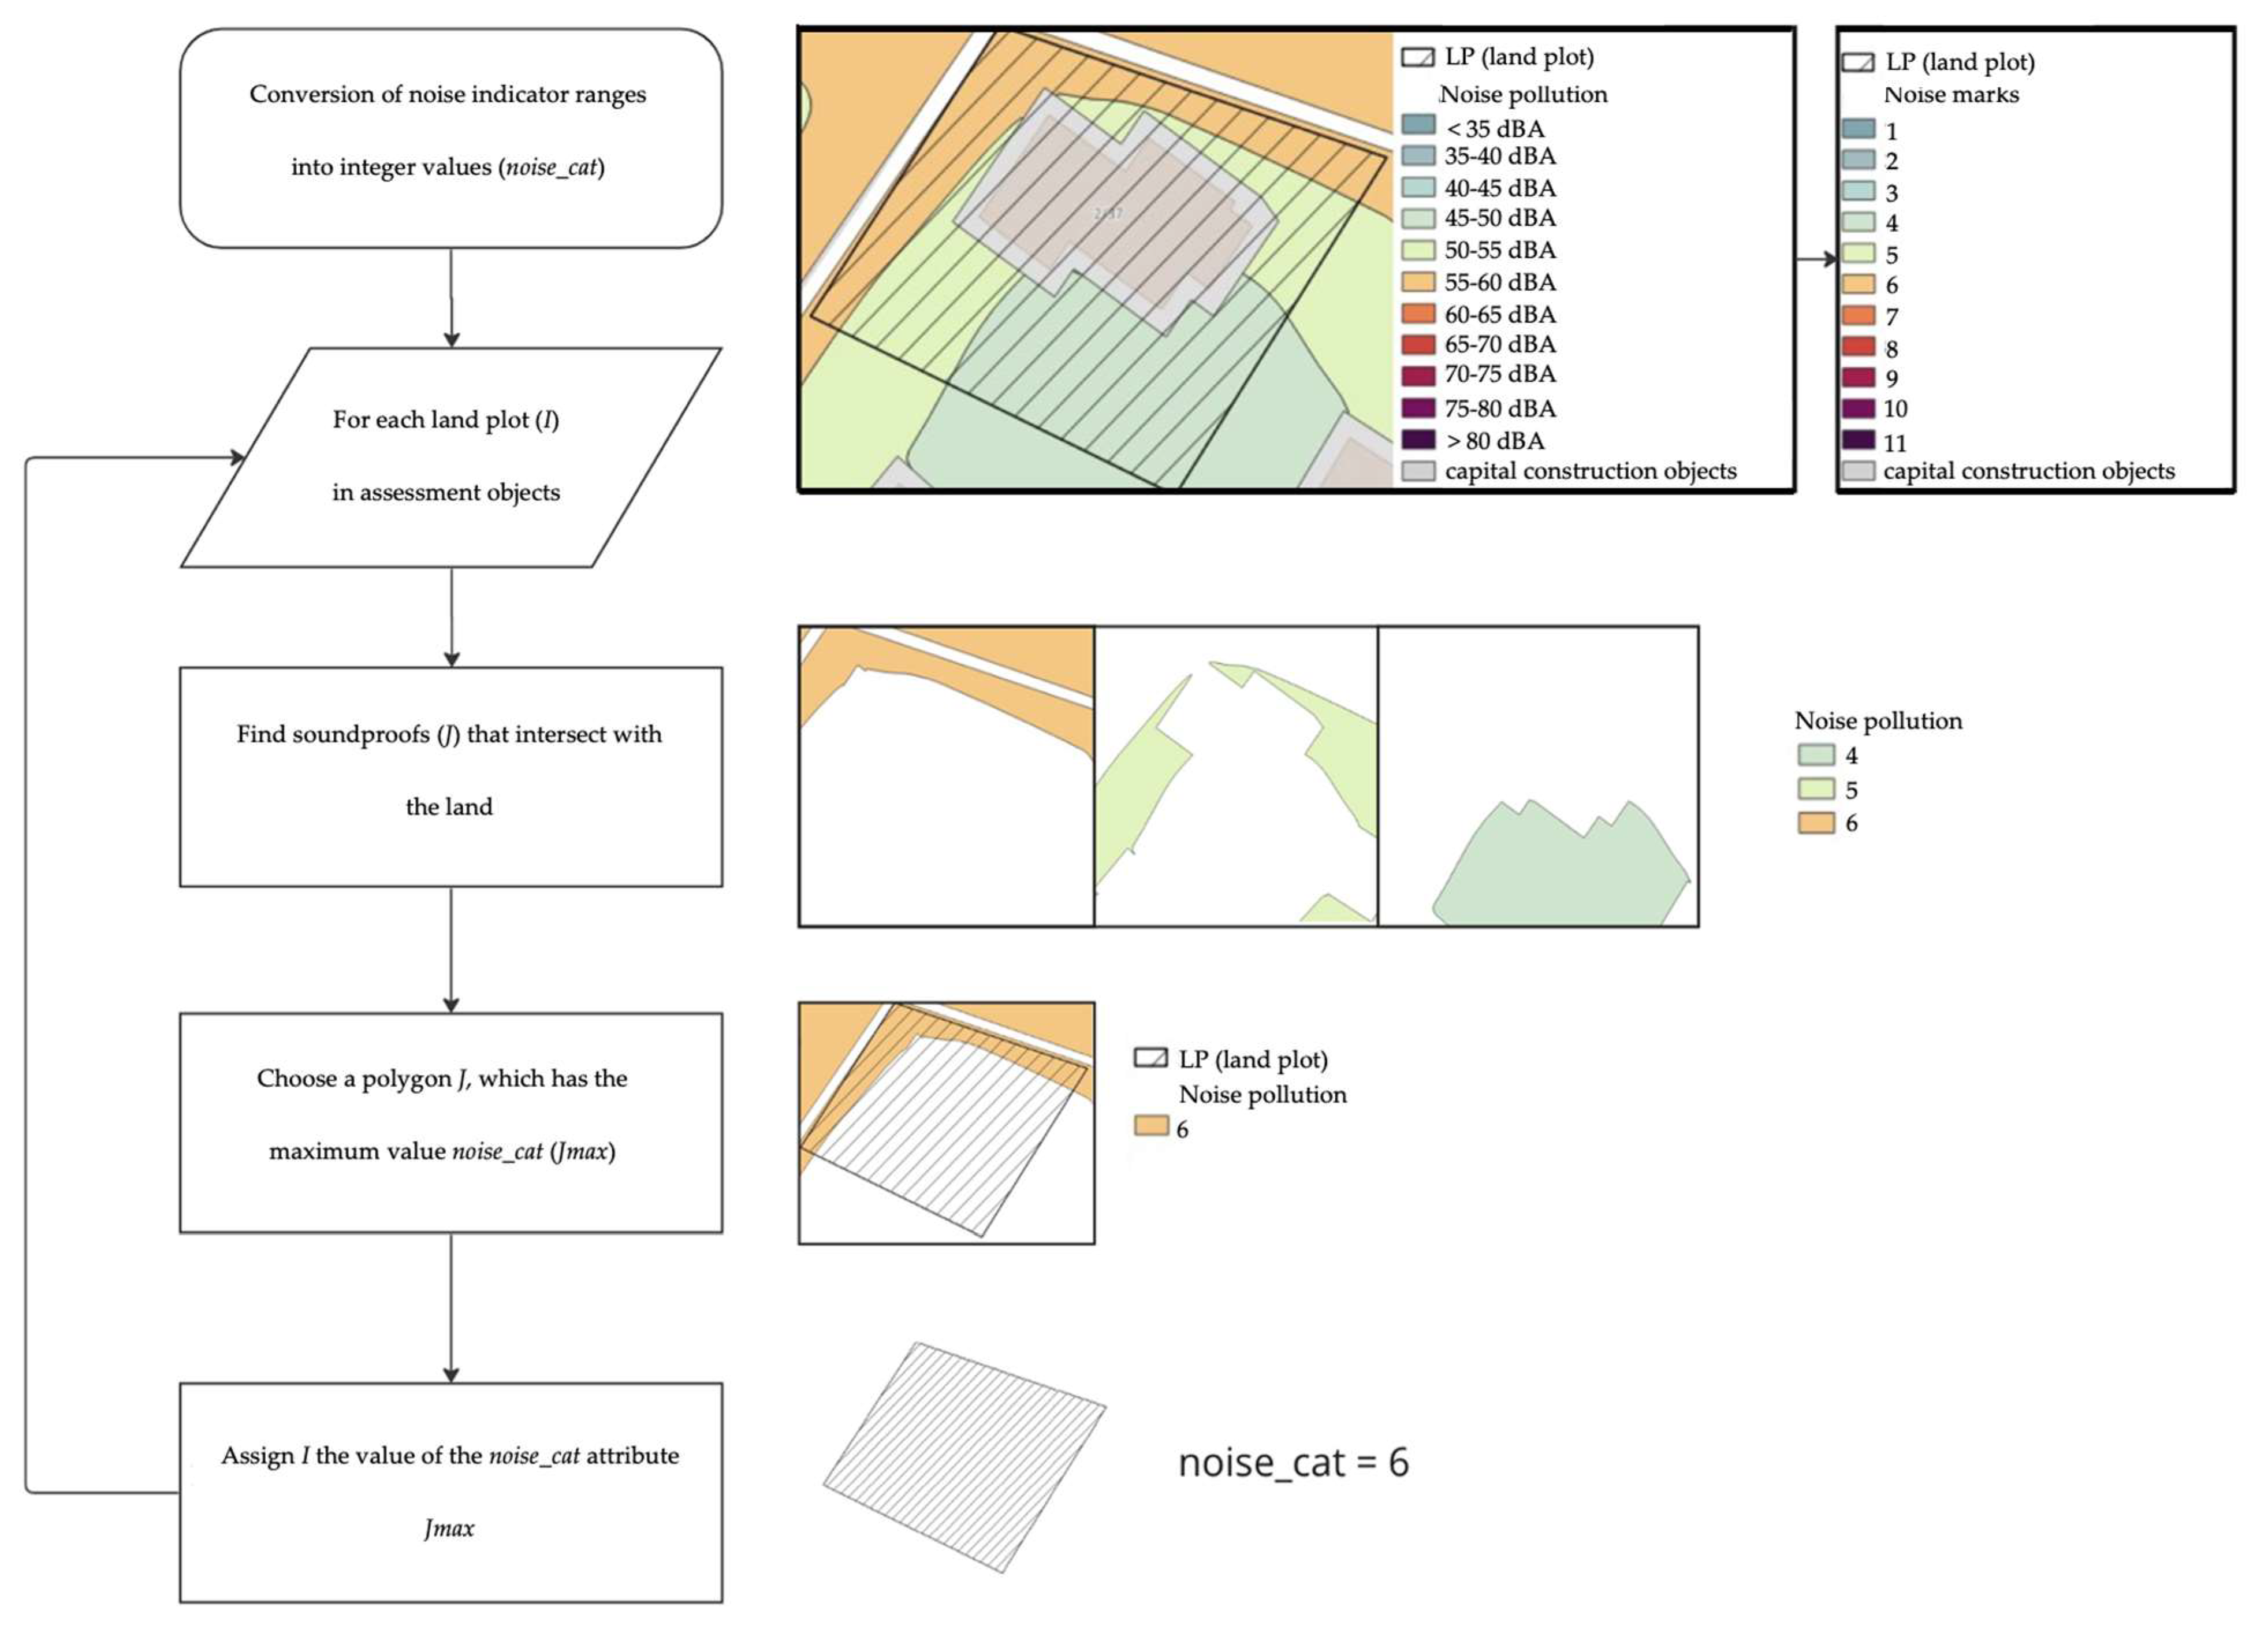
Next, using geospatial operations, it is necessary to implement a mechanism for transferring the gradation values of the noise indicator into the attributive information to each object of assessment. The general implementation of this algorithm is presented in the form of a scheme (
Figure A2).
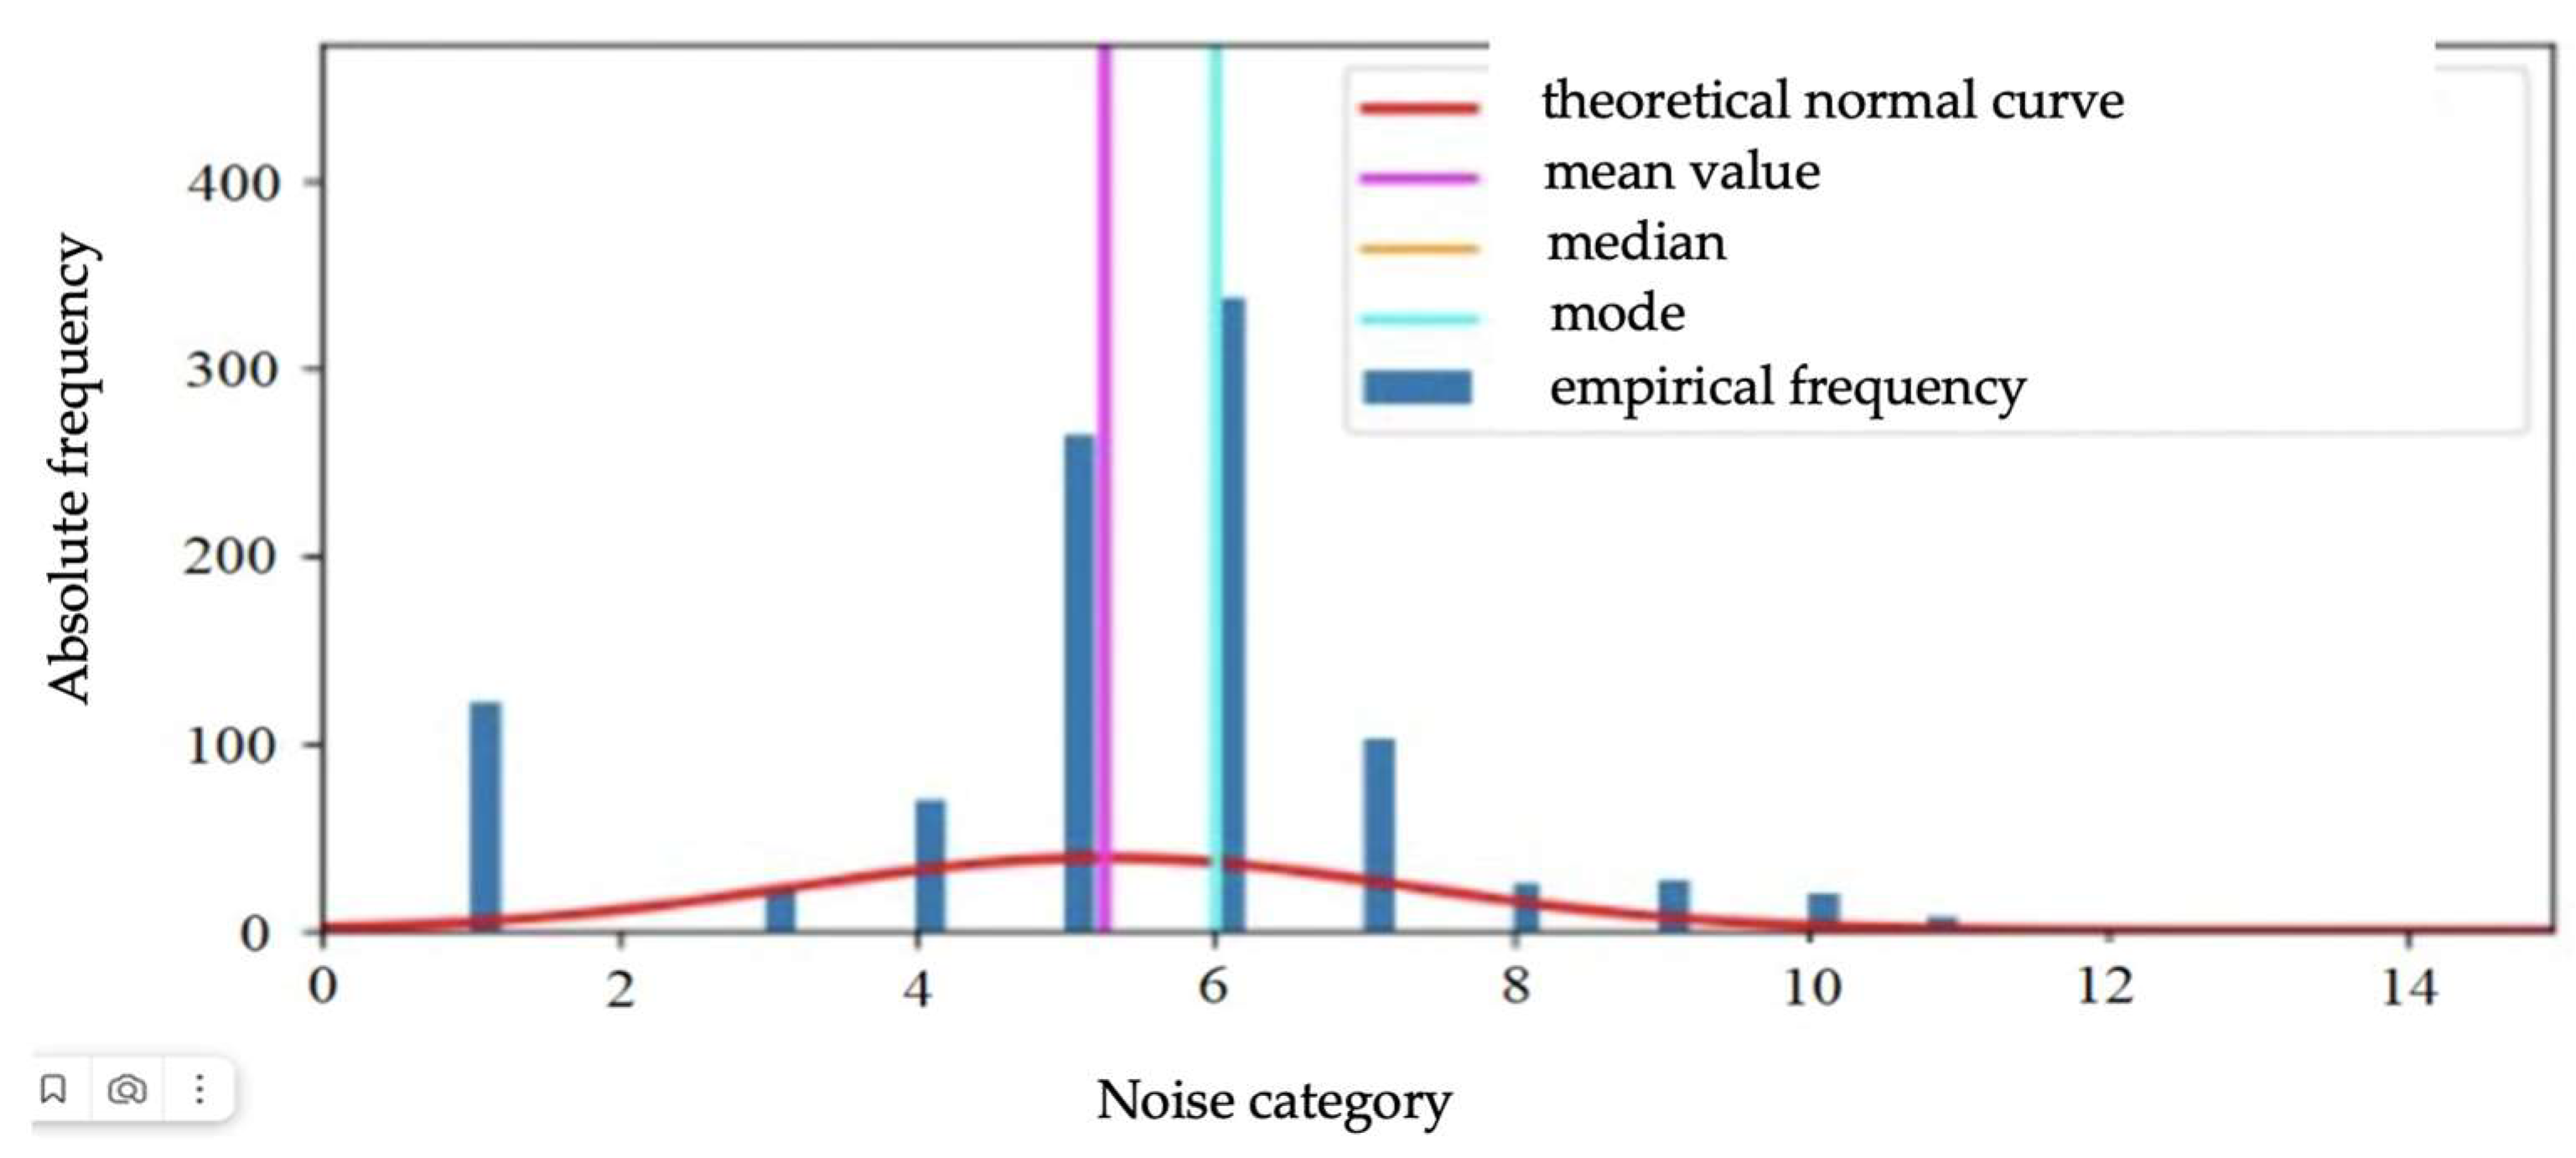
For visual analysis, as well as for further calculations, the programming language Python 3.10, with the calculation module Scipy/statistics [
34] was used. The constructed histogram of frequency distribution of values of the factor “noise impact” in
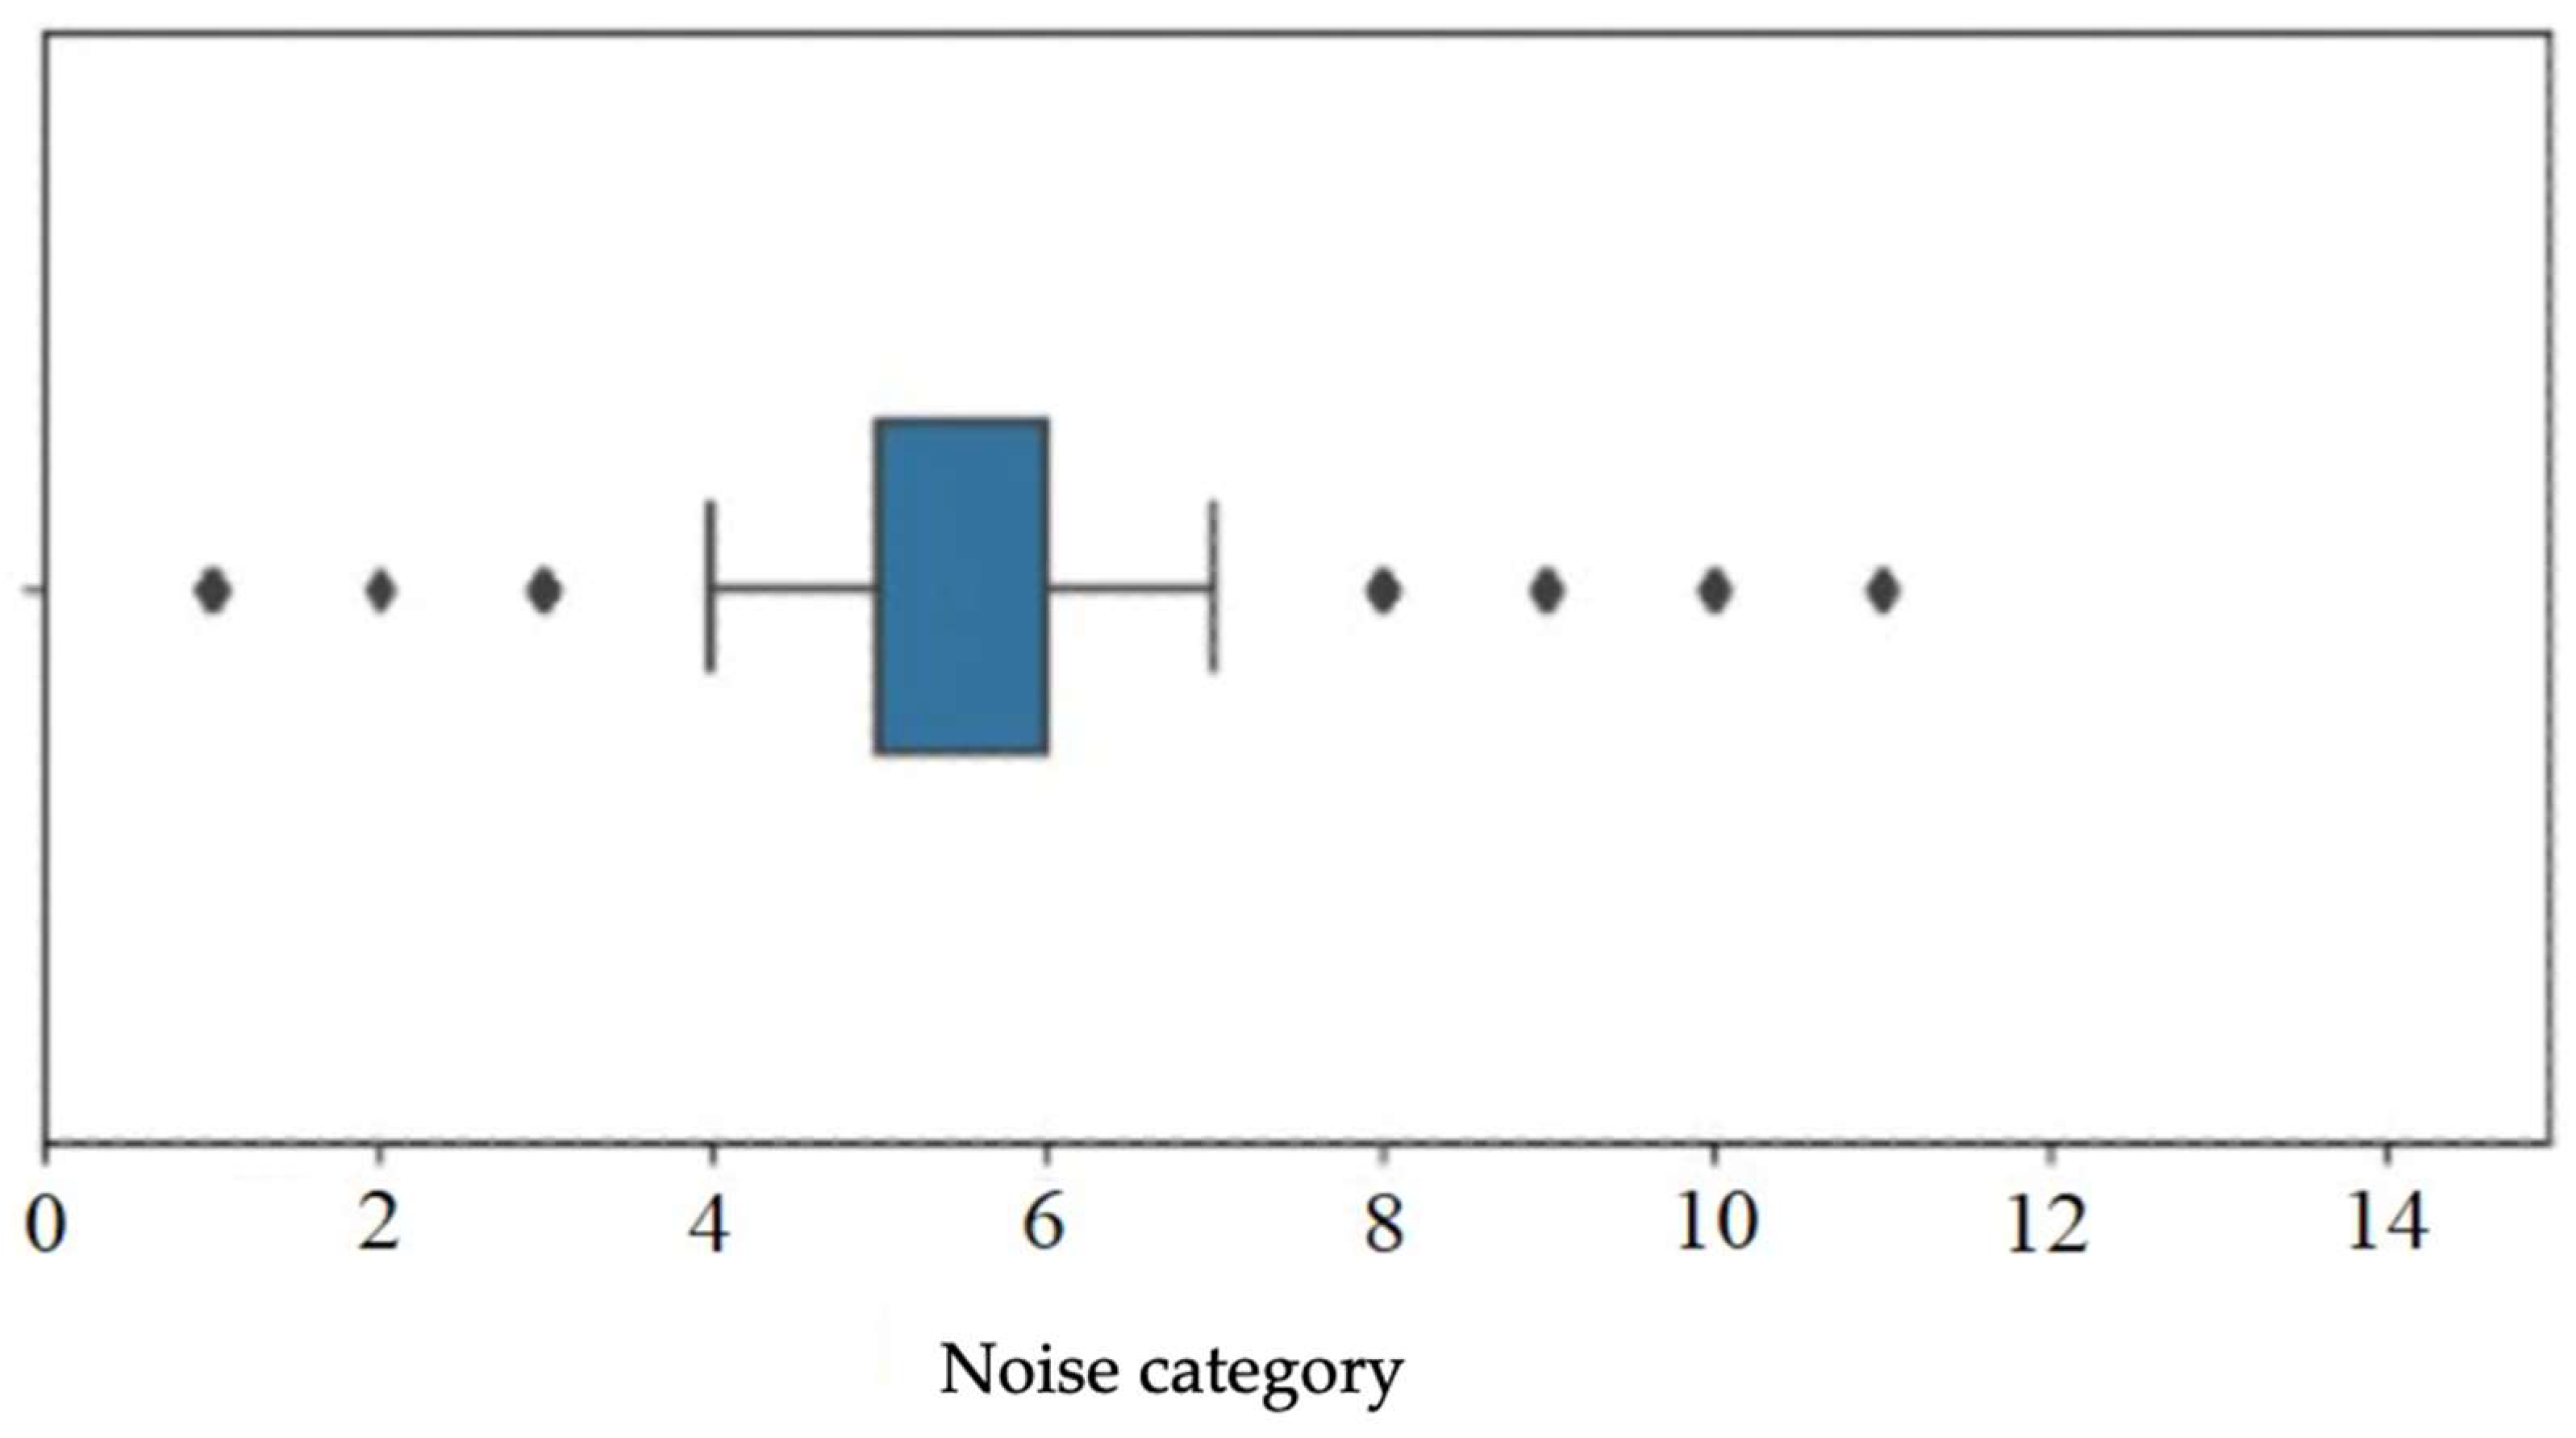
Figure 5 significantly deviates from the theoretical normal curve. Also, on the bulb diagram in
Figure 6, we can observe the presence of abnormal values.
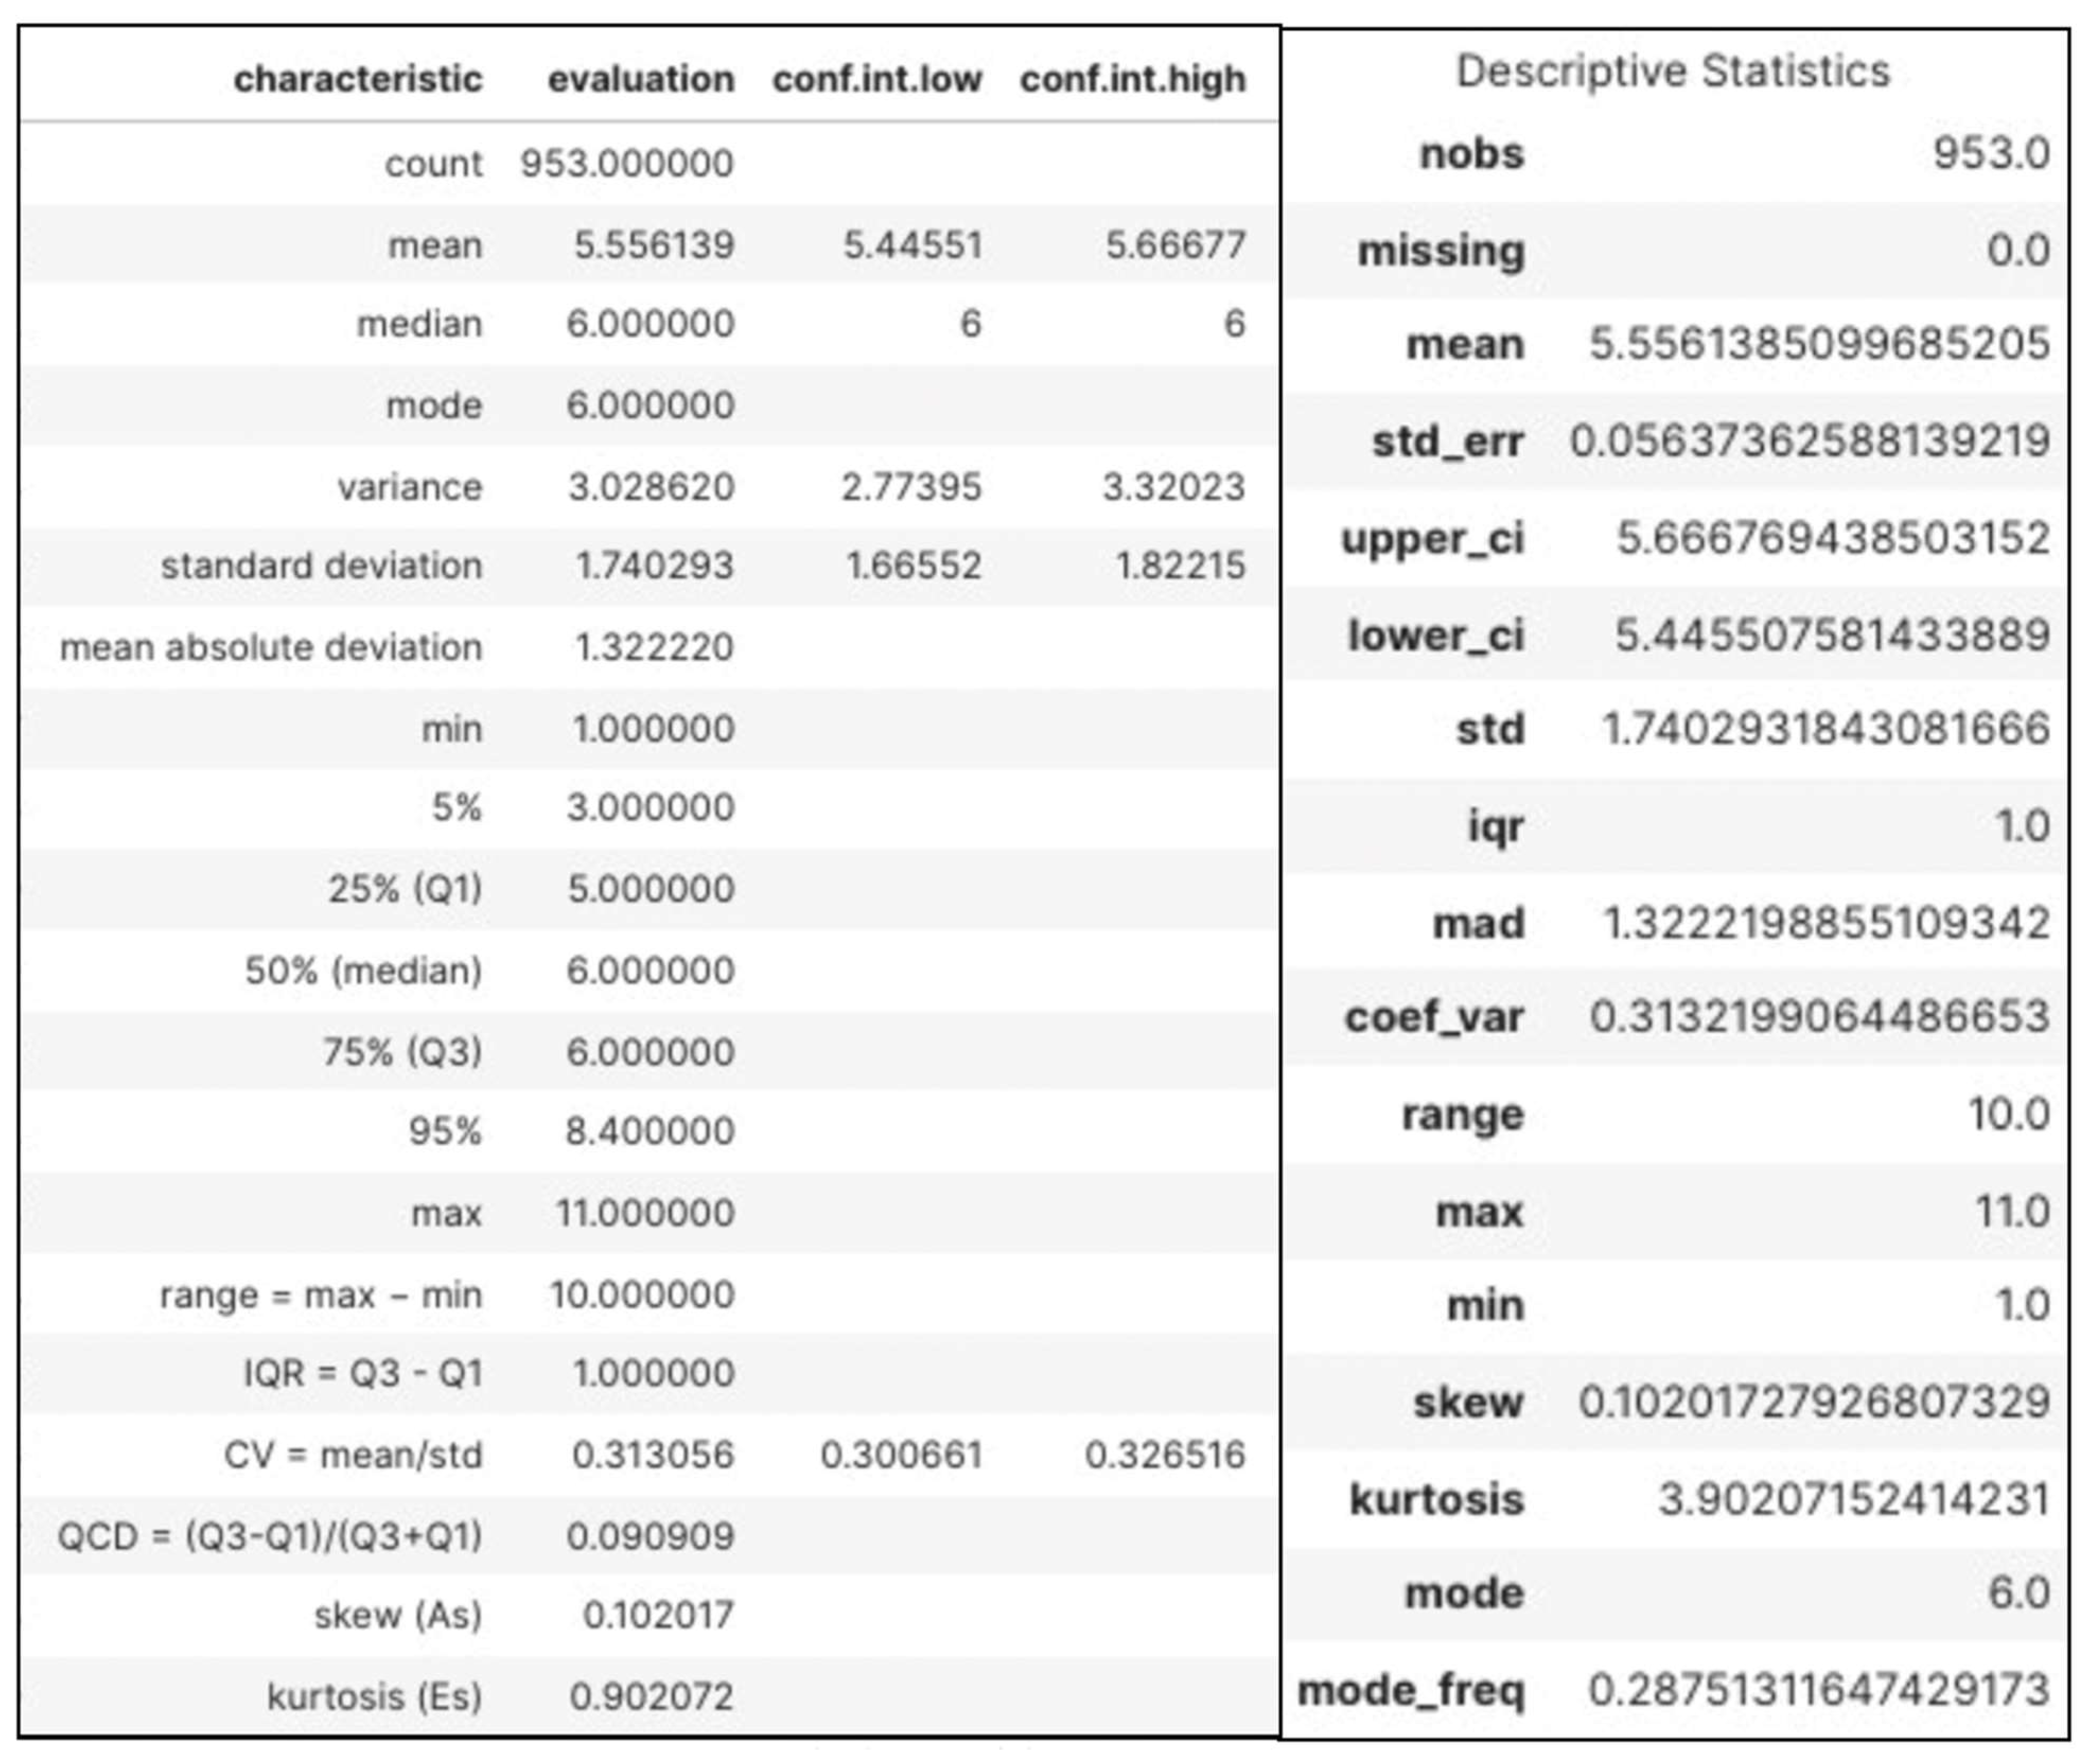
More-precise criteria were derived from descriptive statistics (
Figure A3), which are summarized in
Table 2. The coefficient of variation being equal to 0.30 and the close value of the skewness index (0.10) shows the homogeneity of the data, but the kurtosis coefficient (3.90) and the comparison of the arithmetic mean with the mode contain contradictory indicators.
To eliminate uncertainty, it is necessary to conduct a number of statistical tests to test the hypothesis of normal distribution of data.
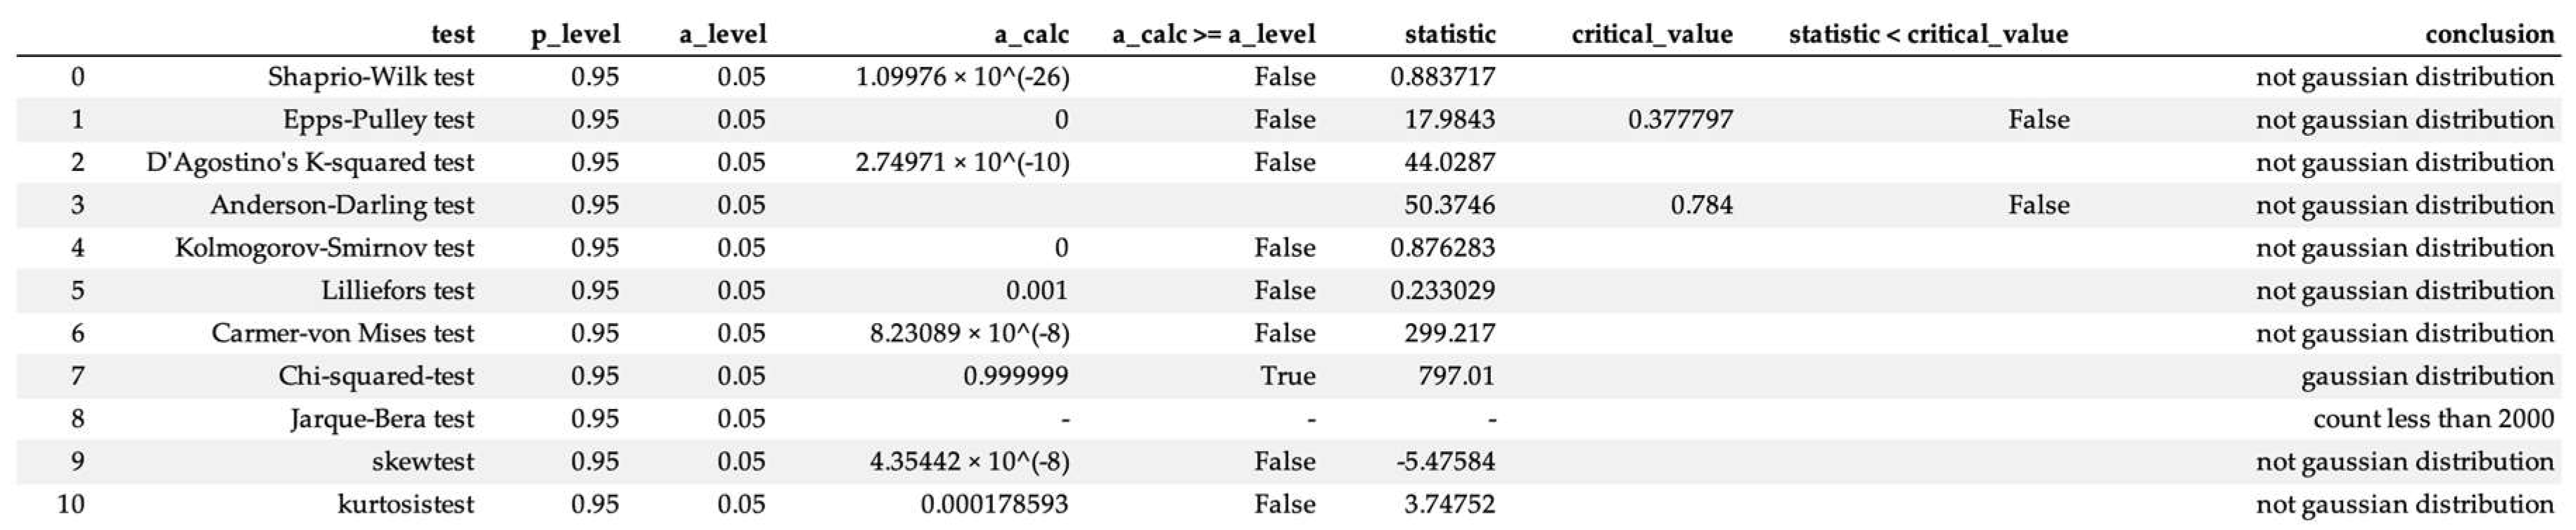
Figure 7 shows the resulting table of the tests performed. Out of 10 variants, only the chi-squared criterion showed that the data had a normal distribution, so it was concluded that the model type was non-parametric.
Correlation analysis can be used to identify trends by calculating and validating the importance of indicators of the tightness of connection between the “noise impact” factor and the price, but the presence of trends in the values of indicators can lead to a false correlation. Various methods can be used to test for randomness and identify trends. The simplest method is the test the average level difference, where a series is divided into two parts, each of which is treated as a separate sample, and then the hypothesis of equality of its mean values is tested. If the data are normally distributed, the Student’s criterion can be used; otherwise, non-parametric methods should be used.
Since the normal data distribution hypothesis was rejected, non-parametric indicators such as Spearman’s rank correlation coefficient and the Mann–Whitney, Abbe, and Foster–Stewart criteria [
19] were used for testing. This calculation was realized using software [
30], the result of which is summarized in
Table 3.
Most criteria reject the normal data distribution hypothesis, but some criteria show the opposite. Cox–Stewart requires the discreteness of the values to be processed (at n > 40), and may give an incorrect prediction if this condition is not met. It follows that methods based on the idea of a normal distribution of data cannot be used to find the connection.
The correlation coefficient is often used to quantify the degree of connection, but its use is not justified in non-parametric models. However, it is possible to use universal coefficients. The Spearman and Kendall’s rank correlation coefficient is a universal indicator of the tightness of connection, because it is not related to the assumption of normality of the initial data distribution, and can also assess the presence of non-linear but monotonic relationships. If we calculate the values of the correlation coefficient and the Spearman coefficient for the same data, the closer the obtained results are, the less the correlation relationship will differ from the linear one. This property can be used when selecting the type of functional relationship between noise pollution and the value of land plots. The result of the calculation is presented in
Table 4.
The calculated significance level for both criteria was greater than the 5% confidence interval (Kendall’s coefficient = 0.12, and Spearman’s coefficient = 0.11). In addition, the test using the Student’s criterion showed the absence of connection, which indicates the insignificance of the influence of noise pollution on the value of land plots, i.e., the absence of a market reaction to noise pollution. This is due to the fact that the concept of the pricing of objects in the land market does not consider the environmental situation as a significant factor in the acquisition of real estate, because it does not have full information about the presence of various types of pollution [
35,
36].
Therefore, there appears the need to take into account the noise factor as an externality, which is possible by obtaining a correction factor to the value of land plots. In this case, the correction factor is made possible via the method of paired sales. For this purpose, it is necessary to determine twice the market value of two land plots where any extremes exceeding the noise limit (55 dBA) are observed, with and without adjustments for noise. Pairs of sales were selected due to the most identical site parameters, except for one characteristic, which further allowed us to determine the dependence of the price change on the exceedance of the maximum-permissible noise level.
The objects of valuation were land plots with cadastral numbers 78:12:0007153:2071 and 78:40:0019282:6064. Their prices were adjusted to the terms of the transaction. The implementation of the paired-sales method for the land parcel 78:12:0007153:2071 is presented in
Table 5 and
Table 6 (with and without noise impact, respectively).
Similarly, the cost of land plot 78:40:0019282:6064 was calculated, which is presented in
Table 7 and
Table 8 (with and without noise impact, respectively). An analysis of the impact of extreme noise on the cost of land plots can be conducted by calculating the size of the noise adjustment, by obtaining the difference in values with and without taking into account the exceedance of the normative permissible noise index of 55 dBA, respectively. This calculation is presented in
Table 9.
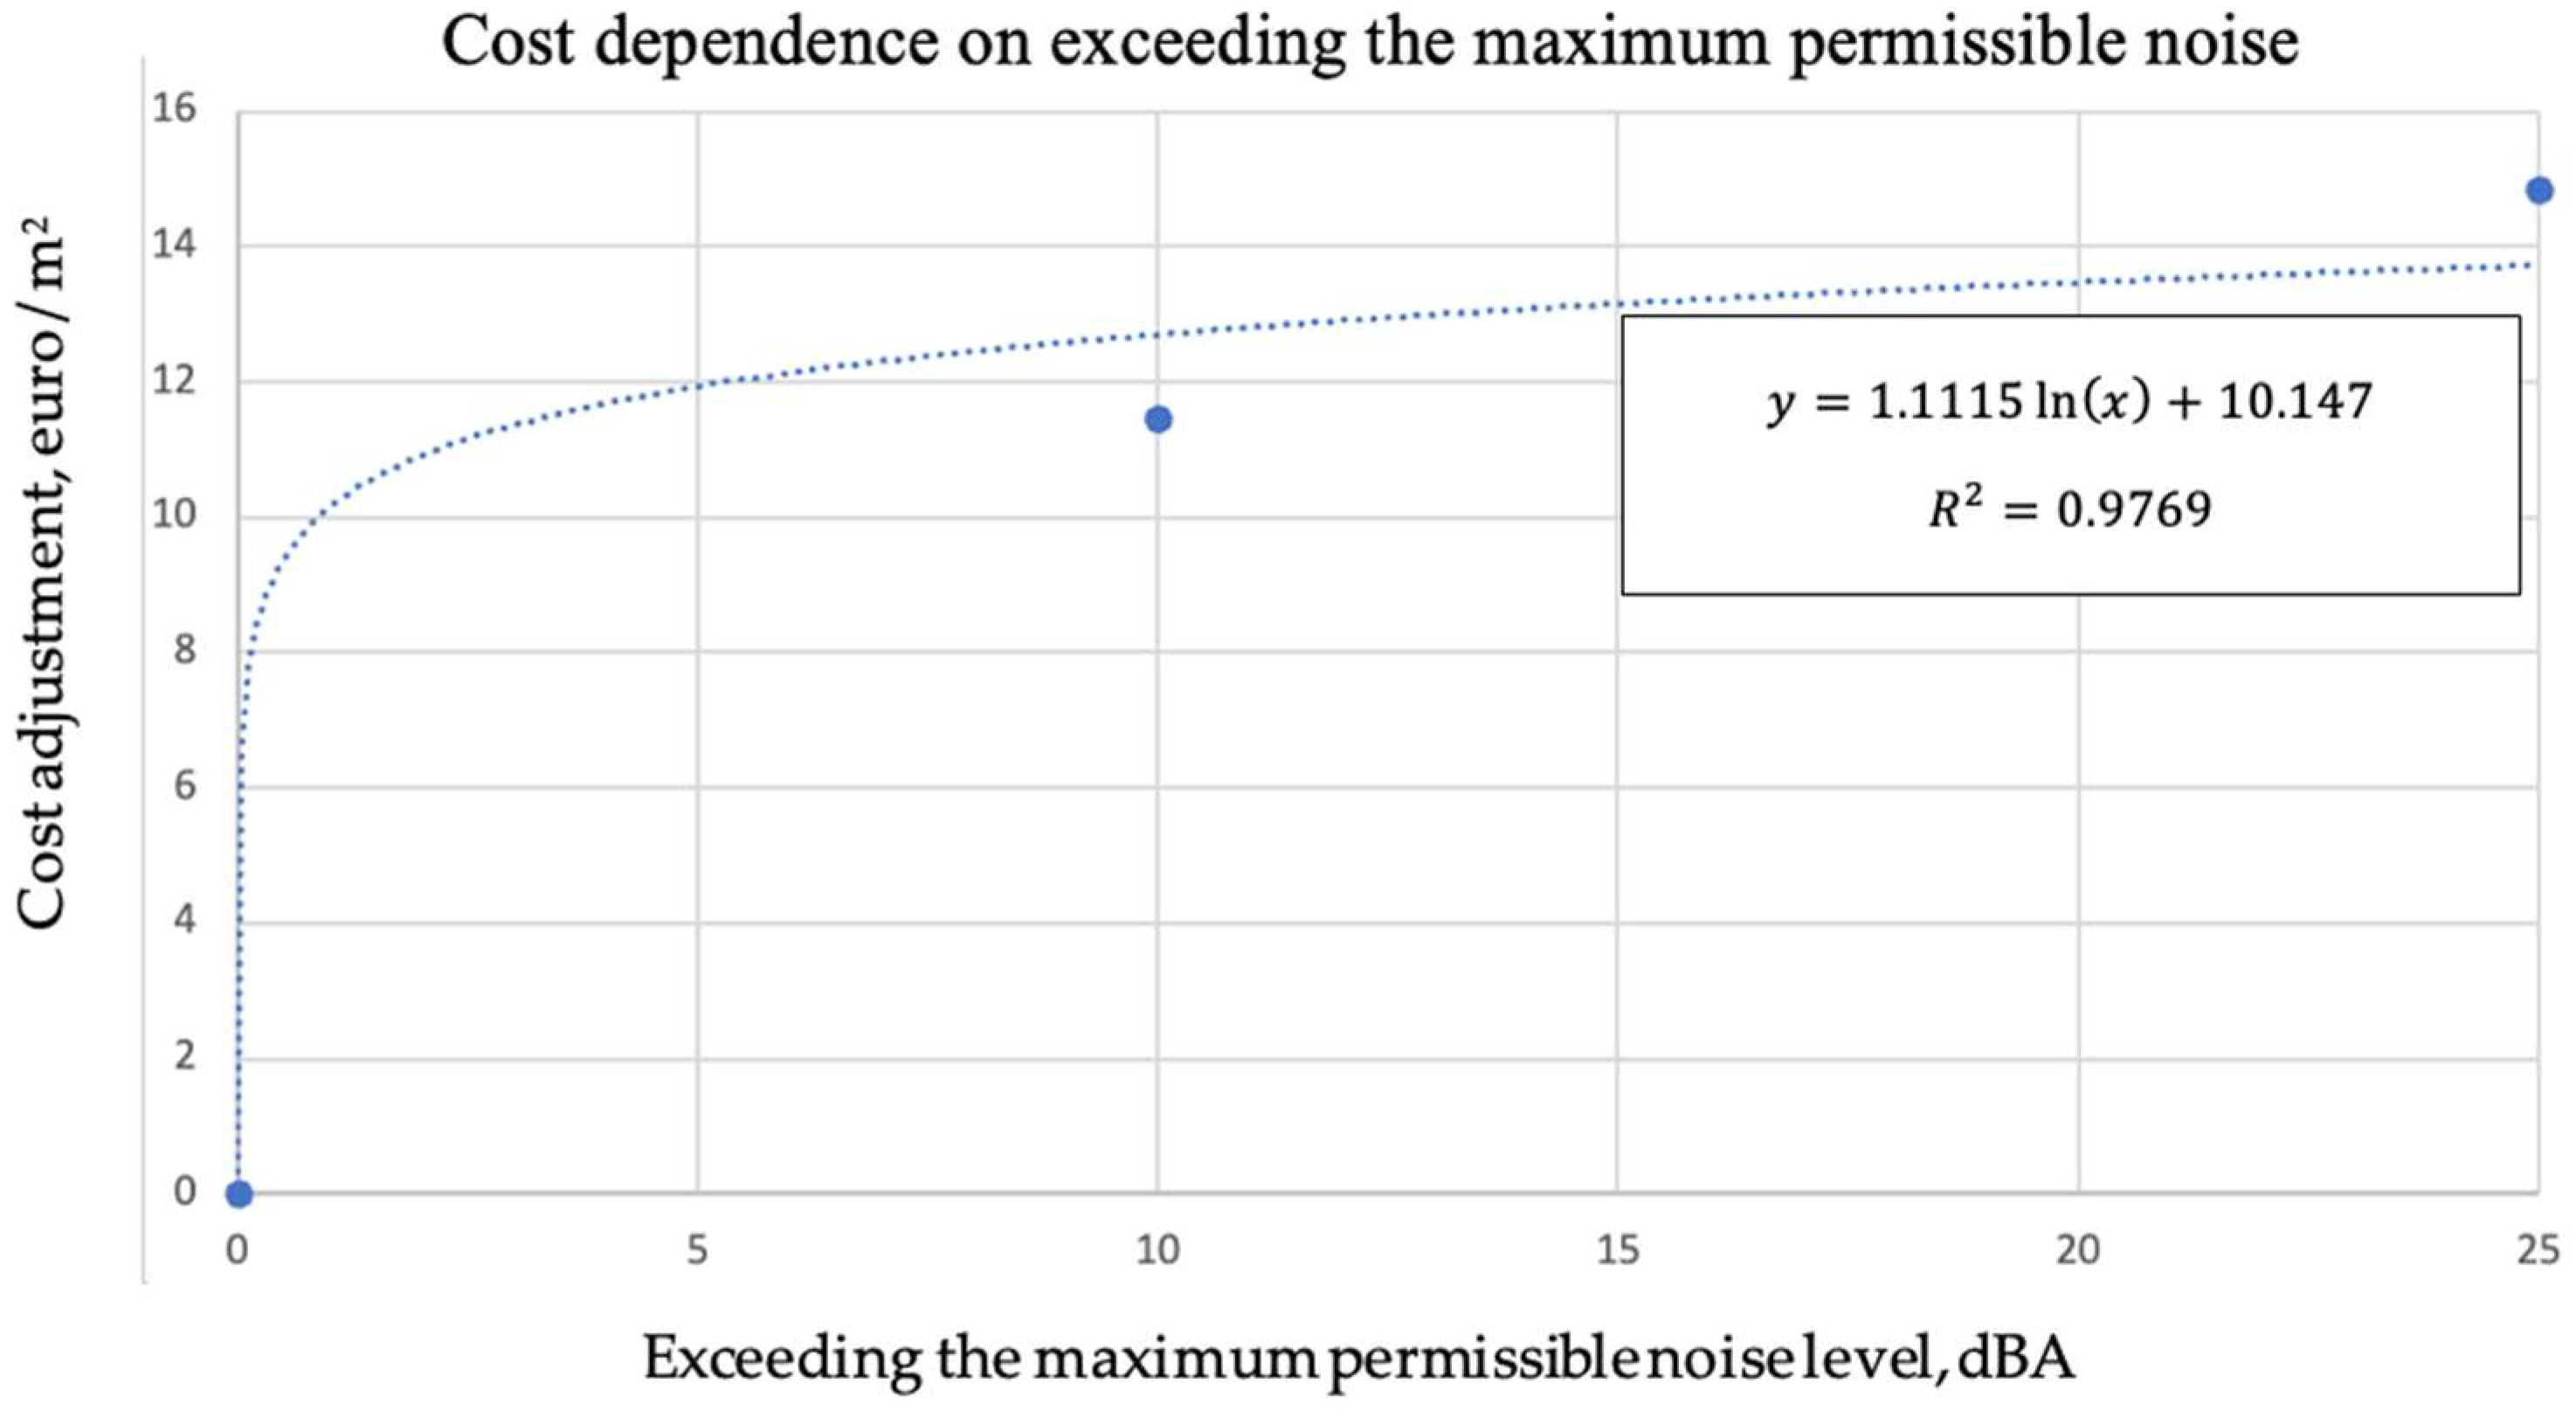
The logarithmic model, among others, most accurately describes the dependence of cost on exceeding the maximum permissible noise limit, as shown in the graph presented in
Figure 8, which is also justified by the physical meaning of the decibel description.
The noise adjustment can therefore be described by the following Formula (5):
In Equation (5), is noise impact adjustment, in euro/m2, and x is exceedance of the noise limit, in dBA.
As an implementation of the methodology, one can consider an example of cadastral value calculation taking into account technogenic noise impact and compare it with the real market value. The initial data are presented in
Table 10.
Since the initial cadastral value at the valuation date is already known, it is necessary to calculate the adjustment for noise impact using Formula (5):
Thus, the adjusted cadastral value will be as follows:


