Article

Integrated Land-Use Systems Contribute to Restoring Water Cycles in the Brazilian Cerrado Biome

by
Sarah Glatzle
1,
Roberto Giolo de Almeida
2,
Mariana Pereira Barsotti
3,
Davi José Bungenstab
2,
Marcus Giese
1,
Manuel Claudio M. Macedo
2,
Sabine Stuerz
1 and
Folkard Asch
1,*
1
Institute of Agricultural Sciences in the Tropics (490), University of Hohenheim, 70599 Stuttgart, Germany
2
Brazilian Agricultural Research Corporation, EMBRAPA Beef Cattle, Rádio Maia Avenue, 830, Campo Grande 79106-550, MS, Brazil
3
AgResearch Limited, Lincoln Research Center, Springs Road 1365, Lincoln 7674, New Zealand
*
Author to whom correspondence should be addressed.
Land 2024, 13(2), 221; https://doi.org/10.3390/land13020221
Submission received: 10 January 2024 / Revised: 7 February 2024 / Accepted: 8 February 2024 / Published: 10 February 2024

Abstract

:
Cerrado, constituting native Brazilian vegetation in the tropical and subtropical grasslands, savannas, and shrublands biome, has been extensively replaced by crop and pastureland, resulting in reduced water recycling to the atmosphere via evapotranspiration (ET). Re-introducing trees via integrated land-use systems potentially restores soil health and water-related processes; however, field data are scarce. During two years, we monitored soil moisture dynamics of natural Cerrado (CER), continuous pasture (COP), integrated crop-livestock (ICL), and integrated crop-livestock-forestry (ICLF) systems across 100 cm soil depth. Across years, mean soil moisture was highest for ICL, followed by COP and lowest in systems with trees (ICLF and CER). However, seasonal and spatial analyses revealed pronounced differences between soil layers and systems. COP and ICL mainly lost water from upper soil layers, whereas in ICLF, the strongest water depletion was observed at 40–100 cm depth, almost reaching a permanent wilting point during the dry season. CER was driest in the upper 40 cm, but water storage was highest below 60 cm depth. Our results suggest that compared to conventional land-use practices, integrated systems, including trees, increase water recycling to the atmosphere via ET and potentially compensate for the loss of key ecological functions of degraded or replaced Cerrado.

1. Introduction

The Brazilian Cerrado biome, the second largest biome in South America, underwent and is still undergoing an expansion of agriculture for the last five decades [1,2]. About 50% of the natural Savannah vegetation has been replaced by monocultures of soybean, sugar cane, corn, coffee, or cotton, as well as by energy plantations and pastures [2,3,4]. Whereas rapid expansion of agricultural activities significantly increased crop yields and economic wealth in the region, it also contributed to soil degradation and altered water cycles [5].
Compared to undisturbed Cerrado vegetation, regions affected by deforestation and land use change were characterized by changed water pathways towards reduced evapotranspiration (ET) and relatively increased runoff and percolation [5,6]. Several studies reported potential consequences of land cover changes, including reduced annual precipitation and increased rainfall variability [6,7,8].
Strong seasonal variability of rain and, as a consequence, temperature greatly influence soil moisture dynamics in this ecosystem, resulting in reduced soil moisture availability during the dry season [9]. The natural savannah vegetation of the Cerrado is highly adapted to seasonal variability of soil moisture and has developed several coping strategies, such as deep rooting systems, dormancy of the herbaceous layer, stomata control, leaf abscission, and the ability to extract water from soil at different depths [9]. Integrated crop-livestock systems (ICL) or integrated crop-livestock-forestry systems (ICLF) are management systems aiming at conserving soil resources while sustainably producing crops, livestock, and/or timber integrated into the same area employing intercropping or rotations [10]. Compared to conventional continuously cropped or grazed systems, integrated systems conserve soil quality by reducing erosion, maintaining or increasing soil organic matter, and improving soil structure and porosity, resulting in increased infiltration and water retention capacity [11,12]. Increased soil water infiltration and improved soil water storage of integrated systems potentially reduce drought impacts on agricultural production [13]. However, in comparison to deep-rooting natural Cerrado vegetation, pastures and integrated systems tend to extract water at shallower depths and can create a strong distortion in the vertical-spatial water distribution. On a transect within an ICLF system, large seasonal and vertical-spatial heterogeneity in soil moisture has been reported [14], and these effects of vegetation heterogeneity are expected to be more pronounced across and between systems. As the most important species of any pasture component, Brachiaria brizantha, mainly roots in the upper 30 cm of the soil [15]; the dynamic of moisture in the topsoil largely affects the productivity of the pasture and, thus, in addition to seasonal variability, dynamics of vertical-spatial variability of soil moisture within seasons needs to be taken into account when evaluating the effects of land-use change on water availability and -productivity. The soil moisture dynamics depend to a large extent on the concentration of soil organic matter in any soil layer, which, in turn, has been shown to be strongly affected by land-use change [16].
Nonetheless, information on seasonal and vertical-spatial variability of soil moisture as affected by land-use change from natural Cerrado to pasture or integrated systems remains scarce. Since land-use change also affects the quality and the physical characteristics of soils and, thus, soil moisture dynamics, it directly impacts long-term land productivity. On the other hand, actively growing vegetation also directly affects soil moisture via transpiration and evaporation, which renders comparing soil moisture dynamics across different land use types difficult as the transpiring biomass and the soil cover need to be factored in. Therefore, the objective of this study was to elucidate the seasonal and vertical-spatial variability of soil moisture of a Cerrado ecosystem as affected by different long-term land use management.

2. Materials and Methods

2.1. Experimental Area

The study was conducted on the long-term experimental sites of EMBRAPA Beef Cattle situated in Campo Grande in the state of Mato Grosso do Sul, Brazil (20°24′54.9″ S, 54°42′25.8″, altitude 530 m). The study area is characterized by a tropical savannah Aw climate (Köppen) with a mean annual temperature of 22.6 °C and mean annual rainfall of 1560 mm divided into a distinct rainy season and a distinct dry season (Figure 1). About 70% of the mean annual rainfall falls within the rainy season, and the remaining 30% within the dry season. Temperature, relative air humidity, solar radiation, wind speed, and precipitation were monitored with a nearby meteorological station operated by EMBRAPA Beef Cattle.

2.2. Treatments

All measurements were performed in four land use systems, defined here as treatments, namely: continuous pastures (COP), integrated crop-livestock system (ICL), integrated-crop-livestock-forestry system (ICLF), and natural Savannah vegetation, Cerrado (CER). Plots of the four treatments were arranged on three replications and located in close proximity (Figure 2). For the CER treatment, measurement plots were established in a large continuous Cerrado area.
The plots of the treatments COP and ICL were part of a long-term management experiment that was established in 1995 and, thus, demonstrated management effects of more than 20 years. The COP treatment represented a typical degraded non-fertilized pasture often found in central west Brazil. The pasture consisted of Brachiaria decumbens cv. Basilisk under variable stocking rate with a minimum of two steers per plot and increasing stocking rate depending on forage availability. In ICL, rotation strategy was established with a cycle of 4 years, rotating Glycine max under no-till for one year, followed by Brachiaria brizantha cv. BRS Piatã pasture under variable stocking rate with annual fertilizer application of 50 kg N ha−1 (in the form of urea) and 300 kg NPK ha−1 (0:20:20) for three years. The ICLF was part of another long-term management experiment and was established in 2008. It consisted of a Brachiaria brizantha cv. BRS Piatã pasture lined with rows of 25 to 27 m high Eucalyptus (Eucalyptus grandis × Eucalyptus urophylla, H13 clone) trees with annual fertilizer application of 50 kg N ha−1 (in the form of urea) and 300 kg NPK ha−1 (0:20:20). The Eucalyptus seedlings were transplanted in east-west oriented rows. Each replication consisted of two single tree rows at a distance of 22 m and 2 m distance between the trees within each row, resulting in a tree density of 227 trees ha−1. The ICLF followed a 4-year rotation strategy with Glycine max for five months, followed by 3.5 years of pasture. For this study, data were collected for the ICL and the ICLF treatment during the second and third years of the pasture cycle from November 2015 to August 2017. For the ICL and ICLF treatment, the cattle (Nellore heifers) grazed at varying stocking rates depending on biomass production to keep the height of the pasture at approximately 35 cm (put-and-take method).

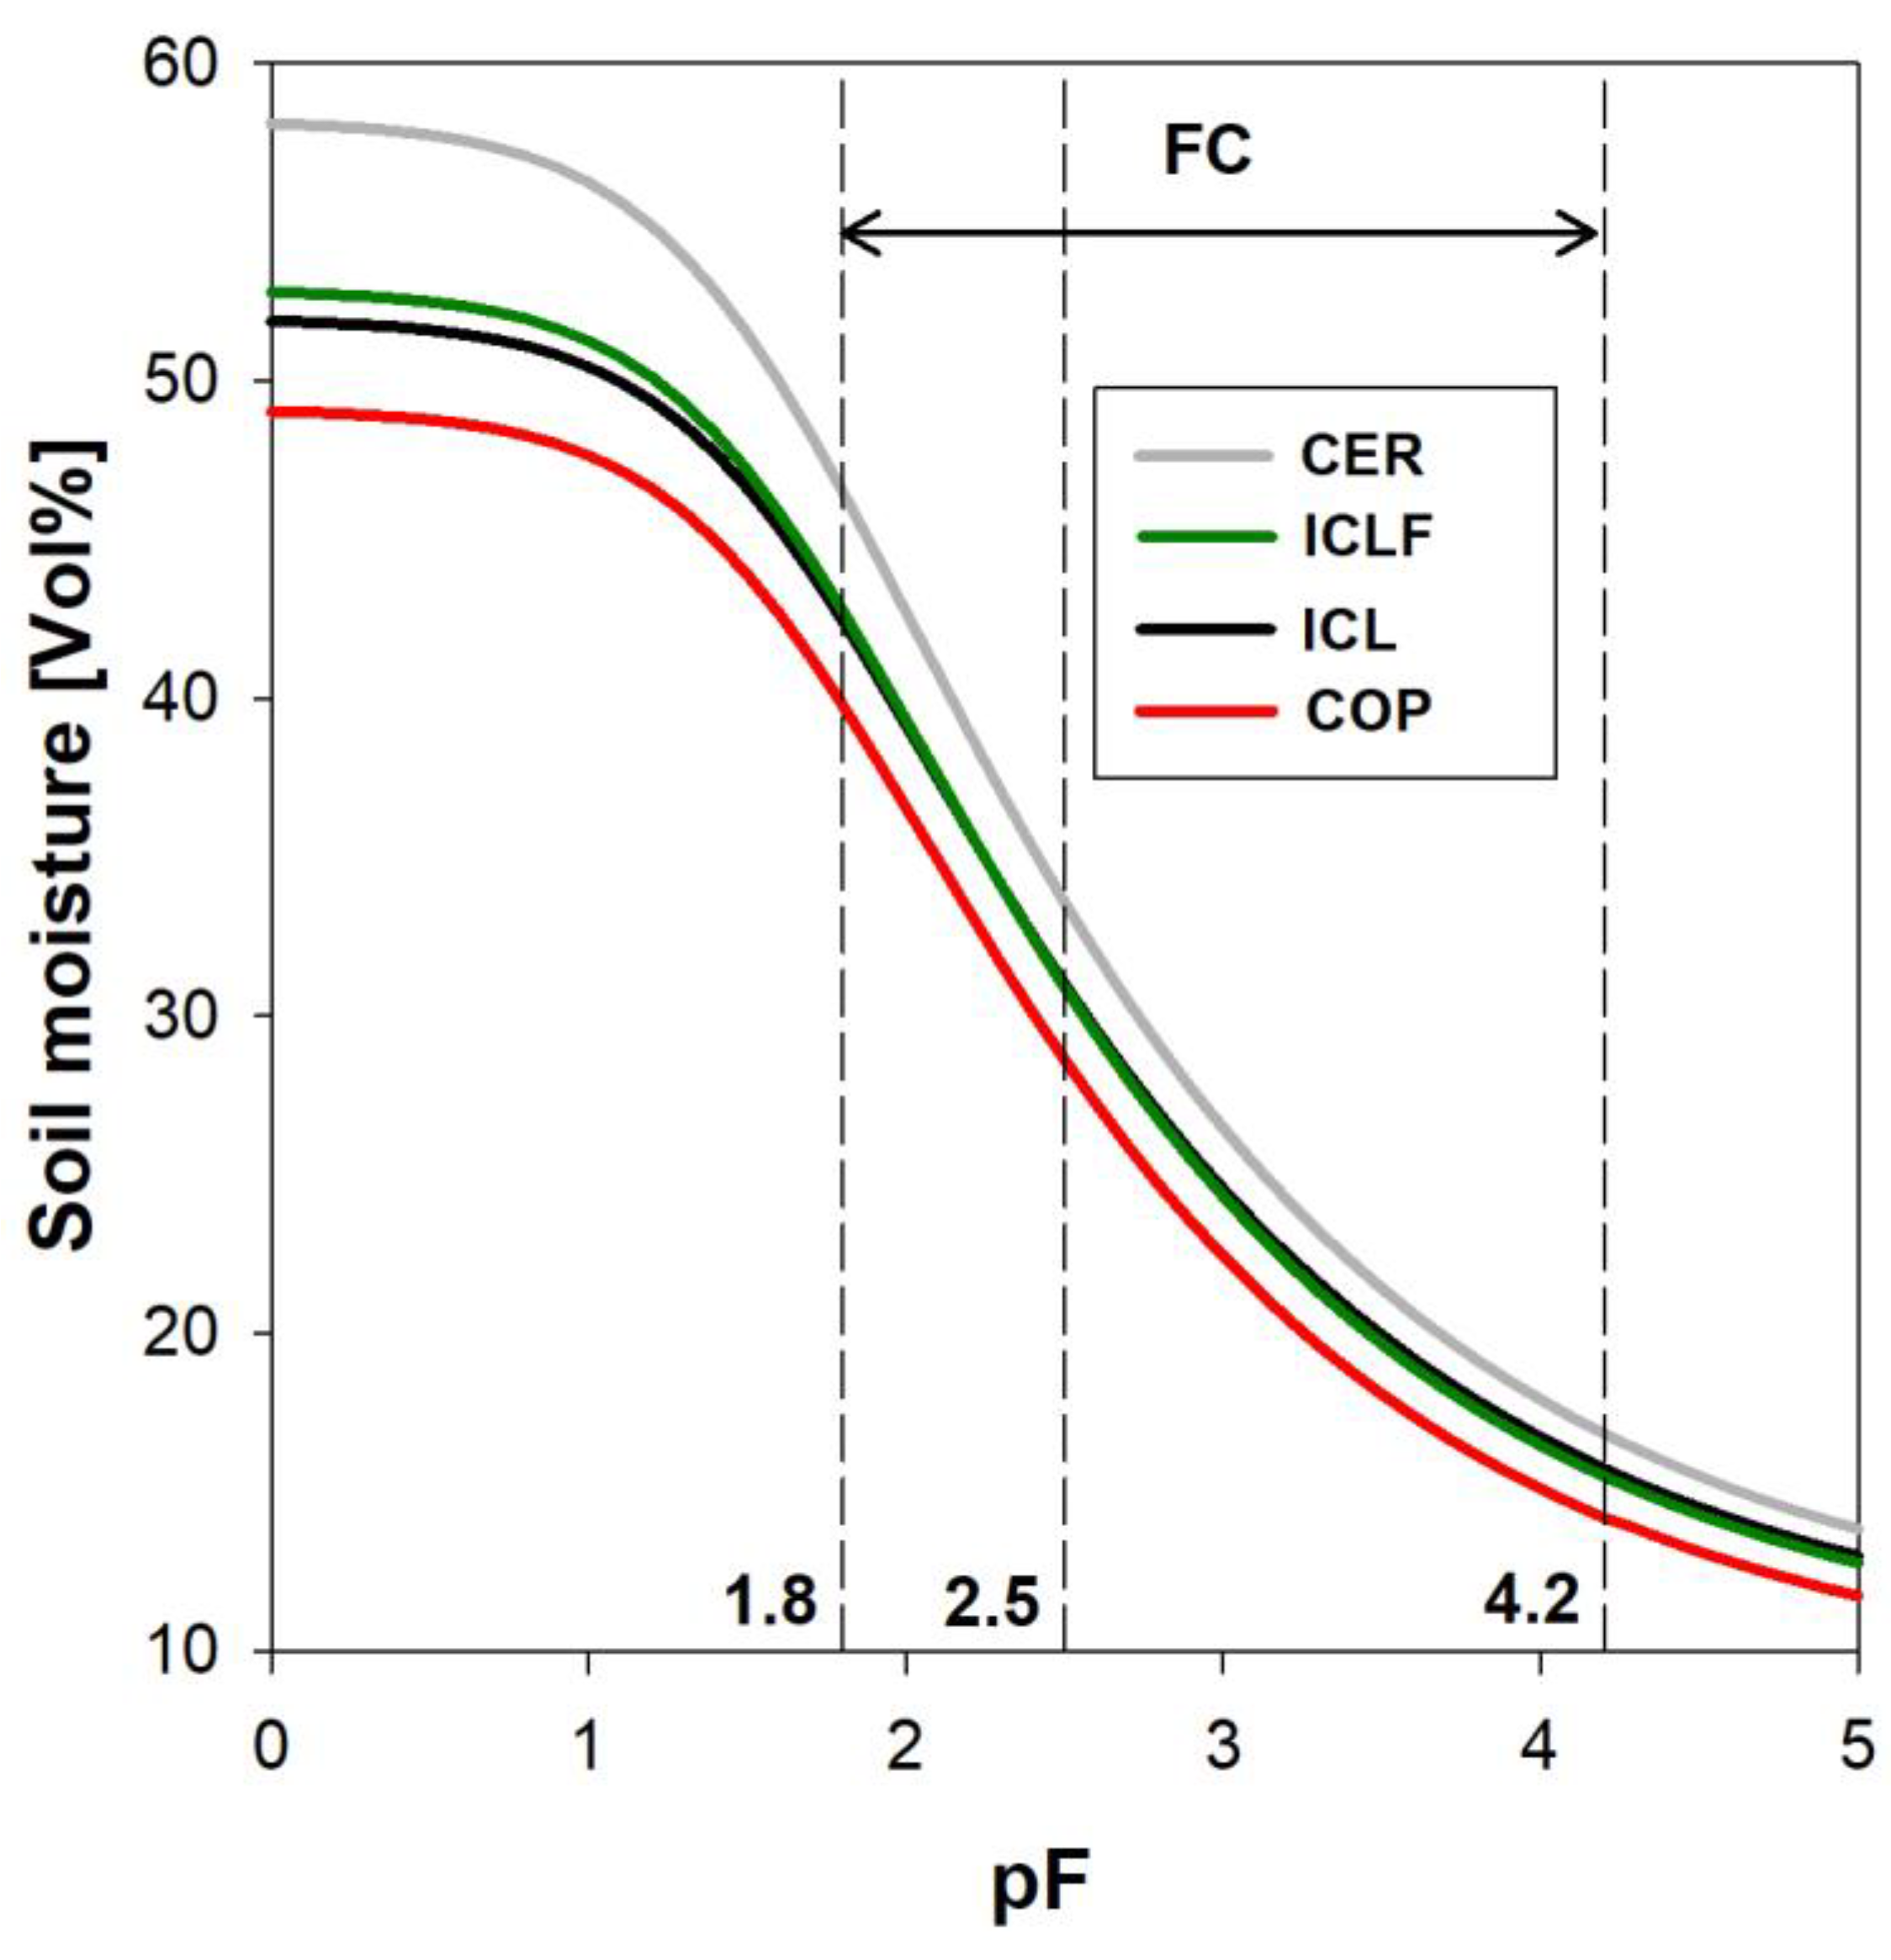
2.3. Soil Characteristics

The soil of the study area has been classified as a Ferralsol [17] and a Typic Acrudox Oxisol [18]. From soil pits excavated in February 2017, undisturbed (coring rings 10 cm3) and disturbed soil samples were taken for all four treatment plots in 10, 20, 30, 40, 60 and 100 cm depth, resulting in 3 replicates per depth. The undisturbed soil samples were used to determine soil bulk density (BD), and the disturbed soil samples to analyze pH measured in calcium chloride, soil organic carbon (SOC) using a C/N analyzer and soil texture using the pipette method (Table 1). Saturated hydraulic conductivity (Ksat), field capacity, and permanent wilting point were calculated using the computer program Rosetta Lite v. 1.1 within the software package HYDRUS 1D by PC Progress. Rosetta Lite v. 1.1 implements five hierarchical pedotransfer functions for the estimation of the van Genuchten water retention parameters (pF curve: field capacity and permeant wilting point) and the saturated hydraulic conductivity by using the measured soil texture and BD data [19].

2.4. Soil Moisture and Aboveground Biomass Measurements

For the treatments CER, ICL and COP in each replication, five fibreglass access tubes (DeltaT Type: ALT1) of 1 m length were vertically installed along a row with 2 m distance between the access tubes for volumetric soil moisture [vol%] measurements with a portable DeltaT FDR (frequency domain reflectometry) PR2/6 profile probe. In the replications of the ICLF treatment, the fibreglass access tubes were installed along a transect of five sampling points between the tree rows to account for the shading and soil moisture gradient caused by the trees. For the exact location of the access tubes between the tree rows, see Figure 2 in Glatzle et al. [14]. For the ICLF system, soil moisture values have been averaged from measurements taken along the transect between the tree rows to account for variability in soil moisture caused by the distance from the trees. FDR measurements were taken weekly in depths of 10, 20, 30, 40, 60 and 100 cm. The FDR soil moisture measurements were validated against gravimetric soil moisture measurements. Samples for gravimetric soil moisture measurements were taken with an auger right next to every FDR access tube at the same depths where the FDR probe measurements were taken.
Evapotranspiration data were calculated from changes in the volumetric soil moisture content in the respective layers and then added up and expressed in mm of evapotranspiration. Conversion from volumetric soil moisture content to mm was calculated as: Vol % in [m3 m−3] × depth [m] × 1000 = [l m−2] = [mm]
In all four treatments, aboveground biomass (AGBM) [g DW m−2] was quantified monthly at a total of 22 sampling dates (Dec 2015–Sept 2017). At each sampling date, biomass was collected at five sampling points in each replication (for ICLF along a transect between the tree rows). The grass layer was harvested on 1 m2 and cut 5 cm above the ground. Furthermore, for COP and ICL, all dead material laying on the ground within the 1 m2 was collected, and for ICLF, all dead material + litter from the Eucalyptus trees laying on the ground within the 1 m2 was collected. Due to the non-existing grass layer, only litter was collected from 1 m2 sampling points in CER. All harvested biomass samples were separated into green biomass, standing dead biomass, and litter-dried for 48 h at 70 °C and weighed to determine biomass as dry weight per area in g m−2.

2.5. Data Analysis

Data were analyzed in a randomized block (3 replicates) design using the generalized least squares model of R [20]. For the analysis of soil moisture treatment, month and depth were considered as fixed effects. For the analysis of green AGBM and dead AGBM + litter, treatment and month were considered as fixed effects. As soil moisture was only measured at 10, 20, 30, 40, 60 and 100 cm depth, soil moisture values at 50, 70, 80 and 90 cm depth were obtained by linear interpolation of the measured data points.

3. Results

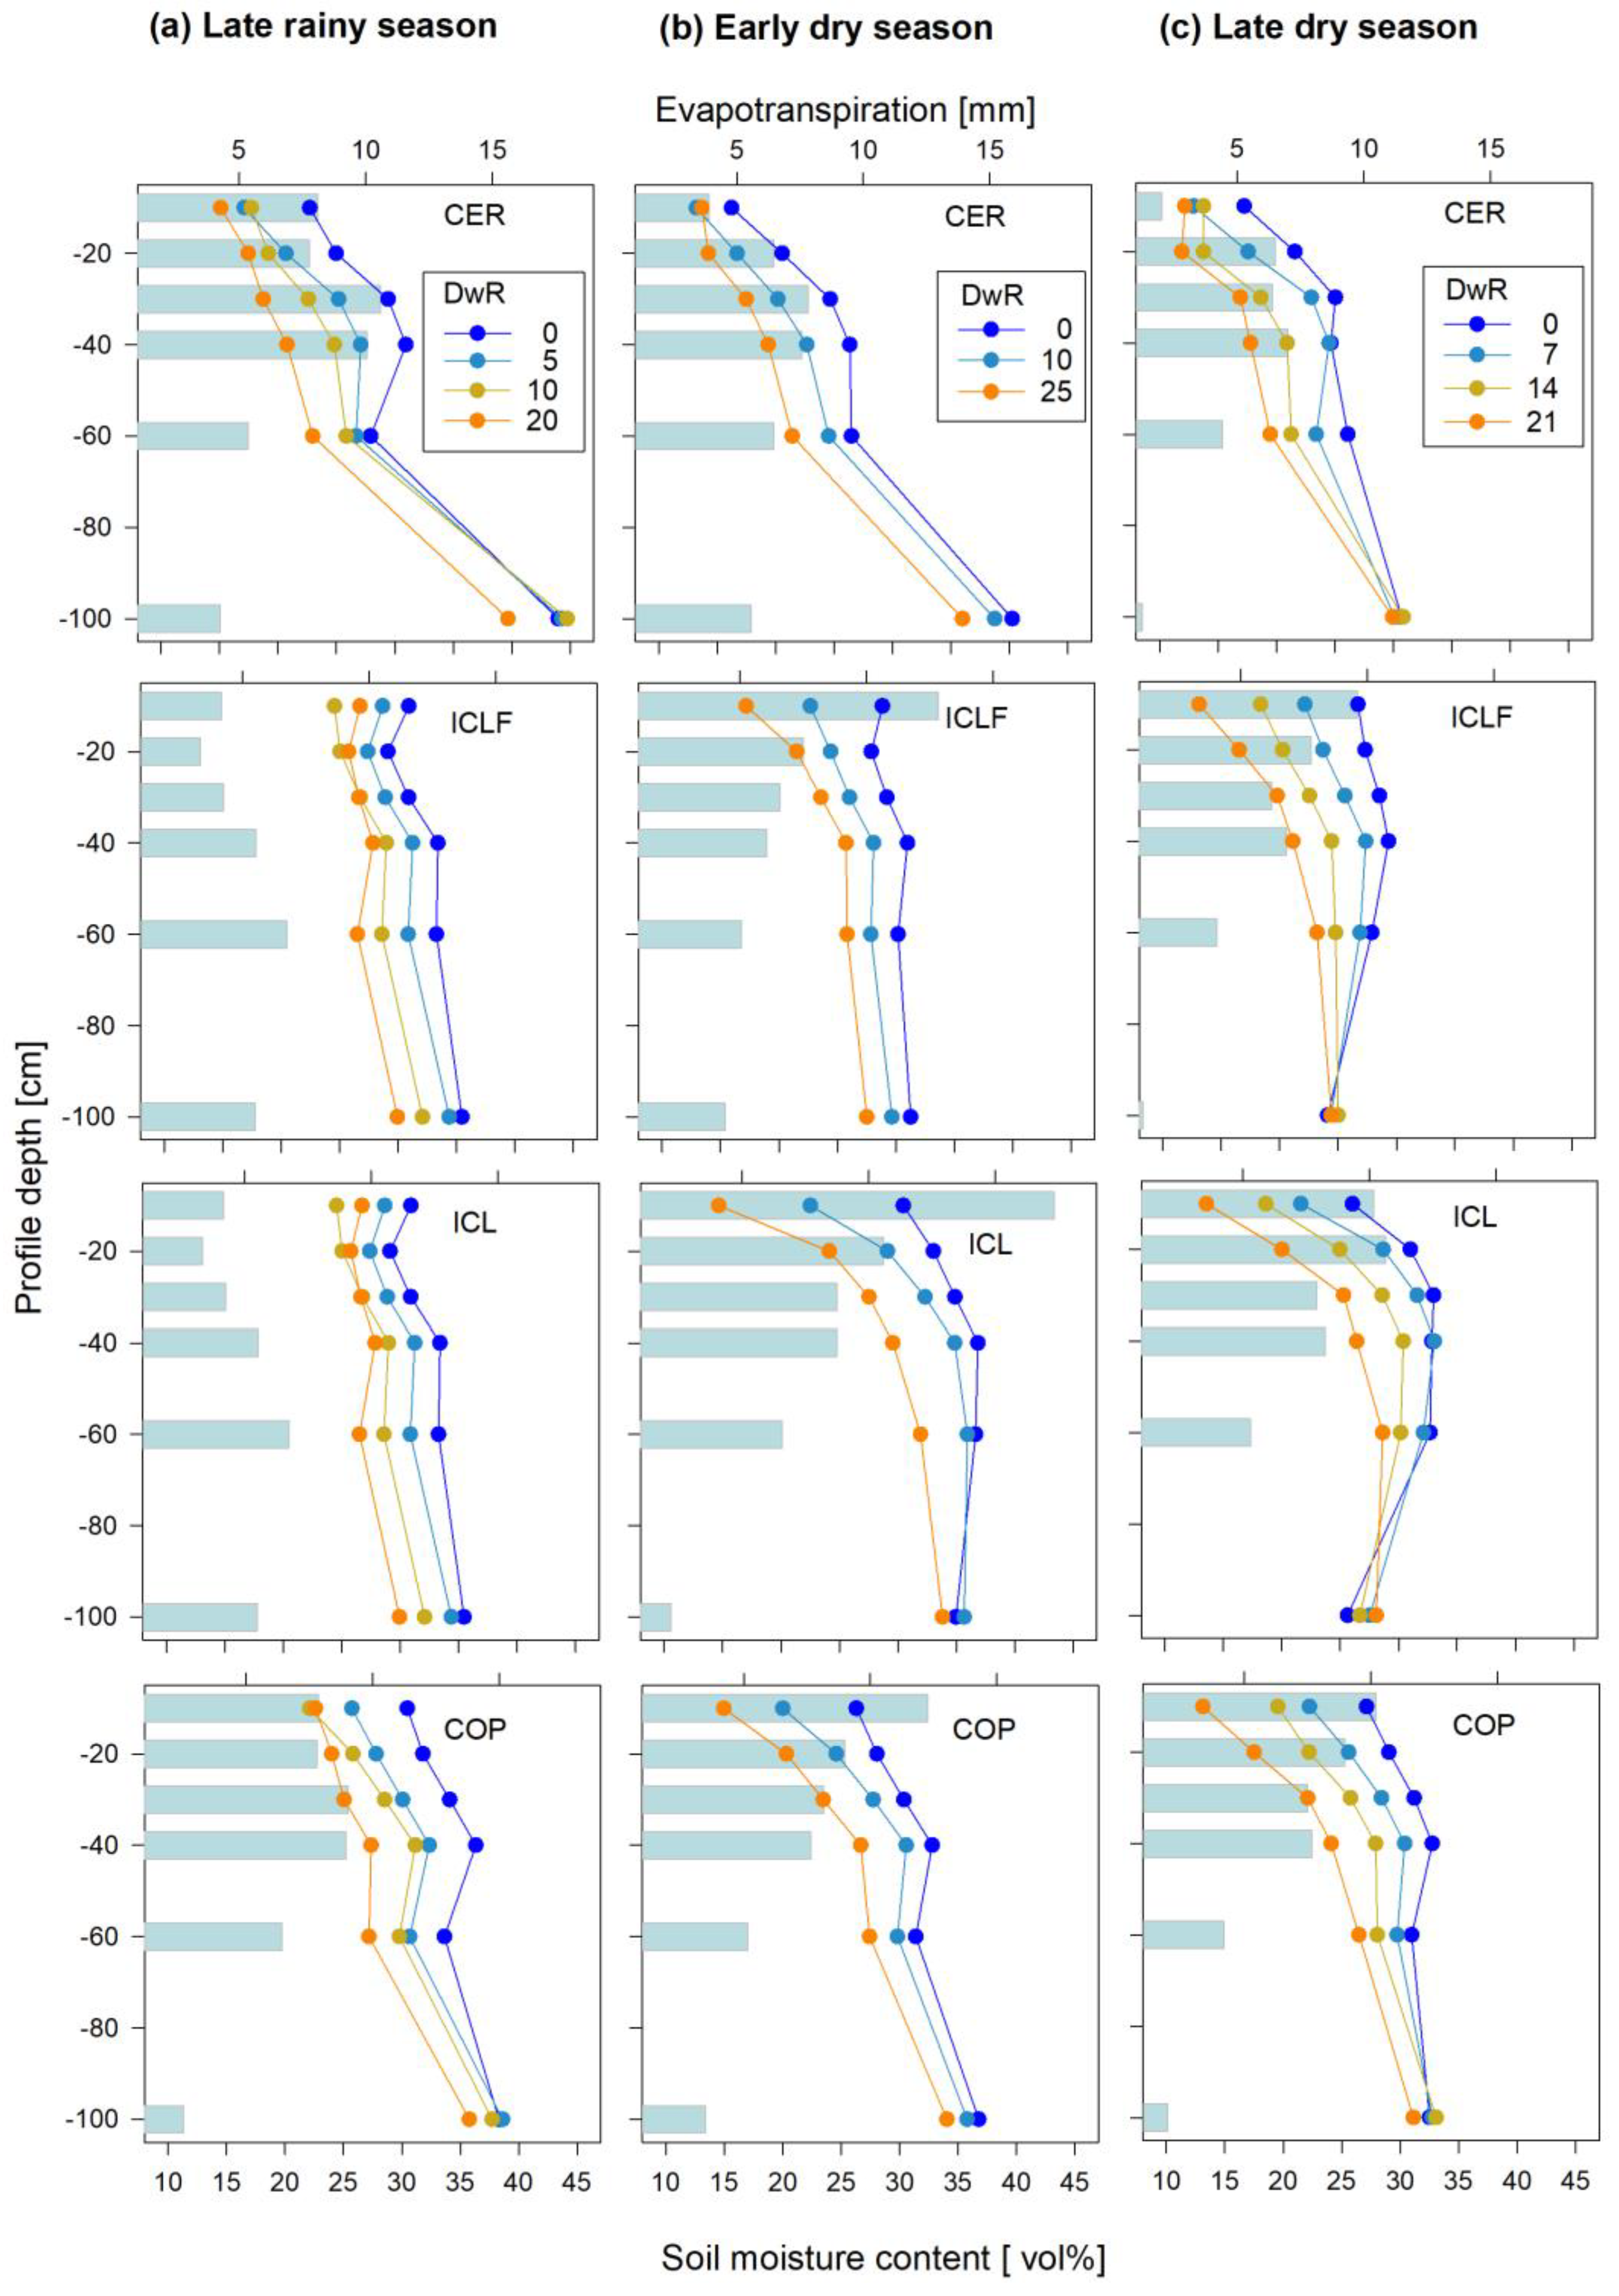
3.1. Seasonal Dynamics of Soil Moisture Content

Figure 3 shows the monthly dynamic of soil moisture content across the entire soil profile (0–100 cm) for all treatments over the experimental period. Monthly mean soil moisture content varied between 18 and 35 vol% and followed a clear seasonal pattern in all treatments. The dynamics of soil moisture content differed significantly (p ≤ 0.001; Table 2) between treatments and seasons, with the integrated crop-livestock treatment being the wettest, varying between 35 vol% (wet season) and 25 vol% (dry season) (Figure 3).
The lowest monthly mean soil moisture content was observed in the natural Cerrado, with maximum values around 28–30 vol% during the rainy season and minimum values around 18–23 vol% during the dry season. The integrated crop-livestock treatment had, on average, about 5 vol% higher soil moisture content than the integrated crop-livestock-forestry treatment average during the rainy season. Averaged over the rainy season, CER had with 27.5 vol% the lowest soil moisture content, closely followed by ICLF with 27.7 vol%, followed by COP with 30.0 vol%, while ICL had with 32.3 vol% the highest soil moisture content. The different treatments follow the same sequence when averaged over the dry season but with a soil moisture level 10–15 vol% lower than in the rainy season.
Figure 4 illustrates the vertical-spatial dynamics of soil moisture content for different soil profile depths (from 10 to 100 cm) for the entire experimental period for all four treatments. In general, soil moisture content increased with depth independent of season or treatment. As expected in all treatments and in all profile depths, soil moisture content was lower in the dry season and higher in the rainy season.
The vertical-spatial combined with the temporal resolution allows for a more detailed analysis of soil moisture dynamics in the various land-use systems. Where Figure 3 indicated that the natural Cerrado seems to be the least water-conserving land-use system, Figure 4—CER shows that particularly the topsoil down to 30 cm dries out severely, even during the rainy season (vol% values at or close to permanent wilting point), whereas the lower profile layers (>70 cm) maintain soil moisture values close to or at saturation. During the dry season, CER soils dried to a permanent wilting point down to about 70 cm below the surface. The removal of trees in the ICL and COP systems (Figure 4—ICL, COP) resulted in strongly different vertical-spatial soil moisture dynamic patterns. Except for the dry season, where the topsoil (10 to 30 cm) of the two systems dried to values close to the permanent wilting point, for the remaining time, soils stayed well saturated (vol% values between 25 and 40) from a depth of 10–15 cm below the surface for the entire remaining profile. Re-integrating trees into the system (ICLF—Figure 4—ICLF) changed the vertical-spatial dynamic of soil moisture towards the pattern observed in CER. The main difference is that the top soil stayed relatively well saturated during the rainy season and dried down to the permanent wilting point in the lower profile layers only during the driest months during the dry season.
Analysis of variance (Table 3) showed that the land-use system significantly affected soil moisture content, with this effect highly significant depending on the season (months). In addition, soil moisture content in combination with season was highly significantly affected by the position (depth) in the soil profile.

3.2. Soil Moisture Kinetics during Drying Events

In order to evaluate which of the treatments contributed to the local water cycle from which depth, we followed several dry spells during periods without rainfall in the different seasons with regular soil moisture measurements across the soil profile down to 100 cm of depth. We calculated the water lost from the different depths during the drying event and related it to the overall water loss from the respective treatments during the dry spell (Figure 5). During a period of 20 days without rainfall late in the rainy season (Figure 5a), the CER treatment lost 64 mm of soil moisture to evapotranspiration, with the largest share originating from the first 40 cm of the soil profile. All other treatments lost between 11% (COP), 15% (ICLF) and 18% (ICL) less water than the CER, and for the treatments including trees, the distribution of water evapotranspired from the different layers of the soil profile was more homogenous than in the CER. The differences between the treatments in the way water was lost through evapotranspiration became more manifest in periods without rain during the dry season. In the dry season, monthly rainfall ranges between 15–60 mm (Figure 1), but there are longer periods with no rain at all. In a 25-day period without rain early in the dry season (Figure 5b), all systems lost about the same amount of water. Meanwhile, in the CER, the topsoil did not hold much water (soil moisture values of less than 15%), soil moisture values below 30 cm depth were relatively high, and most water was lost from there. In all other systems, the top soil was covered with grass, and the top layer of the soil profile initially stored a high percentage of water with soil moisture values of 25 to 30 vol% in the top 10 cm.
A period of about 3 weeks without rain late in the dry season (Figure 5c) resulted in reduced water losses in all treatments, mainly due to less water extraction for evapotranspiration from deeper soil layers, indicating a less active vegetation cover towards the end of the dry season. COP and ICL lost about the same amount of water (51 mm and 49 mm, respectively), followed by ICLF (40 mm) and CER (34 mm). As in the drying period before, the strongest decrease in soil moisture content was observed in COP, ICL, and ICLF in the upper soil layers, whereas in CER, soil moisture decreased most strongly between 20 and 60 cm depth. During this period, hardly any water was lost at 100 cm depth in all treatments. On average, across the respective dry spells, the largest variation in soil moisture content was observed between 30 and 40 cm at CER, whereas in the other treatments, water was mainly lost from the topsoil.

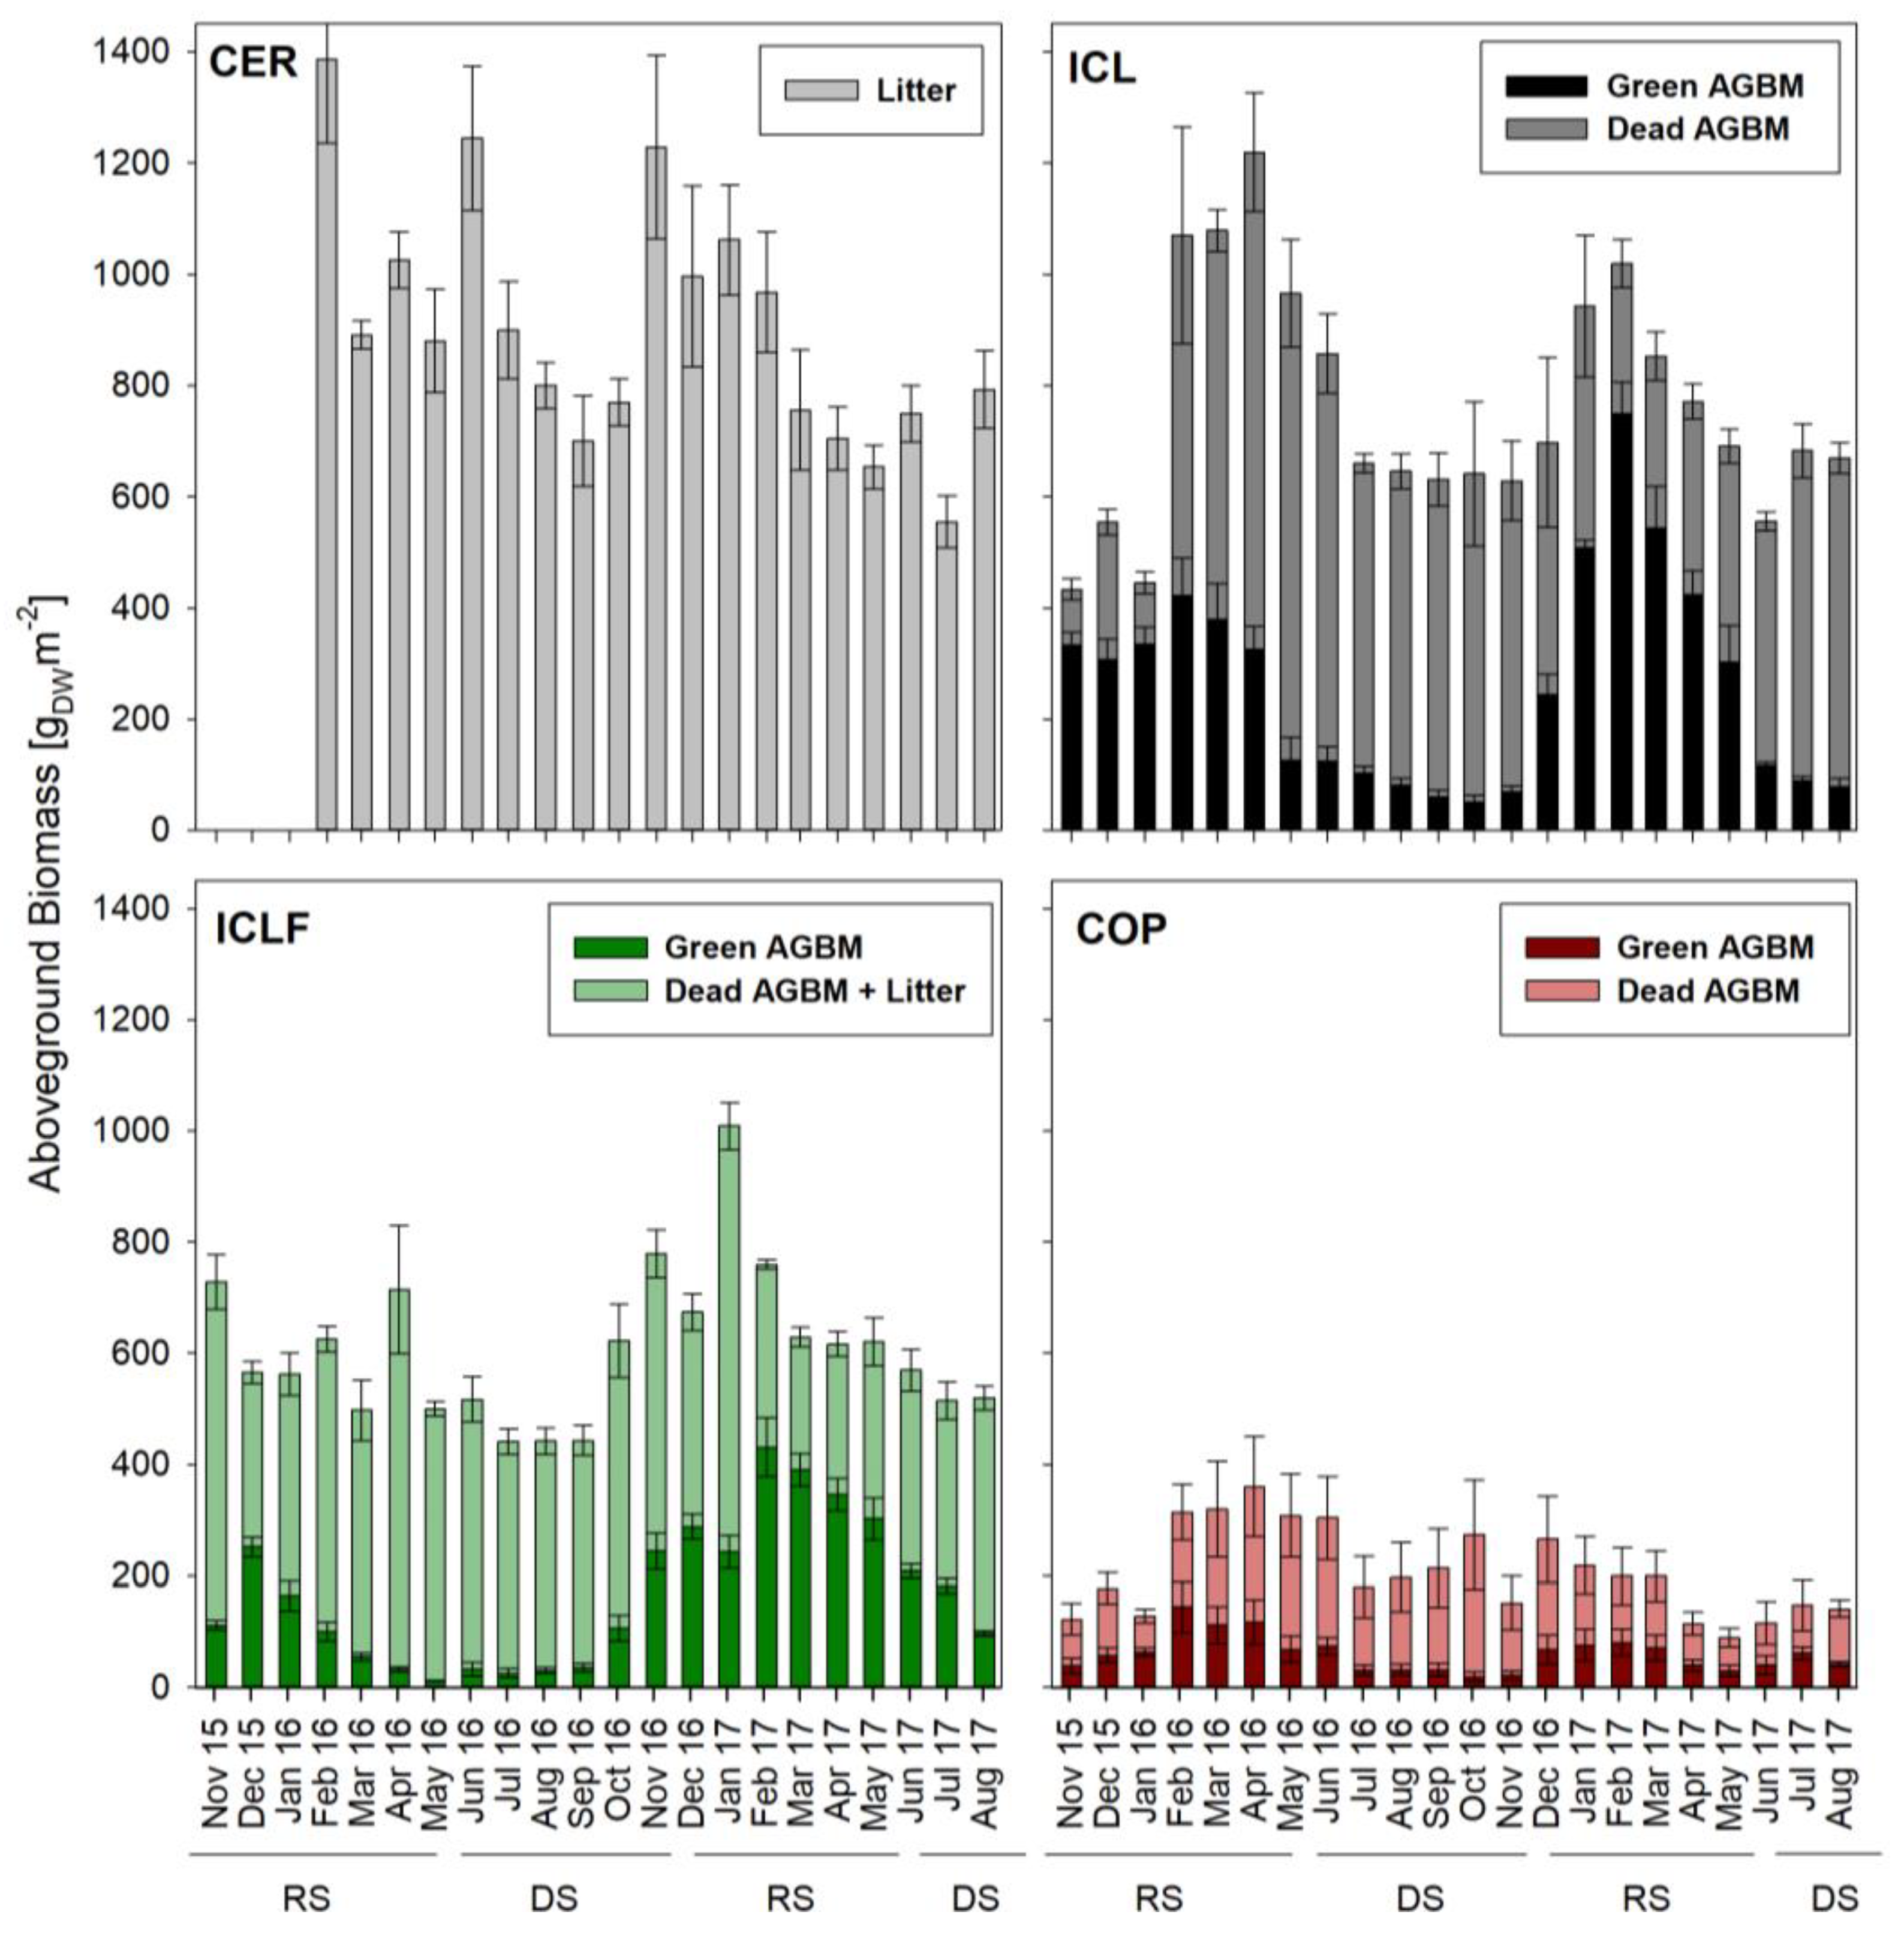
3.3. Aboveground Biomass

Aboveground biomass (AGBM; from tree biomass, only litter was sampled) was monitored monthly for the entire experimental period and is shown for all treatments in Figure 6. In general, for all treatments, the total AGBM (green + dead + litter) was higher during the rainy season than during the dry season. Comparing the treatments on average over the experimental period, COP had 206 gDWm−2, by far the lowest total AGBM, followed by ICLF with 607 gDWm−2 and ICL with 760 gDWm−2. Comparing green AGBM on average over the measurement period, COP had 60 gDWm−2, the lowest green AGBM, followed by ICLF with 168 g DW m−2 and ICL with 262 gDWm−2. Comparing the dead + litter AGBM pool, COP (146 gDWm−2) was lowest, followed by ICLF and ICL (439 and 497 gDWm−2, respectively), while CER had 899 gDWm−2, the largest amount of litter.

4. Discussion

4.1. Soil Moisture Dynamics in the Different Land Use Systems

Monthly precipitation (Figure 1) and associated changes in soil moisture content to a depth of 100 cm for all 4 treatments were continuously measured for 22 months. Soil moisture content dynamics were strongly seasonal in all treatments, with high soil moisture content in the rainy season and significantly lower soil moisture content in the dry season relative to the rainfall regime. Intra-annual changes in soil moisture content were similar for the different treatments but on different levels. This indicates a higher turnover rate for precipitation in the dry season due to increased evapotranspiration. For both seasons, pooled over 1 m depth, soil moisture content was always lower in the treatments with trees, ICLF and CER, as compared to treatments without trees, COP and ICL. Due to rooting patterns, trees and shrubs often access deeper soil layers, resulting in increased water uptake and transpiration. It was shown for the ICLF system that soil moisture content, especially in deeper profile layers, decreased close to tree lines as compared to the central areas between the tree lines [14].
Comparing Cerrado (cerrado denso) and a natural grassland (cerrado sujo), Oliveira et al. [8] found higher evapotranspiration rates in the Cerrado due to differences in tree densities and leaf area, but also to differences in root distribution. Similar results of lower soil moisture content at a higher tree density were reported by Quesada et al. [9], who compared a densely wooded Cerrado with a burned Cerrado with a high grass density in central Brazil and by Herrera et al. [21] who compared a Eucalyptus plantation with a Savanah vegetation in Venezuela. In the current study, soil moisture content in CER was slightly lower than in ICLF on average over the experimental period, which was probably related to the higher density of woody vegetation and higher leaf area of the CER, resulting in higher transpiration rates.
In contrast, ICL showed similar amounts of aboveground biomass as CER, including a large share of standing dead biomass (Figure 6), but soil moisture content was always significantly higher in ICL than in CER. Since both systems had relatively high soil organic matter concentrations (Table 1), an indicator for increased available soil water capacity [22], differences in topsoil moisture content (Figure 3) could have been caused by the large quantity of dead AGBM in ICL serving as mulch in addition to the closed grass cover, which both reduce losses of soil moisture via bare soil evaporation [23,24]. Additionally, the CER canopy and thick litter layer intercept a large share of precipitation, especially of smaller rainfall events. As a result, some of the precipitation at CER directly evaporates from litter, leaf and stem surfaces and, consequently, does not contribute to soil moisture content.
In the COP, soil moisture content across the seasons (Figure 3) was always between CER (driest) and ICL (wettest), but biomass production was only about one-third of ICL. This indicates soil compaction and degradation resulting from deforestation, intensive cattle grazing, and machinery use [25,26,27,28], as also suggested by the relatively high bulk density and low hydraulic conductivity (BD and Ksat, Table 1).
Soil compaction may result in reduced growth of aboveground biomass as a consequence of limited root growth [29], which could be an explanation for the significantly reduced green AGBM in COP compared to ICL and ICLF. However, in contrast to COP, mineral fertilizer was applied in ICL and ICLF, comparisons of biomass growth between the systems are difficult and need to be considered with caution.
Soil moisture content and plant water availability strongly depend on soil properties and the retention capacity for water of the individual soil types. In order to compare soils for their level of water available to plants and their respective level of degradation, we calculated soil water retention curves for the different soils (Figure 7).
The water retention curves showed higher soil moisture content at the same pF values in the ICL and ICLF systems compared to COP, indicating the potential of integrated systems (ICL and ICLF) and other conservation systems (e.g., No-Till systems) to mitigate the effect of soil compaction in pasture systems and, thus, to restore degraded sites due to lower soil movement, the formation of biopores and input of soil organic carbon [30,31]. The potential of ICLF systems to improve the soil physical quality has also been described by Moreira et al. [32] and Assis et al. [33], who found improved soil physical quality in ICLF and ICL systems compared to degraded pastures in the Cerrado biome. In line with our findings, Nóbrega et al. [28] found significantly greater bulk densities and smaller Ksat and total porosity in the topsoil of a pasture that was converted from a Cerrado. In contrast to the results reported here, Feitosa et al. [34] found higher water retention at field capacity of soils under pasture in the Cerrado biome of northern Brazil, indicating potentially site-specific responses.
Due to the fact that our core experimental sites were established more than 25 years ago and were continuously maintained under the same management, we were able to capture a certain level of long-term processes reflected in parameters of soil texture, carbon content, and hydrological conductivity (Ksat) which could be clearly attributed to the respective land-use management. In general, our results confirm that tree components reduce average soil moisture content independent of seasons; however, regarding seasonal dynamics in different soil depths, differences in water extraction patterns were found between the systems.

4.2. Seasonal and Vertical-Spatial Soil Moisture Variations

In general, soil moisture content was lowest in the top layers of the profiles and increased with depth. These moisture profiles changed in the dry season, where relatively low soil moisture content was found in greater depths. However, soil moisture content in the observed profiles varied widely between treatments. While the topsoil was driest in CER in all seasons, soil moisture content in the topsoil layers showed only little variation between the other treatments, with COP having the lowest soil moisture content during the peak of the dry season and ICL having higher soil moisture content during the rainy season (Figure 4). In contrast, in profile layers deeper than 30 cm, soil moisture content was, on average, the lowest in ICLF. However, the differences between ICLF and CER in soil moisture content in the deeper soil layers were strongly seasonal, with a large difference during the rainy season and similar values during the dry season. COP and ICL had, on average, soil moisture contents in the deeper soil layers similar to CER, but during the dry season, soil moisture content was higher in COP and ICL than in CER.
The upper layers of the soil in the Cerrado have been described as relatively dry, with values below the permanent wilting point during the dry season [35] and a study comparing the hydrology of catchments predominated by either Cerrado or pasture found significantly higher streamflow values in the pasture catchment indicating higher evapotranspiration of the forest [28], confirming results from Dias et al. [36]. Despite the extensive land conversion from Cerrado to pasture in recent years, studies directly comparing soil moisture content between the two land use types are scarce. With a lower bulk density and a higher share of organic matter, the topsoil of CER should have a higher water retention than the other land use systems. Further, evaporation from the topsoil has been found to be lower in the forest than in an open pasture [37], as the tree canopy strongly limits the radiation reaching the ground and the soil is covered with a layer of litter. A layer of litter, which was present in CER year-round, not only strongly limits evaporation [37] but also intercepts a substantial share of rain in the Cerrado [38]. Interception from Cerrado canopy was estimated to be around 20% of total precipitation [6], which in turn is directly contributing to higher evapotranspiration of Cerrado systems compared to other land-use types.
We are aware that litter can also lead to errors when measuring soil moisture with permittivity sensors [39], such as the one used in our study. The access tube needs to be in close contact with the surrounding soil for a precise FDR measurement (Delta-T Devices Ltd., Cambridge, UK, 2016), and in CER, the upper 2–3 cm of the access tube was in contact with a layer of litter in a stage of decomposition, which impeded the required close contact, the precision of the soil moisture measurements at 10 cm depth can be questioned. However, soil moisture content at 20 cm depth in CER was also lower than in the other land use types, and its measurement was not affected by the layer of litter. As evaporation and litter-related measurement errors can be, thus, excluded as causes for the lower values of soil moisture content in CER, a possible explanation could be the soil-specific characteristics found in Ferralsols under native Savannah vegetation. Natural ferralsols have a granular macrostructure due to the gibbsitic (aluminium hydroxide) mineralogy [40], resulting in a high amount of macropores and micropores [41]. The stable soil structure is based on the bonds between negatively charged clay minerals and positively charged Aluminum hydroxide. Juhász et al. [42] found in the topsoil under native Cerrado vegetation (cerradão) low soil, bulk density and low water retention caused by high organic matter content and high total macroporosity. According to this study, water infiltration, conductivity, and retention depend on the shape of the pores and, consequently, on soil structure. The pore shapes found in the topsoil of these natural Ferralsols favour water infiltration and conductivity, which is a disadvantage to retention. Furthermore, natural Ferralsols were found to have more macropores under native perennial vegetation due to the formation of biopores [43]. The high total macroporosity, low water retention, and higher saturated hydraulic conductivity in the topsoil of CER (Table 1) could explain the low soil moisture content values in this treatment. Moreover, the slope of the CER retention curve (Figure 7) is steeper compared to the other treatments, indicating that soil moisture is less retained. In the pasture systems without trees COP and ICL, water was mainly lost from the upper 40 cm of the soil, while in CER, the largest share of water lost, in the upper 1 m of the soil was depleted between 20 and 40 cm depth (Figure 5). In ICLF, most of the water was extracted below 40 cm at the end of the wet season, but with increasing water deficit, a larger share of water was lost from the upper part of the soil. In the pasture, it can be expected that the largest share of water is lost from the upper part of the soil, as more than 80% of the roots of Brachiaria brizantha are found in the upper 30 cm of the soil [15]. For the ICLF system, soil moisture content values have been averaged from measurements taken along a transect between the tree rows to account for variability in soil moisture caused by the distance from the trees [14]. Bosi et al. [13] found the largest fluctuation in soil moisture content in the upper 30 cm of the soil in an ICLF system. However, they also described a fast soil water withdrawal closer to the trees, indicating a higher water uptake by the trees than by the pasture. Even though Eucalyptus has a large share of its root system in the top layers of the soil, its roots grow far beyond the depth of 1 m [44]. The varying depth of the zone of the largest water extraction found in our study (Figure 5) indicates a shift in water uptake to greater depth during the dry season. As with decreasing soil moisture content from the end of the wet season to the end of the dry season, water extraction at 1 m depth in ICLF diminished, and a larger share of water was probably extracted from greater depth. In a study from south-eastern Brazil, deep water uptake by Eucalyptus roots accounted for a relatively small proportion of the total water uptake, but during the dry season, trees increased the share of the water taken up near the water table at 12 m depth [45]. Similar effects were reported for the Cerrado. Even with the highest root density being found in the topsoil in a Cerrado forest and more than 90% of the fine roots in the upper 1 m of the soil, deep water uptake accounted for 83% of the total water use during the dry season [8]. However, as soil moisture content was much lower in ICLF than in CER between 40 and 100 cm during the rainy season (Figure 4), Eucalyptus trees probably take up more water in the upper part of the rooted subsoil (40–100 cm) than the Cerrado vegetation during periods of high water availability. Further, as soil moisture content was much lower in ICLF than in CER at 1 m depth throughout the year (Figure 4), we hypothesize that the shift in water uptake to greater depth in response to low soil moisture content is taking place earlier in CER resulting in water conservation. This aspect of seasonal dynamics of the water balance between natural Cerrado and ICLF systems needs to be investigated in more detail if systems’ sustainability should be assessed, especially since other essential ecosystem processes related to water availability may have changed. Eucalyptus trees are by far the most dominant tree species used in ICLF systems, and the potential of other (native) tree species to be used in ICLF systems appears not to have been fully evaluated yet. However, by contributing to increased evapotranspiration, Eucalyptus or other trees may directly compensate for reduced water recycling to the atmosphere that has been reported from other land use systems established in previous Cerrado areas [5,46]. From this perspective, integrated systems, including trees, are closer to the natural Cerrado than pasture and other integrated systems. In view of the serious consequences caused by altered water cycles because of land use change, ICLF systems should be considered as an additional option to mitigate previous land use change effects in the context of sustainable intensification.

5. Conclusions

Integrated systems may offer a good alternative to traditional pastures in terms of soil health and sustainable water management. Trees as components of integrated land use systems indicate the potential of restoring natural ecosystem functions with regard to water recycling to the atmosphere and consequentially suggest the possibility of partly compensating for Cerrado deforestation. However, the complexity of integrated systems and natural climate variability need further in-depth analysis of seasonal and spatial soil water dynamics in order to improve our understanding of ecological functions and processes towards sustainable land use management.

Author Contributions

Conceptualization, S.G., D.J.B., M.G. and M.C.M.M.; Formal analysis, S.G. and M.P.B.; Investigation, S.G. and M.P.B.; Methodology, S.G., M.G. and F.A.; Project administration, M.G.; Resources, R.G.d.A., D.J.B., M.G. and F.A.; Supervision, M.G. and F.A.; Writing—original draft, S.G. and S.S.; Writing—review and editing, S.G., M.G. and F.A. All authors have read and agreed to the published version of the manuscript.

Funding

This research was funded by the Anton & Petra Ehrmann-Stiftung Research Training Group “Water—People—Agriculture (WPA)” at the University of Hohenheim, Germany.

Data Availability Statement

All data supporting the findings of this study are available from the corresponding author upon reasonable request.

Acknowledgments

Help and support of the field and laboratory staff, the students, and interns from EMBRAPA Beef Cattle is gratefully acknowledged.

Conflicts of Interest

The authors declare no conflicts of interest. The funders had no role in the design of the study; in the collection, analyses, or interpretation of data; in the writing of the manuscript; or in the decision to publish the results.

References

  1. Hunke, P.; Mueller, E.N.; Schröder, B.; Zeilhofer, P. The Brazilian Cerrado: Assessment of water and soil degradation in catchments under intensive agricultural use: Ecohydrological assessment of the Brazilian Cerrado. Ecohydrology 2015, 8, 1154–1180. [Google Scholar] [CrossRef]
  2. Sano, E.E.; Rosa, R.; Brito, J.L.S.; Ferreira, L.G. Land cover mapping of the tropical savanna region in Brazil. Environ. Monit. Assess. 2010, 166, 113–124. [Google Scholar] [CrossRef]
  3. Klink, C.A.; Machado, R.B. Conservation of the Brazilian Cerrado. Conserv. Biol. 2005, 19, 707–713. [Google Scholar] [CrossRef]
  4. Marris, E. The forgotten ecosystem. Nature 2005, 437, 944–945. [Google Scholar] [CrossRef]
  5. Spera, S.A.; Galford, G.L.; Coe, M.T.; Macedo, M.N.; Mustard, J.F. Land-use change affects water recycling in Brazil’s last agricultural frontier. Glob. Chang. Biol. 2016, 22, 3405–3413. [Google Scholar] [CrossRef]
  6. Oliveira, P.T.S.; Nearing, M.A.; Moran, M.S.; Goodrich, D.C.; Wendland, E.; Gupta, H.V. Trends in water balance components across the Brazilian Cerrado. Water Resour. Res. 2014, 50, 7100–7114. [Google Scholar] [CrossRef]
  7. Butt, N.; de Oliveira, P.A.; Costa, M.H. Evidence that deforestation affects the onset of the rainy season in Rondonia, Brazil. J. Geophys. Res. Atmos. 2011, 116, D11120. [Google Scholar] [CrossRef]
  8. Oliveira, R.S.; Bezerra, L.; Davidson, E.A.; Pinto, F.; Klink, C.A.; Nepstad, D.C.; Moreira, A. Deep root function in soil water dynamics in cerrado savannas of central Brazil. Funct. Ecol. 2005, 19, 574–581. [Google Scholar] [CrossRef]
  9. Quesada, C.A.; Hodnett, M.G.; Breyer, L.M.; Santos, A.J.B.; Andrade, S.; Miranda, H.S.; Miranda, C.; Lloyd, J. Seasonal variations in soil water in two woodland savannas of central Brazil with different fire history. Tree Phys. 2008, 28, 405–415. [Google Scholar] [CrossRef] [PubMed]
  10. Balbino, L.C.; Cordeiro, L.A.M.; Porfírio-da-Silva, V.; Moraes, A.de; Martínez, G.B.; Alvarenga, R.C.; Kichel, A.N.; Fontaneli, R.S.; dos Santos, H.P.; Franchini, J.C.; et al. Evolução tecnológica e arranjos produtivos de sistemas de integração lavoura-pecuária-floresta no Brasil. Pesqui. Agropecuária Bras. 2011, 46, 1–12. [Google Scholar] [CrossRef]
  11. Bono, J.A.M.; Macedo, M.C.M.; Tormena, C.A.; Nanni, M.R.; Gomes, E.P.; Müller, M.M.L. Infiltração de água no solo em um latossolo vermelho da região sudoeste dos cerrados com diferentes sistemas de uso e manejo. Rev. Bras. Ciência Solo 2012, 36, 1845–1853. [Google Scholar] [CrossRef]
  12. Nair, P.K.R. An Introduction to Agroforestry; Springer Science & Business Media: Berlin/Heidelberg, Germany, 1993; p. 499. [Google Scholar]
  13. Bosi, C.; Pezzopane, J.R.M.; Sentelhas, P.C. Soil water availability in a full sun pasture and in a silvopastoral system with eucalyptus. Agrofor. Syst. 2020, 94, 429–440. [Google Scholar] [CrossRef]
  14. Glatzle, S.; Stuerz, S.; Giese, M.; Pereira, M.; de Almeida, R.G.; Bungenstab, D.J.; Macedo, M.C.M.; Asch, F. Seasonal Dynamics of Soil Moisture in an Integrated-Crop-Livestock-Forestry System in Central-West Brazil. Agriculture 2021, 11, 245. [Google Scholar] [CrossRef]
  15. Guenni, O.; Marín, D.; Baruch, Z. Responses to drought of five Brachiaria species. I. Biomass production, leaf growth, root distribution, water use and forage quality. Plant Soil 2002, 243, 229–241. [Google Scholar] [CrossRef]
  16. Jha, A.; Bonetti, S.; Smith, A.P.; Souza, R.; Calabrese, S. Linking soil structure, hydraulic properties, and organic carbon dynamics: A holistic framework to study the impact of climate change and land management. J. Geophys. Res. Biogeosci. 2023, 128, e2023JG007389. [Google Scholar] [CrossRef]
  17. IUSS Working Group WRB. World Reference Base for Soil Resources 2014, update 2015. In International Soil Classification System for Naming Soils and Creating Legends for Soil Maps; World Soil Resources Reports No. 106; FAO: Rome, Italy, 2015. [Google Scholar]
  18. de Sousa Neto, E.L.; Andrioli, I.; de Almeida, R.G.; Macedo, M.C.M.; Lal, R. Physical quality of an Oxisol under an integrated crop-livestock-forest system in the Brazilian Cerrado. Rev. Bras. Ciência Solo 2014, 38, 608–618. [Google Scholar] [CrossRef]
  19. Schaap, M.G.; Leij, F.J.; van Genuchten, M.T. Rosetta: A computer program for estimating soil hydraulic parameters with hierarchical pedotransfer functions. J. Hydrol. 2001, 251, 163–176. [Google Scholar] [CrossRef]
  20. R Core Team. R: A Language and Environment for Statistical Computing (3.5.3) [Computer Software]. R Foundation for Statistical Computing. 2019. Available online: https://www.R-project.org/ (accessed on 15 February 2020).
  21. Herrera, A.; Urich, R.; Rengifo, E.; Ballestrini, C.; González, A.; León, W. Transpiration in a eucalypt plantation and a savanna in Venezuela. Trees 2012, 26, 1759–1769. [Google Scholar] [CrossRef]
  22. Minasny, B.; McBratney, A.B. Limited effect of organic matter on soil available water capacity. Eur. J. Soil Sci. 2018, 69, 39–47. [Google Scholar] [CrossRef]
  23. Iqbal, R.; Raza, M.A.S.; Valipour, M.; Saleem, M.F.; Zaheer, M.S.; Ahmad, S.; Toleikiene, M.; Haider, I.; Aslam, M.U.; Nazar, M.A. Potential agricultural and environmental benefits of mulches—A review. Bull. Natl. Res. Cent. 2020, 44, 75. [Google Scholar] [CrossRef]
  24. Anache, J.A.A.; Wendland, E.; Rosalem, L.M.P.; Youlton, C.; Oliveira, P.T.S. Hydrological trade-offs due to different land covers and land uses in the Brazilian Cerrado. Hydrol. Earth Syst. Sci. 2019, 23, 1263–1279. [Google Scholar] [CrossRef]
  25. de Oliveira, O.C.; de Oliveira, I.P.; Alves, B.J.R.; Urquiaga, S.; Boddey, R.M. Chemical and biological indicators of decline/degradation of Brachiaria pastures in the Brazilian Cerrado. Agric. Ecosys. Environ. 2004, 103, 289–300. [Google Scholar] [CrossRef]
  26. Drewry, J.J.; Cameron, K.C.; Buchan, G.D. Pasture yield and soil physical property responses to soil compaction from treading and grazing—A review. Soil Res. 2008, 46, 237–256. [Google Scholar] [CrossRef]
  27. Greenwood, K.L.; McKenzie, B.M. Grazing effects on soil physical properties and the consequences for pastures: A review. Aus. J. Exp. Agric. 2001, 41, 1231–1250. [Google Scholar] [CrossRef]
  28. Nóbrega, R.L.B.; Guzha, A.C.; Torres, G.N.; Kovacs, K.; Lamparter, G.; Amorim, R.S.S.; Couto, E.; Gerold, G. Effects of conversion of native Cerrado vegetation to pasture on soil hydro-physical properties, evapotranspiration and streamflow on the Amazonian agricultural frontier. PLoS ONE 2017, 12, e0179414. [Google Scholar] [CrossRef] [PubMed]
  29. Shah, A.N.; Tanveer, M.; Shahzad, B.; Yang, G.; Fahad, S.; Ali, S.; Bukhari, M.A.; Tung, S.A.; Hafeez, A.; Souliyanonh, B. Soil compaction effects on soil health and crop productivity: An overview. Environ. Sci. Pollut. Res. 2017, 24, 10056–10067. [Google Scholar] [CrossRef]
  30. He, J.; Li, H.; Rasaily, R.G.; Wang, Q.; Cai, G.; Su, Y.; Qiao, X.; Liu, L. Soil properties and crop yields after 11 years of no tillage farming in wheat–maize cropping system in North China Plain. Soil Tillage Res. 2011, 113, 48–54. [Google Scholar] [CrossRef]
  31. Strudley, M.W.; Green, T.R.; Ascough, J.C. Tillage effects on soil hydraulic properties in space and time: State of the science. Soil Tillage Res. 2008, 99, 4–48. [Google Scholar] [CrossRef]
  32. Moreira, G.M.; Neves, J.C.L.; Rocha, G.C.; Magalhães, C.A.d.S.; Farias Neto, A.L.; Meneguci, J.L.P.; Fernandes, R.B.A. Physical quality of soil under a crop-livestock-forestry system in the cerrado/amazon transition region. Rev. Árvore 2018, 42, e420213. [Google Scholar] [CrossRef]
  33. Assis, P.C.R.; Stone, L.F.; Medeiros, J.C.; Madari, B.E.; Oliveira, J.d.M.; Wruck, F.J. Atributos físicos do solo em sistemas de integração lavoura-pecuária-floresta. Rev. Bras. Eng. Agríc. Ambient. 2015, 19, 309–316. [Google Scholar] [CrossRef]
  34. Feitosa, C.E.L.; Costa, P.H.d.S.; de Meneses, K.C.; de Oliveira, U.C.; de Farias, M.F. Changes in physical quality of oxisols under different management systems in the Brazilian Cerrado. Eng. Agríc. 2020, 40, 609–616. [Google Scholar] [CrossRef]
  35. Eiten, G. The cerrado vegetation of Brazil. Bot. Rev. 1972, 38, 201–341. [Google Scholar] [CrossRef]
  36. Dias, L.C.P.; Macedo, M.N.; Costa, M.H.; Coe, M.T.; Neill, C. Effects of land cover change on evapotranspiration and streamflow of small catchments in the Upper Xingu River Basin, Central Brazil. J. Hydrol. Reg. Stud. 2015, 4, 108–122. [Google Scholar] [CrossRef]
  37. Magliano, P.N.; Giménez, R.; Houspanossian, J.; Páez, R.A.; Nosetto, M.D.; Fernández, R.J.; Jobbágy, E.G. Litter is more effective than forest canopy reducing soil evaporation in Dry Chaco rangelands. Ecohydrology 2017, 10, e1879. [Google Scholar] [CrossRef]
  38. Rosalem, L.M.P.; Anache, J.A.A.; Wendland, E. Determining forest litter interception in an area of the Cerrado sensu stricto. RBRH 2018, 23, e26. [Google Scholar] [CrossRef]
  39. Schunk, C.; Leuchner, M.; Wastl, C.; Ruth, B.; Menzel, A. Comparison of different methods for the in situ measurement of forest litter moisture content. Nat. Hazards Earth Syst. Sci. 2015, 3, 3733. [Google Scholar] [CrossRef]
  40. Ferreira, M.M.; Fernandes, B.; Curi, N. Mineralogia da fração argila e estrutura de latossolos da região sudeste do Brasil. Rev. Bras. Ciência Solo 1999, 23, 507–514. [Google Scholar] [CrossRef]
  41. Ferreira, M.M.; Fernandes, B.; Curi, N. Influência da mineralogia da fração argila nas propriedades físicas de latossolos da região sudeste do Brasil. Rev. Bras. Ciência Solo 1999, 23, 515–524. [Google Scholar] [CrossRef]
  42. Juhász, C.E.P.; Cooper, M.; Cursi, P.R.; Ketzer, A.O.; Toma, R.S. Savanna woodland soil micromorphology related to water retention. Sci. Agric. 2007, 64, 344–354. [Google Scholar] [CrossRef]
  43. Salako, F.K.; Kirchhof, G. Field hydraulic properties of an Alfisol under various fallow systems in southwestern Nigeria. Soil Use Manag. 2003, 19, 340–346. [Google Scholar] [CrossRef]
  44. Bouillet, J.-P.; Laclau, J.-P.; Arnaud, M.; M’Bou, A.T.; Saint-André, L.; Jourdan, C. Changes with age in the spatial distribution of roots of Eucalyptus clone in Congo: Impact on water and nutrient uptake. Forest Ecol. Manag. 2002, 171, 43–57. [Google Scholar] [CrossRef]
  45. Christina, M.; Nouvellon, Y.; Laclau, J.; Stape, J.; Bouillet, J.; Lambais, G.R.; Maire, G. Importance of deep water uptake in tropical eucalypt forest. Funct. Ecol. 2017, 31, 509–519. [Google Scholar] [CrossRef]
  46. Oliveira, P.T.S.; Wendland, E.; Nearing, M.A.; Perea Martins, J. Interception of rainfall and surface runoff in the Brazilian Cerrado. Geophys. Res. Abstracts 2014, 16, 4780. [Google Scholar] [CrossRef]
Figure 1. Monthly precipitation, mean air temperature, and mean daily solar radiation recorded over the experimental period at the EMBRAPA Beef Cattle station in Campo Grande, Mato Grosso do Sul, Brazil (20°24′54.9″ S, 54°42′25.8″, altitude 530 m) with a nearby meteorological station.
Land 13 00221 g001
Figure 2. Top part: Map of the study area indicating the location of the four treatments and replications. CER: Cerrado (natural Savannah vegetation), ICLF: integrated-crop-livestock-forestry system, ICL: integrated crop-livestock system, COP: continuous pasture. Bottom part: Aspects of the respective treatments.
Land 13 00221 g002
Figure 3. Monthly mean soil moisture content [vol%] for CER: Cerrado, COP: continuous pasture, ICL: integrated crop-livestock, and ICLF: integrated crop-livestock-forestry across 0–100 cm soil profile from Nov 2015 until Aug 2017. Bars represent standard errors with n = 3. Dashed horizontal lines indicate plant-usable field capacity between pF 1.8–2.5 (field capacity) and pF 4.2 (permanent wilting point).
Land 13 00221 g003
Figure 4. Soil moisture content [vol%] for 10 to 100 cm profile depth shown as monthly means for the four treatments: CER = Cerrado, ICLF = integrated crop-livestock-forestry, ICL = integrated crop-livestock, COP = continuous pasture. RS: rainy season, DS: dry season.
Land 13 00221 g004
Figure 5. Soil moisture [vol%] kinetics shown for 10 to 100 cm profile depth during dry spells of at least three weeks without rain in three distinguished seasons for the four treatments CER = Cerrado, ICLF = integrated crop-livestock-forestry, ICL = integrated crop-livestock, COP = continuous pasture. Horizontal bars show the water amount of water lost to evaporation in mm from the different soil depths over the course of the respective dry spell. Data are shown as averages over three replications. Error bars have been omitted for clarity.
Land 13 00221 g005
Figure 6. Time courses of aboveground biomass dry matter (AGBM) for the four treatments CER = Cerrado, ICLF = integrated crop-livestock-forestry, ICL = integrated crop-livestock, COP = continuous pasture. Stacked bars show the total AGBM, including standing green, standing dead and litter biomass (from tree biomass, only litter was sampled). Data are shown as averages over three replications. Error bars = Standard error of means.
Land 13 00221 g006
Figure 7. Water retention curves for the soils in the four treatments CER = Cerrado, ICL = integrated crop-livestock, ICLF = integrated crop-livestock-forestry, COP = continuous pasture. Curves were calculated using Rosetta Lite v. 1.1 within the software package HYDRUS 1D by PC Progress.
Land 13 00221 g007
Table 1. Soil characteristics for the treatments CER: Cerrado (natural Savannah vegetation), ICLF: integrated-crop-livestock-forestry system, ICL: integrated crop-livestock system, COP: continuous pasture. SCL: sandy clay loam, SC: sandy clay.
pHBDSOCTexture [%]Ksat
Depth [cm](CaCl2)[g cm−3][%]SandSiltClay [cm d−1]
Cerrado (CER)
104.30.913.1356737SC107.1
204.30.942.0853839SC99.8
304.41.001.6852741SC83.4
404.61.051.5951742SC71.9
60-0.99-----83.6
100-1.01-----79.7
mean4.40.982.1253740SC87.6
Integrated-crop-livestock-forestry system (ICLF)
105.41.241.8356638SC46.9
205.01.171.6055639SC55.5
304.81.111.3554739SC65.0
404.81.141.1855639SC60.3
60-1.14-----60.3
100-1.10-----67.2
mean5.01.151.4955639SC59.2
Integrated-crop-livestock system (ICL)
105.21.252.3953740SC41.5
205.11.181.8253740SC51.8
305.01.211.5053839SC47.4
404.81.191.2452741SC49.1
60-1.18-----50.6
100-1.10-----64.1
mean5.01.181.7461534SC50.7
Continuous pasture (COP)
104.91.341.7564531SCL49.1
204.81.241.5160634SCL57.5
304.71.281.2961435SCL52.1
404.61.241.0559437SC47.0
60-1.28-----47.0
100-1.21-----56.4
mean4.81.271.4061534SCL52.4
Table 2. Analysis of variance for soil moisture content in the soil profile 0–100 cm. Df = degrees of freedom, SS = sum of squares, MS = mean square, n = 3.
Soil Moisture Content [vol%] SM = TxM + R
DfSSMSp
Treatment (T)3888296<0.001
Month (M)212340111<0.001
Replication (R)23216<0.001
Interaction (T × M)631993<0.001
Residuals1742261
Table 3. Analysis of variance for soil moisture (SM). Df = degrees of freedom, SS = sum of squares, MS = mean square, n.s. = not significant at p < 0.05, n = 3.
SM SM = TxMxD + R
[vol%]DfSSMSp
Treatment (T)364982166<0.001
Month (M)2114657698<0.001
Depth (D)5238174763<0.001
Replication (R)211758<0.001
Interaction (T × M)63126120<0.001
Interaction (T × D)155623375<0.001
Interaction (M × D)105270126<0.001
Interaction (T × M × D)3158933n.s. < 0.064
Residuals105427383
Disclaimer/Publisher’s Note: The statements, opinions and data contained in all publications are solely those of the individual author(s) and contributor(s) and not of MDPI and/or the editor(s). MDPI and/or the editor(s) disclaim responsibility for any injury to people or property resulting from any ideas, methods, instructions or products referred to in the content.

