Abstract
Under China’s carbon neutrality vision, the integration of resource consumption and ecological protection in agricultural production requires increased attention to agroecology. This study comprehensively integrates the carbon impact within agricultural ecological efficiency (AEE). Based on the window analysis of super-SBM-undesirable and geographically and temporally weighted regression (GTWR) models, AEE and its influencing factors in China’s 31 provinces from 2000 to 2021 are measured, and then types categorized, mechanisms investigated, and optimization pathways provided. The results revealed that from 2000 to 2021, the AEE showed a growing trend, with the spatial agglomeration degree increased. Its gravity center presented a migration path of “northeast–southwest”. Driven by internal and external mechanisms, both agricultural production conditions and regional socio-economic conditions had a stronger positive effect and wider range of promotion on China’s AEE, and the positive contribution of physical environmental conditions decreased, while the inhibitory effect increased. Furthermore, this study divided three zones and emphasized that the agri-ecological power zone plays a demonstrative role in carbon sequestration and efficiency improvement, the eco-pollution balance zone needs to strike a balance between economic development and agricultural ecological development, and the agri-pollution power zone ought to reduce agricultural carbon emissions and mitigate its environmental impact.
1. Introduction
The increasingly warm and dry global climate has exerted a notable influence on human survival and agricultural production [1]. Under the global temperature control objective, China has put forward the ambitious vision of attaining carbon neutrality by 2060 to reduce the ecological impact on social development. Eco-efficiency was originally introduced by German scholars Schaltegger and Sturm [2], and its concept was defined as the ability to achieve maximum economic benefit while minimizing environmental impact through the efficient allocation of input factors, thereby enhancing human wellbeing and promoting harmonious co-existence between the environment and society. Then, the Organization for Economic Co-operation and Development (OECD) promoted this concept to research in the field of agricultural production [3]; since then, AEE has been a prominent global concern.
Under China’s vision of carbon neutrality, integrating resource consumption and ecological protection issues in agricultural production necessitates greater attention to the role of carbon in agroecological benefits [4,5]. AEE is the capacity to maximize the benefits of agricultural products and carbon sequestration while minimizing the negative ecological and environmental impacts of carbon emissions and other pollution in the agricultural production process. Accurately measuring China’s AEE and exploring avenues to improve it and mitigate environmental pollution are significant for advancing sustainable agricultural development and supporting the realization of the carbon neutrality vision.
Extensive research has been conducted on AEE, with the following main characteristics. Firstly, various research scales have been employed, including large-scale studies at the national level or above, such as in developing countries [6], Europe [7], and China [8]; medium-scale studies ranging from county to national levels, such as in the Yangtze River Basin [9] and Hunan Province [10]; and small-scale studies below the county level, such as regarding farms [11], orchards [12], and enterprises [13]. Secondly, the research has encompassed macroscopic, mesoscopic, and microscopic levels, including the spatial distribution patterns of regional AEE [8], the estimation of eco-efficiency within specific agricultural sectors [14], and the life cycles of individual or multiple agricultural products [15,16]. Moreover, a wide range of calculation methods are used in this field, such as data envelopment analysis (DEA) [8], stochastic frontier analysis [15], directional distance function [17], the dynamic weighted slacks-based measure model [18], the Malmquist index [19], etc. Among them, the DEA has been widely recognized and used. Additionally, there is a notable variation in the selection of indicators, and evaluation is primarily based on input–output considerations. Input indicators commonly include three categories: labor, land, and material resources [5]. Output indicators consist of expected and unexpected outputs, with agricultural GDP frequently being employed as the expected output [8]. Some studies have integrated agricultural social and ecological outputs into the expected outputs [5]; unexpected outputs are measured through indicators like agricultural carbon emissions and agricultural non-point source pollution (NPSP) [20]. Since there is a lack of a uniform approach, a standardized evaluation framework has to be established.
Agricultural production is intricately linked to the ecological environment. Globally, greenhouse gas emissions originating from agricultural activities contribute to approximately one-third of total anthropogenic greenhouse gas emissions [21,22]. This mainly includes carbon emissions from agricultural material inputs during production [23], methane (CH4) emissions from rice cultivation [24], nitrous oxide (N2O) emissions from soil due to crop planting [25], and CH4 and N2O emissions from animal husbandry, especially ruminant farming [26]. Correspondingly, in agriculture, through photosynthesis, crops absorb a significant amount of carbon dioxide (CO2), while the soil effectively sequesters carbon by harboring decomposing organisms, fostering carbon exchange between the crops and the soil [27]. Consequently, agriculture has the potential to mitigate up to 80% of its own greenhouse gas emissions [28]. Notably, Chinese agriculture boasts substantial carbon storage capabilities, as well [29,30,31]. With the influence of climate change, urbanization, and industrialization, China’s grain production and sales have undergone transformation patterns known as “northward expansion and central migration” and “north grain transport to south”. These processes have led to significant shifts in the structure of the agricultural output within the country [32,33]. Nevertheless, scant attention has been devoted to the comprehensive examination of the economic and ecological functions of agriculture, leaving a critical gap in evaluating the pivotal role of agriculture in carbon sequestration and emissions.
This study establishes a measurement system for evaluating China’s AEE under the context of the “dual carbon” goals, focusing on the planting industry, the narrow definition of agriculture, as the subject of investigation. Given the significant impacts of human activities on agriculture, diverse consumption patterns of crops wield a remarkable influence over the dynamic balance between carbon emissions and carbon sequestration. Consequently, this study solely concentrates on crop growth processes to evaluate the carbon sequestration function of agriculture. In the selection of indicators for input factors, the natural resources factor and the human and material resources factor are considered. The output structure is established based on expected and non-expected yields, wherein agricultural carbon and NPSP emissions are classified as non-expected outputs. The window analysis of the super-SBM-undesirable model is utilized to calculate the AEE of 31 provinces and municipalities in China from 2000 to 2021 (Hong Kong, Macao, and Taiwan are not included due to data limitations) and to evaluate the influencing factors under both internal and external mechanisms using the GTWR. Building upon the AEE and non-expected outputs, this study classifies the types of AEE situation in China. The insights garnered from these analyses provide valuable contributions towards achieving the high-quality development of China’s agriculture aligned with the carbon neutrality goals.
2. Methods and Data Sources
2.1. Methods
2.1.1. The Window Analysis of Super-SBM-Undesirable Model
The super-SBM-undesirable model is developed based on the DEA model, which is a mainstream technical tool for measuring efficiency. It is a multi-input and multi-output analytical model that does not require unified dimensional metrics or predetermined functional relationships. The resulting efficiency values maximize actual benefits and allow for an effective evaluation of decision-making units located on the frontier. Additionally, the model can eliminate efficiency deviations caused by pollution, providing a more accurate reflection of the essence of green development in China’s agricultural production [34,35]. The model is constructed as follows:
In the formula, , , and are, respectively, the input redundancy, the positive output deficiency and the negative output superscalar of the ith decision-making unit; , , and are corresponding vectors; γ is the weight vector; and σ is the AEE. The window analysis constructs the production frontier by using the period as the window width and treats the same decision unit in different periods as distinct decision units. By considering each period as a separate entity, window analysis enables the issues of discontinuity in the production frontier and the lack of comparability in cross-period analysis to be addressed, so that dynamic changes are effectively represented [36]. In this study, the window width is set to 20 to ensure an adequate number of DMUs in the DEA measurement. Moreover, by comparing all decision units within the same period, the limitation of comparing efficiency values across different periods in DEA calculation can be overcome.
According to the correspondence between input factors and output factors, as well as the accessibility of data, an indicator system of AEE evaluation is constructed (Table 1).

Table 1.
Indicator system of AEE evaluation.
2.1.2. GTWR Model
The GTWR considers the non-stationary time on top of spatial heterogeneity consideration, which can reflect the evolutionary relationship of variables in spatial–temporal scenes [39]. This study utilizes ArcGIS 10.8 software and the GTWR plugin developed by Huang et al. [40] to investigate the influencing factors of AEE in China. The formula is as follows:
where Gi is the explained variable of the ith space element; k is the number of explained variables; (xi,yi,ti) is the spatial longitude, latitude, and time coordinate of the ith space element; α0 is the constant term; αk is the regression coefficient of the kth explanatory variable; Xik is the kth explanatory variable at the ith space element; and ξi is the random error.
Agricultural production is a combined process of natural reproduction and economic reproduction [41], influenced by both internal conditions and external environment. To comprehensively understand the impact of various factors on China’s AEE, three aspects are considered: agricultural production conditions, physical environmental conditions, and socio-economic conditions. Thus, three major categories with a total of 15 variables were selected (Table 2). To avoid spurious regressions, a regression analysis was conducted to examine multicollinearity among all variables. The variance inflation factors are all below 10, which means all indicators passed the test. Regarding model fitting, the R-squared value exceeded 0.8, indicating that the GTWR effectively captures the influence of various factors on AEE.
Table 2.
Variables of influencing factors on AEE.
2.1.3. Regional Types of AEE Situation Method
The dynamic succession of agriculture functions, ecological products, and services due to system changes affects the level of agricultural sustainable development [42]. To improve agricultural ecological quality under the carbon neutrality goal, it is necessary to increase AEE and carbon sequestration while reducing the negative effects of undesirable outputs on the environment. Based on the dual dimensions of AEE and undesirable outputs, this paper categorizes three types of AEE situation: the agri-ecological power zone (AEPZ), eco-pollution balance zone (EPBZ), and agri-pollution power zone (APPZ).
According to the classification of AEE levels, scores of 3, 2, and 1 are assigned to high-efficiency, moderate-efficiency, and low-efficiency categories, respectively. By applying the entropy weighting method, a comprehensive score for undesirable output is calculated; using the percentile method, Chinese agricultural undesirable output is divided into three levels: high-output, moderate-output, and low-output, with corresponding scores of −3, −2, and −1. By combining the scores from AEE levels and undesirable output pollution levels, an evaluation matrix of the AEE situation is formed (Table 3).
Table 3.
Evaluation matrix of the AEE situation.
The AEPZ is the positive scoring region, where both agricultural production and ecological conservation are at a higher level, with AEE being higher than undesirable output. The EPBZ is a region with a score of 0, signifying that the level of AEE and the degree of undesirable output are equivalent. The APPZ is the negative scoring region, where the level of AEE falls below the undesirable output.
2.2. Data Sources
The statistical data used are all from the China Rural Statistical Yearbook and China Statistical Yearbook for the years 2001 to 2022. The parameters of various crops used in the calculation of agricultural carbon sequestration refer to the research by Tian et al. [32]. The coefficients of carbon emissions sources used in calculating agricultural greenhouse gas emissions refer to the research by Tian et al. [38], Min et al. [24], and Dong et al. [26]. The calculation of agricultural NPSP emissions, specifically regarding the loss or residue coefficients for nitrogen and phosphorus fertilizers, pesticides, and agricultural film, was referenced from the study conducted by Wang et al. [38]. The calculation of terrain and landform data was obtained by utilizing national DEM data, following the method developed by Feng et al. [43].
3. Results
3.1. Characteristic of Input and Output Factors
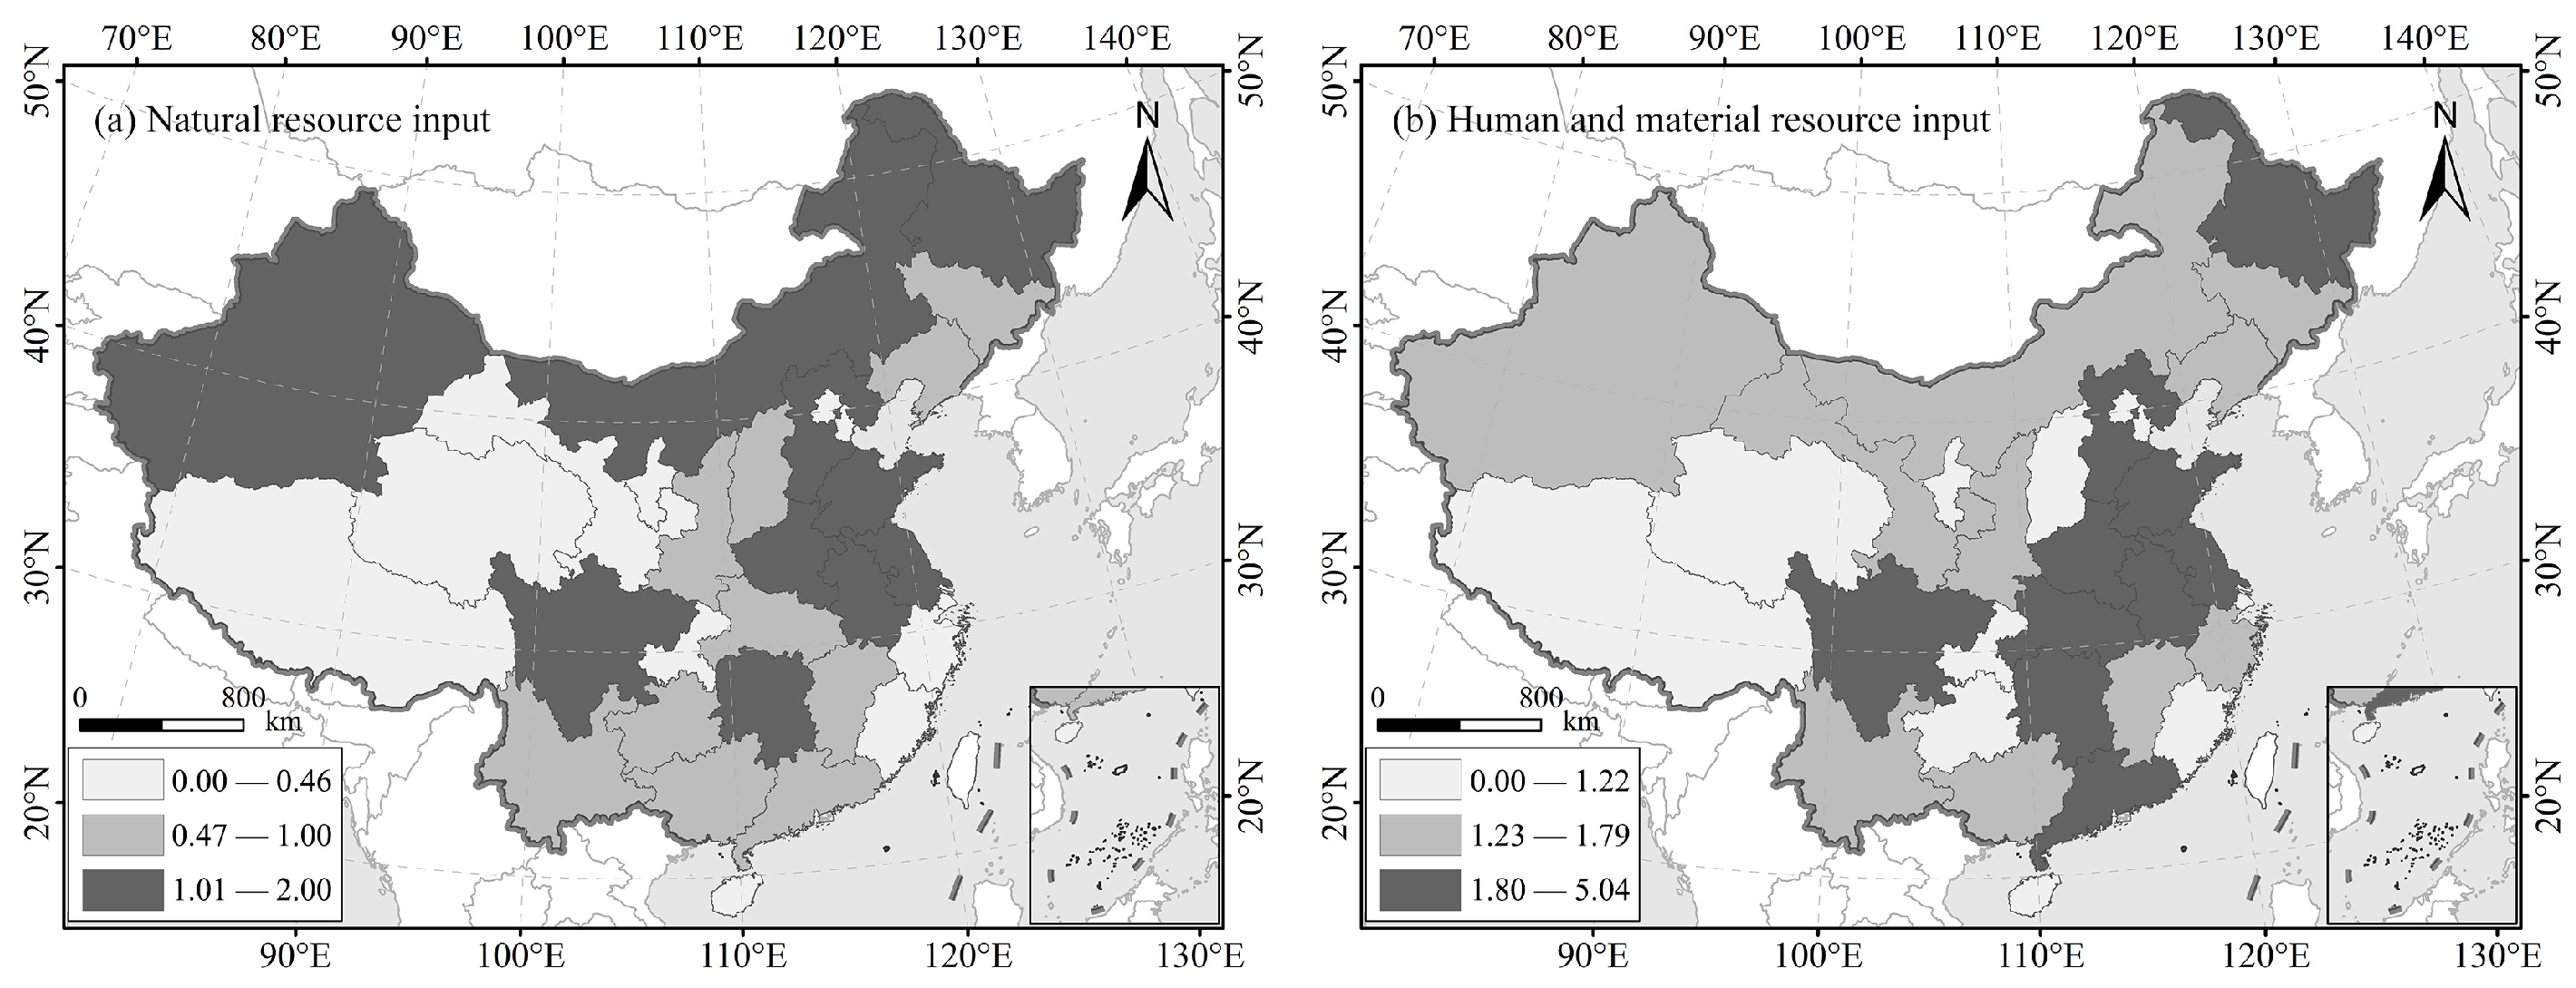
The mean values of each input indicator from 2000 to 2021 were standardized and summed to derive the values for natural resource elements and human and human-and-material resource elements. These values were then categorized into three groups using the quantile method (Figure 1). From 2000 to 2021, the input intensity of agricultural natural resources in eastern China surpassed that of the western region, while the southeast exhibited higher human and material resource intensity. Notably, Hebei, Henan, Shandong, Jiangsu, Anhui, Sichuan, Hunan, and Heilongjiang are in the high-value areas, indicating a significant emphasis on agriculture with substantial resource inputs.
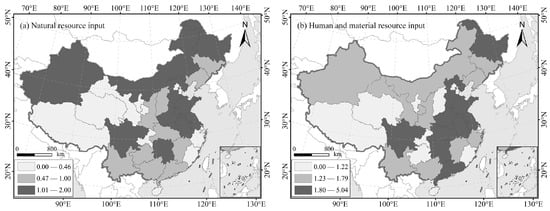
Figure 1.
The spatial differentiation of input factors from 2000 to 2021. (a) natural resource input; (b) human and material resource input.
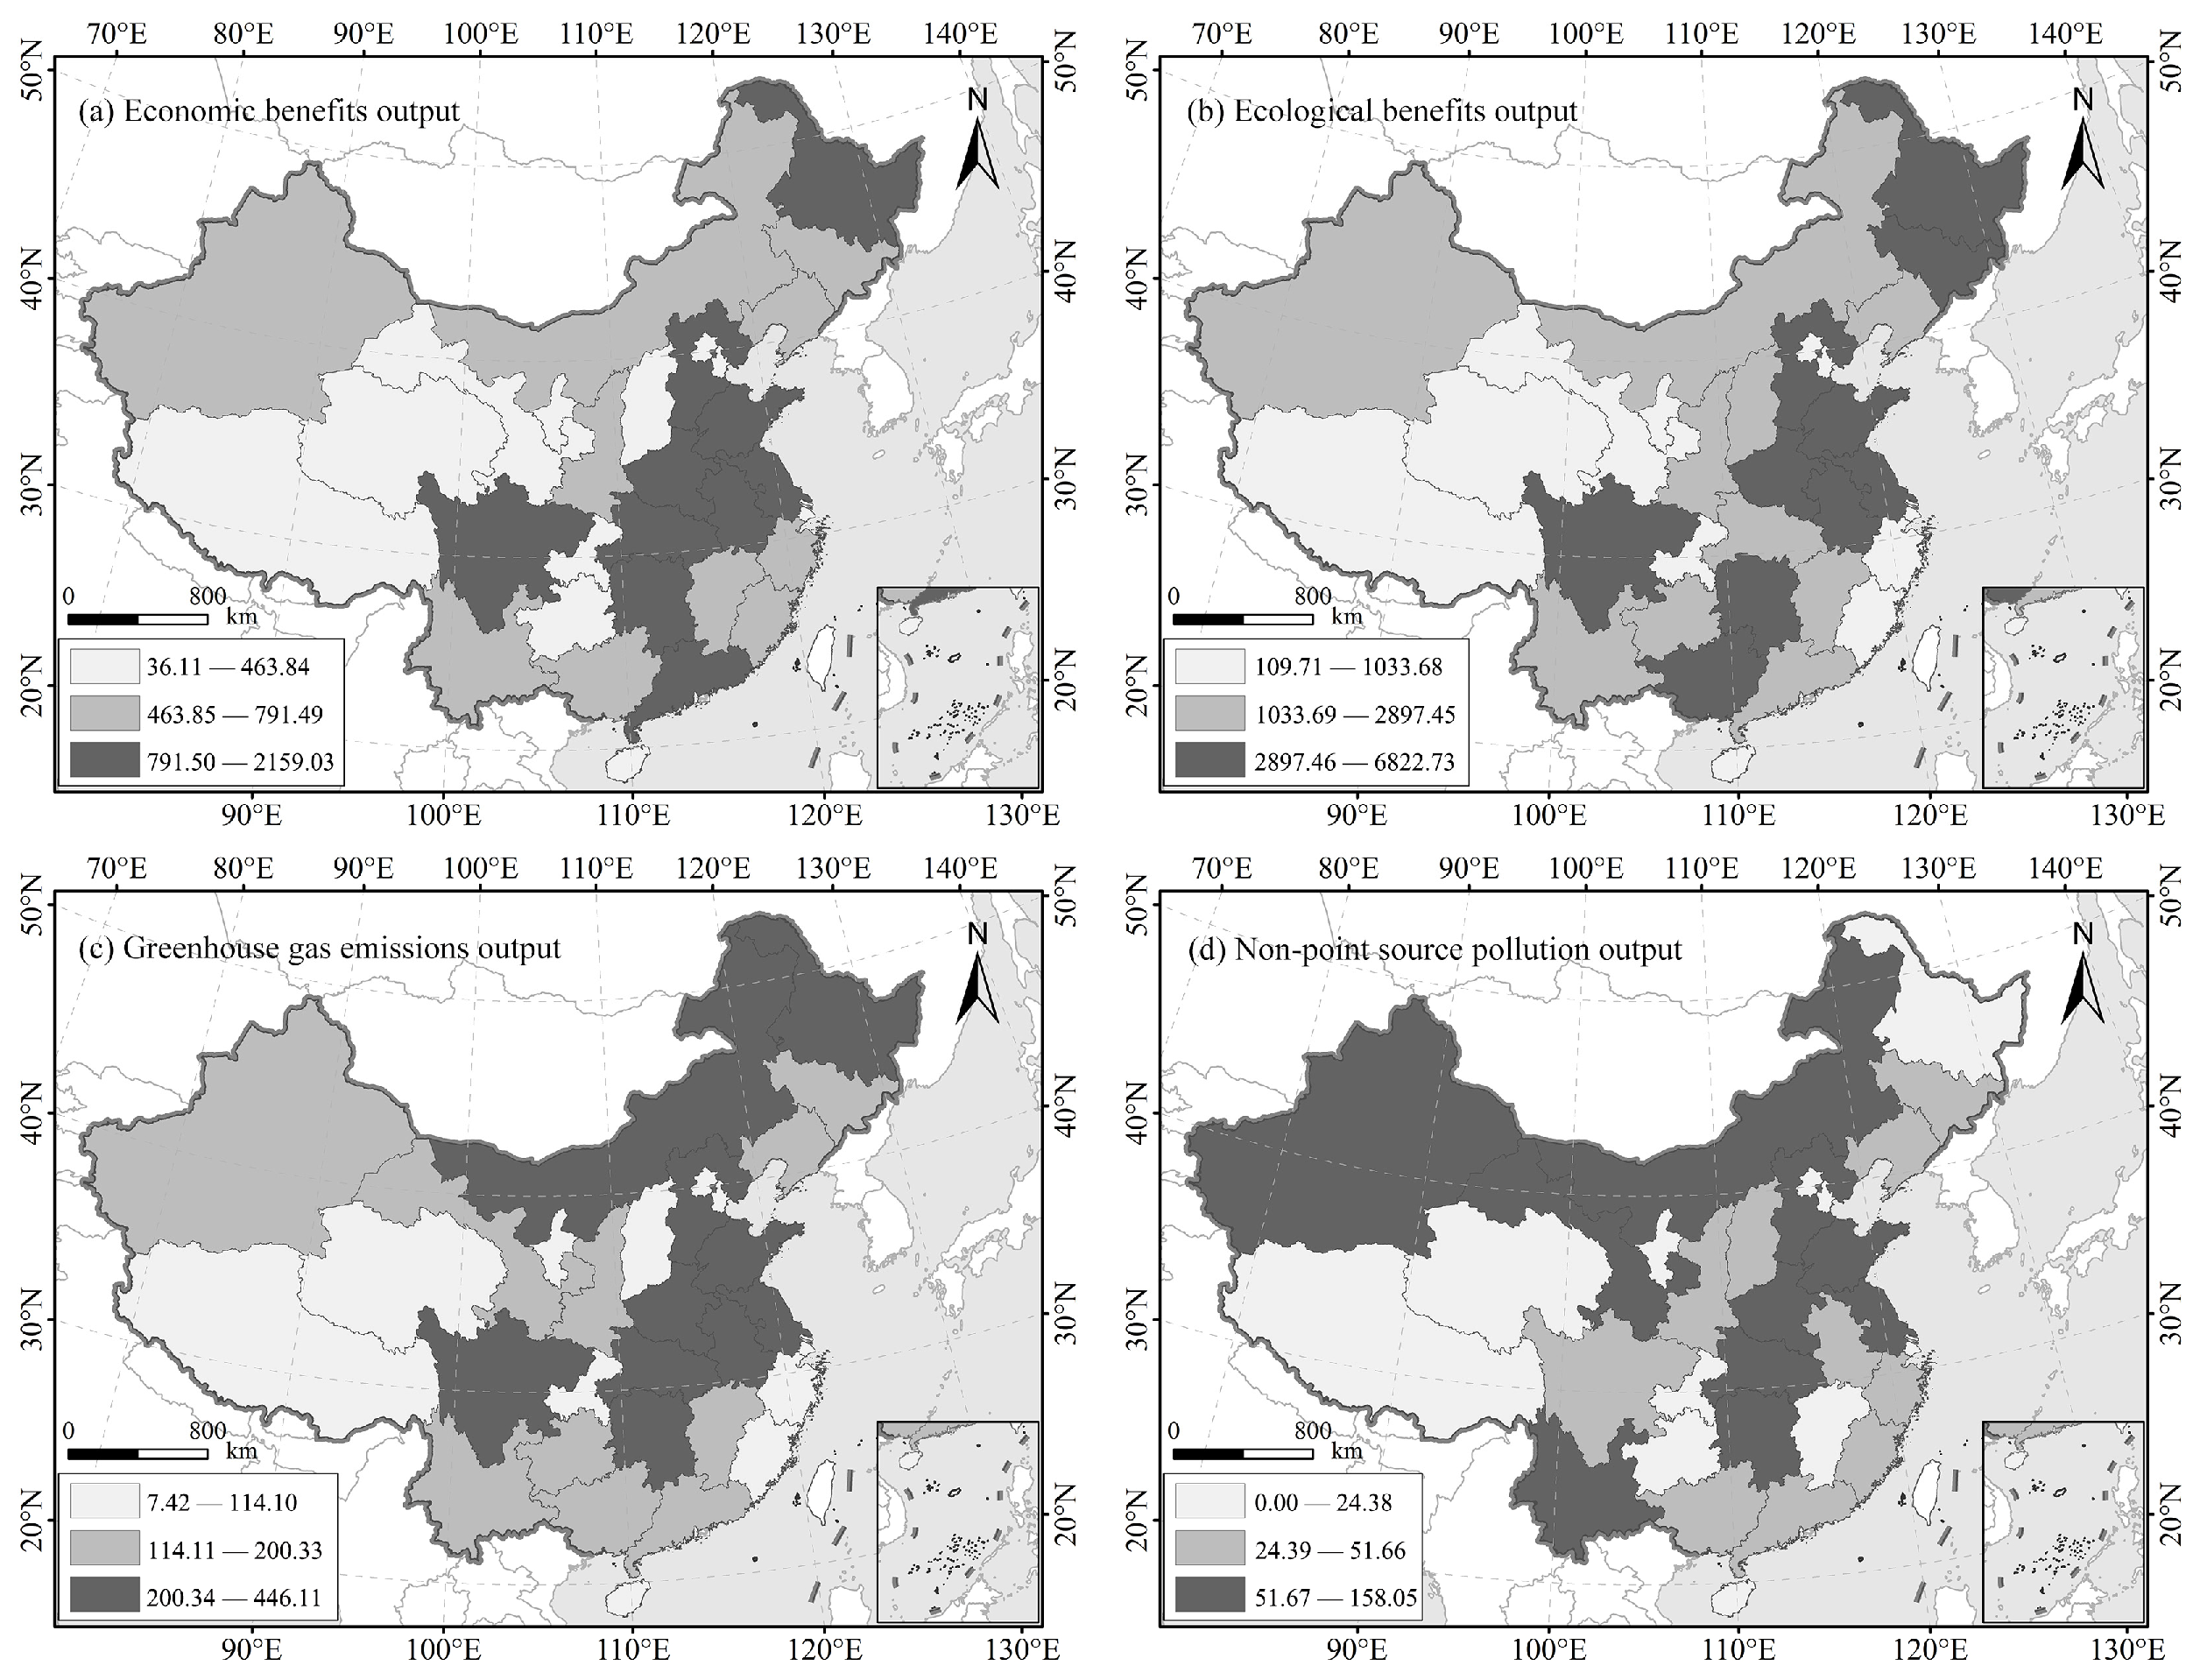
Output elements are categorized into three groups using the quantile method based on their mean values of each output indicator value from 2000 to 2021 (Figure 2). In terms of expected outputs, the eastern region demonstrates superior economic and ecological benefits compared to the western counterpart. Notably, Hebei, Henan, Shandong, Anhui, Jiangsu, Heilongjiang, Sichuan, and Hunan rank within the high-value areas for both expected outputs, highlighting their leadership in achieving agricultural production’s economic and ecological benefits. Conversely, from the standpoint of undesired outputs, the spatial distribution reveals that greenhouse gas emissions and non-point source pollution are more pronounced in the east than the west, and in the north relative to the south. Henan, Hebei, Shandong, Jiangsu, and Hunan were all in the high-value areas of the two undesired outputs, indicating that the region experiences the most substantial adverse effects during agricultural production.
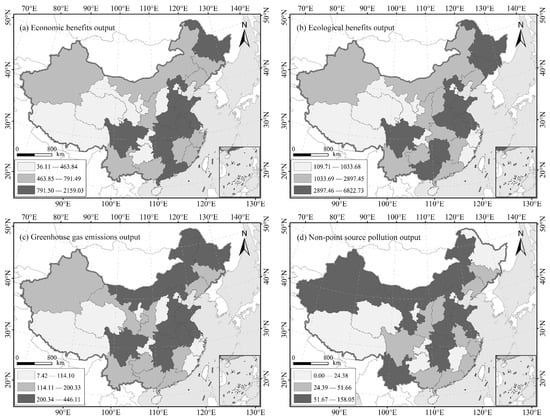
Figure 2.
The spatial differentiation of output factors from 2000 to 2021. (a) economic benefits output; (b) ecological benefits output; (c) greenhouse gas emissions output; (d) non-point source pollution output.
3.2. Evolution Process of AEE
3.2.1. Spatiotemporal Division of AEE
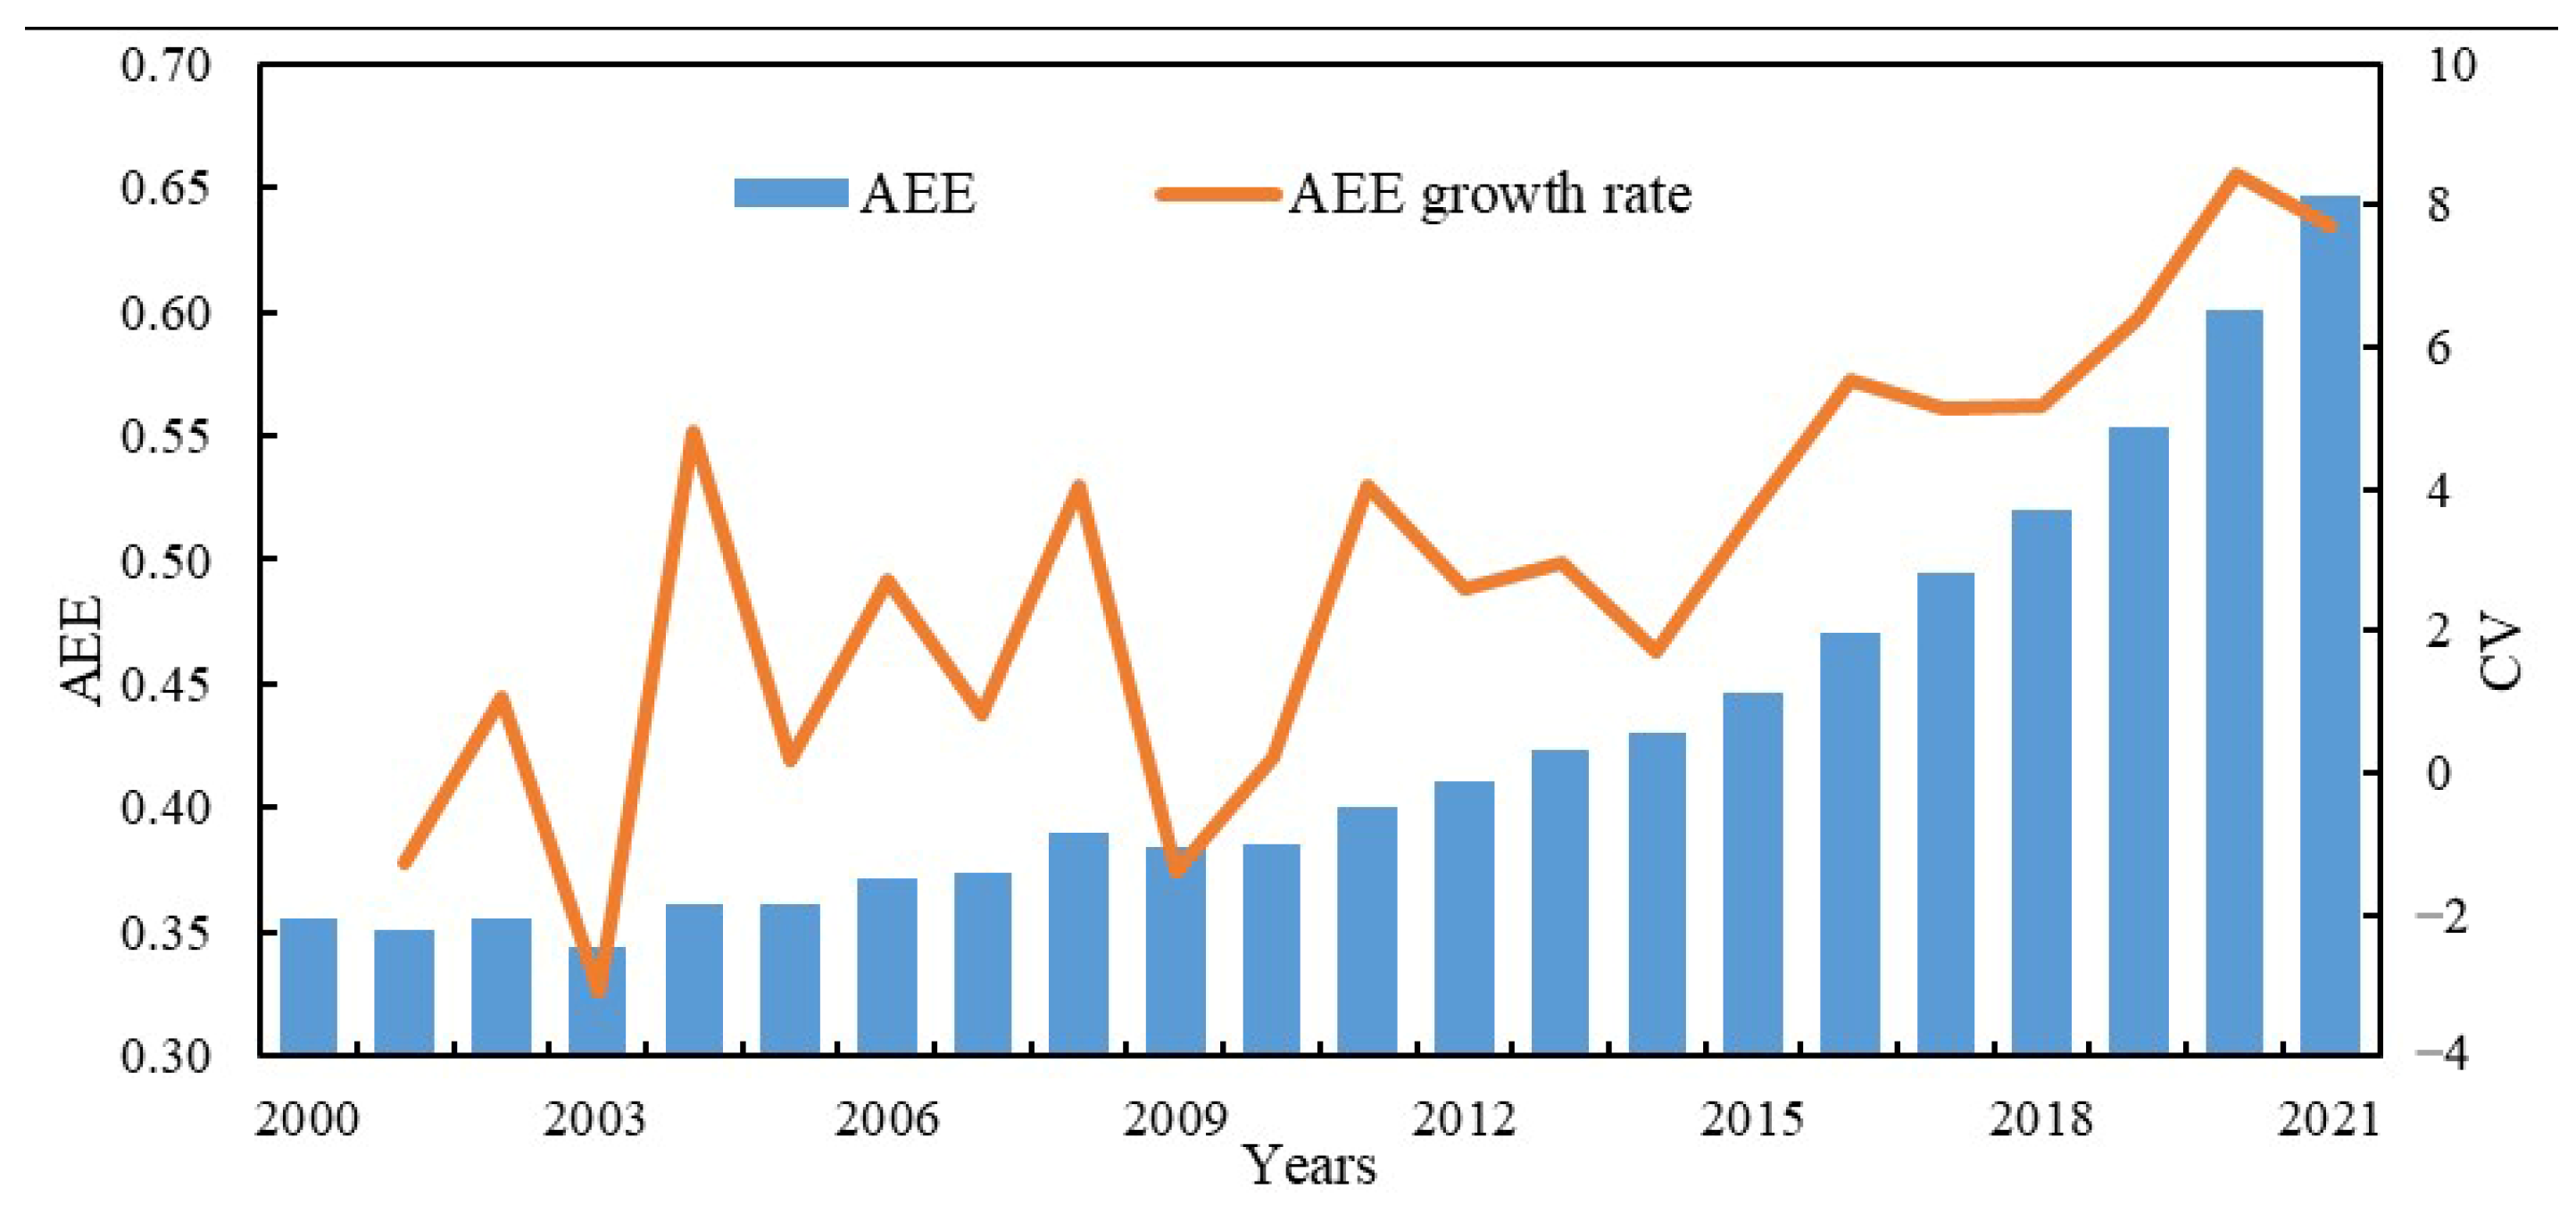
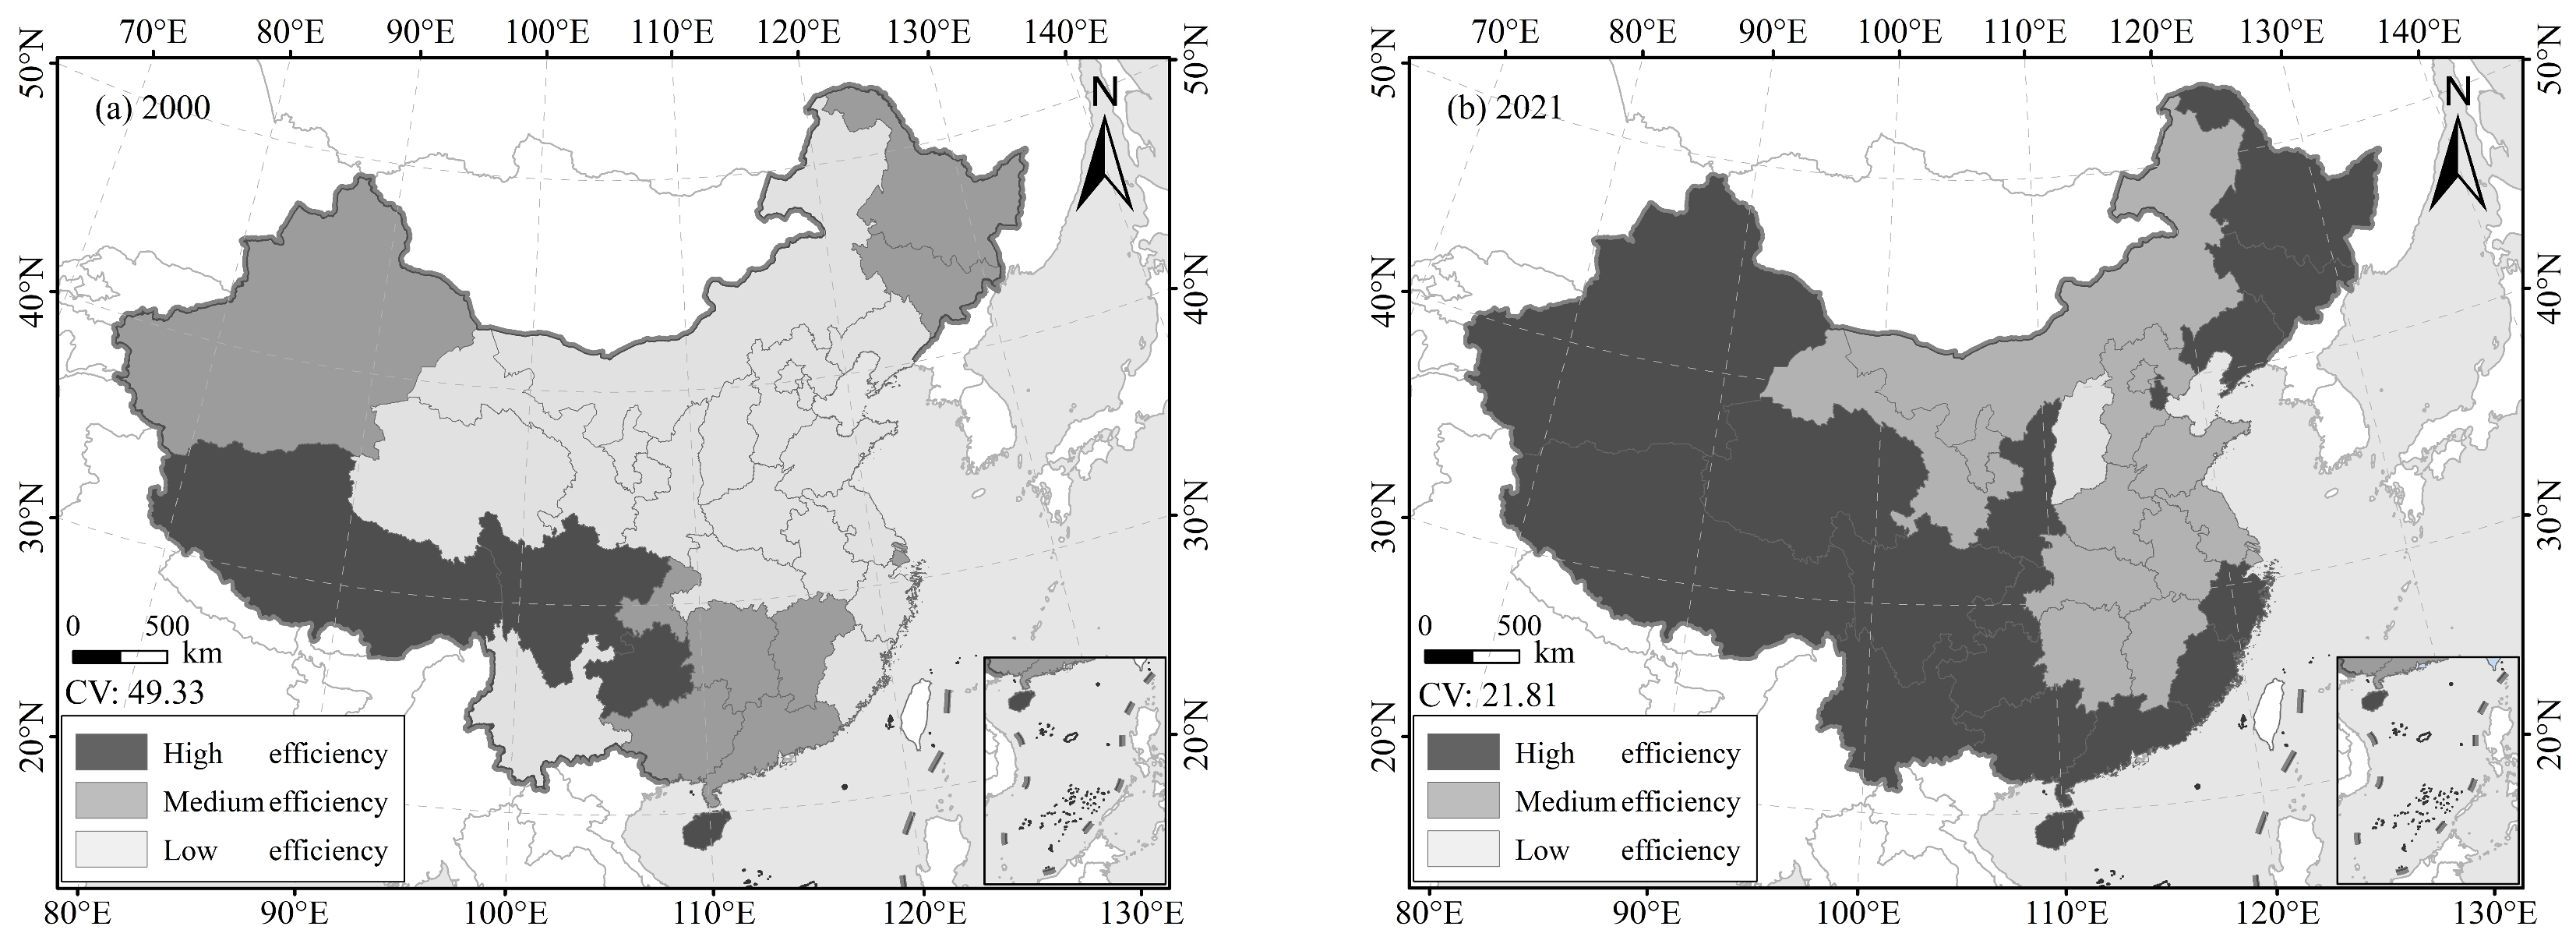
China’s AEE showed a growing trend from 2000 to 2021, with the efficiency value increasing from 0.36 to 0.65, an increase of 81.72%. The growth rate of AEE fluctuated, and from 2015 onwards, the fluctuation amplitude decreased, showing a sustained positive growth trend (Figure 3). Based on the percentile method, the efficiency values are divided into three types: low efficiency (0–0.50), medium efficiency (0.6–1.01), and high efficiency (1.02–1.20) (Figure 4). In the period 2000–2021, the distribution range of high and medium efficiency significantly expanded, from a small-scale concentration in the western region to nationwide. The efficiency levels of 23 units improved; among them, 7 units, such as Tianjin, Qinghai, Liaoning, etc., upgraded from low efficiency to high efficiency, which was the most significant improvement in efficiency. In addition, the coefficient of variation (CV) decreased from 49.33 to 21.81, narrowing the interprovincial gap.
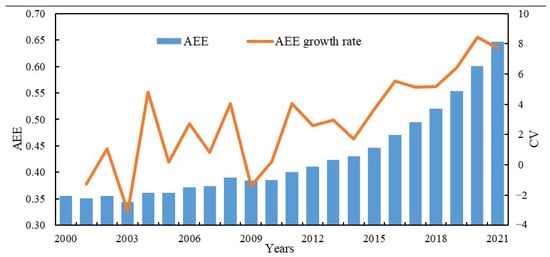
Figure 3.
The temporal changing trend of AEE from 2000 to 2021.
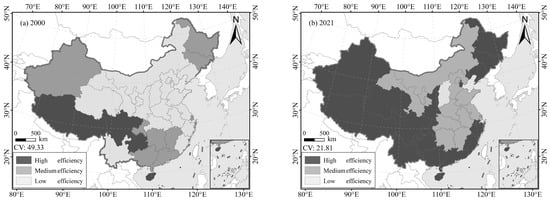
Figure 4.
The spatial and temporal divisions of AEE in 2000 (a) and 2021 (b).
3.2.2. Spatial Pattern Evolution of AEE
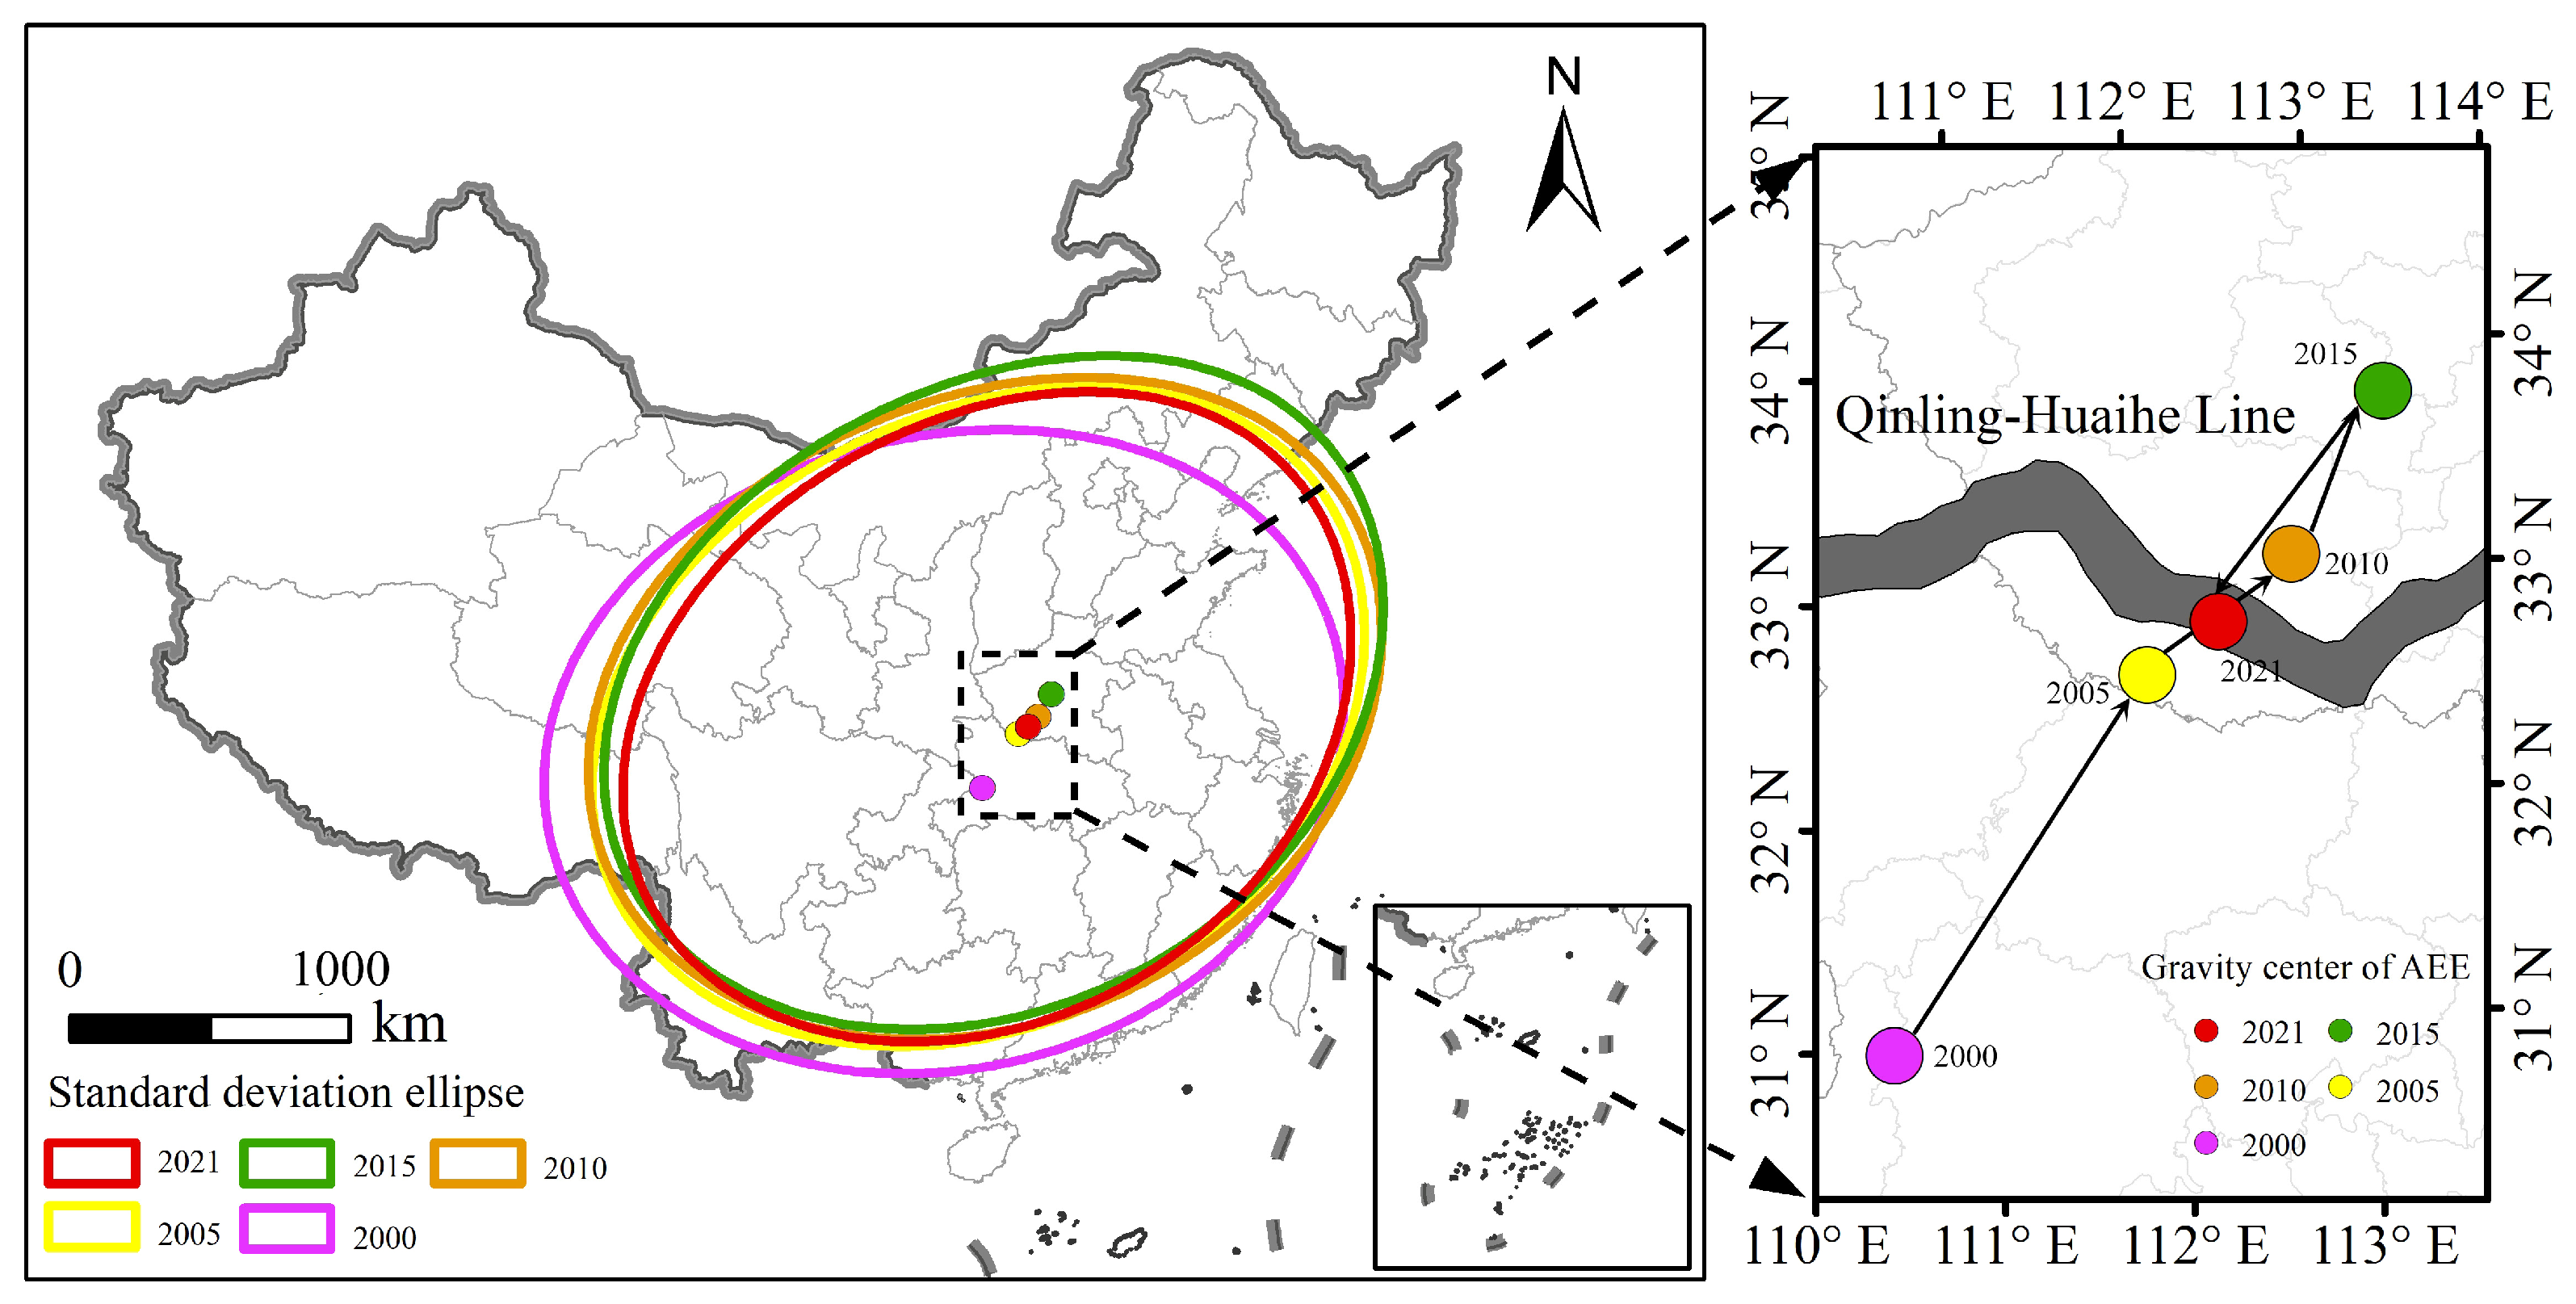
From 2000 to 2021, China’s AEE gravity center underwent a south-to-north transition. In 2015, the center of gravity shifted from the northeast to the southwest, indicating a trend of crossing from north to south. The spatial gravity center of China’s AEE has consistently been biased towards the southeast in relation to China’s geometric center (103°50′ E, 36° N), showing an overall shift towards the northeast, and the trajectory of this shift follows the directions of northeast (2000–2015) to southwest (2015–2021) (Figure 5).
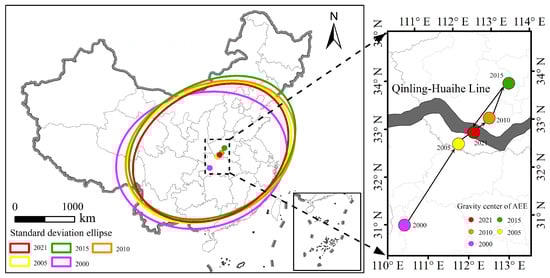
Figure 5.
The evolution of the gravity center and standard deviation ellipse of AEE from 2000 to 2021.
During the study period, the gravity center shifted eastward by 210.79 km and northward by 241.17 km, relocating from Yichang City, Hubei Province (32°24′10″ N, 110°27′27″ E), to Nanyang City, Henan Province (34°34′10″ N, 112°21′04″ E), based on the scope definition of the Qinhuai Line provided by Zhang et al. [44]. From 2000 to 2015, the gravity center moved in the northeast direction, crossing the Qinhuai Line known as the geographical boundary line between north and south China, which indicated a transition from the southern region to the northern region. However, from 2015 to 2021, the gravity center changed its course to the southwest and returned closer to the vicinity of the Qinhuai Line. Notably, the fastest rates of movement speed were observed between 2000 and 2005 in both the north–south and east–west directions (Table 4).
Table 4.
Variation of standard deviational ellipse parameters of AEE.
From 2000 to 2021, the spatial pattern of AEE in China exhibited stability with slight changes. The standard deviation ellipse of AEE shows an eastward-northern and westward-southern pattern, and its spatial distribution exhibits an “aggregation–dispersion–aggregation” change (Figure 5).
The spatial area of the standard deviation ellipse has decreased, its oblateness has increased, and its azimuth has decreased, indicating a distinct counterclockwise rotation (Table 4). These observations imply an enhanced level of AEE agglomeration and strengthened directional tendencies in spatial clustering. Furthermore, the northeastern and southwestern regions play a significant role in driving AEE development.
From 2000 to 2005, the northeast direction was the main driving force of the ellipse, resulting in a decrease in azimuth and a significant counterclockwise rotation. From 2005 to 2010, the efficiency values in many regions improved significantly, showing a scattered distribution in space. This led to an enlargement of the ellipse’s area and a decrease in its flatness, indicating a spatial pattern reshaping of China’s AEE. From 2010 to 2015, the growth rate of the ellipse’s area slowed down, accompanied by an increase in its flatness ratio, indicating a strengthened spatial agglomeration. With greater driving force in the northern and eastern regions compared to the southern and western regions, the rotation angle decreased. From 2015 to 2021, due to the increase in efficiency in the western and southern regions surpassing the northeast region, the area of the ellipse decreased significantly. This indicates the formation of a new spatial aggregation for the AEE, but the pattern still maintains an east-northeast to west-southwest pattern in general.
3.3. Driving Factors of AEE
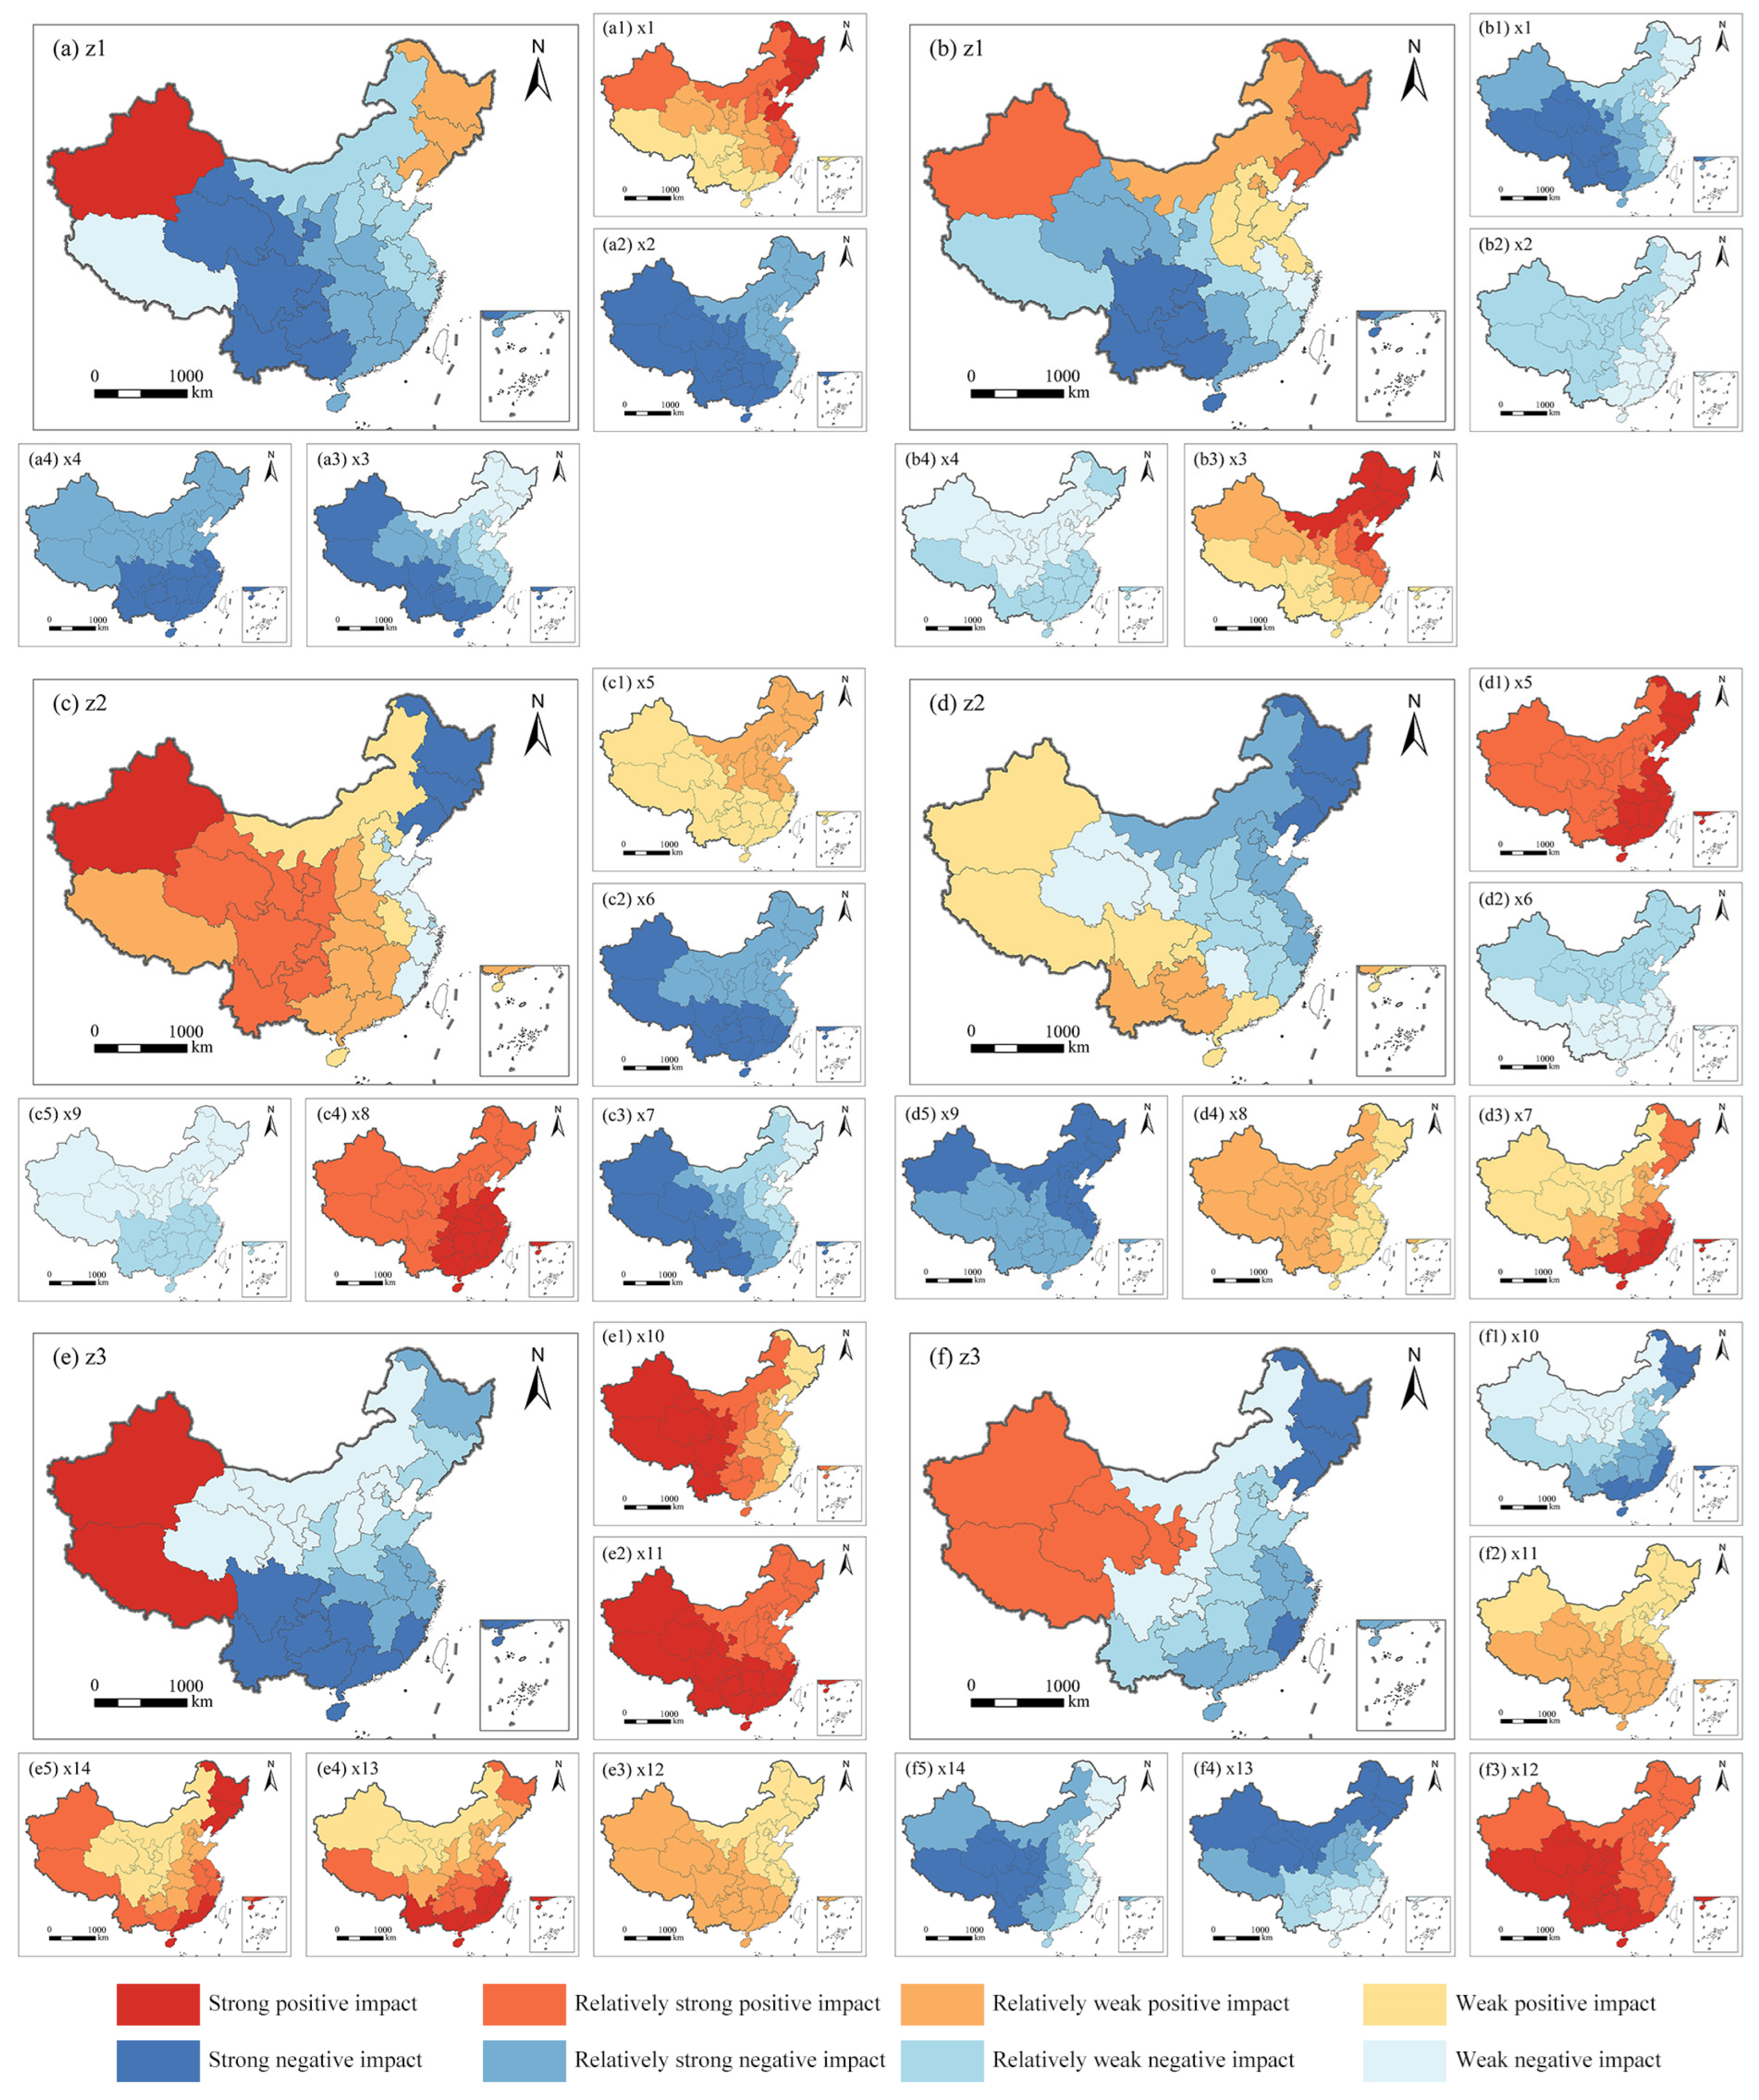
The GTWR model was used to measure the effects of 14 variables influencing factors on AEE (Table 2). Through an analysis of regression coefficients and their magnitudes, the factors controlling AEE from 2000 to 2021 were evaluated. The study identified eight drivers, including strong positive impact, relatively strong positive impact, relatively weak positive impact, weak positive impact, weak negative impact, relatively weak negative impact, relatively strong negative impact, and strong negative impact. To further clarify these findings, weights were assigned to the third-level indicators, resulting in the calculation of three indices: agricultural production conditions (Z1), physical environmental conditions (Z2), and socio-economic environmental conditions (Z3). Spatial differentiation is observed in the impact of each factor on AEE over time (Figure 6).
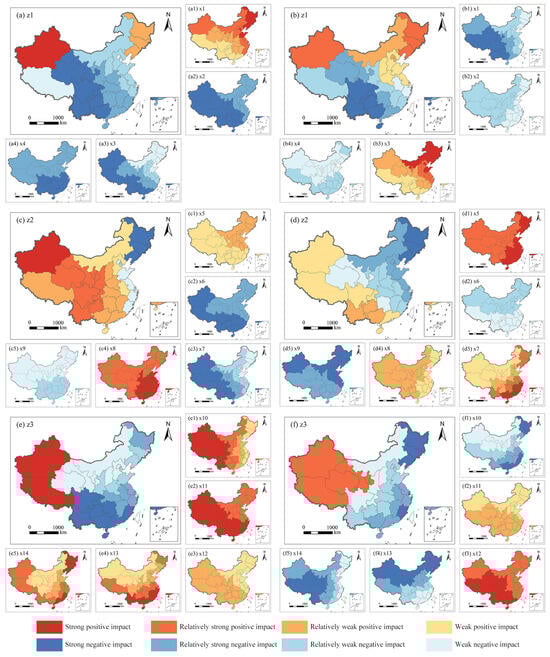
Figure 6.
Results distribution of influencing factors between 2000 and 2021. (a,a1,a2,a3,a4) are the influences of agricultural production conditions, farmers’ education level, rural aging rate, per capita cultivated land area, agricultural biodiversity index on AEE in 2000, (b,b1,b2,b3,b4) are the influences of agricultural production conditions, farmers’ education level, rural aging rate, per capita cultivated land area, agricultural biodiversity index on AEE in 2021, (c,c1,c2,c3,c4,c5) are the influences of physical environmental condition, topography, sunshine duration, temperature, water resources, disaster degree on AEE in 2000, (d,d1,d2,d3,d4,d5) are the influences of physical environmental condition, topography, sunshine duration, temperature, water resources, disaster degree on AEE in 2021, (e,e1,e2,e3,e4,e5) are the influences of socio-economic environ-mental conditions, regional economic level, contribution to agricultural output, urbanization level, financial support for agriculture, emphasis on regional eco-logical protection on AEE in 2000, and (f,f1,f2,f3,f4,f5) are the influences of socio-economic environ-mental conditions, regional economic level, contribution to agricultural output, urbanization level, financial support for agriculture, emphasis on regional eco-logical protection on AEE in 2021, respectively.
The impact of Z1 has been strengthened, and its positive influence has expanded, particularly in the northern region, where the changes are evident. The effect of x1 has shifted from positive promotion to negative inhibition; the negative impacts of x2 and x4 have weakened, with x2 having a relatively more pronounced negative effect on the eastern region compared to the western region in 2021; the impact of x3 has transformed from negative inhibition to positive promotion. Those indicate that, currently, the agricultural labor force and crop diversity fail to meet the requirements for economic and ecological benefits in agricultural production, and that strengthening agricultural production conditions enhances AEE, especially increasing land input elements.
The impact of Z2 is significantly weakened, with an expanded negative influence range that is particularly pronounced in the central and northern regions. The x5 enhances the positive effect, while x6 and x9 have negative impacts; x8 exhibits a positive effect, with a stronger influence in the western region compared to the eastern region, although the overall impact intensity weakens; the influence of x7 shifts from negative to positive. These findings indicate that the impact of the physical environment on AEE is diminishing and presenting constraints, in which the degree of disaster is the primary limiting factor, so that increasing water resource inputs will further promote AEE improvement.
The positive effect scope of Z3 has expanded and is mainly concentrated in the northwestern region. The impact of x10, x13, and x14 has changed from positive to negative, while the effect of x11 has weakened, with a stronger promoting effect in the southern region compared to the northern region; x12 has generated a positively strengthened influence, and its impact on the western region is stronger than that on the eastern region. These findings indicate an improvement in the promoting effect of human social activities on AEE, with urbanization level showing the most significant promotion effect. Moreover, increases in regional economic development and the emphasis on regional ecological environment have inhibited the promotion of AEE to different degrees.
3.4. Evaluation and Classification of the AEE Situation
According to the division method of AEE situation regional types, the study area is divided into three zones (Table 5). AEPZ, EPBZ, and APPZ accounted for 54.83%, 29.03%, and 16.13% of the study area, respectively. This indicates that AEE is harmonized with pollutant emissions from agricultural production in most areas of China, and agriculture can carry pollutant emissions from agricultural production better.
Table 5.
Regional types of AEE situation in China.
The dominant proportion of the AEPZ covers over half of the entire study area, with a continuous distribution in the southwest and southeast coastal regions. This zone demonstrates remarkable performance in terms of effective agriculture functioning, maintaining a relatively high level of both agricultural production and ecological conservation. The EPBZ exhibits spatial concentration in the northern and central-southern regions of China. This zone demonstrates a higher capacity for resource utilization and an equal level of pollution emissions, making it a promising area for enhancing efficiency and reducing pollution. The enhancement of AEE development in this area requires special attention. The APPZ is concentrated in the northern regions of China, representing the smallest proportion. These areas experience profitable agricultural production but also significant pollution. Therefore, the AEE falls below expected levels, resulting in an overloaded operation of agriculture and relatively low ecological benefits.
4. Discussion
4.1. Spatio-Temporal Evolutionary Characteristics of AEE
The AEE is a huge carbon sequestration system [27]. The study conducted by Huang et al. [45] shows that the contribution rate of cropland carbon sequestration will further increase in 2030 compared to the current stage, and by 2060, cropland will become one of the main contributors to terrestrial ecosystems carbon sequestration. Therefore, when calculating the ecological benefits of agriculture, the carbon sequestration capacity of agricultural production should be fully taken into account. In accordance with Hou et al.’s [4] study, this study only considers the economic benefits of agriculture when measuring expected output; the results indicate that the spatial evolution of China’s AEE shows a better improvement in the eastern region.
This study incorporates the role of agricultural carbon sequestration as an important desirable output indicator in the assessment of China’s AEE. The results reveal that China’s AEE has experienced a fluctuating growth trend from 2000 to 2021. Between 2000 and 2014, there was significant fluctuation in the growth rate with a slow increase, whereas from 2015 to 2021, the fluctuation was minimal and the growth rate significantly accelerated. This can be attributed to the decreased reliance on physical environmental conditions and the amplified impact of human activities, in particular advancements in agricultural production conditions, and socio-economic environmental shifts that collectively perturb the variation in AEE [46]. Furthermore, in 2015, the Ministry of Agriculture, the National Development and Reform Commission, and the Ministry of Science and Technology issued the National Plan for Sustainable Agricultural Development (2015–2030), which prioritizes “restoring agricultural ecology and enhancing ecological functions” as a key objective. This plan has enhanced agricultural economic, social, and ecological benefits by delineating agricultural regions and implementing revitalization projects, thus promoting sustainable agricultural development. In addition, the results reveal a spatial relocation of the AEE gravity center, transitioning from the “Northeast (2000–2015)” to the “Southwest (2015–2021)” during the period of 2000–2021, with more substantial improvements observed in the western regions. From 2000 to 2015, there was a significant northward trend in agricultural cultivation due to the overall increase in global temperatures [32]. As the socialist market economy system matured and developed, agriculture in developed areas of eastern China gradually moved towards modernized production. This was accompanied by advancements in agricultural technology, increased efficiency, and the movement of agricultural capital towards the east [47]. This led to a significant improvement in AEE in eastern and northern regions such as Heilongjiang, Jilin, Jiangsu, and Shandong, resulting in a shift of the AEE gravity center towards the north. Since 2015, agricultural supply side reforms have been implemented to promote a transformation in the agricultural development mode and resource efficiency, particularly in reducing human and material resource inputs. These reforms have steadily increased AEE and significantly boosted AEE growth in western and southern regions like Qinghai, Yunnan, and Fujian. As a result, the gravity center has shifted in the southwest direction. Additionally, Furthermore, the significant and growing carbon sequestration benefits observed in western regions such as Xinjiang, Guangxi, and Yunnan during agricultural production have played a crucial role in driving a more distinct improvement in the AEE evolutionary patterns.
4.2. Mechanisms and Policy Recommendations of AEE
Agriculture is a production service system with the dual benefits of agricultural economic gains and ecological gains from carbon sequestration and sinks. In the context of the carbon neutrality goal, agriculture needs to improve production efficiency and strengthen the capacity of carbon sequestration and sinks, while reducing emissions of greenhouse gases and NPSP in order to mitigate agriculture as a carbon source.
First of all, establishing the leading role of AEPZ. These zones exhibit high AEE and carbon sequestration benefits. The urban modern agricultural zones, focusing on ecological benefits, primarily include the four municipalities of Beijing, Shanghai, Tianjin, and Chongqing. Additionally, the eastern monsoon regions, characterized by high agricultural and ecological benefits, include Liaoning, Jilin, Shaanxi, Yunnan, Guizhou, Guangxi, and Guangdong. Furthermore, there are agricultural production regions such as Tibet, Qinghai, Ningxia, Zhejiang, Fujian, and Hainan, which are constrained by ecological environments. Agricultural production conditions have a positive role in promoting the region, with the agricultural output contribution level and urbanization level playing the most significant roles. Conversely, the education level of farmers, the degree of agricultural diversity, and the emphasis on regional ecological conservation have a major inhibiting effect. This indicates that the diminishing contribution of agricultural output value and the enhancement of urbanization levels have positively influenced AEE in the zone, despite challenges such as low educational attainment among farmers, increased ecological protection efforts, reduced agricultural diversity, and a gradual shift in planting structure. To further progress, the region must elevate the quality of its farming population, cultivate specialized agricultural technical talents, and diversify agricultural planting through specialized cultivation. This is particularly pertinent given the current constraints on agricultural development due to economic and societal pressures. By augmenting risk resilience and carbon sequestration capacity, the region can serve as a model for similar resource-environment settings to foster efficiency gains and drive regional improvements.
Secondly, enhancing the AEE in the EPBZ. This zone is the most promising area for improving efficiency and reducing pollution. The eastern parts of this zone, such as Hubei, Hunan, Anhui, Jiangxi, etc., have suitable topography and climate conditions. Due to the agroecological potential, this region has a high proportion of agricultural industry in regional economic development. Therefore, they are traditional rice planting areas in China and “Huguang is ripe all over the world” is their reputation. With the advancement of industrialization and urbanization, this region encounters challenges such as agricultural diversification and land degradation, so that the area of agricultural production has shrunk [40,48], which hampers the ecological development of agriculture. As a designated area for optimizing urban development and emphasizing agricultural development, this region has an urgent need to balance economic growth with agricultural ecological development and to further enhance agricultural ecological benefits.
Since 2015, there has been a westward shift in the center of AEE’s gravity. Western provinces such as Xinjiang, Gansu, and Sichuan have emerged as regions with robust agricultural development momentum. They have increasingly demonstrated their advantages in the cultivation of grains, fruits, vegetables, and cotton. These areas have a high demand for advanced agricultural production technologies, yet they are constrained by factors related to the agricultural workforce. Consequently, the educational attainment of farmers and the aging rural population exert a significant inhibitory effect on AEE. Due to the vulnerability of the regional ecological environment, the region needs to optimize soil–crop relationships, and it is recommended to prioritize ecological conservation as the leading function of agriculture. This ought to promote a moderately developed modern agricultural system with distinct characteristics, taking into account the carrying capacity of resources and the environment. In addition, strengthened investment and support for agriculture, enhanced recruitment of high-quality technicians, improved agricultural production technologies, and the addressing of labor shortages are needed. Therefore, the region will strive to further enhance AEE and carbon sequestration, accomplishing the transformation of agricultural production towards industrialization, organizational development, and ecological sustainability.
Thirdly, reducing the agricultural carbon emissions in APPZ. The AEE in this zone falls below the undesirable output level, leading to high agricultural production but also significant pollution. This zone is a vital agricultural area in China, characterized by well-coupled solar, thermal, water, and topographical conditions. It is distinguished by high-input factors along with both desirable and undesirable high-value outputs. The inefficient use of natural resources and frequent agricultural disasters severely hinder AEE. To tackle these challenges, the adoption of precision agriculture is beneficial; it can minimize costs and transform the agricultural production method from traditional ‘experience-based agriculture’ to data-driven ‘prescriptive agriculture’. Leveraging big data for real-time crop monitoring and optimizing growth conditions can enhance agricultural profitability and lessen the impacts of environmental disasters. Moreover, incorporating green technologies and clean practices is crucial to reducing the carbon footprint of agriculture. Strengthening the agricultural disaster insurance system is also essential to improve the level of risk protection [49].
In addition, as agricultural production technology advances, the impact of agricultural conditions and socio-economic factors on AEE has intensified, conversely diminishing the influence of the physical environment. However, global climate change has led to a significant increase in the frequency and intensity of extreme weather events, which often lead to agro-meteorological disasters, bringing great losses to agricultural production [50]. To cope with extreme climate impacts, on the one hand, it is necessary to adjust the layout of agricultural production to suitable crops; on the other hand, for sudden disasters such as floods, it is necessary to implement agricultural insurance to reduce farmers’ production losses [51]. In addition, promoting the transformation of agricultural production modes is one of the ways to cope with extreme weather, improve the level of agricultural science and technology, and develop modern agriculture, such as facility agriculture and fine agriculture, to further reduce the dependence of agricultural production on the physical environment.
4.3. Limitations
This study examines the economic income and ecological benefits generated by crop growth with natural and human and material factor inputs, taking into account undesired outputs and measuring AEE in the narrow sense, which is the plantation industry. Since this study takes a macro perspective, it uses statistical data to measure the value of AEE. Therefore, only the crop growth process was considered in measuring the carbon sequestration and carbon emissions of agriculture in this study, and the evolution of efficiency in the whole life cycle of agricultural products’ production, marketing, and final consumption was not explored. Moreover, there was no division of agricultural product types to explore the impact of different crop types and their consumption patterns on the dynamic balance between carbon emissions and carbon sequestrations. These are the limitations of this study, but also the directions of agroecological efficiency research that can be carried out in the future. In the future, we can explore the input and output of a single agricultural product or all agricultural products in a certain place from production to consumption through the perspective of the whole life cycle, so as to comprehensively and deeply explore the AEE. In addition, observing that the impacts of climate extremes on agricultural production are multifaceted, and as climate change leads to an increase in these extremes, it is of great significance to explore the effects on AEE and agricultural sustainable development. It would be a direction for further deepening this research.
5. Conclusions
The window analysis of the super-SBM-undesirable model is used to calculate the AEE in China from 2000 to 2021. The standard deviation ellipses are utilized to examine the spatiotemporal evolution pattern. Furthermore, the GTWR is applied to measure the influence factors of AEE under the internal and external mechanisms. Based on these analyses, with a dual dimension of AEE and undesirable output, the types of AEE situation in China are classified, and their development mechanisms are investigated. Finally, optimization suggestions are proposed.
Due to growing influence of human activities, including agricultural production conditions and socio-economic factors, along with macro-policy emphasis on agricultural ecological benefits, AEE has shown an increasing trend, with a rising fluctuation rate from 2000 to 2021. The range of the medium-to-high efficiency interval expanded, and the inter-provincial disparity decreased. The AEE gravity center exhibited a “Northeast–Southwest” movement. It crossed the Qinhuai Line from 2000 to 2015 and then returned to its vicinity after 2015, ultimately located within Nanyang City, Henan Province by 2021. The spatial pattern remained stable with variations, with an increased concentration level of AEE spatial distribution. The spatial distribution demonstrated a pattern of “agglomeration–dispersion–agglomeration” changes, maintaining a stable development with a northeast–southwest pattern. Under the joint influence of internal and external mechanisms, the effects of agricultural production conditions and regional socio-economic conditions on China’s AEE have increased in strength and positive promotion range. The positive influence exerted by physical environmental conditions has decreased, while the inhibitory effect has increased. Among these factors, increasing input factors such as agricultural land and water resources, improving the level of regional urbanization, enhancing agricultural disaster resistance, and balancing the relationship between regional economic development and agricultural production are important ways to enhance China’s AEE.
Based on the evaluation of the AEE situation from the aspects of AEE and undesirable output, the research identified three categories: AEPZ, EPBZ, and APPZ. In future development, the AEPZ will play a necessary and exemplary role in carbon sequestration and efficiency improvement and drive the surrounding areas with similar resource and environmental conditions to improve efficiency. The EPBZ needs to strike a balance between economic development and ecological sustainability by promoting the transformation and upgrading of agricultural production towards industrialization, organization, and ecological orientation, thus further enhancing agricultural ecological benefits. The APPZ should emphasize the introduction of green technologies and clean modes to reduce agricultural carbon emissions. In addition, it is vital to strengthen measures for preventing and mitigating agricultural disasters, as well as to ensure the security of regional agriculture.
It is important to note that this study adopted a macro perspective and used statistical data to calculate AEE values. However, it does not delve into various links of agricultural production or analyze the input–output relationship of ecological factors for specific agricultural products throughout the entire process, including production and sales. Therefore, the calculation of efficiency values lacks precision. This aspect will be a focus for further research.
Author Contributions
X.W.: Methodology, Software, Data curation, Writing—original draft; Y.L.: Conceptualization, Funding acquisition; Writing—review and editing; X.W.: Investigation, Validation; Y.L.: Proofreading. All authors have read and agreed to the published version of the manuscript.
Funding
This research was supported by the National Natural Science Foundation of China (Grant No. 42201289) and the China Postdoctoral Science Foundation (Grant No. 2021M700143).
Data Availability Statement
The data presented in this research are available on request from the corresponding author.
Acknowledgments
We greatly appreciate the editors and anonymous reviewers for their valuable time, constructive suggestions, and insightful comments.
Conflicts of Interest
The authors declare no conflicts of interest.
References
- Lenton, T.M.; Xu, C.; Abrams, J.F.; Ghadiali, A.; Loriani, S.; Sakschewski, B.; Zimm, C.; Ebi, K.L.; Dunn, R.R.; Svenning, J.-C.; et al. Quantifying the Human Cost of Global Warming. Nat. Sustain. 2023, 6, 1237–1247. [Google Scholar] [CrossRef]
- Schaltegger, S.; Sturm, A. Ökologische rationalität: Ansatzpunkte zur ausgestaltung von ökologieorientierten management instrumenten. Die Unternehm. 1990, 44, 273–290. [Google Scholar]
- Flichmann, G. International Comparisons of Efficiency in Agricultural Production; OECD Publishing: Paris, France, 1990. [Google Scholar] [CrossRef]
- Hou, M.Y.; Yao, S.B. Spatial-temporal evolution and trend prediction of agricultural eco-efficiency in China: 1978–2016. Acta Geogr. Sin. 2018, 73, 2168–2183. [Google Scholar]
- Ke, N.; Lu, X.H.; Kuang, B.; Han, J. Regional differences and influencing factors of green and low-carbon utilization of cultivated land under the carbon neutrality target in China. China Land Sci. 2021, 35, 67–76. [Google Scholar]
- Moutinho, V.; Madaleno, M.; Macedo, P.; Robaina, M.; Marques, C. Efficiency in the European agricultural sector: Environment and resources. Environ. Sci. Pollut. Res. 2018, 25, 17927–17941. [Google Scholar] [CrossRef] [PubMed]
- Grovermann, C.; Wossen, T.; Muller, A.; Nichterlein, K. Eco-Efficiency and Agricultural Innovation Systems in Developing Countries: Evidence from Macro-Level Analysis. PLoS ONE 2019, 14, e0214115. [Google Scholar] [CrossRef] [PubMed]
- Liu, Y.; Zou, L.; Wang, Y. Spatial-Temporal Characteristics and Influencing Factors of Agricultural Eco-Efficiency in China in Recent 40 Years. Land Use Policy 2020, 97, 104794. [Google Scholar] [CrossRef]
- Liu, M.B.; Zhang, A.L.; Wen, G.H. Regional differences and spatial convergence in the ecological efficiency of cultivated land use in the main grain producing Areas in the Yangtze Region. J. Nat. Resour. 2022, 37, 477–493. [Google Scholar] [CrossRef]
- Zhang, H.; Liao, X.P.; Li, C.H.; Yang, C.; Yang, S.S.; Li, Y.H. Spatio-temporal characteristics of agricultural eco-efficiency and its determinants in Hunan Province. Econ. Geogr. 2022, 42, 181–189. [Google Scholar]
- Schulte, H.D.; Armbrecht, L.; Bürger, R.; Gauly, M.; Musshoff, O.; Hüttel, S. Let the Cows Graze: An Empirical Investigation on the Trade-off between Efficiency and Farm Animal Welfare in Milk Production. Land Use Policy 2018, 79, 375–385. [Google Scholar] [CrossRef]
- Mouron, P.; Scholz, R.W.; Nemecek, T.; Weber, O. Life Cycle Management on Swiss Fruit Farms: Relating Environmental and Income Indicators for Apple-Growing. Ecol. Econ. 2006, 58, 561–578. [Google Scholar] [CrossRef]
- Wissmann, M.A.; Hein, A.F.; Neuls, H. Waste generation: An analysis of eco-efficiency in production lines in a dairy industry and its influence on environmental costs. Cust. Agron. 2013, 9, 83–103. [Google Scholar]
- Gaudino, S.; Goia, I.; Grignani, C.; Monaco, S.; Sacco, D. Assessing Agro-Environmental Performance of Dairy Farms in Northwest Italy Based on Aggregated Results from Indicators. J. Environ. Manag. 2014, 140, 120–134. [Google Scholar] [CrossRef]
- Domagała, J. Economic and Environmental Aspects of Agriculture in the EU Countries. Energies 2021, 14, 7826. [Google Scholar] [CrossRef]
- Soteriades, A.D.; Faverdin, P.; Moreau, S.; Charroin, T.; Blanchard, M.; Stott, A.W. An Approach to Holistically Assess (Dairy) Farm Eco-Efficiency by Combining Life Cycle Analysis with Data Envelopment Analysis Models and Methodologies. Animal 2016, 10, 1899–1910. [Google Scholar] [CrossRef] [PubMed]
- Beltrán-Esteve, M.; Reig-Martínez, E.; Estruch-Guitart, V. Assessing Eco-Efficiency: A Metafrontier Directional Distance Function Approach Using Life Cycle Analysis. Environ. Impact Assess. Rev. 2017, 63, 116–127. [Google Scholar] [CrossRef]
- Gémar, G.; Gómez, T.; Molinos-Senante, M.; Caballero, R.; Sala-Garrido, R. Assessing Changes in Eco-Productivity of Wastewater Treatment Plants: The Role of Costs, Pollutant Removal Efficiency, and Greenhouse Gas Emissions. Environ. Impact Assess. Rev. 2018, 69, 24–31. [Google Scholar] [CrossRef]
- Vázquez-Rowe, I.; Villanueva-Rey, P.; Iribarren, D.; Teresa Moreira, M.; Feijoo, G. Joint Life Cycle Assessment and Data Envelopment Analysis of Grape Production for Vinification in the Rías Baixas Appellation (NW Spain). J. Clean. Prod. 2012, 27, 92–102. [Google Scholar] [CrossRef]
- Zou, L.L.; Liu, Y.S.; Wang, Y.S. Shadow prices and pollution costs of agricultural pollutants in China from 1978 to 2017. Trans. Chin. Soc. Agric. Eng. 2020, 36, 223–230. [Google Scholar]
- IPCC. 2006 IPCC Guidelines for National Greenhouse Gas Inventories; Institute for Global Environmental Strategies: Hayama, Japan, 2006. [Google Scholar]
- Crippa, M.; Solazzo, E.; Guizzardi, D.; Monforti-Ferrario, F.; Tubiello, F.N.; Leip, A. Food Systems Are Responsible for a Third of Global Anthropogenic GHG Emissions. Nat. Food 2021, 2, 198–209. [Google Scholar] [CrossRef] [PubMed]
- Zhi, J.; Gao, J.J. Analysis of carbon emission caused by food consumption in urban and rural inhabitants in China. Prog. Geog. 2009, 28, 429–434. [Google Scholar]
- Min, J.S.; Hu, H. Measurement of greenhouse gas emissions from agricultural production in China. China Popul. Resour. Environ. 2012, 22, 21–27. [Google Scholar]
- Qi, Y.C.; Dong, Y.S. Nitrous oxide emissions from soil and some influence factors. Acta Geogr. Sin. 1999, 6, 534–542. [Google Scholar]
- Dong, H.M.; Li, Y.E.; Tao, X.P.; Peng, X.P.; Li, N.; Zhu, Z.P. China’s agricultural greenhouse gas emissions and emission reduction technology countermeasures. Trans. Chin. Soc. Agric. Eng. 2008, 24, 269–273. [Google Scholar]
- Terrer, C.; Phillips, R.P.; Hungate, B.A.; Rosende, J.; Pett-Ridge, J.; Craig, M.E.; van Groenigen, K.J.; Keenan, T.F.; Sulman, B.N.; Stocker, B.D.; et al. A Trade-off between Plant and Soil Carbon Storage under Elevated CO2. Nature 2021, 591, 599–603. [Google Scholar] [CrossRef] [PubMed]
- Jin, S.Q.; Lin, Y.; Niu, K.Y. Driving green transformation of agriculture with low carbon: Characteristics of agricultural carbon emissions and its emission reduction path in China. Reform 2021, 5, 29–37. [Google Scholar]
- Liu, Y.F. A study on carbon cycle in the agroecological system of China. J. Nat. Resour. 1995, 10, 1–8. [Google Scholar]
- Xie, S.J.; Kuang, Y.Q.; Huang, N.S. Main paths and policy proposals for the development of carbon-sinking agriculture in China. China Popul. Resour. Environ. 2010, 20, 46–51. [Google Scholar]
- Tian, Y.; Zhang, J.B. Regional differentiation research on net carbon effect of agricultural production in China. J. Nat. Resour. 2013, 28, 1298–1309. [Google Scholar]
- Liu, Y.S.; Zhai, R.X. Spatial-temporal pattern changes and optimal strategy of grain production in China since 1990s. Areal Res. Dev. 2009, 28, 1–5, 16. [Google Scholar]
- Liu, Y.S.; Wu, C.J. Theories and progress of study on sustainable agriculture development. Econ. Geogr. 2000, 20, 63–68. [Google Scholar]
- Tone, K. A Slacks-Based Measure of Efficiency in Data Envelopment Analysis. Eur. J. Oper. Res. 2001, 130, 498–509. [Google Scholar] [CrossRef]
- Tone, K. A Slacks-Based Measure of Super-Efficiency in Data Envelopment Analysis. Eur. J. Oper. Res. 2002, 143, 32–41. [Google Scholar] [CrossRef]
- Sheng, K.R.; Li, X.R.; Sun, W.; Wang, C.Y. Examining the impacts of network position on urban carbon emissions efficiency in China. Acta Geogr. Sin. 2023, 78, 2864–2882. [Google Scholar]
- Tian, Y.; Zhang, J.B.; Wu, X.R.; Cheng, L.L. Research on dynamic change and regional differences of China’s planting industry carbon sequestration surplus. J. Nat. Resour. 2015, 30, 1885–1895. [Google Scholar]
- Wang, B.Y.; Zhang, W.G. A research of agricultural eco- efficiency measure in China and space- time differences. China Population Resour. Environ. 2016, 26, 11–19. [Google Scholar]
- Rey, S.J. Spatial empirics for economic growth and convergence. Geogr. Anal. 2001, 33, 195–214. [Google Scholar] [CrossRef]
- Huang, B.; Wu, B.; Barry, M. Geographically and temporally weighted regression for modeling spatio-temporal variation in house prices. Int. J. Geogr. Inf. Sci. 2010, 24, 383–401. [Google Scholar] [CrossRef]
- Liu, Y.S.; Zhang, Z.W.; Wang, J.Y. Regional differentiation and comprehensive regionalization scheme of modern agriculture in China. Acta Geogr. Sin. 2018, 73, 203–218. [Google Scholar]
- Yu, G.R.; Wang, Y.S.; Yang, M.M. Discussion on the ecological theory and assessment methods of ecosystem quality and its evolution. Chin. J. Appl. Ecol. 2022, 33, 865–877. [Google Scholar]
- Feng, Z.; Zhang, D.; Yang, Y.Z. Relief degree of land surface in China at county level based on GIS and its correlation between population density and economic development. J. Jilin Univ. Soc. Sci. 2011, 51, 146–151,160. [Google Scholar]
- Zhang, J.; Liu, X.N.; Tan, Z.H.; Chen, Q.G. Mapping of the north-south demarcation zone in China based on GIS. J. Lanzhou Univ. Nat. Sci. 2012, 48, 28–33. [Google Scholar]
- Huang, X.J.; Zhang, X.Y.; Lu, X.H.; Wang, P.Y.; Qin, J.Y.; Jiang, J.C.; Liu, Z.M.; Wang, Z.; Zhu, A.X. Land development and utilization for carbon neutralization. J. Nat. Resour. 2021, 36, 2995–3006. [Google Scholar] [CrossRef]
- Hou, M.Y.; Yao, S.B. Convergence and differentiation characteristics on agro-ecological efficiency in China from a spatial perspective. China Popul. Resour. Environ. 2019, 29, 116–126. [Google Scholar]
- Hu, C.P.; Li, H.S. Research on the space-time trajectory and its coupling trend of the gravity center of China’s agricultural economy and its endowment structure in 1978–2015. J. Huazhong Agric. Univ. Soc. Sci. 2019, 2, 91–99+167. [Google Scholar]
- Zhang, Q.; Zhang, G.L.; Zhu, D.L.; Di, Y.Y.; Yang, T.; Liu, R.Q.; Dong, J.W. Spatiotemporal patterns of paddy rice production change in China during 1980–2018. Resour. Sci. 2022, 44, 687–700. [Google Scholar] [CrossRef]
- Wang, Y.S.; Liu, Y.S. Pollution and restructuring strategies of rural ecological environment in China. Prog. Geog. 2018, 37, 710–717. [Google Scholar]
- Zhang, Z.; Wang, P.; Chen, Y.; Song, X.; Wei, X.; Shi, P. Global warming over 1960–2009 did increase heat stress and reduce cold stress in the major rice-planting areas across China. Eur. J. Agron. 2014, 59, 49–56. [Google Scholar] [CrossRef]
- Ribeiro, P.F.; Santos, J.L. Exploring the effects of climate change on farming system choice: A farm-level space-for-time approach. Land 2023, 12, 2113. [Google Scholar] [CrossRef]
Disclaimer/Publisher’s Note: The statements, opinions and data contained in all publications are solely those of the individual author(s) and contributor(s) and not of MDPI and/or the editor(s). MDPI and/or the editor(s) disclaim responsibility for any injury to people or property resulting from any ideas, methods, instructions or products referred to in the content. |
© 2024 by the authors. Licensee MDPI, Basel, Switzerland. This article is an open access article distributed under the terms and conditions of the Creative Commons Attribution (CC BY) license (https://creativecommons.org/licenses/by/4.0/).