

Earlier Flowering Phenology and Pollinator Visitation on Urban Green Roofs Compared to Ground-Level Gardens

Abstract
1. Introduction
1.1. Green Roofs as Ecosystems
1.2. Phenology and Green Roofs
1.3. Substrate Temperature
1.4. Plant Pollinator Interactions
1.5. Study Aims
2. Materials and Methods
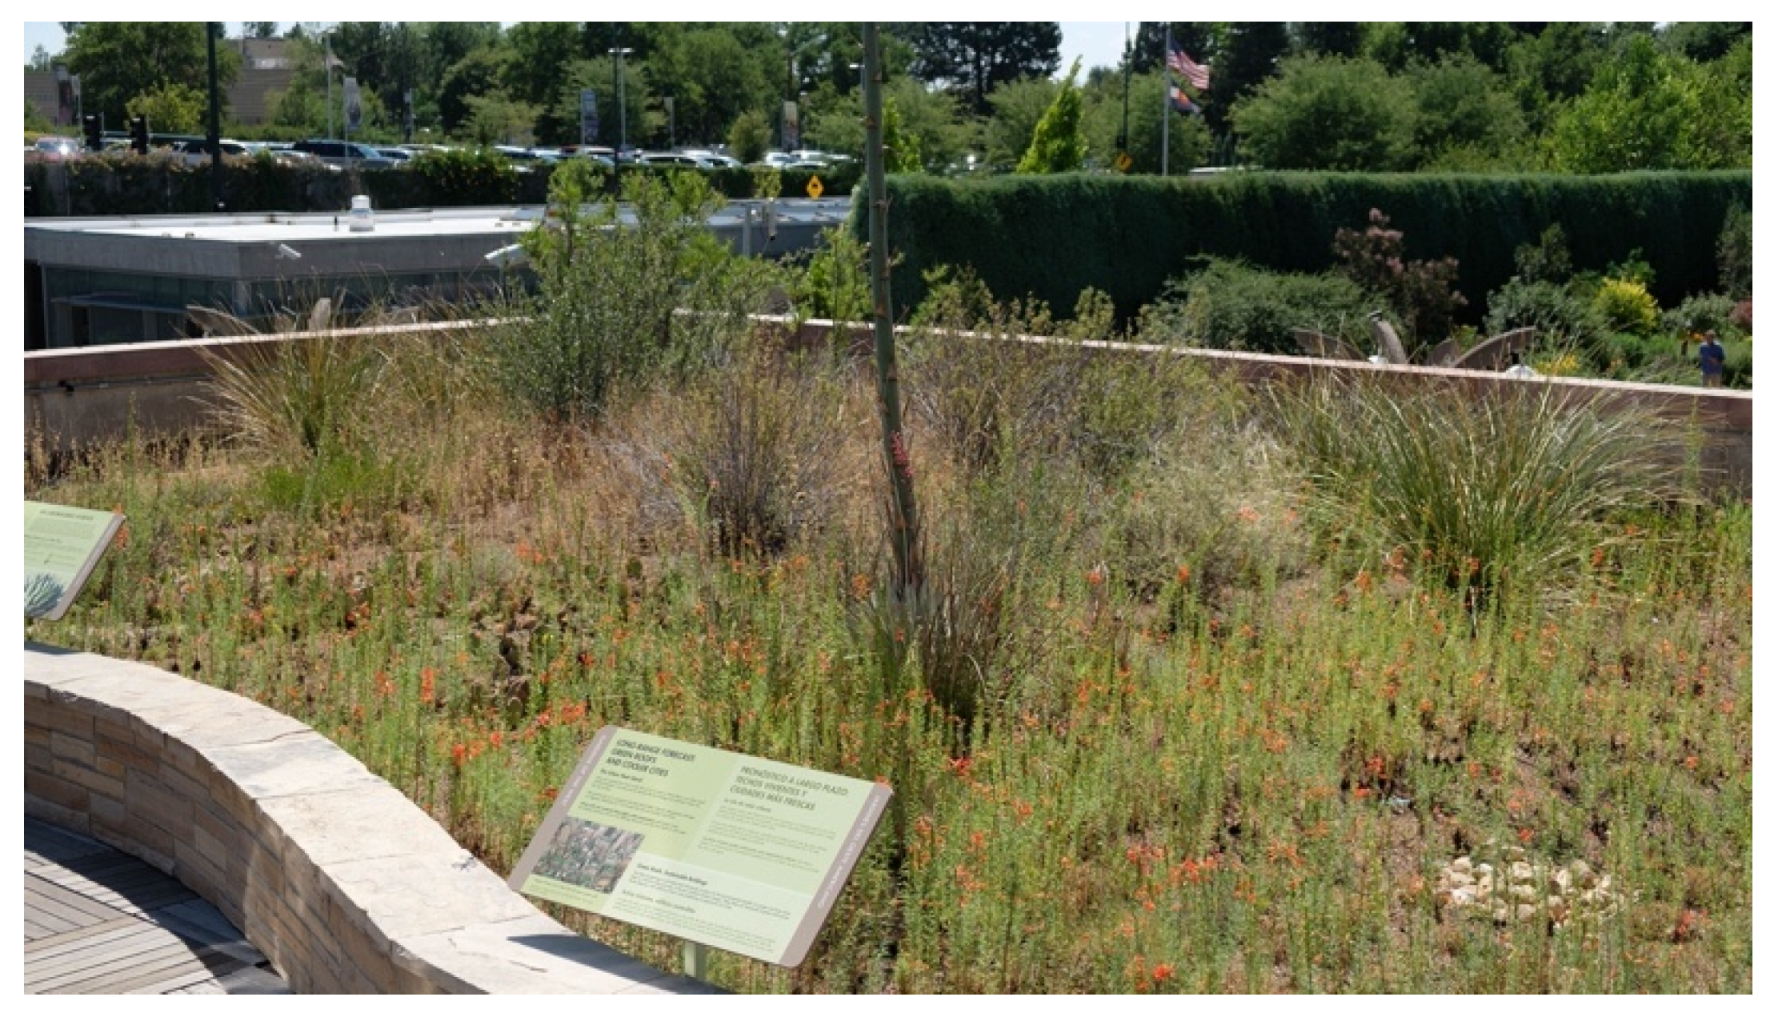
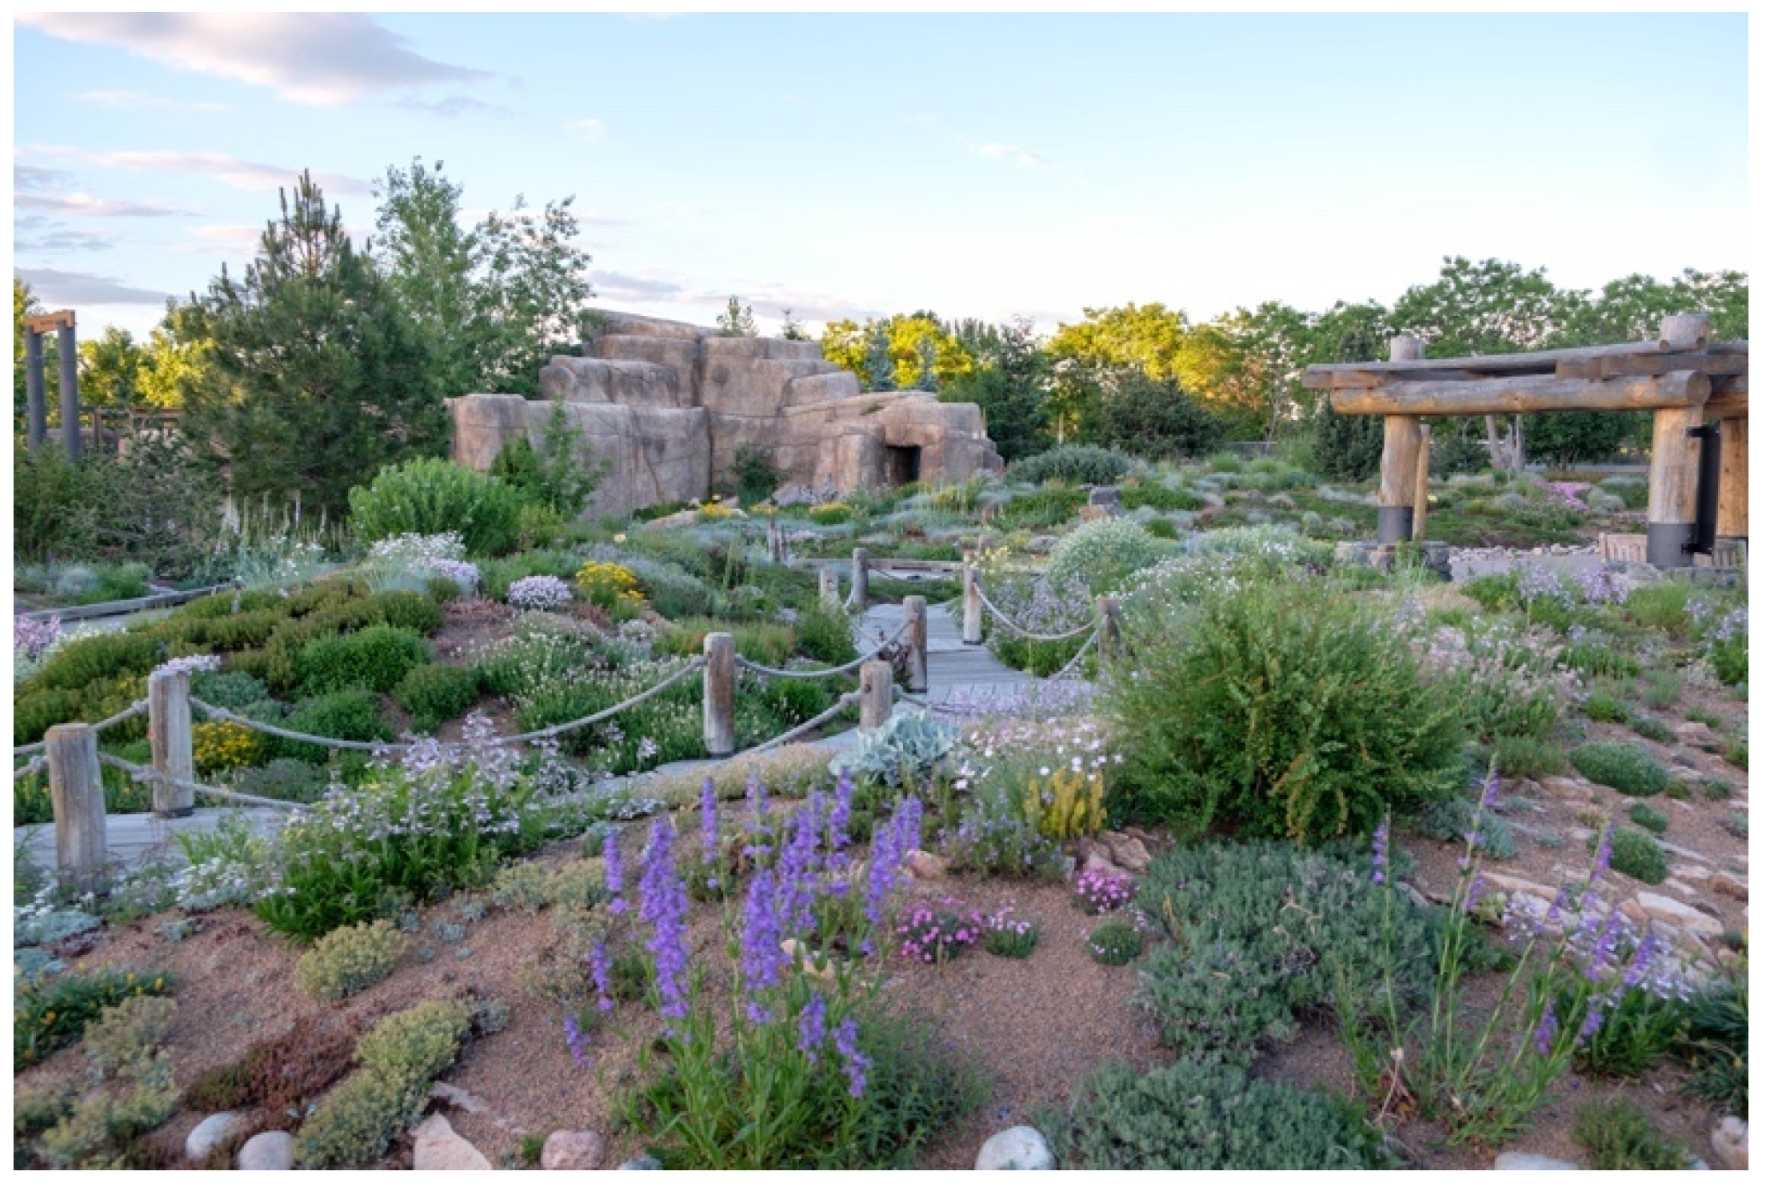
2.1. Study Site
2.2. Local Climate Conditions
2.3. Plant Selection and Inclusion Criteria
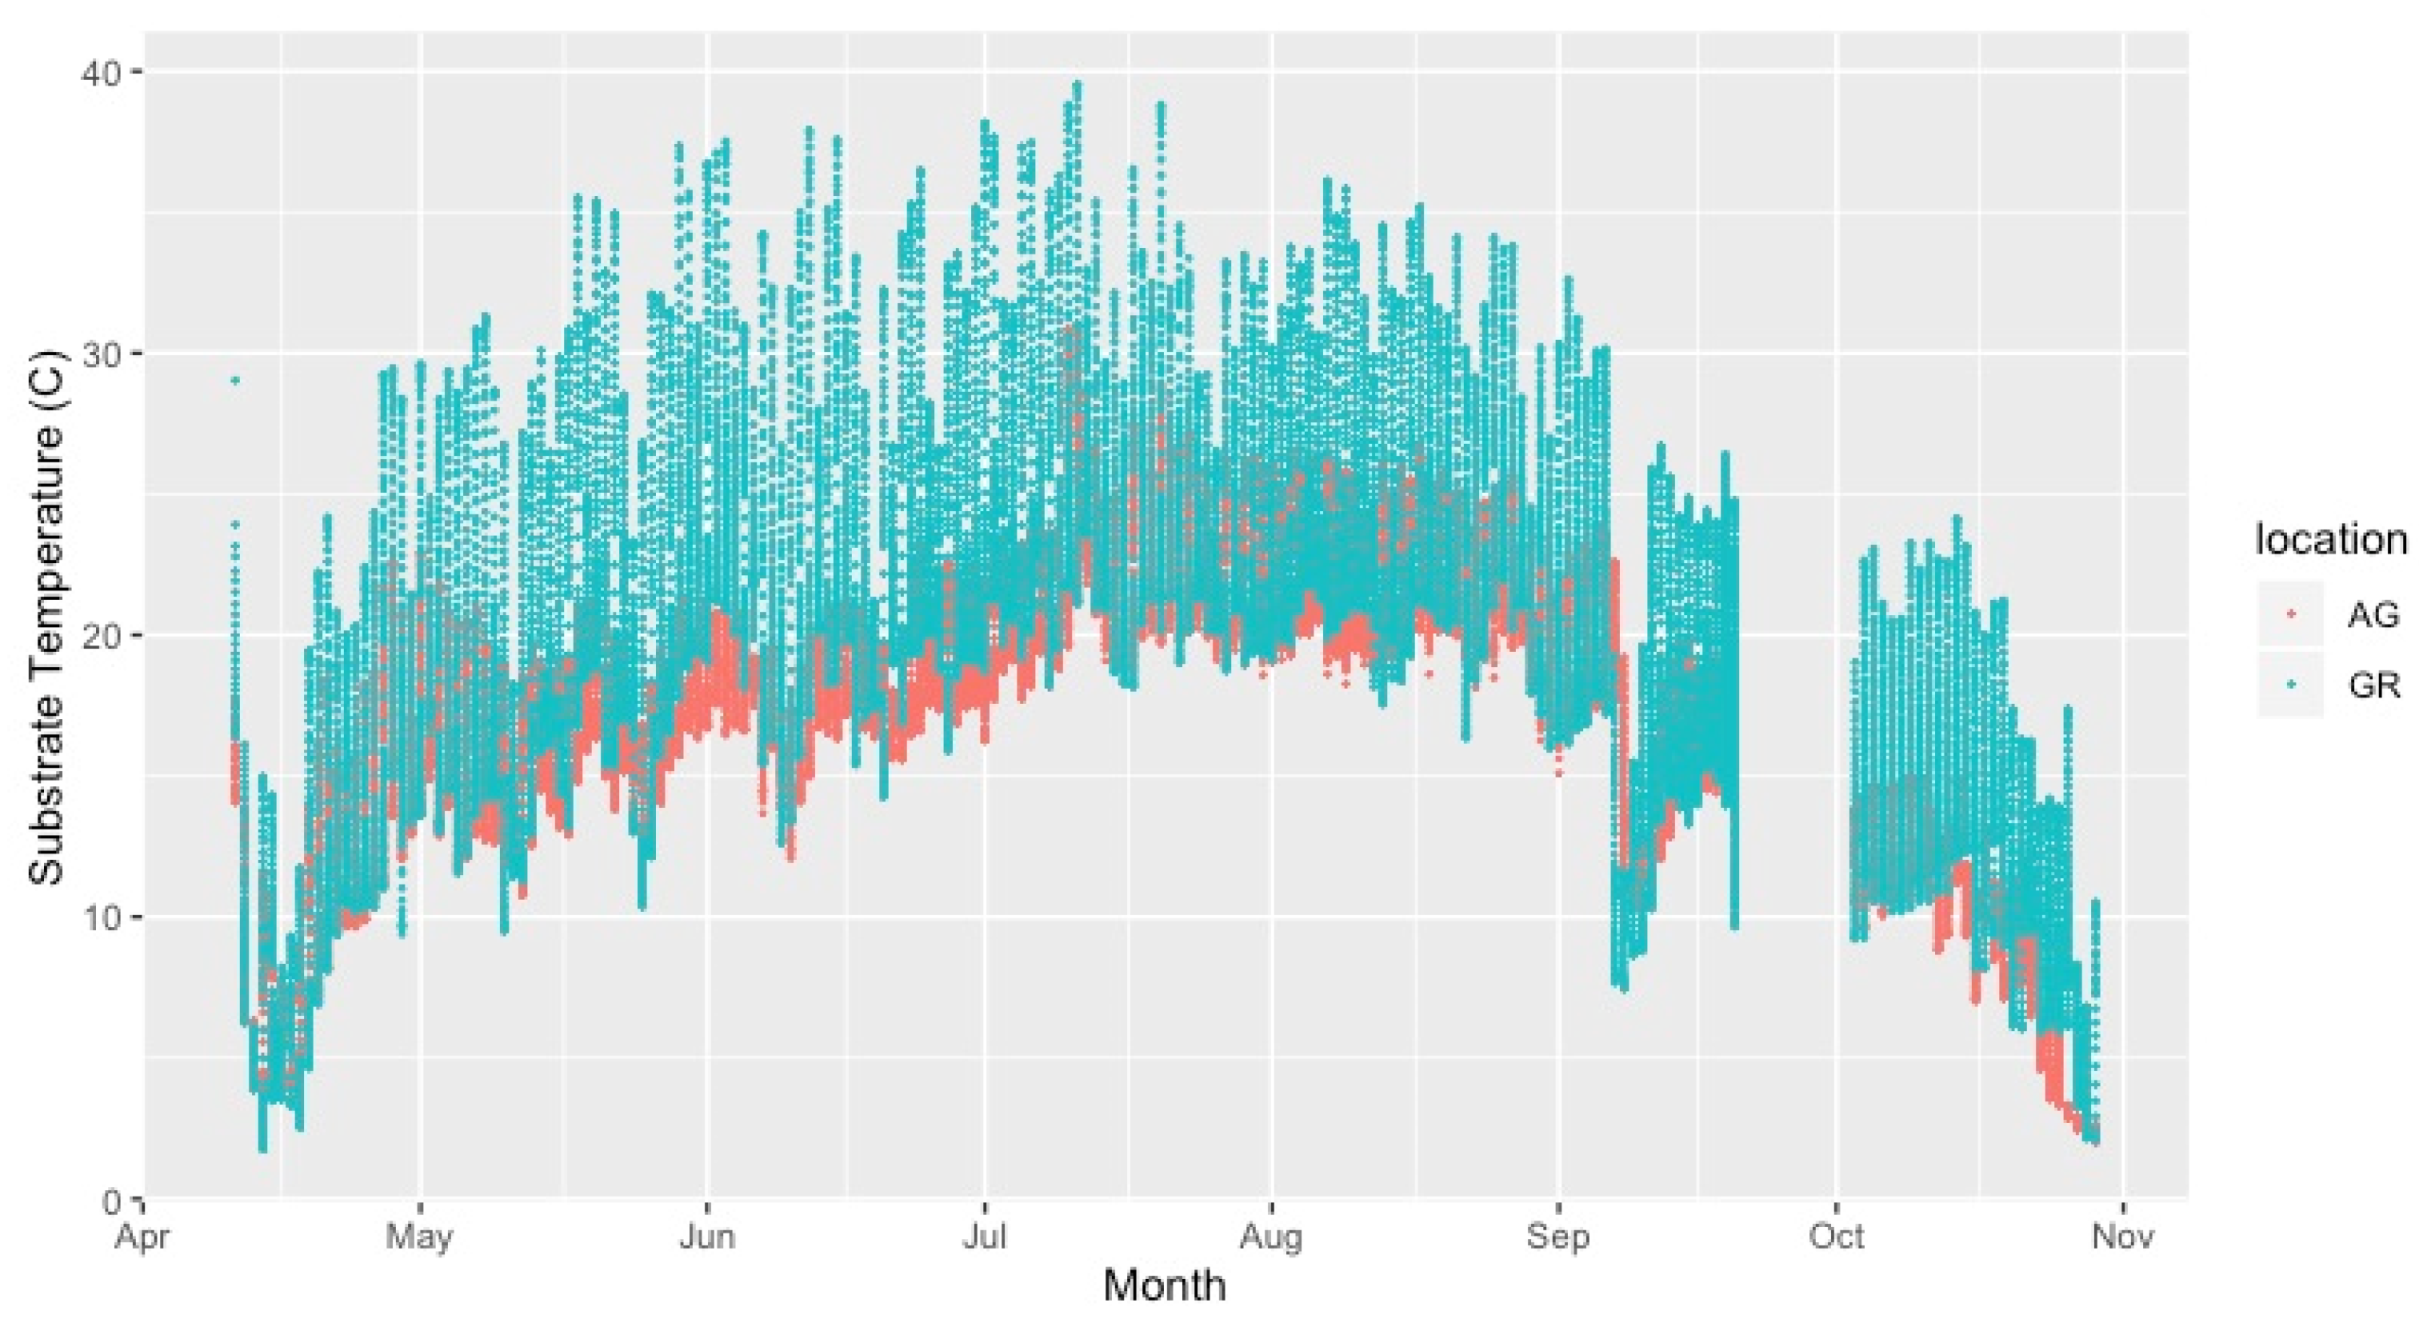
2.4. Substrate Temperature and Abiotic Conditions
2.5. Phenology Observations
2.6. In Situ Pollinator Observations
2.7. Data Analysis
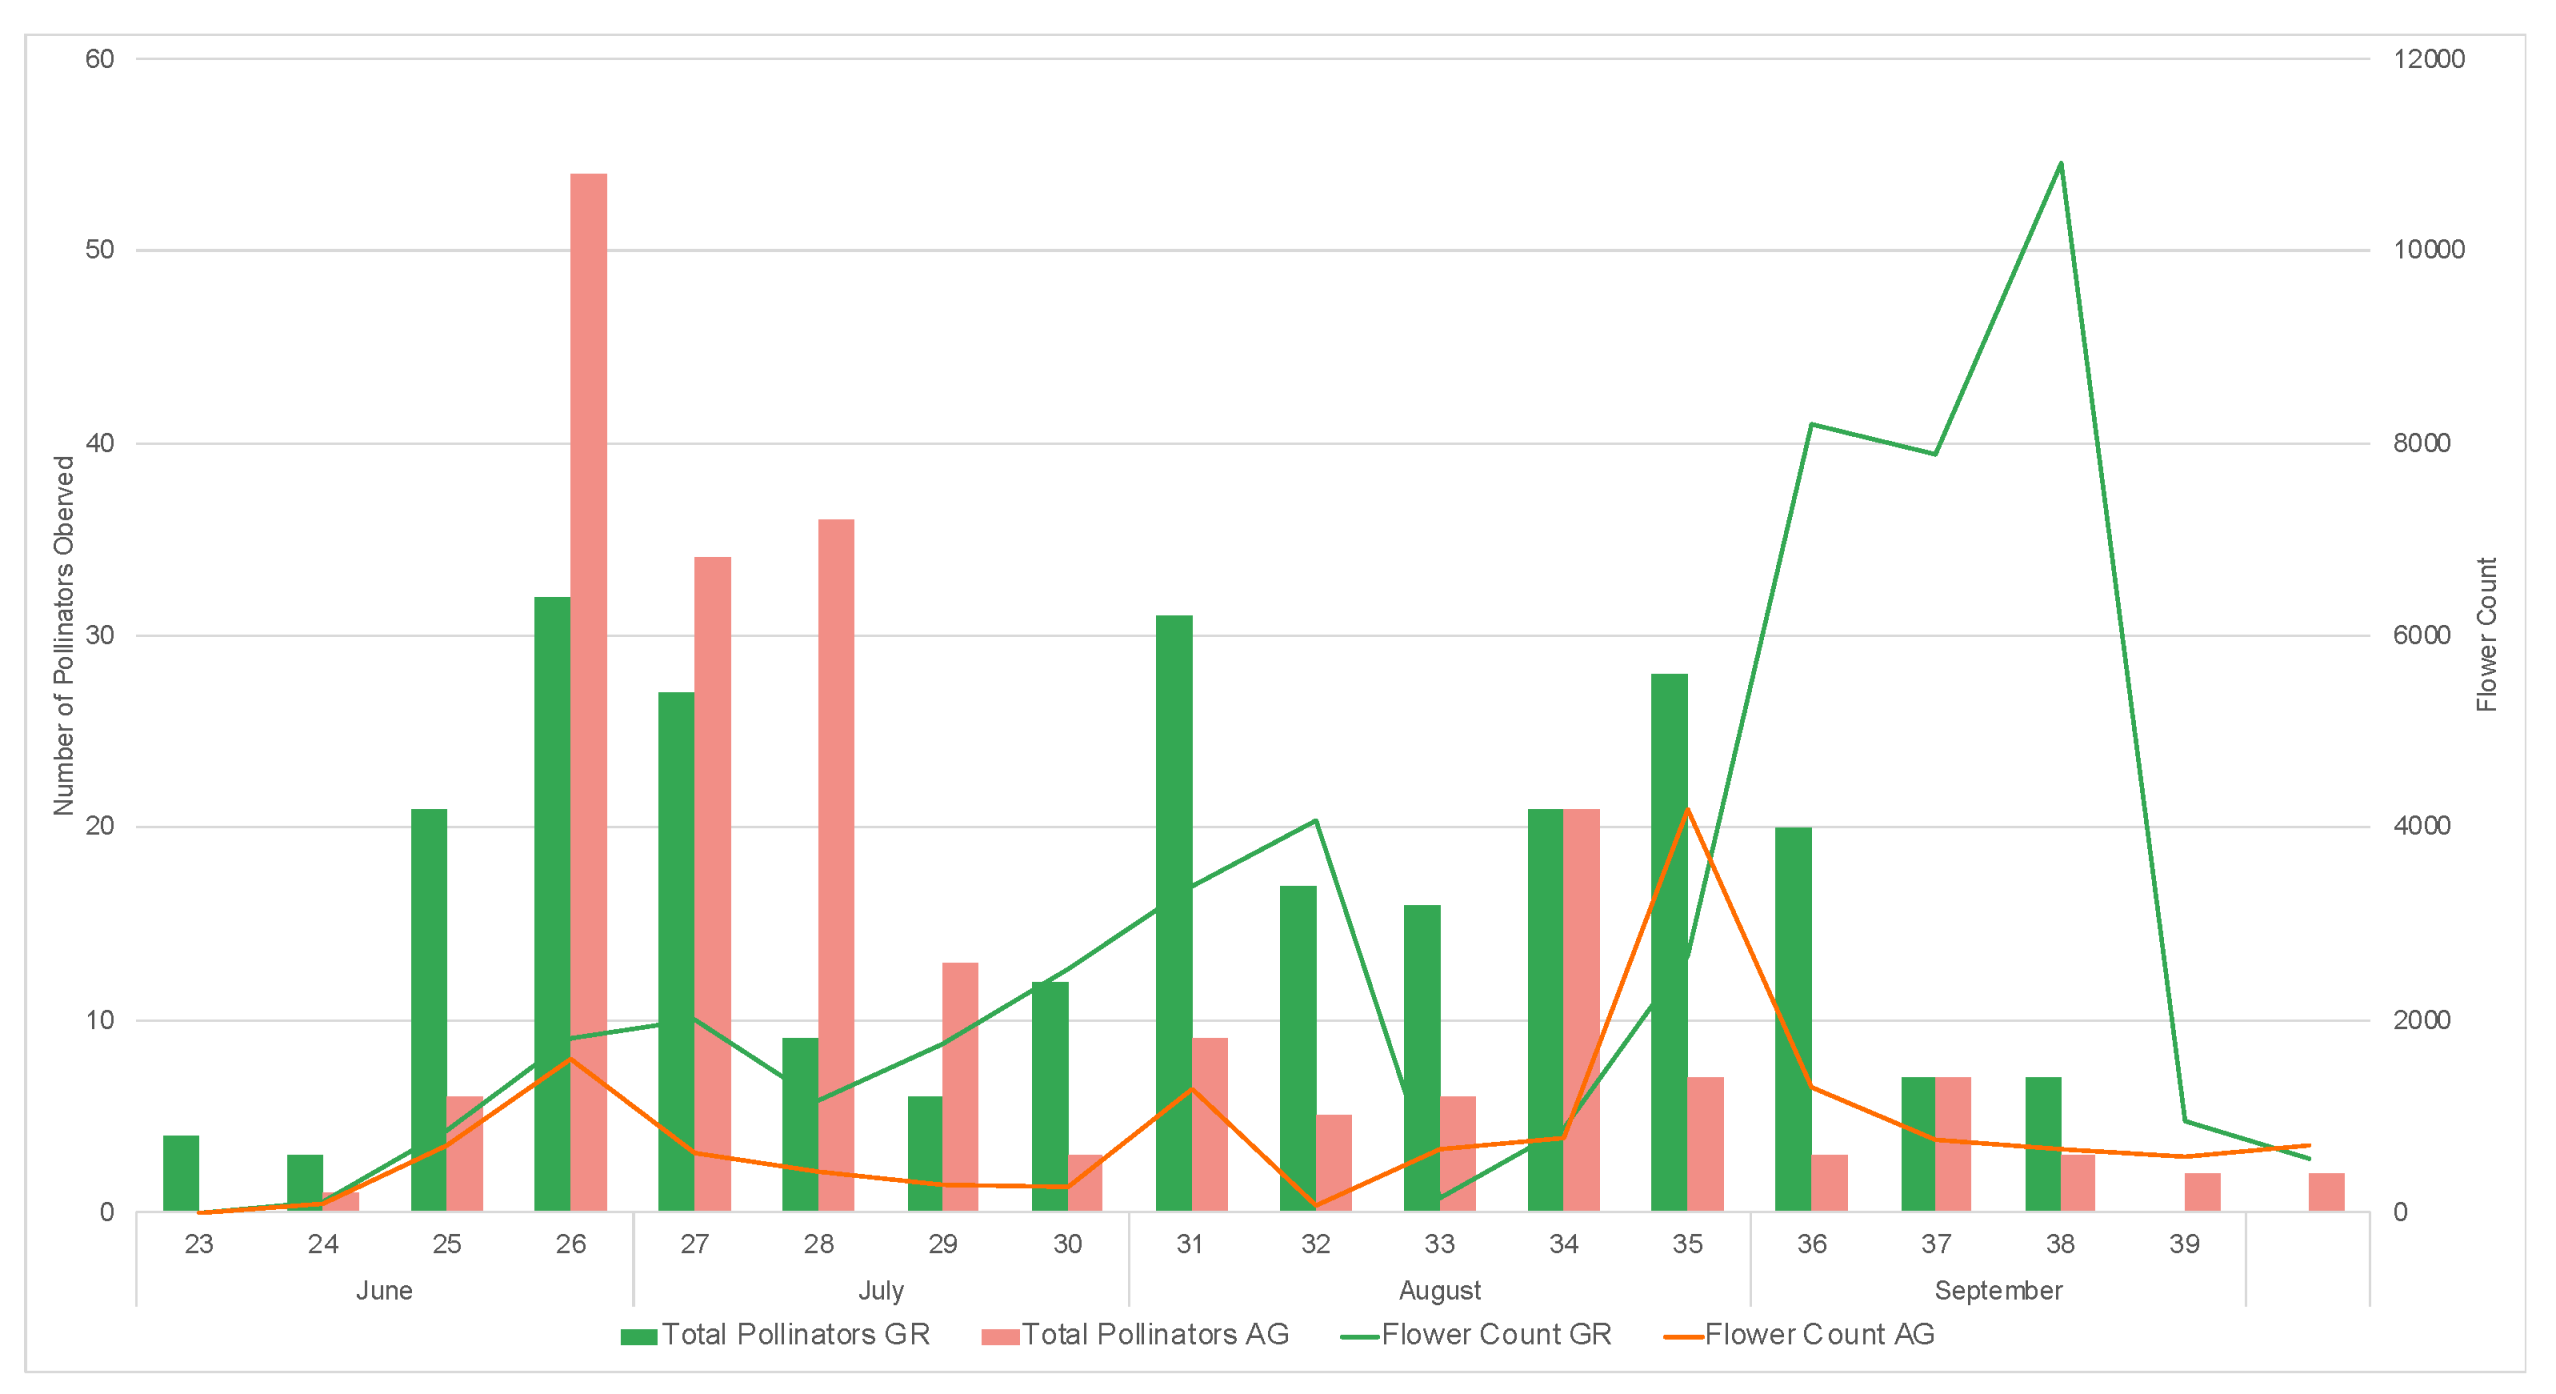
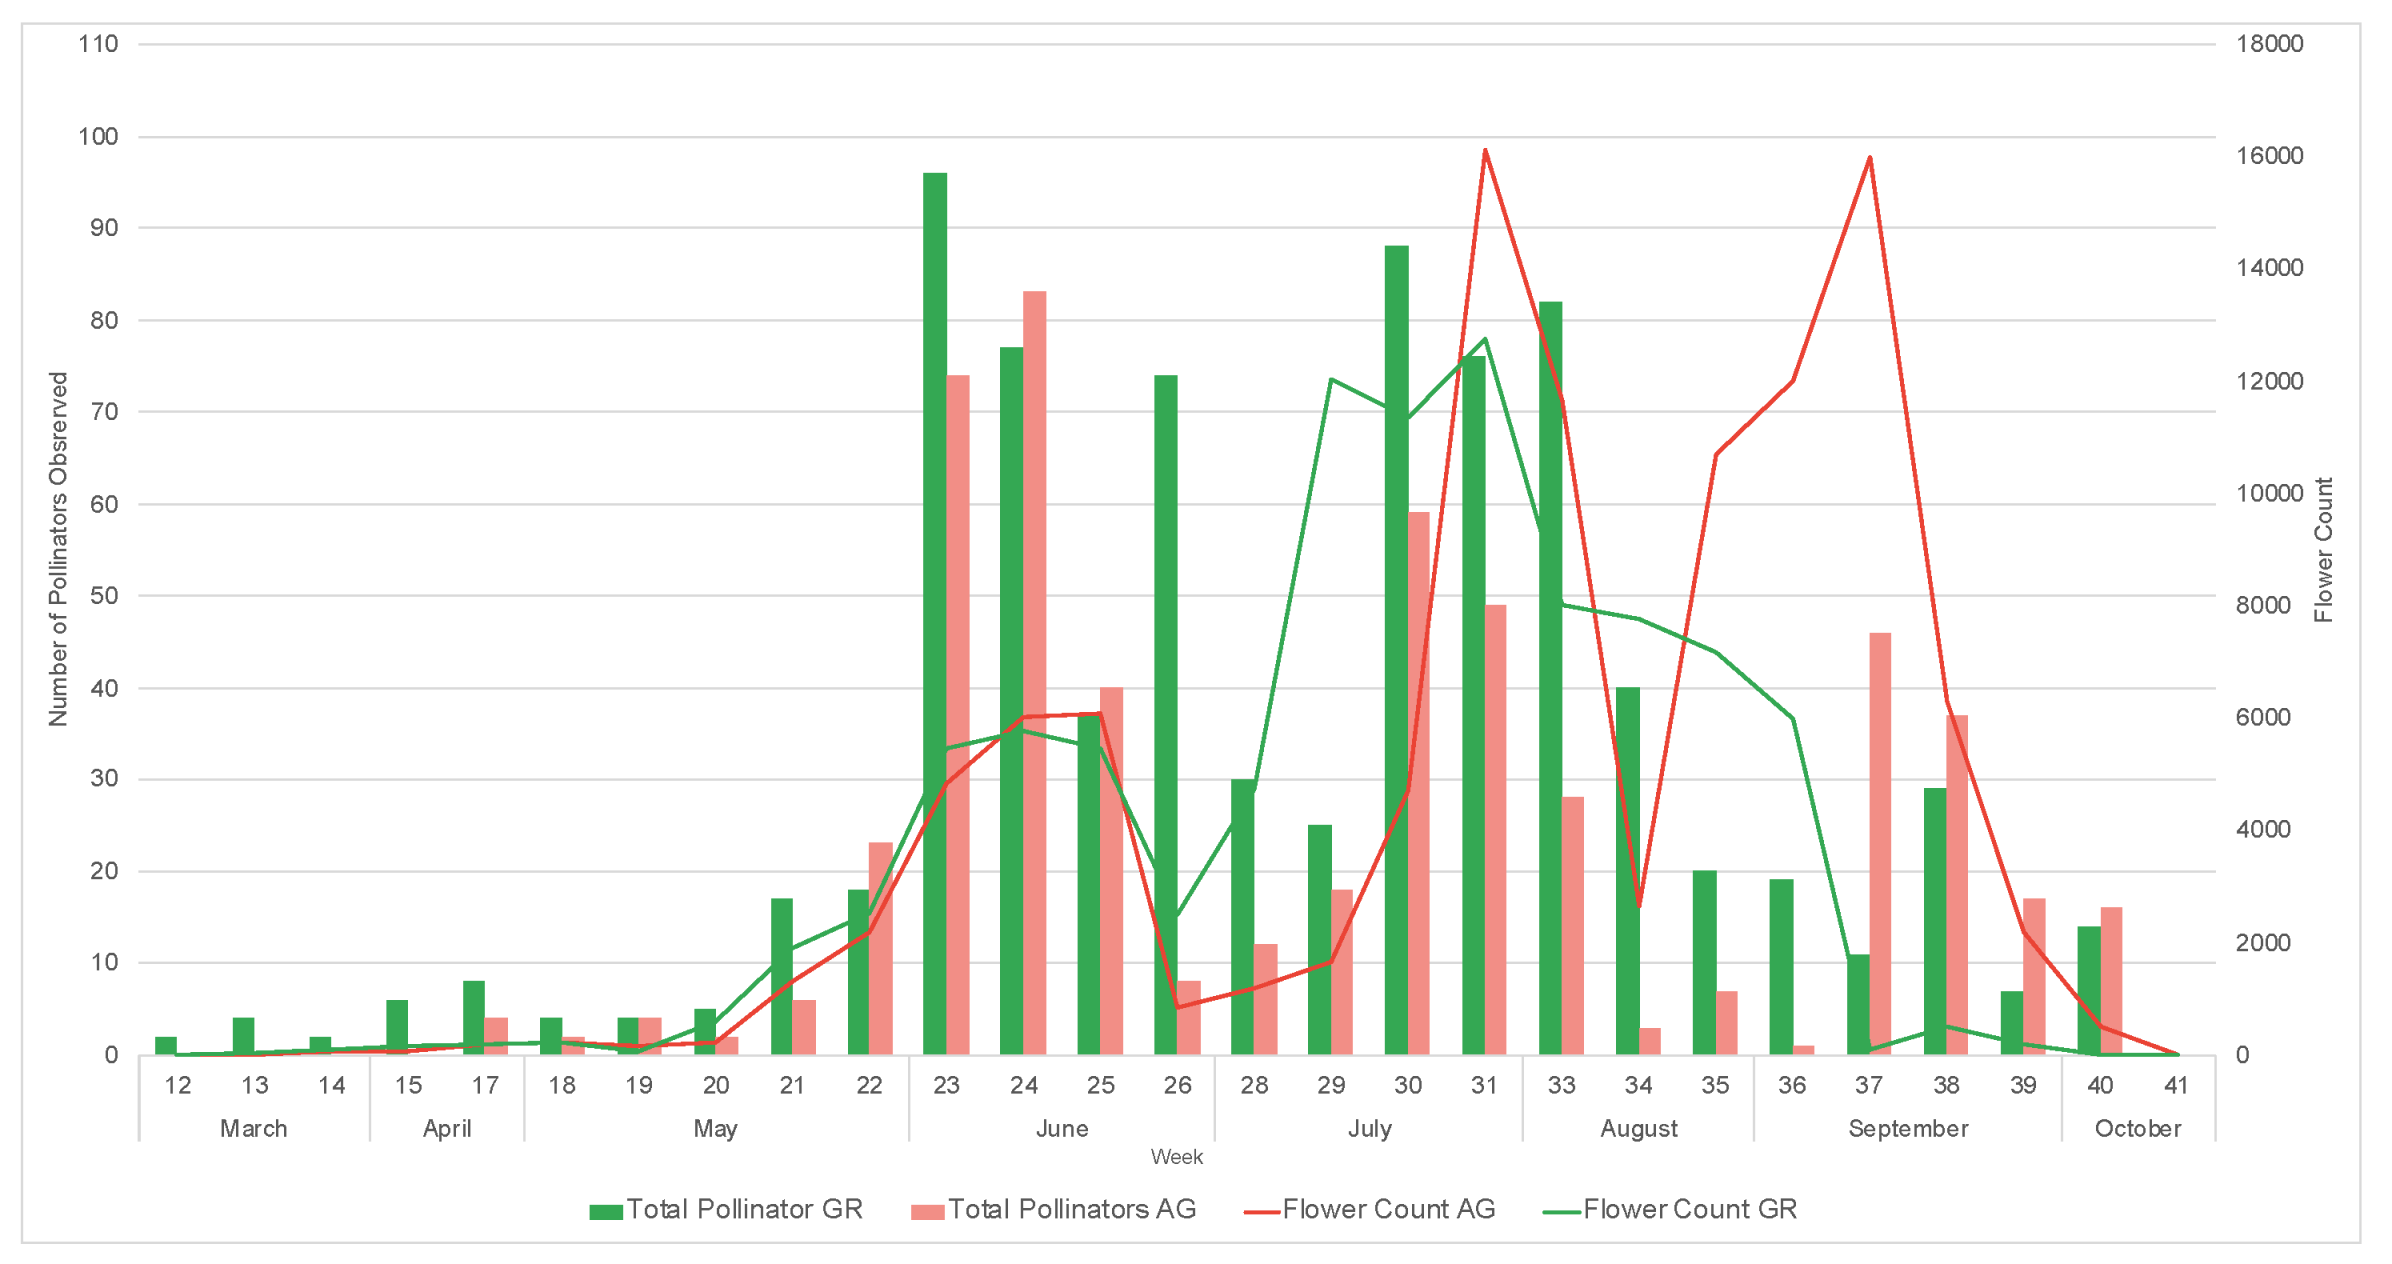
3. Results
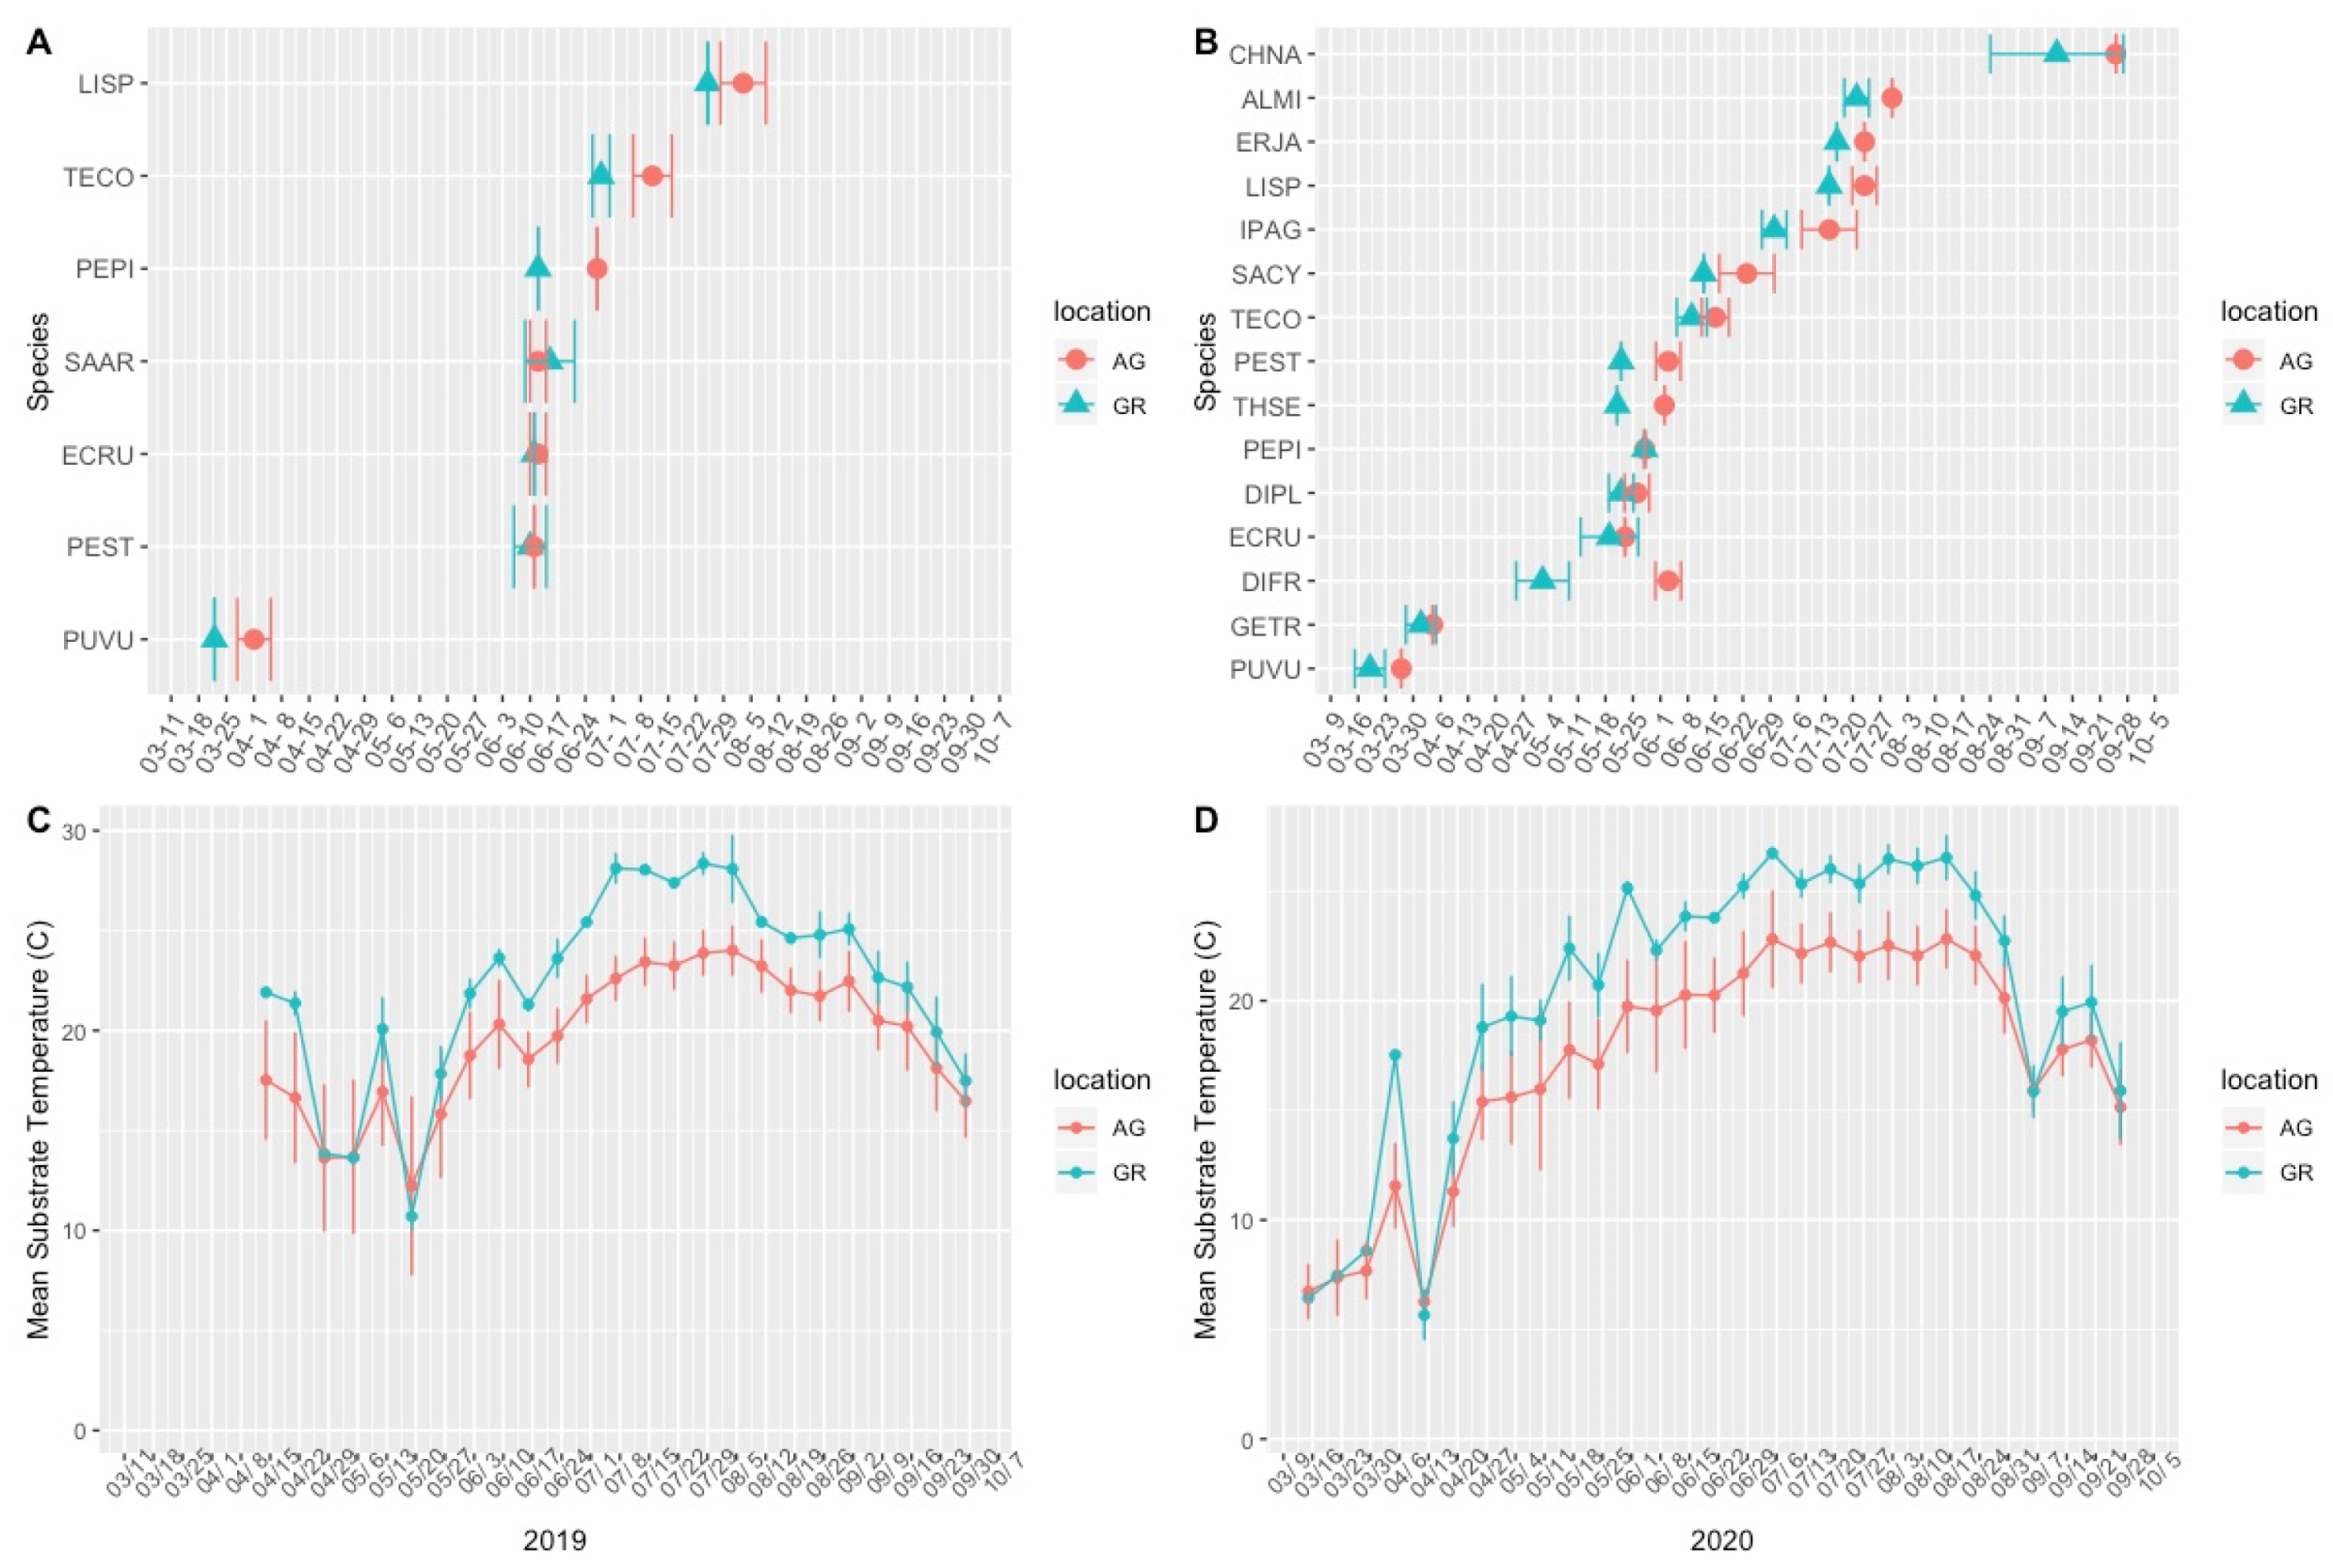
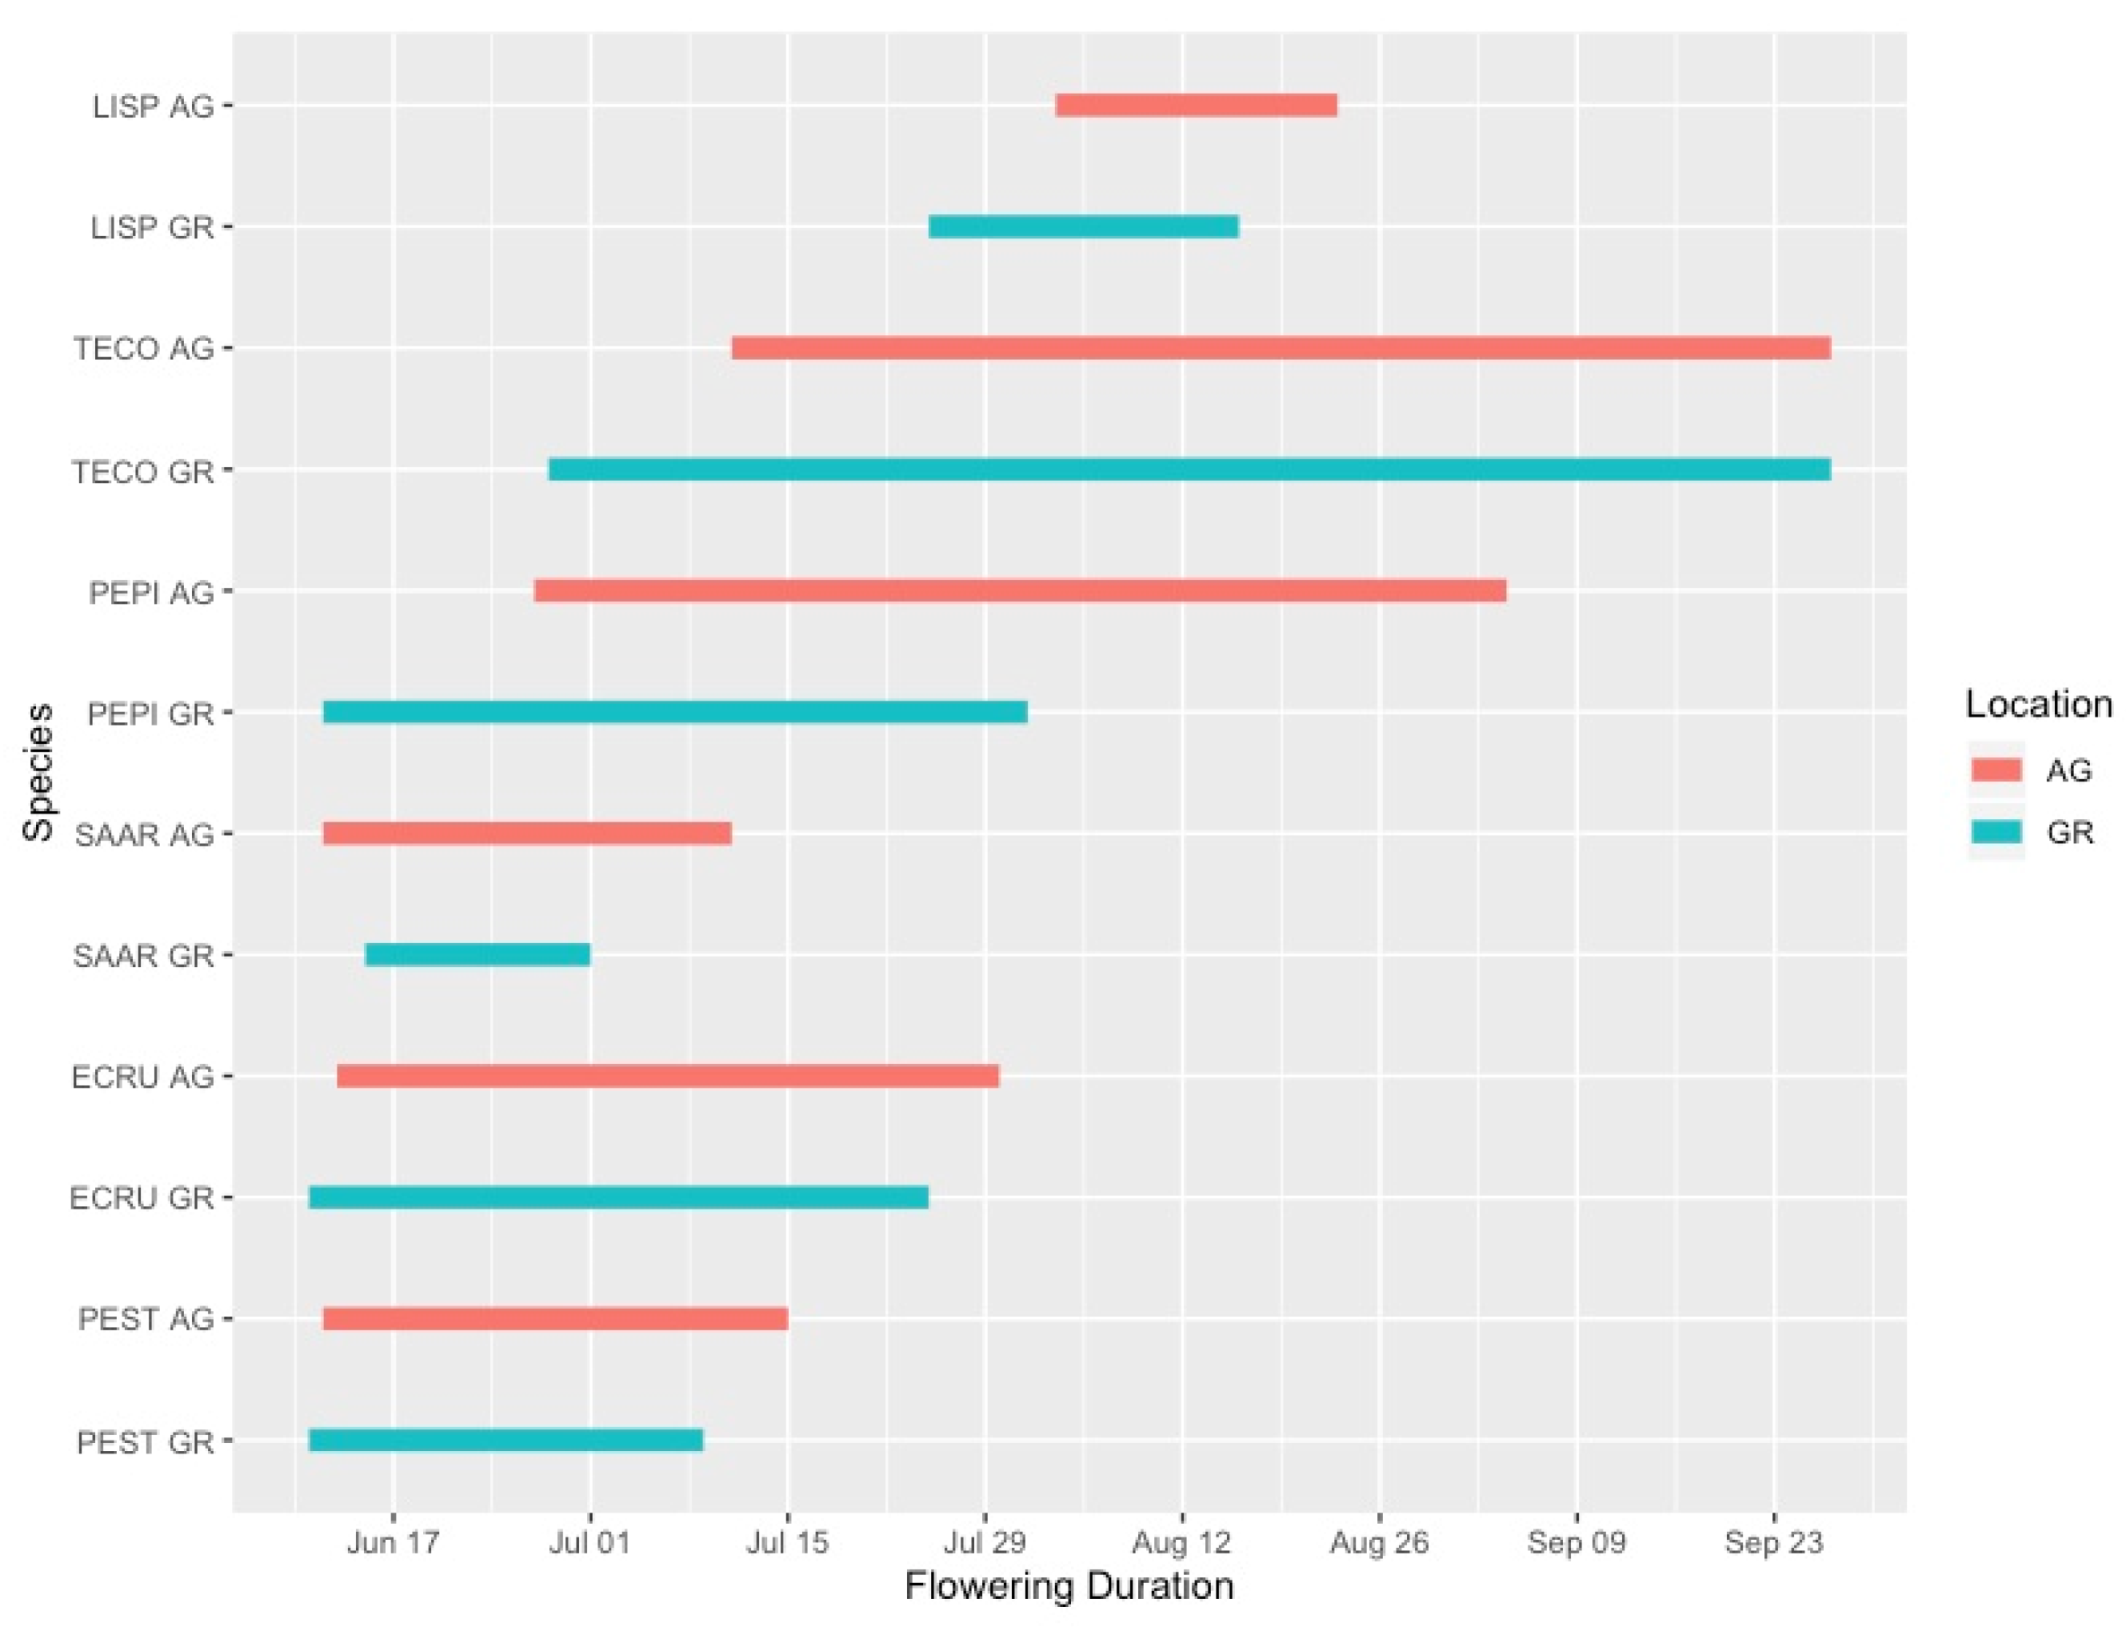
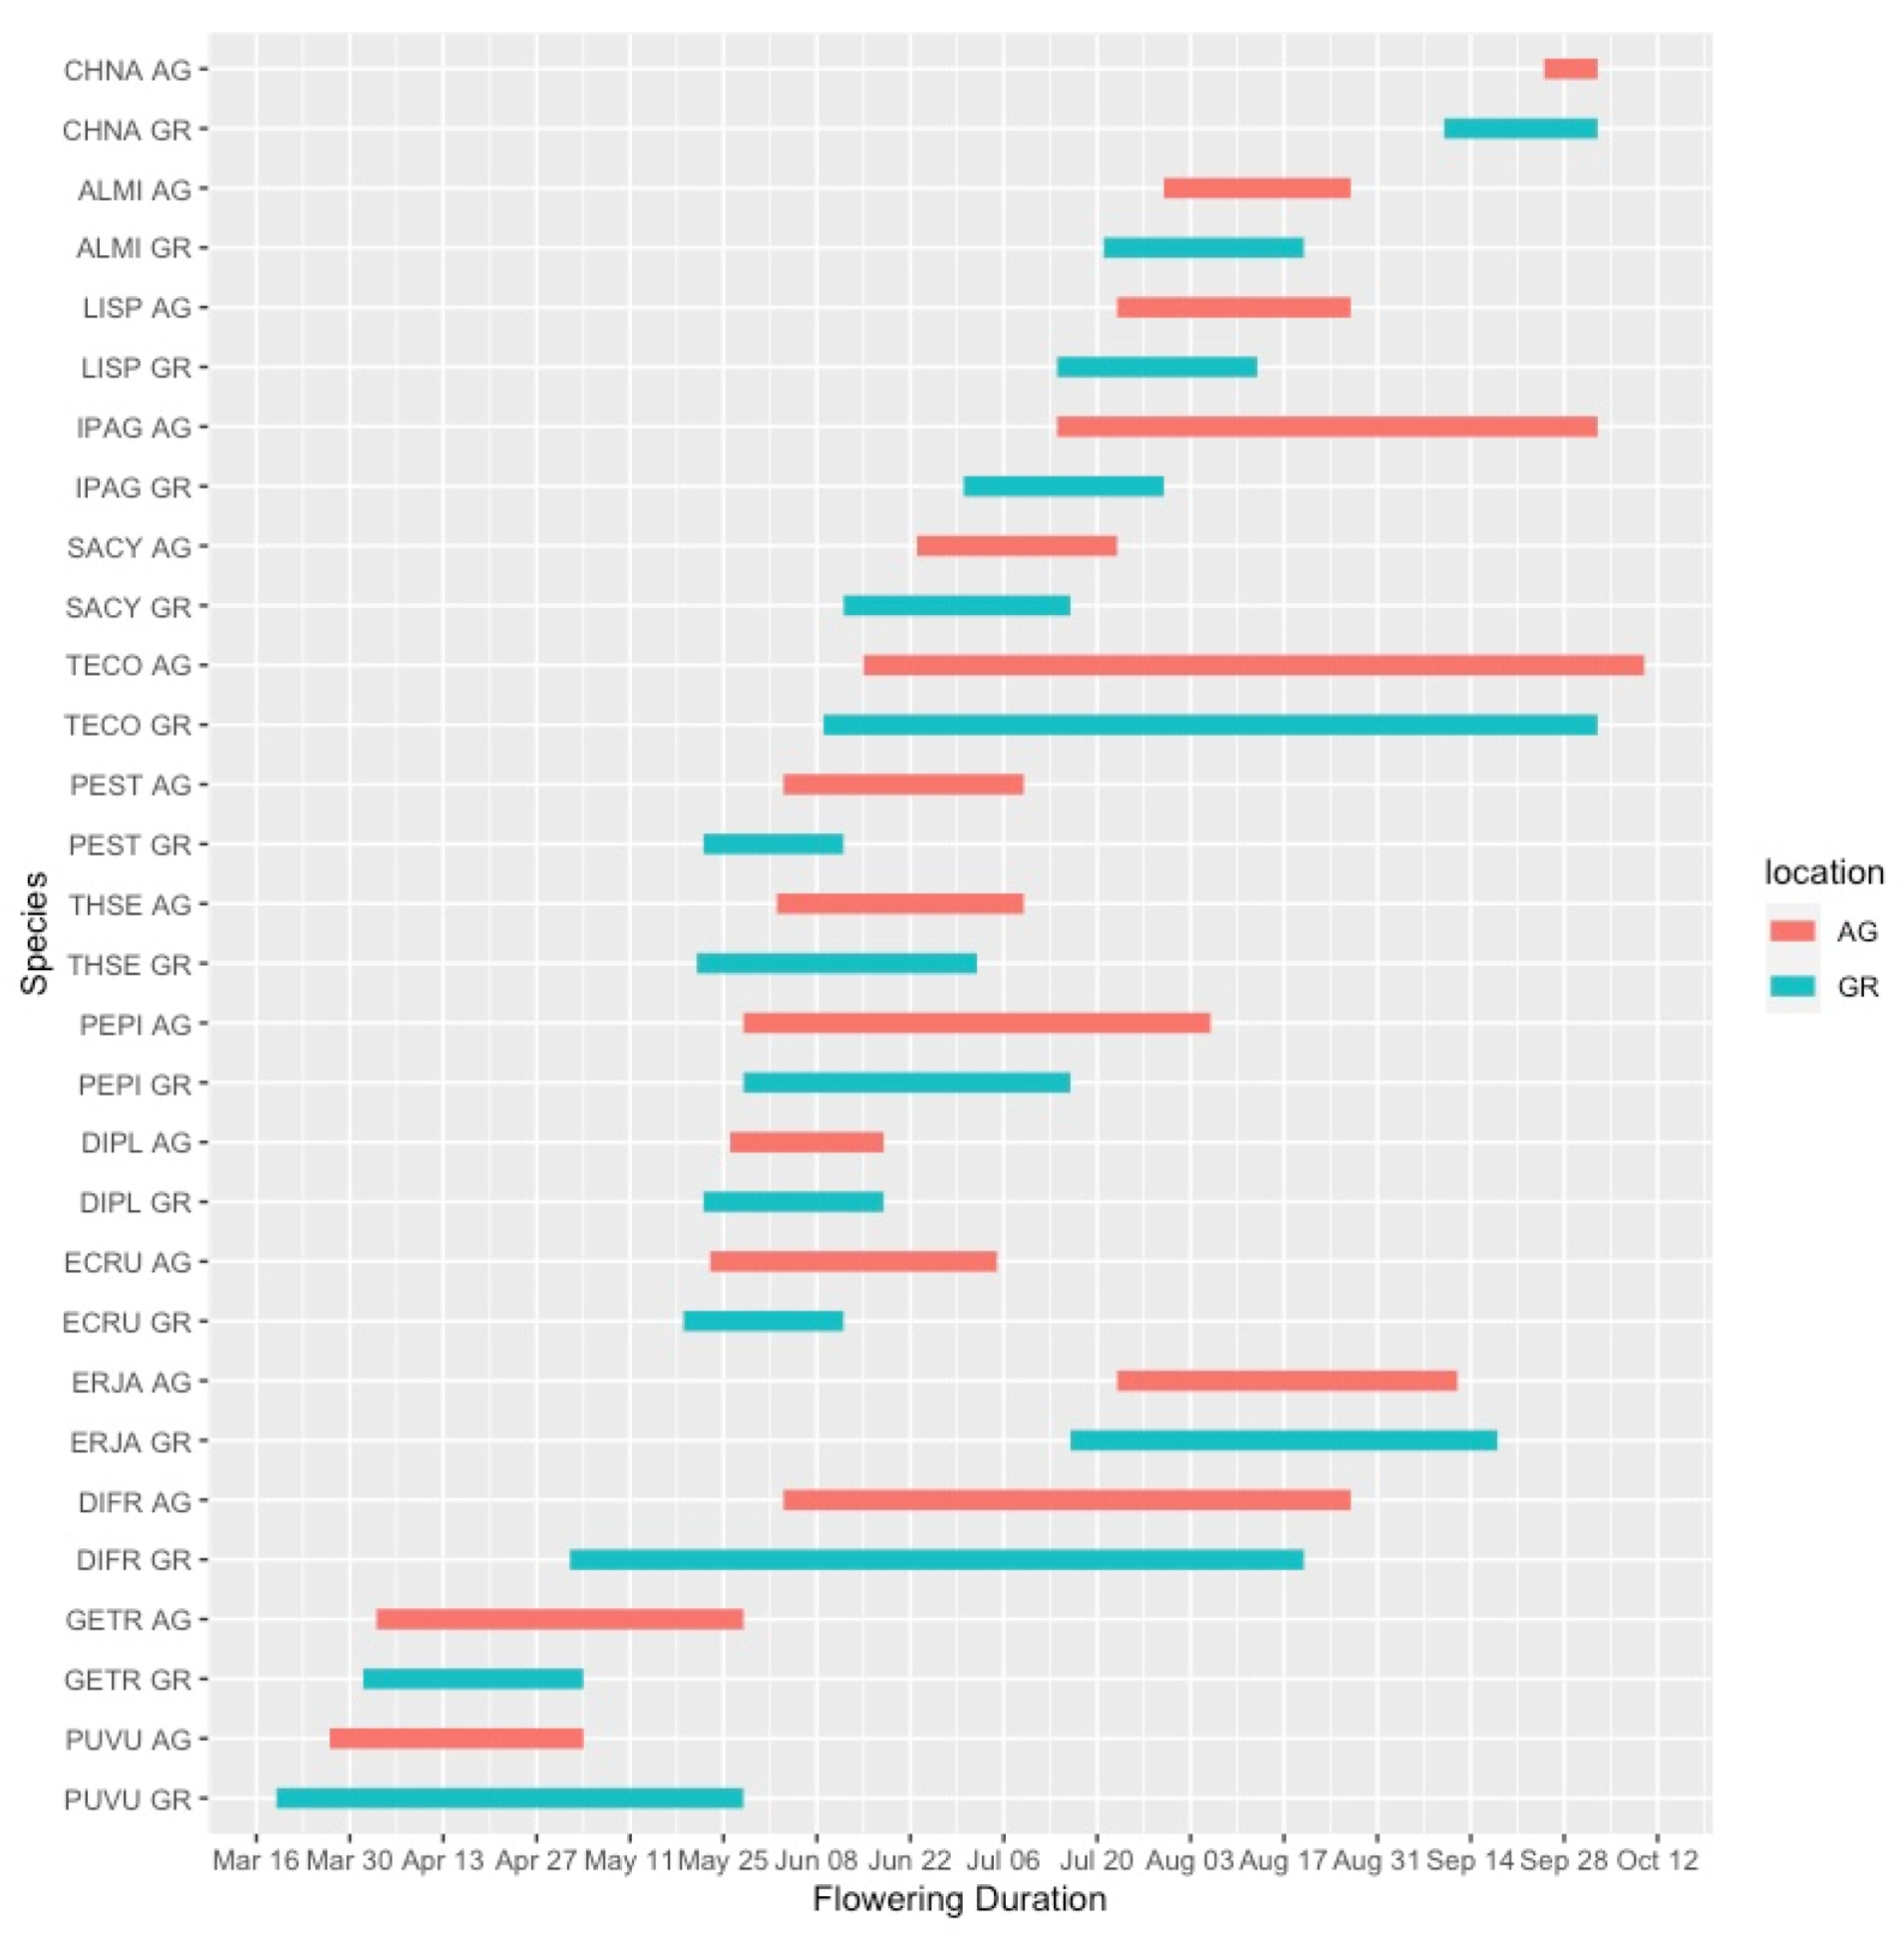
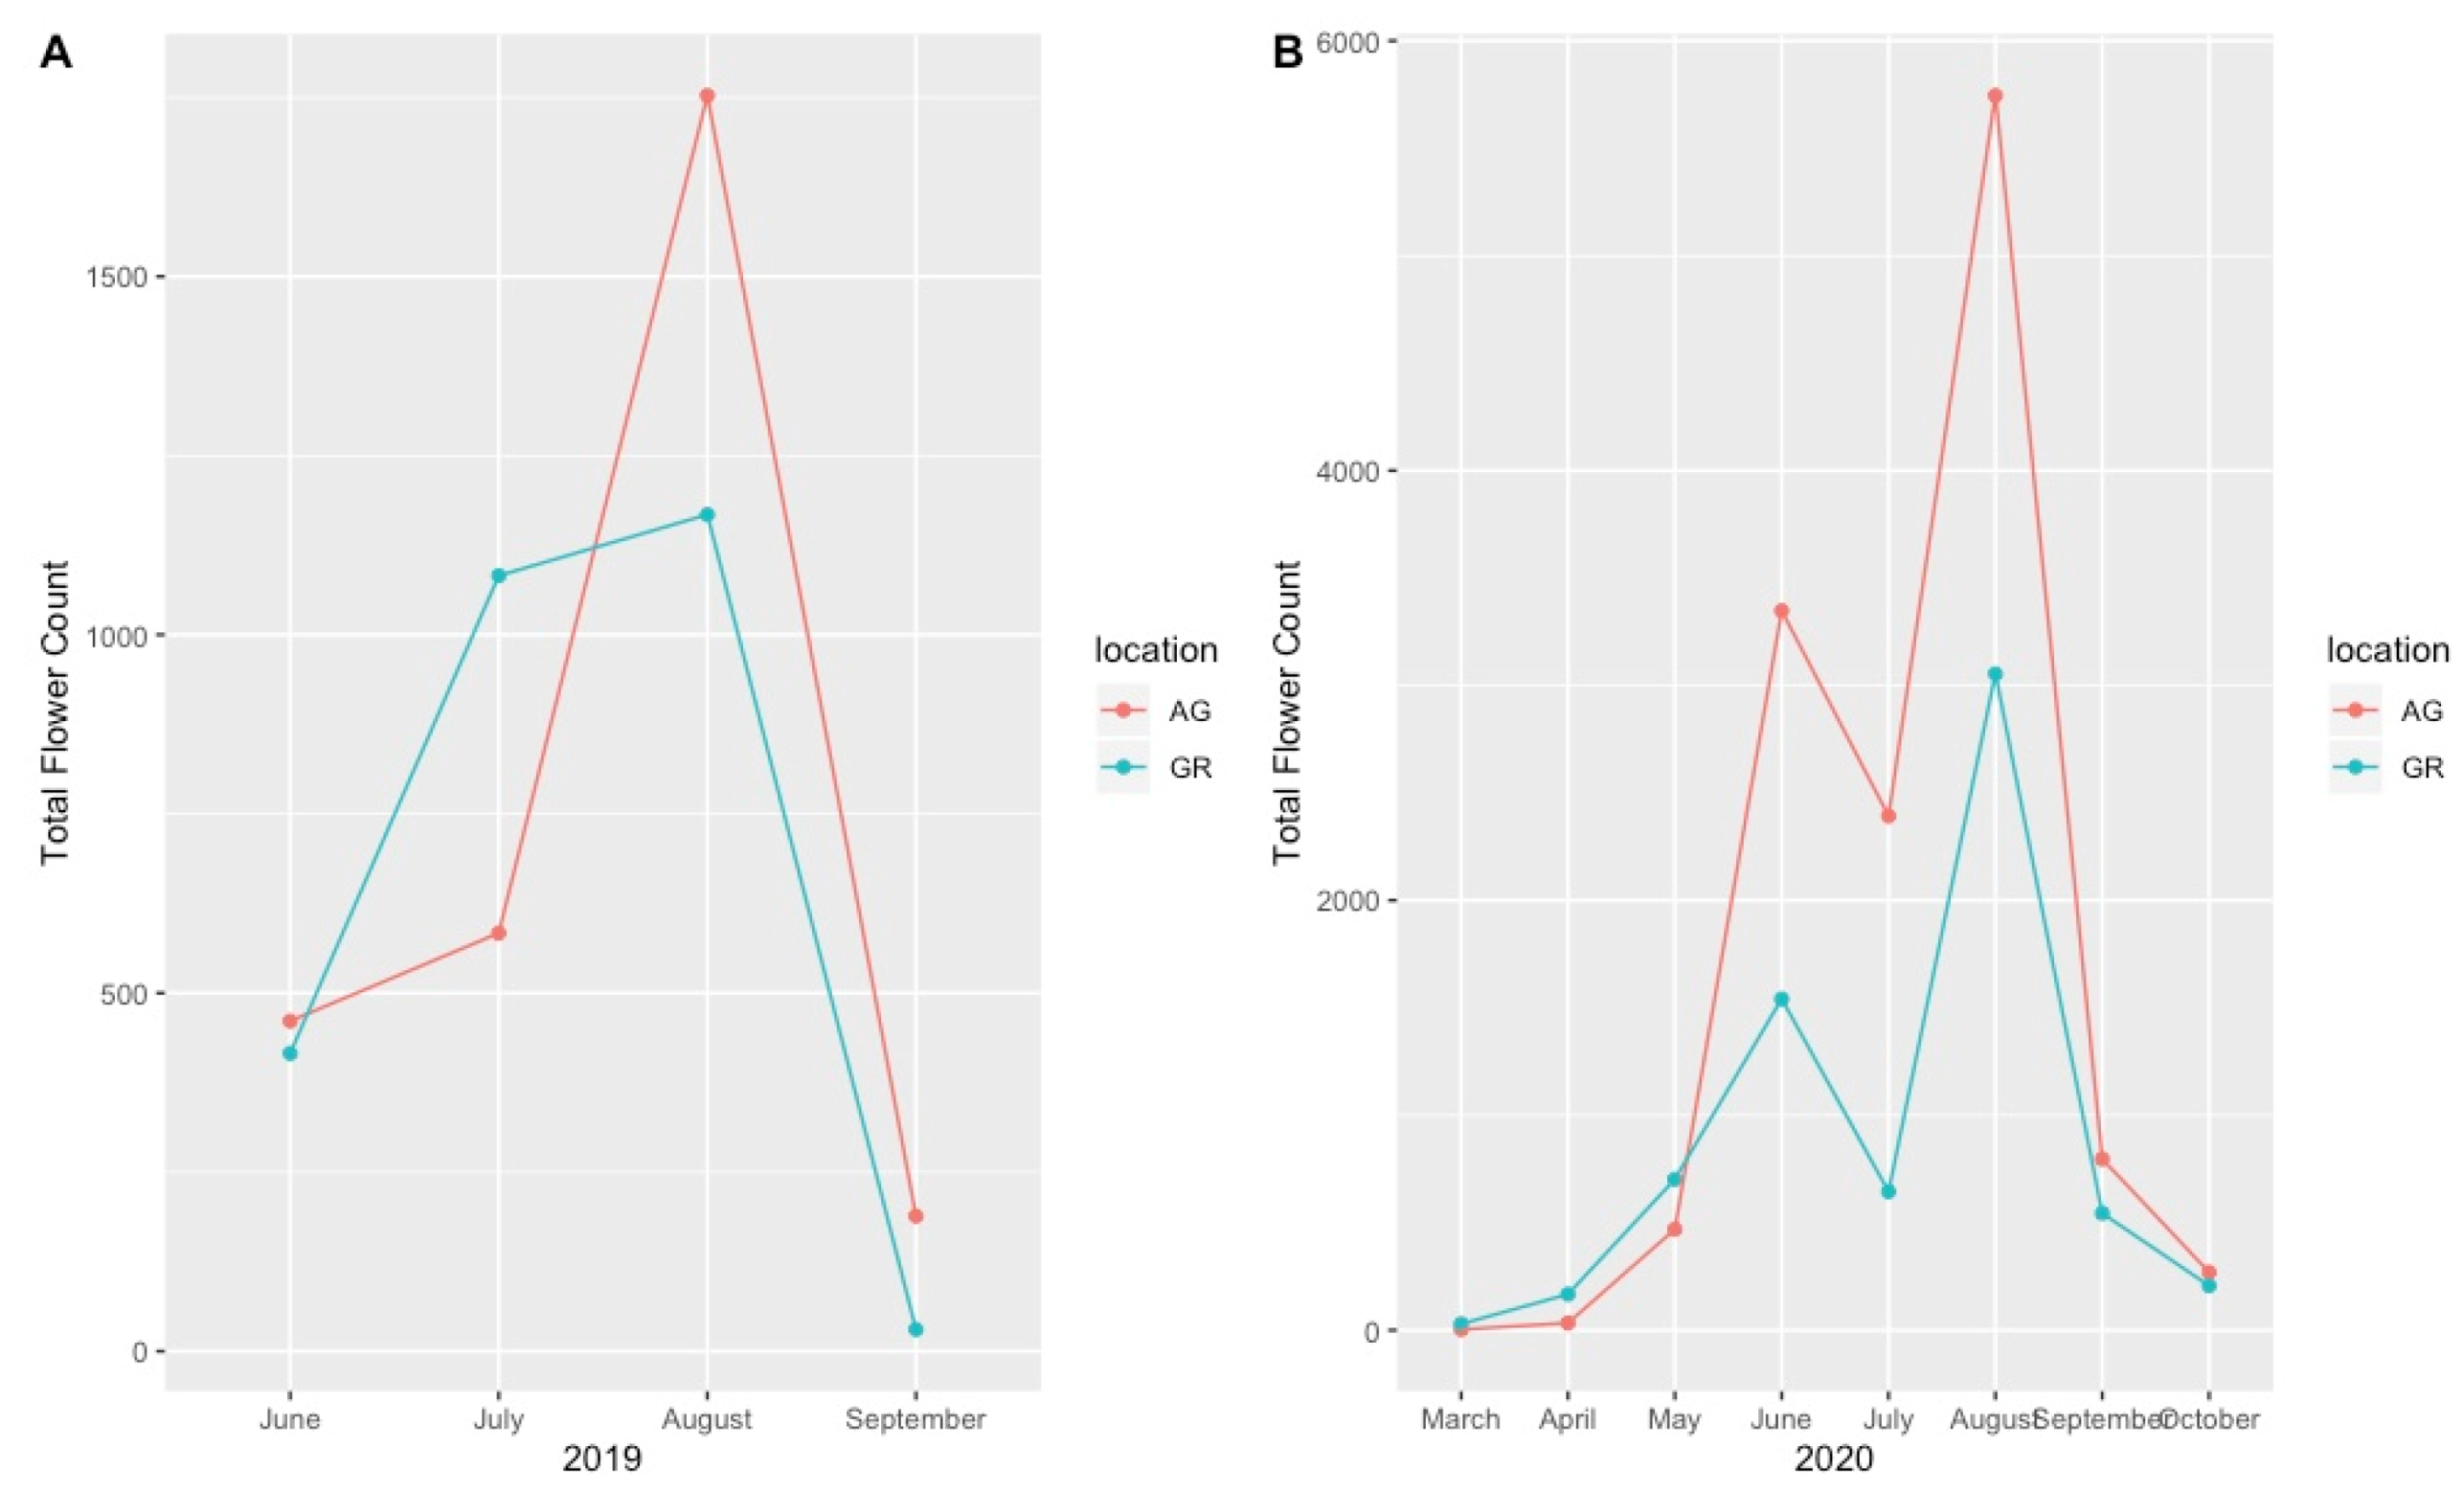
3.1. Plant Phenology
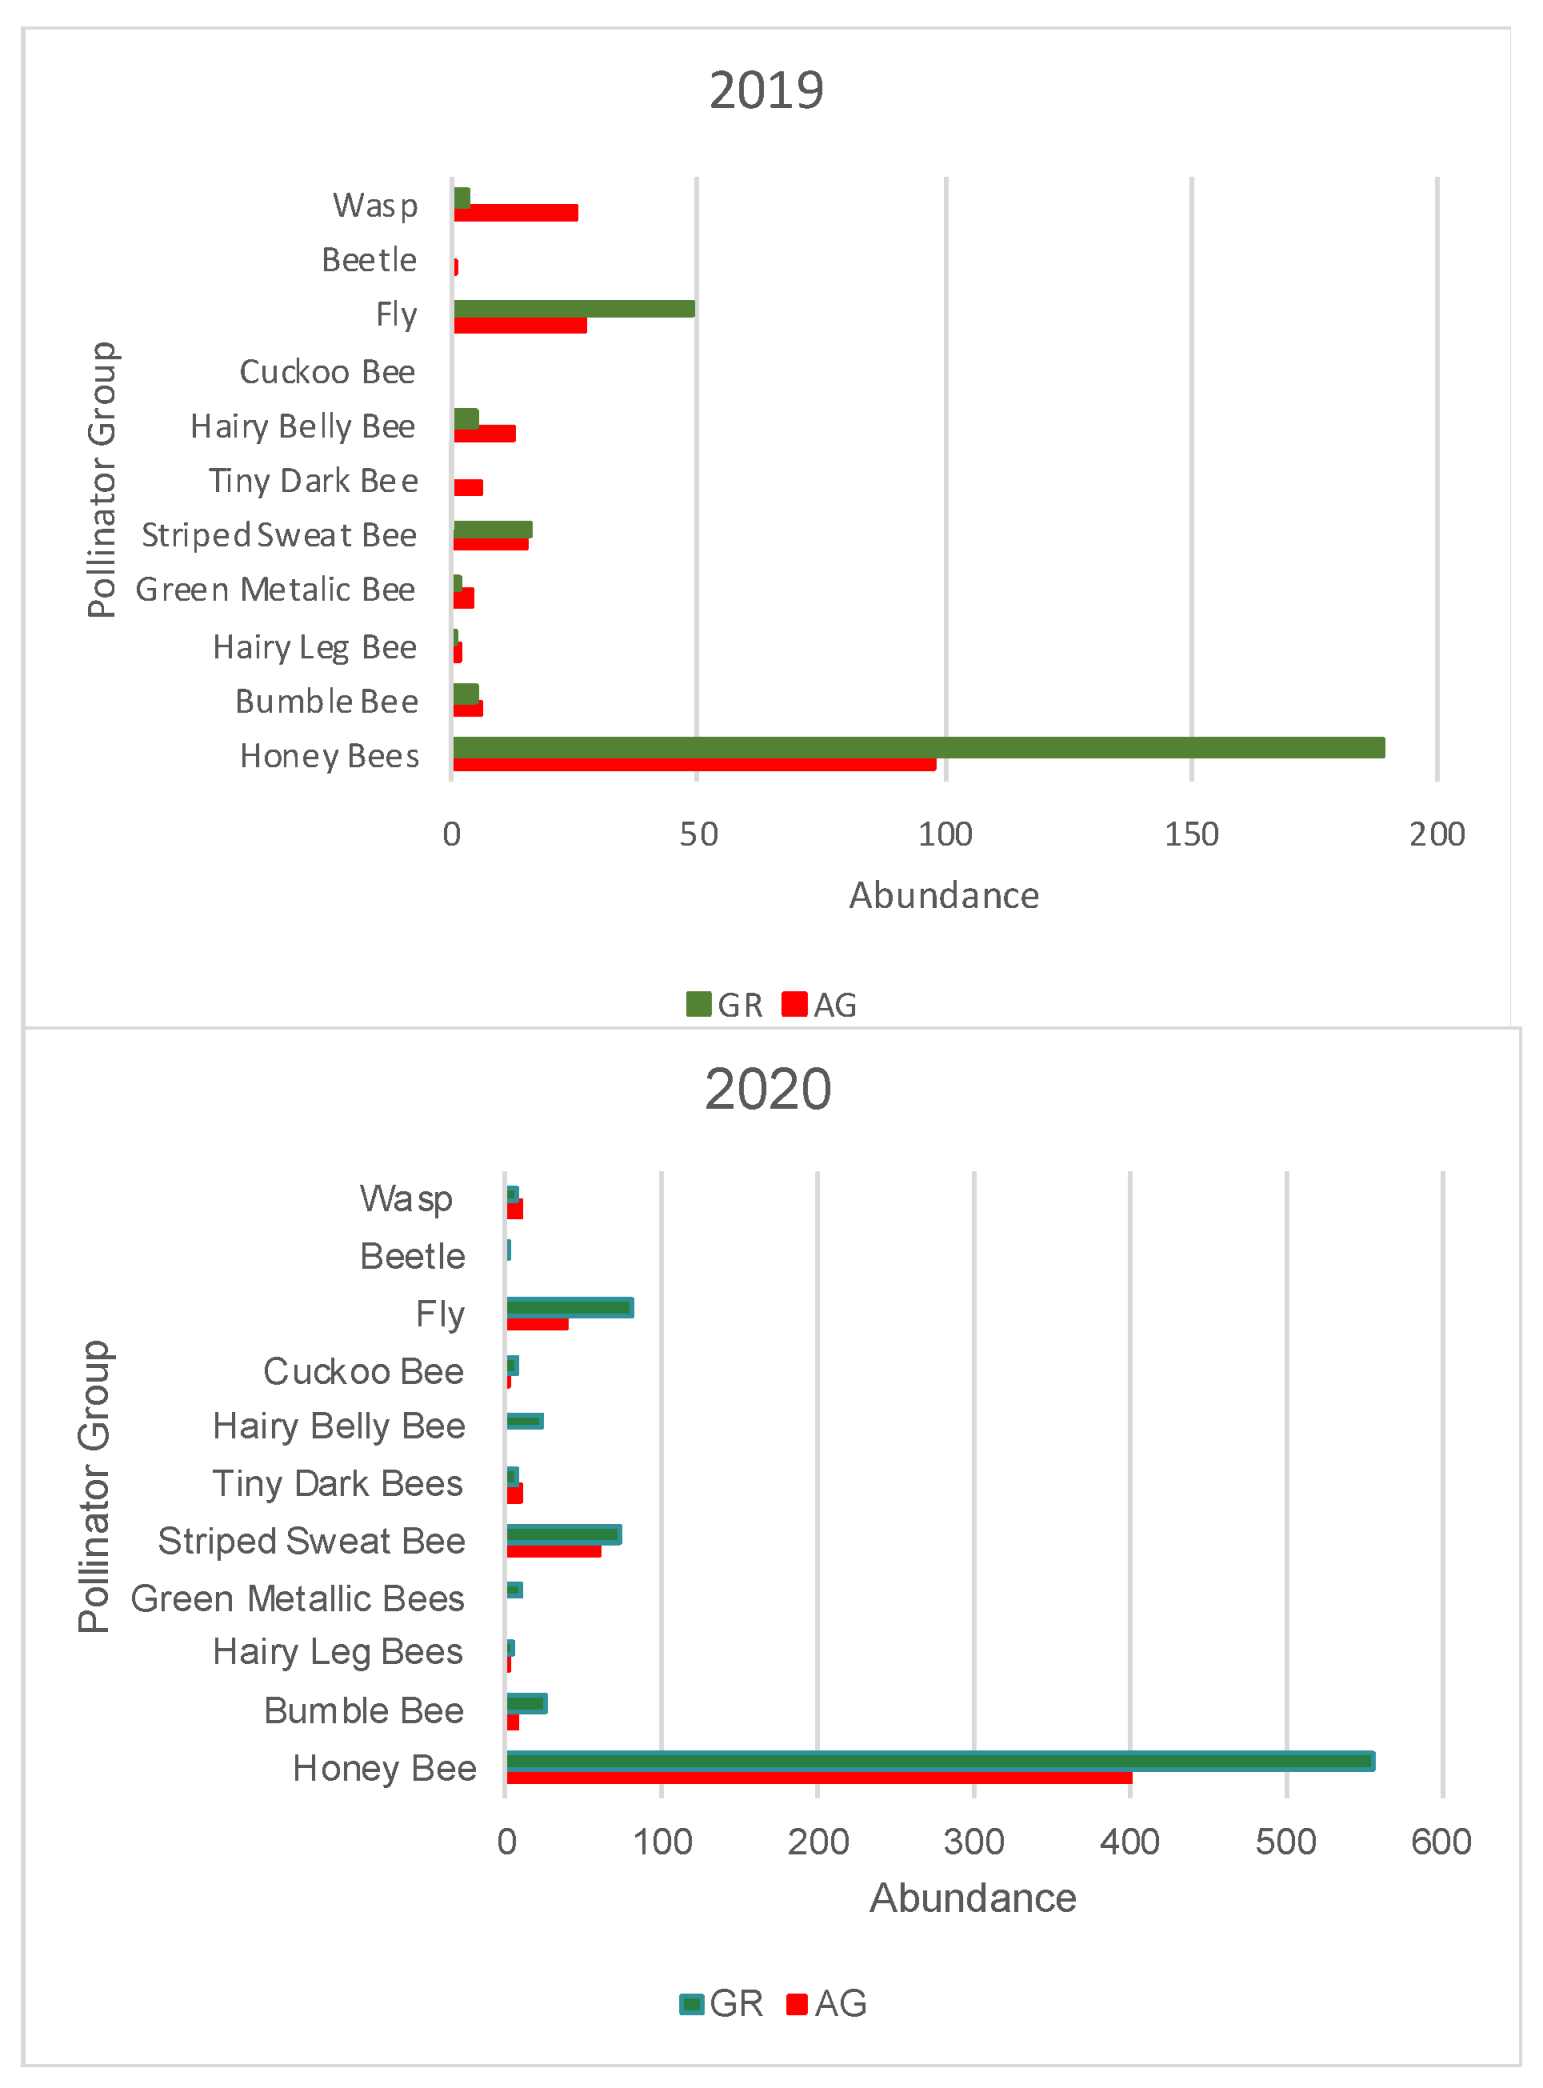
3.2. Pollinator Visitation
4. Discussion
4.1. Green Roof Phenology
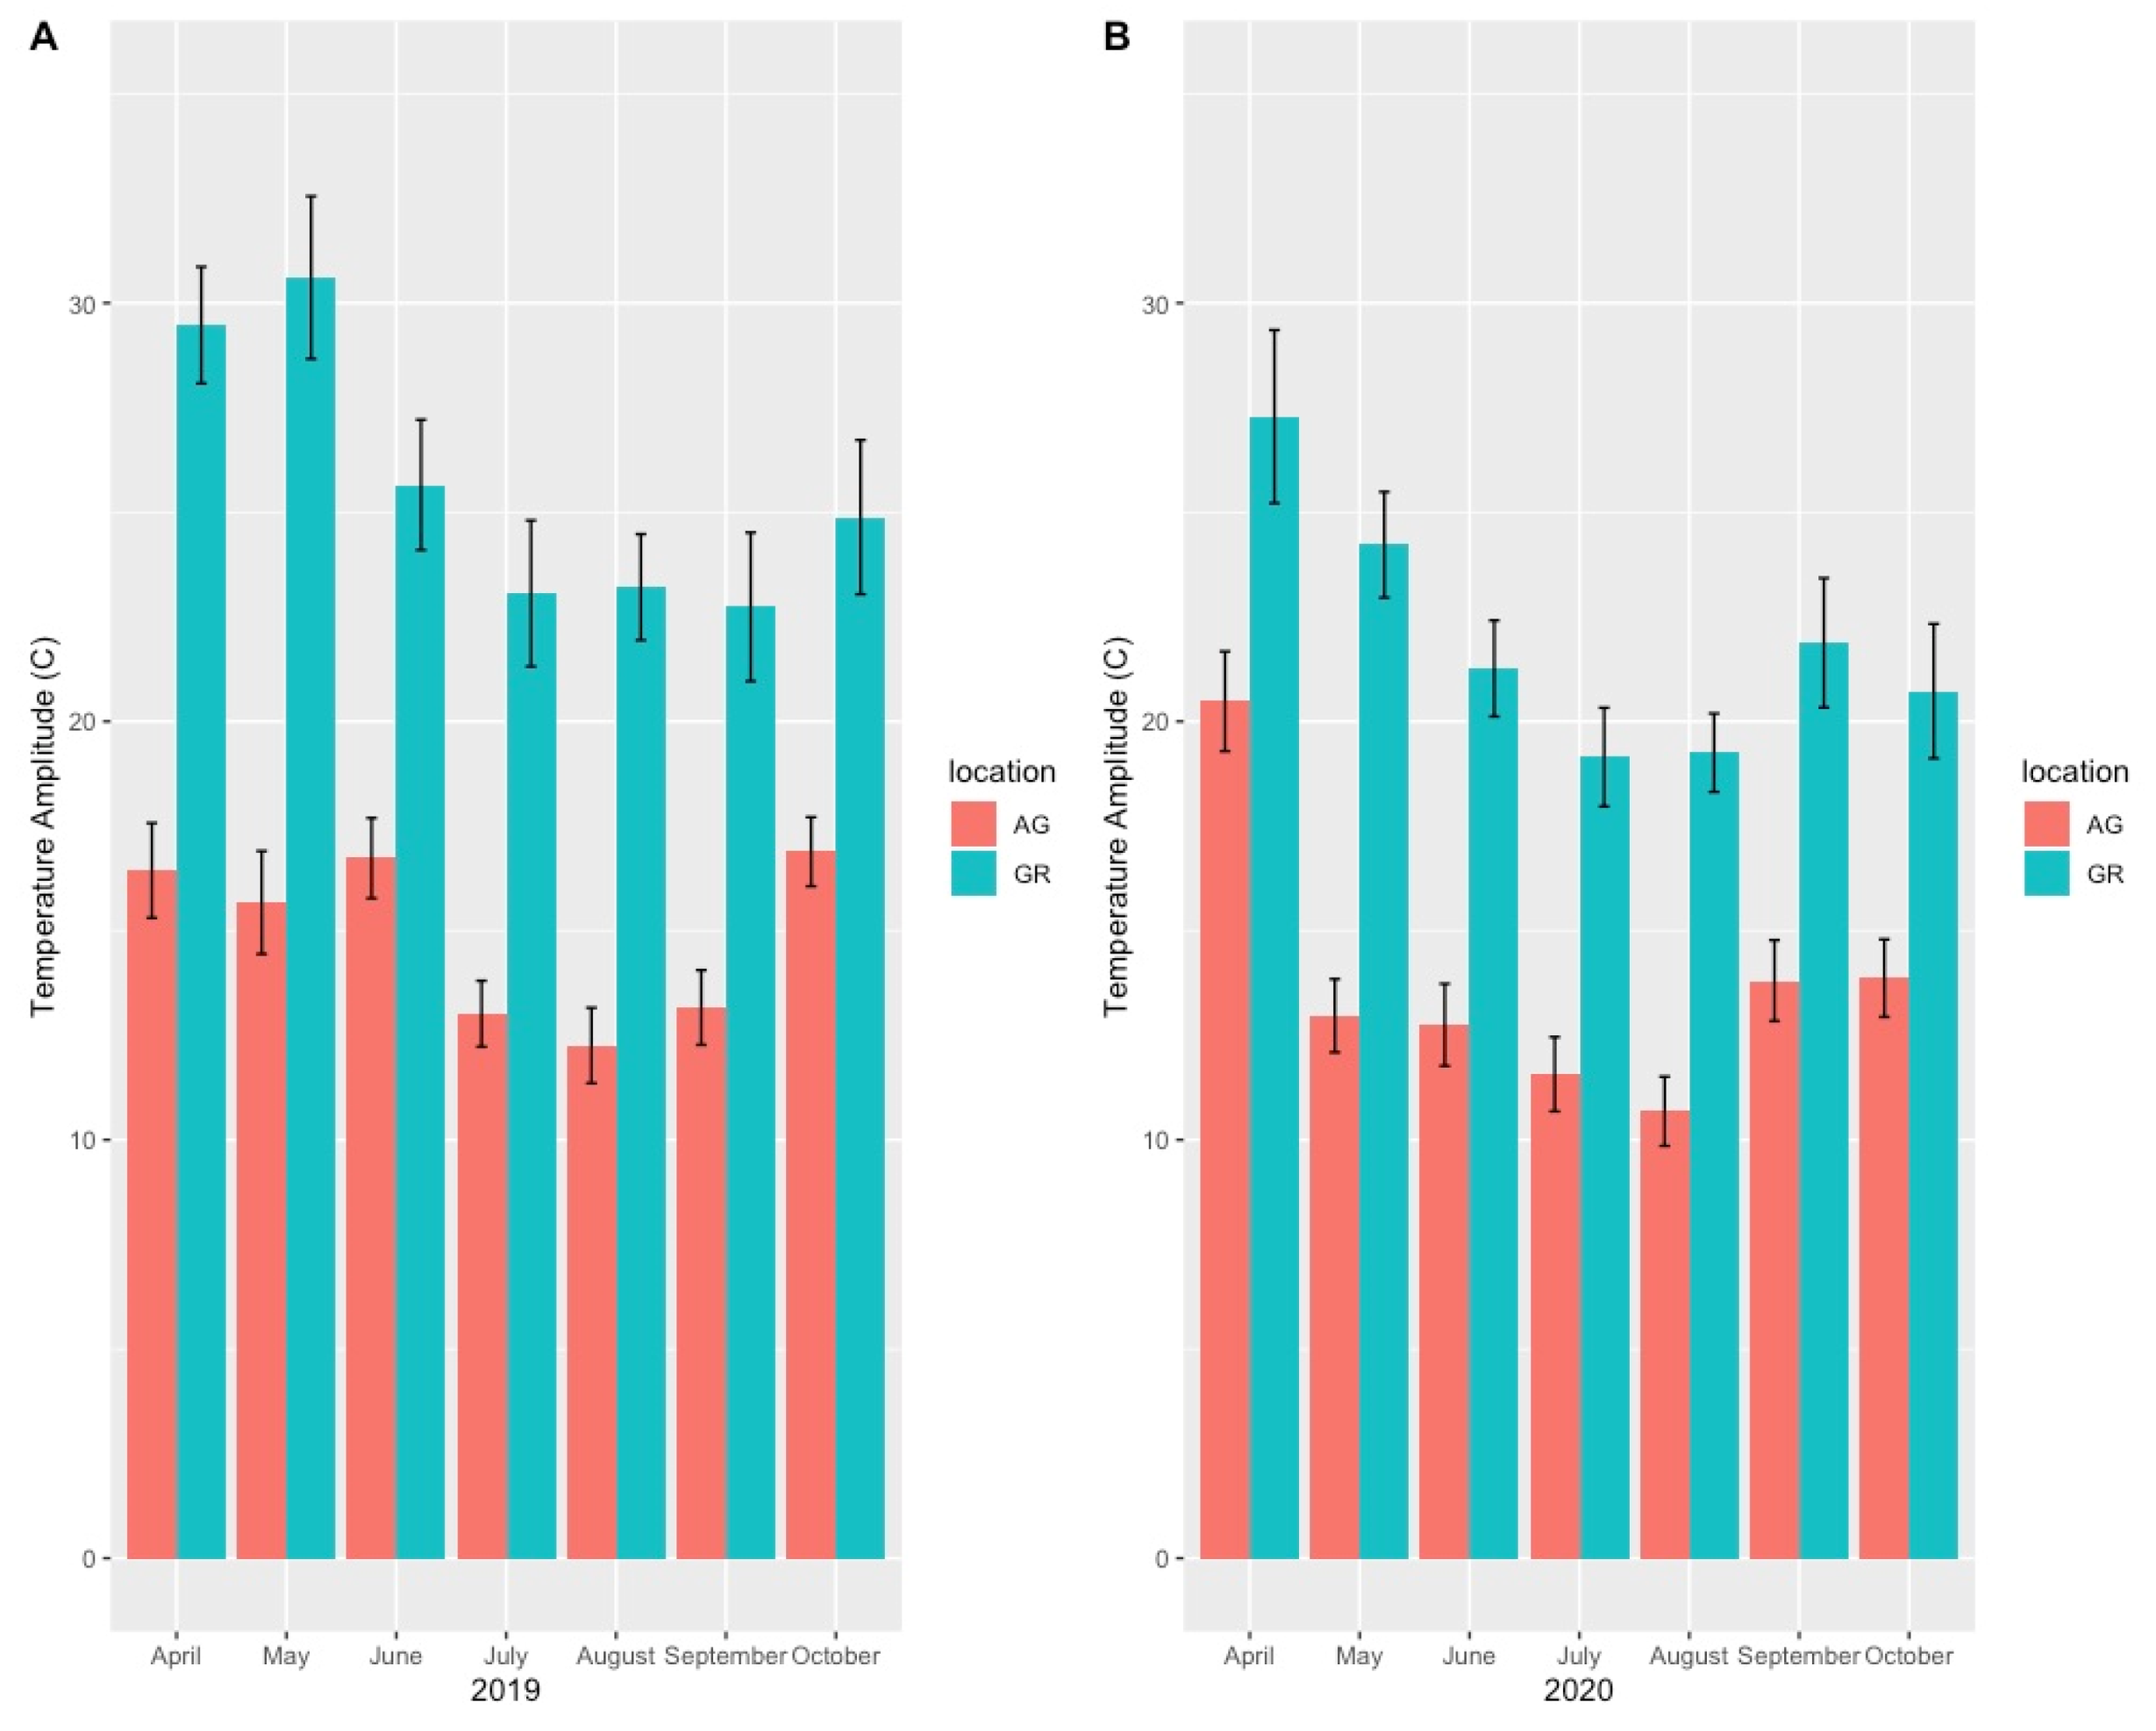
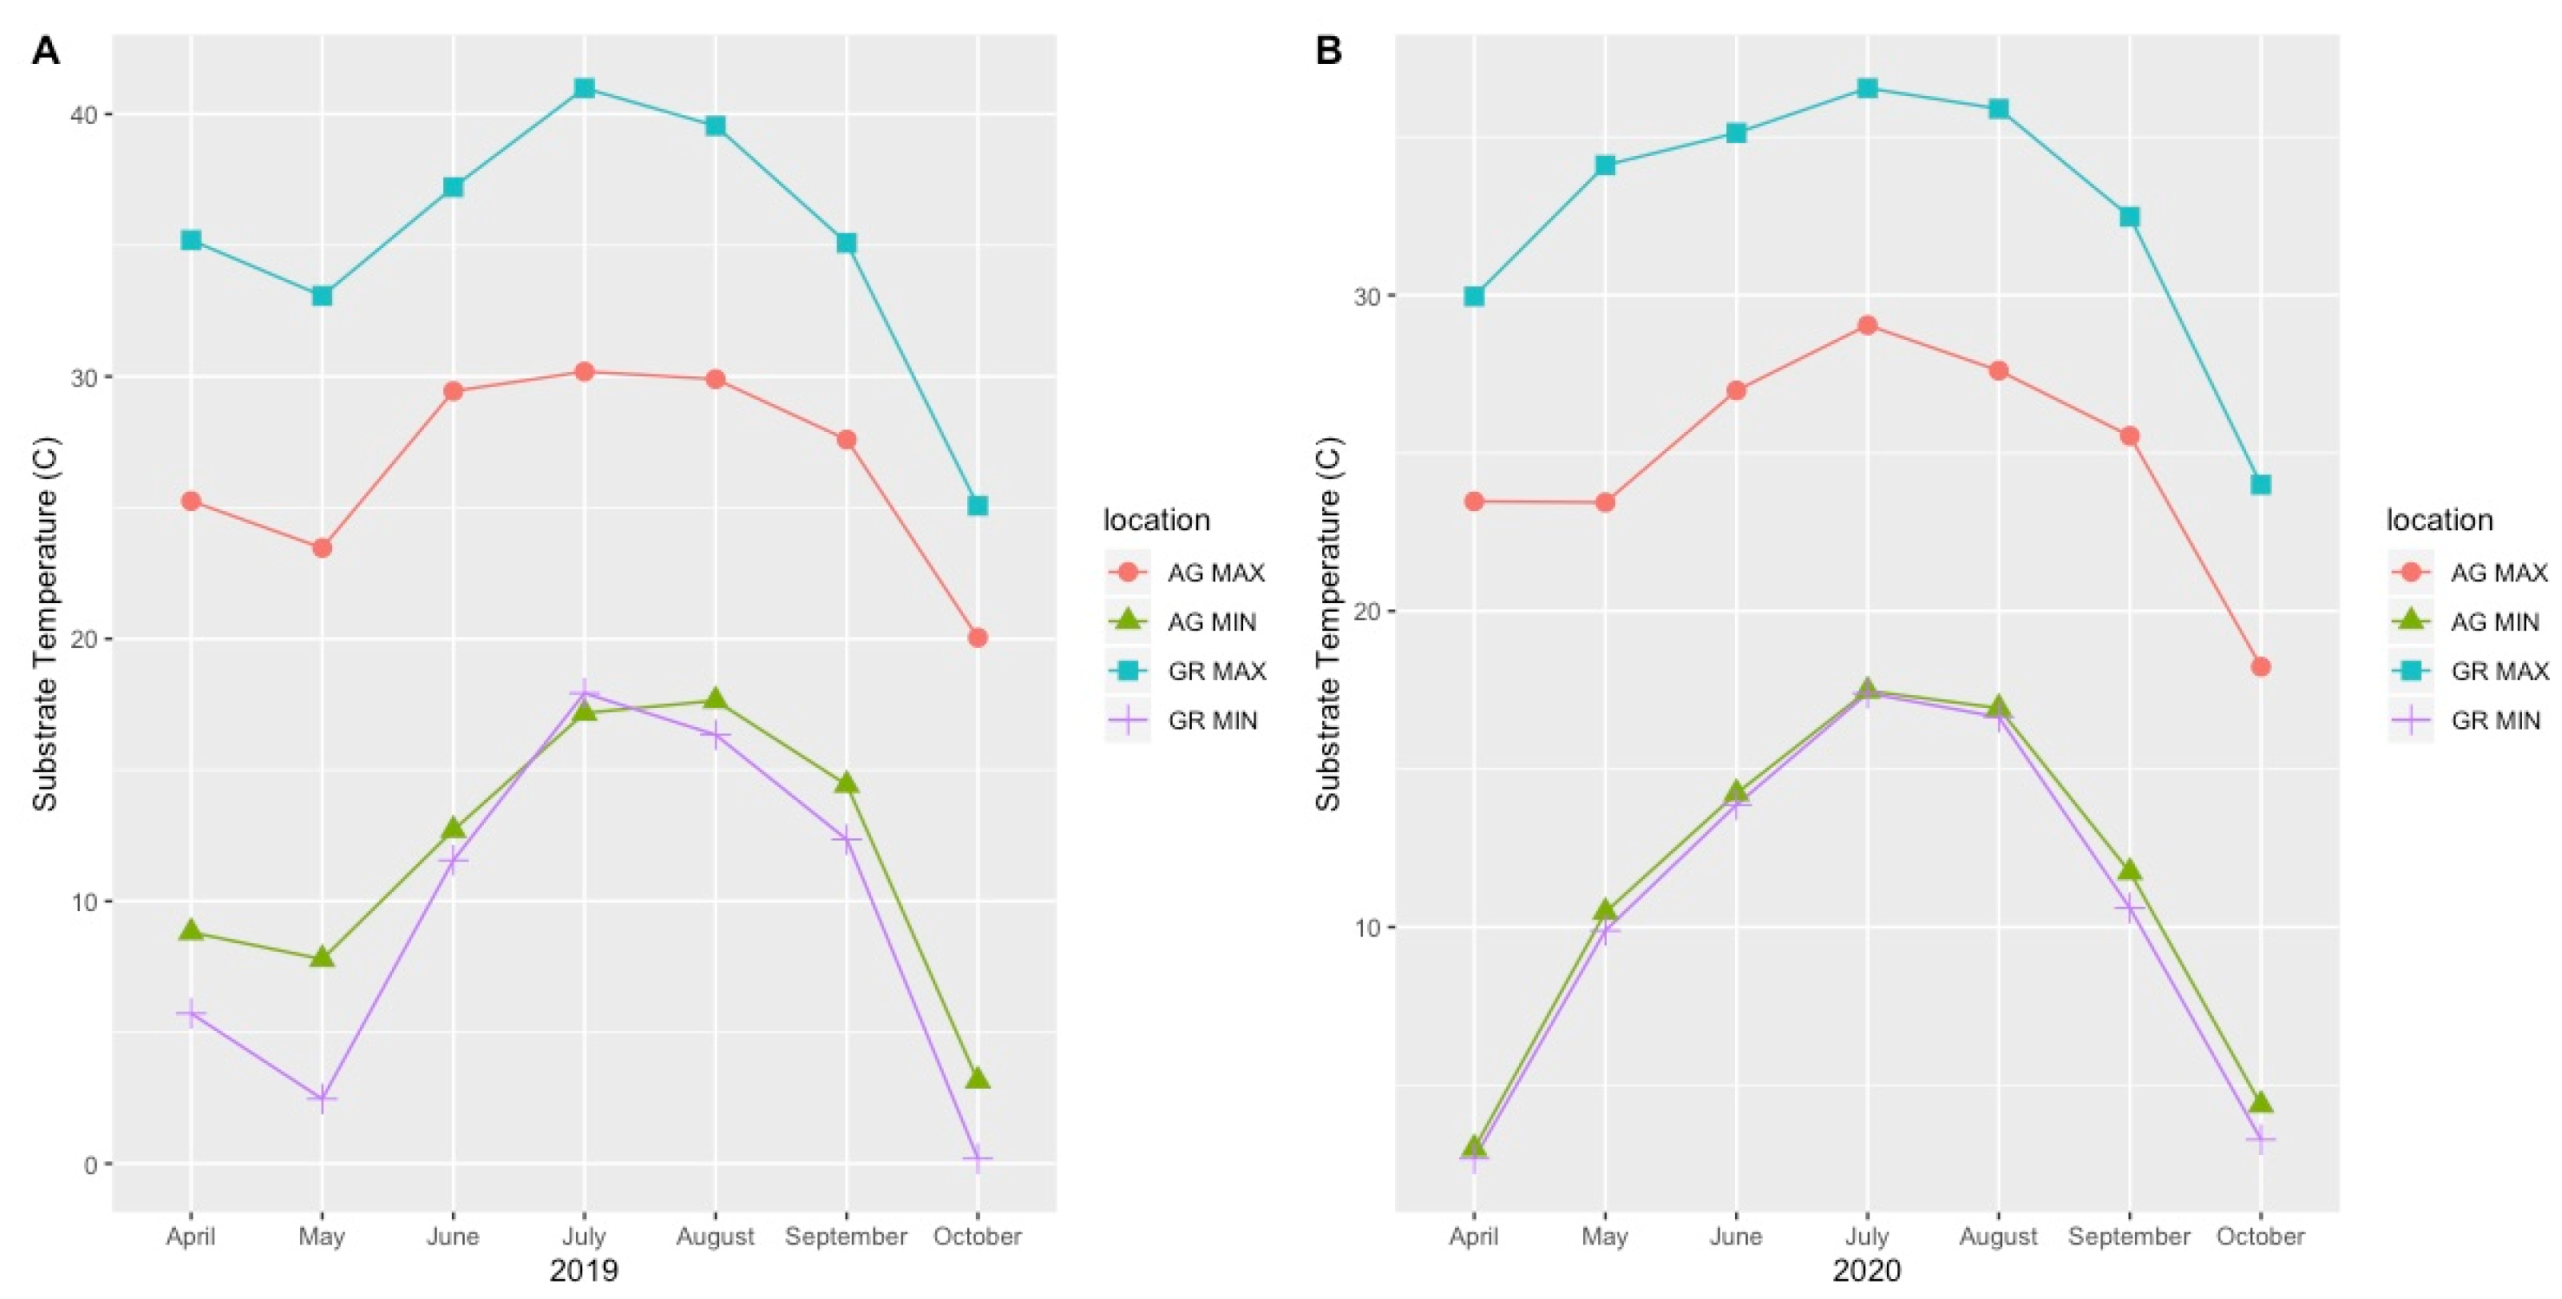
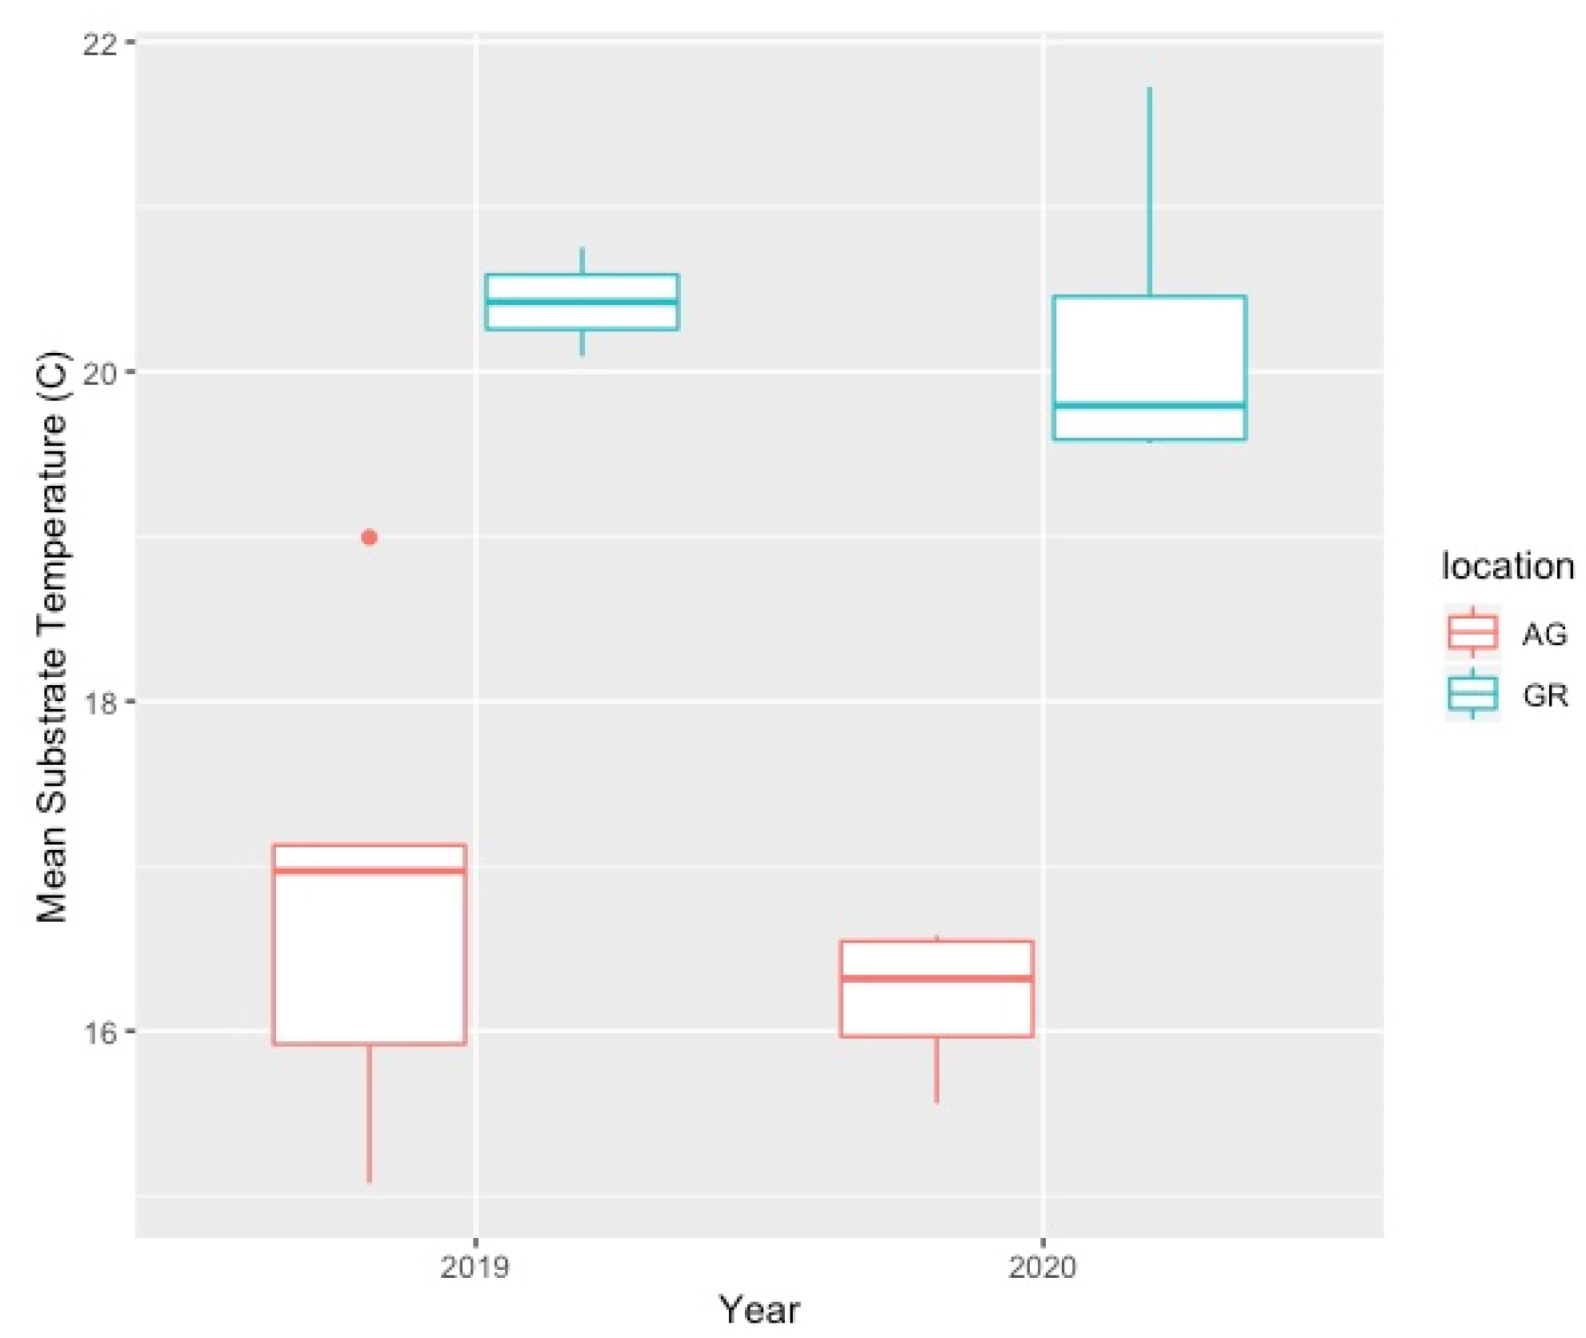
4.2. Variation in Abiotic Study Conditions
4.3. Implications for Pollinators and Sampling Considerations
5. Conclusions
Supplementary Materials
Author Contributions
Funding
Data Availability Statement
Conflicts of Interest
References
- Getter, K.L.; Rowe, D.B. The role of extensive green roofs in sustainable development. HortScience 2006, 41, 1276–1285. [Google Scholar] [CrossRef]
- Oberndorfer, E.; Lundholm, J.; Bass, B.; Coffman, R.R.; Doshi, H.; Dunnett, N.; Gaffin, S.; Köhler, M.; Liu, K.K.Y.; Rowe, B. Green roofs as urban ecosystems: Ecological structures, functions, and services. BioScience 2007, 57, 823–833. [Google Scholar] [CrossRef]
- Dvorak, B.; Bousselot, J. Theoretical Development of Ecoregional Green Roofs. In Ecoregional Green Roofs; Springer: Berlin/Heidelberg, Germany, 2021; pp. 41–79. [Google Scholar]
- Blaustein, L.; Kadas, G.J.; Gurevitch, J. Integrating ecology into green roof research. Isr. J. Ecol. Evol. 2016, 62, 1–6. [Google Scholar] [CrossRef]
- Rayner, J.P.; Farrell, C.; Raynor, K.J.; Murphy, S.M.; Williams, N.S.G. Plant establishment on a green roof under extreme hot and dry conditions: The importance of leaf succulence in plant selection. Urban For. Urban Green. 2016, 15, 6–14. [Google Scholar] [CrossRef]
- Schneider, A.; Fusco, M.; Bousselot, J. Observations on the survival of 112 plant taxa on a green roof in a semi-arid climate. J. Living Archit. 2014, 2, 10–30. [Google Scholar] [CrossRef]
- Schneider, A.; Landis, M.; Bousselot, J. Observations on the survival capacity of 118 plant taxa on a green roof in a semi-arid climate: 12 year update. J. Living Archit. 2021, 8, 19–40. [Google Scholar] [CrossRef]
- Thuring, C.E.; Berghage, R.D.; Beattie, D.J. Green Roof Plant Responses to Different Substrate Types and Depths under Various Drought Conditions. HortTechnology 2010, 20, 395–401. [Google Scholar] [CrossRef]
- Nektarios, P.A.; Ntoulas, N.; Nydrioti, E.; Kokkinou, I.; Bali, E.-M.; Amountzias, I. Drought stress response of Sedum sediforme grown in extensive green roof systems with different substrate types and depths. Sci. Hortic. 2015, 181, 52–61. [Google Scholar] [CrossRef]
- Greer, D.H.; Wünsche, J.N.; Norling, C.L.; Wiggins, H.N. Root-zone temperatures affect phenology of bud break, flower cluster development, shoot extension growth and gas exchange of ‘Braeburn’ (Malus domestica) apple trees. Tree Physiol. 2006, 26, 105–111. [Google Scholar] [CrossRef] [PubMed]
- Aronson, J.; Kigel, J.; Shmida, A.; Klein, J. Adaptive phenology of desert and Mediterranean populations of annual plants grown with and without water stress. Oecologia 1992, 89, 17–26. [Google Scholar] [CrossRef] [PubMed]
- Zhang, X.; Friedl, M.A.; Schaaf, C.B.; Strahler, A.H. Climate controls on vegetation phenological patterns in northern mid-and high latitudes inferred from MODIS data. Glob. Chang. Biol. 2004, 10, 1133–1145. [Google Scholar] [CrossRef]
- Abd El-Ghani, M.M. Phenology of ten common plant species in western Saudi Arabia. J. Arid Environ. 1997, 35, 673–683. [Google Scholar] [CrossRef]
- Friedel, M.H.; Nelson, D.J.; Sparrow, A.D.; Kinloch, J.E.; Maconochie, J.R. What induces central Australian arid zone trees and shrubs to flower and fruit? Aust. J. Bot. 1993, 41, 307–319. [Google Scholar] [CrossRef]
- Dunne, J.A.; Harte, J.; Taylor, K.J. Subalpine meadow flowering phenology responses to climate change: Integrating experimental and gradient methods. Ecol. Monogr. 2003, 73, 69–86. [Google Scholar] [CrossRef]
- Neil, K.; Wu, J. Effects of urbanization on plant flowering phenology: A review. Urban Ecosyst. 2006, 9, 243–257. [Google Scholar] [CrossRef]
- Lundholm, J.T.; Weddle, B.M.; MacIvor, J.S. Snow depth and vegetation type affect green roof thermal performance in winter. Energy Build. 2014, 84, 299–307. [Google Scholar] [CrossRef]
- Lundholm, J.T. Green roof plant species diversity improves ecosystem multifunctionality. J. Appl. Ecol. 2015, 52, 726–734. [Google Scholar] [CrossRef]
- Reyes, R.; Bustamante, W.; Gironás, J.; Pastén, P.A.; Rojas, V.; Suárez, F.; Vera, S.; Victorero, F.; Bonilla, C.A. Effect of substrate depth and roof layers on green roof temperature and water requirements in a semi-arid climate. Ecol. Eng. 2016, 97, 624–632. [Google Scholar] [CrossRef]
- Johnson, S.D.; Steiner, K.E. Generalization versus specialization in plant pollination systems. Trends Ecol. Evol. 2000, 15, 140–143. [Google Scholar] [CrossRef] [PubMed]
- Rafferty, N.E.; Ives, A.R. Effects of experimental shifts in flowering phenology on plant-pollinator interactions: Experimental shifts in flowering phenology. Ecol. Lett. 2011, 14, 69–74. [Google Scholar] [CrossRef]
- Thomson, J.D. Flowering phenology, fruiting success and progressive deterioration of pollination in an early-flowering geophyte. Philos. Trans. R. Soc. B Biol. Sci. 2010, 365, 3187–3199. [Google Scholar] [CrossRef]
- Ogilvie, J.E.; Griffin, S.R.; Gezon, Z.J.; Inouye, B.D.; Underwood, N.; Inouye, D.W.; Irwin, R.E. Interannual bumble bee abundance is driven by indirect climate effects on floral resource phenology. Ecol. Lett. 2017, 20, 1507–1515. [Google Scholar] [CrossRef]
- Potts, S.G.; Biesmeijer, J.C.; Kremen, C.; Neumann, P.; Schweiger, O.; Kunin, W.E. Global pollinator declines: Trends, impacts and drivers. Trends Ecol. Evol. 2010, 25, 345–353. [Google Scholar] [CrossRef]
- Bartomeus, I.; Ascher, J.S.; Wagner, D.; Danforth, B.N.; Colla, S.; Kornbluth, S.; Winfree, R. Climate-associated phenological advances in bee pollinators and bee-pollinated plants. Proc. Natl. Acad. Sci. USA 2011, 108, 20645–20649. [Google Scholar] [CrossRef] [PubMed]
- Fisogni, A.; Hautekèete, N.; Piquot, Y.; Brun, M.; Vanappelghem, C.; Ohlmann, M.; Franchomme, M.; Hinnewinkel, C.; Massol, F. Seasonal trajectories of plant-pollinator interaction networks differ following phenological mismatches along an urbanization gradient. Landsc. Urban Plan. 2022, 226, 104512. [Google Scholar] [CrossRef]
- Lundholm, J.; MacIvor, J.S.; MacDougall, Z.; Ranalli, M. Plant Species and Functional Group Combinations Affect Green Roof Ecosystem Functions. PLoS ONE 2010, 5, e9677. [Google Scholar] [CrossRef] [PubMed]
- Filazzola, A.; Shrestha, N.; MacIvor, J.S. The contribution of constructed green infrastructure to urban biodiversity: A synthesis and meta-analysis. J. Appl. Ecol. 2019, 56, 2131–2143. [Google Scholar] [CrossRef]
- Tonietto, R.; Fant, J.; Ascher, J.; Ellis, K.; Larkin, D. A comparison of bee communities of Chicago green roofs, parks and prairies. Landsc. Urban Plan. 2011, 103, 102–108. [Google Scholar] [CrossRef]
- Domínguez, M.V.S.; González, E.; Fabián, D.; Salvo, A.; Fenoglio, M.S. Arthropod diversity and ecological processes on green roofs in a semi-rural area of Argentina: Similarity to neighbor ground habitats and landscape effects. Landsc. Urban Plan. 2020, 199, 103816. [Google Scholar] [CrossRef]
- Colla, S.R.; Willis, E.; Packer, L. Can green roofs provide habitat for urban bees (Hymenoptera: Apidae)? Cities Environ. 2009, 2, 4. [Google Scholar] [CrossRef]
- US Department of Commerce. 2020 Annual Climate Summary. Available online: https://www.weather.gov/bou/2020AnnualClimateSummary (accessed on 1 April 2021).
- Smith, E.; Pattni, K.; Saladino, C.; Brown, W.E. The Urban Heat Island Effect in Nevada. 1-5. 2020. Available online: https://digitalscholarship.unlv.edu/bmw_lincy_env/1 (accessed on 1 April 2021).
- Mason, L.; Kondratieff, B.; Seshadri, A. Native Bee Watch: A Colorado Citizen Science Field Guide. Doctoral Dissertation, Colorado State University, Fort Collins, CO, USA, 2018. [Google Scholar]
- R Core Team. R: A Language and Environment for Statistical Computing; R Foundation for Statistical Computing: Vienna, Austria, 2022; Available online: https://www.R-project.org/ (accessed on 1 April 2021).
- Ruszkowski, K.M. Green Roof Effects on Floral Phenology and Floral Nectar Resources. Master’s Thesis, Colorado State University, Fort Collins, CO, USA, 2023. [Google Scholar]
- Grime, J.P. The C-S-R model of primary plant strategies—Origins, implications and tests. In Plant Evolutionary Biology; Gottlieb, L.D., Jain, S.K., Eds.; Springer: Dordrecht, The Netherlands, 1988; pp. 371–393. [Google Scholar] [CrossRef]
- Zhang, X.; Tarpley, D.; Sullivan, J.T. Diverse responses of vegetation phenology to a warming climate. Geophys. Res. Lett. 2007, 34, 207. [Google Scholar] [CrossRef]
- Kudo, G.; Ida, T.Y. Early onset of spring increases the phenological mismatch between plants and pollinators. Ecology 2013, 94, 2311–2320. [Google Scholar] [CrossRef] [PubMed]
- Ksiazek, K.; Tonietto, R.; Ascher, J.S. Ten bee species new to green roofs in the Chicago area. Great Lakes Entomol. 2014, 47, 13. [Google Scholar] [CrossRef]
- Pardee, G.L.; Philpott, S.M. Native plants are the bee’s knees: Local and landscape predictors of bee richness and abundance in backyard gardens. Urban Ecosyst. 2014, 17, 641–659. [Google Scholar] [CrossRef]
- CoCoRaHS. Community Collaborative Rain, Hail & Snow Network. Available online: https://www.cocorahs.org/ (accessed on 1 April 2021).


| Scientific Name | Species Code | Common Name | Growth Form | Family | Provenance | Bloom Time |
|---|---|---|---|---|---|---|
| Allium ‘Millenium’ | ALMI | Ornamental Onion | Forb | Liliaceae | Eurasia | Mid |
| Chrysothamnus nauseosus ssp. nauseosus | CHNA | Baby Blue Rabbitbrush | Shrub | Asteraceae | US (CO) | Late |
| Dianthus plumarius | DIPL | Feather Pinks | Forb | Caryophyllaceae | Europe | Early/Mid |
| Echium russicum/amoenum | ECRU | Red Feathers | Forb | Boraginaceae | Eurasia | Early/Mid |
| Eriogonum jamesii | ERJA | James’ Buckwheat | Forb | Polygonaceae | US (CO) | Mid |
| Geum triflorum | GETR | Prairie Smoke | Forb | Rosaceae | US (CO) | Early |
| Ipomopsis aggregata | IPAG | Scarlet Gilia | Forb (biennial) | Polemoniaceae | US (SW) | Mid/Late |
| Liatris spictata | LISP | Blazing Star | Forb | Asteraceae | US | Mid |
| Penstemon pinifolius | PEPI | Pineleaf penstemon | Subshrub | Plantaginaceae | US (SW) | Mid |
| Penstemon strictus | PEST | Rocky Mountain Penstemon | Forb | Plantaginaceae | US (CO) | Mid |
| Dasiphora fruticosa | DIFR | Shrubby cinquefoil | Shrub | Rosaceae | US (CO) | Early/Mid |
| Pulsatilla vulgaris | PUVU | Pasqueflower | Forb | Ranunculaceae | Eurasia | Early |
| Salvia cyanescens | SACY | Turkish Sage | Forb | Lamiaceae | Eurasia | Mid |
| Teucrium cossonii | TECO | Fruity germander | Subshrub | Lamiaceae | Eurasia | Late |
| Thymus serphyllum ‘Pink Chintz’ | THSE | Ornamental Thyme | Creeping Forb | Lamiaceae | Eurasia | Early/Mid |
| Location | pH | EC (mmhos/cm) | NO3 (ppm) | P (ppm) | K (ppm) | % OM | % Sand | % Silt | % Clay | Texture Class |
|---|---|---|---|---|---|---|---|---|---|---|
| AG1 | 7.4 | 0.9 | 15.3 | 22 | 95 | 3.4 | 82 | 3 | 15 | Sandy Loam |
| AG2 | 7.5 | 0.9 | 3.4 | 38 | 234 | 4.9 | 62 | 20 | 18 | Sandy Loam |
| AG3 | 7.5 | 0.9 | 41.1 | 62 | 331 | 8.0 | 69 | 13 | 18 | Sandy Loam |
| AG4 | 7.7 | 0.9 | 22.6 | 83 | 556 | 8.4 | 67 | 15 | 18 | Sandy Loam |
| AG5 | 7.6 | 0.9 | 5.7 | 59 | 352 | 6.0 | 67 | 10 | 23 | Sandy Loam |
| AG6/7 | 7.5 | 0.8 | 22.4 | 48 | 147 | 4.0 | 72 | 10 | 18 | Sandy Loam |
| GR1 | 7.8 | 1.0 | 12.9 | 64 | 125 | 5.1 | 70 | 13 | 18 | Sandy Loam |
| GR2 | 7.9 | 0.8 | 5.0 | 38 | 119 | 8.6 | N/A | N/A | N/A | N/A |
| Species | Year | First Flowering Date (GR) | First Flowering Date (AG) | Mean Flowering Advance (AG-GR, Days) | Max Flower Number (GR) | Max Flower Number (AG) | Flowering Duration GR (Days) | Flowering Duration AG (Days) |
|---|---|---|---|---|---|---|---|---|
| ECRU | 2019 | 11-Jun | 12-Jun | 1.8 | 70.6 | 73.6 | 17.6 | 27.8 |
| LISP | 2019 | 25-Jul | 3-Aug | 9.2 | 725.8 | 715.8 | 10.0 | 12.8 |
| PEPI | 2019 | 12-Jun | 27-Jun | 15 | 78.6 | 151.4 | 50.0 | 54.0 |
| PEST | 2019 | 10-Jun | 11-Jun | 1 | 82.4 | 158.6 | 23.6 | 32.8 |
| SAAR | 2019 | 15-Jun | 12-Jun | −2.4 | 216.2 | 133.8 | 12.2 | 20.2 |
| TECO | 2019 | 28-Jun | 11-Jul | 12.8 | 295.4 | 493.6 | 90.8 | 78.0 |
| ALMI | 2020 | 21-Jul | 30-Jul | 9.4 | 145.4 | 55.0 | 29.0 | 22.4 |
| CHNA | 2020 | 10-Sep | 25-Sep | 14.4 | 2063.3 | 2223.9 | * | * |
| DIFR | 2020 | 2-May | 3-Jun | 32.7 | 8.9 | 12.3 | 107.3 | 19.8 |
| DIPL | 2020 | 22-May | 26-May | 4.2 | 12.9 | 49.7 | 30.4 | 99.4 |
| ECRU | 2020 | 19-May | 23-May | 3 | 21.3 | 38.3 | 19.6 | 24.8 |
| ERJA | 2020 | 16-Jul | 23-Jul | 7 | 624.0 | 1075.1 | 121.4 | 73.6 |
| GETR | 2020 | 1-Apr | 4-Apr | 4.2 | 11.0 | 12.0 | 33.2 | 24.8 |
| IPAG | 2020 | 30-Jun | 14-Jul | 12.6 | 19.7 | 33.1 | 22.0 | 111.0 |
| LISP | 2020 | 14-Jul | 23-Jul | 8.4 | 749.9 | 134.5 | 26.2 | 35.0 |
| PEPI | 2020 | 28-May | 28-May | 0 | 55.5 | 115.4 | 43.0 | 45.8 |
| PEST | 2020 | 22-May | 3-Jun | 16.4 | 18.2 | 10.6 | 23.0 | 32.0 |
| PUVU | 2020 | 19-Mar | 27-Mar | 11.2 | 9.9 | 3.5 | 47.2 | 72.2 |
| SACY | 2020 | 12-Jun | 23-Jun | 13 | 44.6 | 12.4 | 35.0 | 74.8 |
| TECO | 2020 | 9-Jun | 15-Jun | 5.8 | 160.1 | 121.3 | 112.6 | 53.0 |
| THSE | 2020 | 21-May | 2-Jun | 15 | 213.9 | 400.0 | 64.0 | 36.0 |
| Year | Apr | May | Jun | Jul | Aug | Sep | Oct | Avg Temp | Max Temp | Min Temp | |
|---|---|---|---|---|---|---|---|---|---|---|---|
| AG | 2019 | 15.65 | 14.67 | 19.51 | 22.78 | 22.63 | 19.85 | 10.26 | 16.82 | 30.03 | 3.65 |
| GR | 2019 | 19.39 | 15.22 | 22.65 | 27.47 | 25.93 | 22.36 | 9.93 | 20.42 | 40.99 | 0.19 |
| AG | 2020 | 10.69 | 16.15 | 19.15 | 21.80 | 21.96 | 17.65 | 11.35 | 16.97 | 27.84 | 2.86 |
| GR | 2020 | 14.87 | 20.91 | 23.55 | 25.25 | 24.99 | 18.17 | 11.04 | 20.23 | 36.91 | 1.12 |
| Honey Bee | Bumble Bee | Hairy Leg Bee | Green Metallic Bee | Striped Sweat Bee | Tiny Dark Bee | Hairy Belly Bee | Cuckoo Bee | Fly | Beetle | Wasp | Total Pollinator | Native Bees | Other Pollinators | ||||||||||||||
|---|---|---|---|---|---|---|---|---|---|---|---|---|---|---|---|---|---|---|---|---|---|---|---|---|---|---|---|
| AG | GR | AG | GR | AG | GR | AG | GR | AG | GR | AG | GR | AG | GR | AG | GR | AG | GR | AG | GR | AG | GR | AG | GR | AG | GR | AG | GR |
| 98 | 189 | 6 | 5 | 2 | 1 | 4 | 2 | 15 | 16 | 6 | 0 | 13 | 5 | 0 | 0 | 27 | 49 | 1 | 0 | 25 | 3 | 197 | 270 | 46 | 29 | 53 | 52 |
| Honey Bee | Bumble Bee | Hairy Leg Bee | Green Metallic Bee | Striped Sweat Bee | Tiny Dark Bee | Hairy Belly Bee | Cuckoo Bee | Fly | Beetle | Wasp | Total Pollinator | Native Bees | Other Pollinator | ||||||||||||||
|---|---|---|---|---|---|---|---|---|---|---|---|---|---|---|---|---|---|---|---|---|---|---|---|---|---|---|---|
| AG | GR | AG | GR | AG | GR | AG | GR | AG | GR | AG | GR | AG | GR | AG | GR | AG | GR | AG | GR | AG | GR | AG | GR | AG | GR | AG | GR |
| 400 | 556 | 8 | 25 | 3 | 4 | 0 | 10 | 61 | 72 | 9 | 8 | 0 | 22 | 3 | 7 | 39 | 82 | 0 | 1 | 10 | 8 | 533 | 795 | 84 | 148 | 49 | 91 |
Disclaimer/Publisher’s Note: The statements, opinions and data contained in all publications are solely those of the individual author(s) and contributor(s) and not of MDPI and/or the editor(s). MDPI and/or the editor(s) disclaim responsibility for any injury to people or property resulting from any ideas, methods, instructions or products referred to in the content. |
© 2024 by the authors. Licensee MDPI, Basel, Switzerland. This article is an open access article distributed under the terms and conditions of the Creative Commons Attribution (CC BY) license (https://creativecommons.org/licenses/by/4.0/).
Share and Cite
Guidi, M.; Bousselot, J. Earlier Flowering Phenology and Pollinator Visitation on Urban Green Roofs Compared to Ground-Level Gardens. Land 2024, 13, 178. https://doi.org/10.3390/land13020178
Guidi M, Bousselot J. Earlier Flowering Phenology and Pollinator Visitation on Urban Green Roofs Compared to Ground-Level Gardens. Land. 2024; 13(2):178. https://doi.org/10.3390/land13020178
Chicago/Turabian StyleGuidi, Michael, and Jennifer Bousselot. 2024. "Earlier Flowering Phenology and Pollinator Visitation on Urban Green Roofs Compared to Ground-Level Gardens" Land 13, no. 2: 178. https://doi.org/10.3390/land13020178
APA StyleGuidi, M., & Bousselot, J. (2024). Earlier Flowering Phenology and Pollinator Visitation on Urban Green Roofs Compared to Ground-Level Gardens. Land, 13(2), 178. https://doi.org/10.3390/land13020178