Abstract
This study conducts an empirical investigation into the decarbonization effects of urban polycentric structures, exploring their mechanisms and varied influences. Our findings reveal key insights. First, urban polycentric structures effectively reduce carbon emission intensity, a conclusion supported by robust tests and endogeneity analysis. Second, our analysis shows that polycentric structures significantly alleviate downtown overcrowding, reducing carbon emission intensity. These structures also impact carbon emissions through factors like labor allocation across industries and the entry of high-productivity enterprises. Third, our analysis shows that the impact of the polycentric structure on carbon emission intensity follows a ‘U-shaped’ pattern. In this ‘U-shaped’ pattern, the growth of an urban population scale can offset the potential negative impacts of this structure. Finally, government support, urban transportation networks, and communication technologies are crucial in enhancing the effectiveness of polycentric decarbonization. Our research contributes to the literature on polycentric structures and carbon emissions and offers policy implications for addressing climate change, applicable not only to China but also to other economies.
1. Introduction
With globalization and economic growth, China has achieved remarkable urbanization, reaching a 65.22% urbanization rate by 2022. In the rapid urbanization process, Chinese cities, including Beijing, Shanghai, Guangzhou, Shenzhen, Chengdu, and Zhengzhou, have adopted polycentric development to cope with continuous urban space expansion. This approach aids in rational urban land and resource use [1].
Despite the positive aspects of polycentric development, the concentration of population, industry, and commerce in cities makes them significant sources of energy consumption and carbon emissions. The expansion and operation of cities have a profound impact on energy use and carbon emissions. To address climate change and reduce global greenhouse gas emissions, rigorous empirical research is essential to validate the decarbonization effects of the polycentric structure. This is particularly crucial in a rapidly urbanizing country like China, where understanding how the polycentric structure affects carbon emissions is vital for guiding future urban development.
Urban spatial structure, as defined by Anas et al. [2], is the degree of the spatial concentration of urban population and employment, while Anderson et al. [3] describe it as the spatial distribution pattern of human activities. In the early stages of urban spatial structure research, the monocentric structure model, based on Alonso’s spatial equilibrium theory [4,5,6], was a key theoretical starting point. However, with ongoing urban development, this model lost its ability to explain modern urban phenomena, leading to the development of polycentric structure models. Scholars such as Sullivan [7], Wieand [8], Sasaki [9], Fujita et al. [10], and White [11] made significant contributions to polycentric theory, and empirical studies on urban polycentric identification emerged, including case analyses of cities like Los Angeles [12], Chicago [13], and Houston [14]. Despite significant progress in describing modern urban spatial structures, there is no consensus on whether polycentric structures are superior to monocentric ones [15,16,17,18].
The debate on the impact of polycentric structures on carbon emissions features two opposing views. Some studies, such as Veneri and Burgalassi’s research on Italy’s NUTS-2 areas [19], show polycentric cities can shorten commutes and improve transportation, thereby reducing emissions. Faludi [20] argues polycentric structures offer advantages over monocentric ones, such as larger labor markets and diverse services, while also addressing problems like pollution and congestion. Similarly, Zhu et al. [21] suggest that polycentric development limits urban sprawl and encourages efficient land use, leading to lower emissions. Conversely, some studies suggest that polycentric structures could increase emissions. They argue that, despite reduced traffic congestion, these structures might result in longer commutes and greater urban sprawl, thus increasing emissions. For instance, Feng et al. [22] argue this results in longer transportation distances and more energy consumption. Burgalassi’s study in Italy’s NUTS-3 areas found an increase in residential heating and transportation emissions due to polycentric structures [23]. Additionally, Gordon and Richardson [24] critically analyze polycentric and dispersed urban structures in Los Angeles, noting their efficiencies and challenges, such as urban sprawl. Their study indirectly suggests these patterns could impact carbon emissions, though this is not the main focus.
In summary, there is significant disagreement in assessing the impact of polycentric structures on carbon emissions, stemming from different assumptions, methods, and study areas. This study contributes by delving into the relationship between urban polycentric structures and carbon emission intensity, providing a robust basis for understanding their decarbonization effects. Additionally, it explores the non-linear impacts of polycentric structures on carbon emissions and the moderating role of external environmental factors, offering valuable insights for cities to select the most appropriate spatial development models tailored to their unique conditions.
2. Theoretical Analysis
The urban polycentric structure signifies a shift from the traditional single-core urban model to a more dispersed form of urban development with multiple activity centers. We explore the impact mechanisms of this polycentric structure on carbon emission intensity from three perspectives.
Firstly, polycentric structures can provide orderly relief from overcrowding in downtown areas. In cities like Beijing and Shanghai, overcrowding is a serious issue due to an unbalanced population and industry distribution1. While a moderate level of downtown agglomeration can lower carbon emission intensity, too much agglomeration has the opposite effect. On one hand, a high concentration of employment in downtown areas creates an imbalance between jobs and housing. This imbalance leads to increased private car usage, resulting in higher traffic carbon emissions [25]. On the other hand, excessive downtown agglomeration also increases household carbon emissions. Dense building structures in downtown areas amplify the urban-heat island effect, which in turn increases the use of energy-intensive cooling equipment in homes [26]. In contrast, polycentric structures with employment sub-centers promote a balance between jobs and housing. This balance helps shorten commuting times and distances for private cars, thereby reducing traffic carbon emissions. Additionally, polycentric cities often include low-density built-up areas between centers. This design improves air circulation inside and outside the city, effectively mitigating the urban-heat island effect and reducing household carbon emissions.
Polycentric structures, compared to monocentric cities, offer more efficient inter-industry labor allocation. In monocentric cities, high costs associated with labor mobility, such as expensive housing and lengthy commutes, often outweigh the advantages of increased wages [27,28]. This discourages agricultural labor from relocating to urban industries, subsequently increasing labor costs in these urban sectors. As a result, urban industries tend to favor the use of energy over manual labor [29]. Experts such as Lin and Du [30] observe that this trend challenges the reduction of energy intensity in China. Similarly, Yuan [31] agrees with identifying it as a major contributor to the country’s increasing energy demand. In contrast, polycentric cities with several urban centers make it easier for agricultural labor to move, drawing more labor into manufacturing and service industries [32]. This transition may lead to lower carbon emissions due to reduced energy reliance. Concurrently, it might also lead to increased emissions in agriculture, as this sector moves from traditional labor-based practices to more energy-intensive methods. Significantly, since the manufacturing and service sectors contribute a larger share to the national GDP than agriculture, moving labor to these sectors could result in an overall reduction in carbon emission intensity.
Thirdly, polycentric structures effectively attract high-productivity enterprises to enter. Despite the differences in the construction quality of sub-centers across Chinese cities, many sub-centers have achieved remarkable success. For instance, Shanghai’s Pudong New Area is not only a financial hub but also a gathering place for high-tech industries. Meanwhile, Hangzhou’s Binjiang District, as a high-tech industrial development area, plays a crucial role in building the future Science City. These sub-centers benefit from specialized clustering. This leads to benefits like innovation, resource sharing, and better job opportunities [33]. However, this development also leads to increased costs for labor and land. As a result, a competitive environment emerges, favoring high-productivity enterprises that often have lower emissions. This competitive environment makes it hard for low-productive enterprises to enter the local market. Additionally, local governments provide incentives like fiscal subsidies and land provisions to attract high-productivity enterprises. They may also create barriers for low-productivity enterprises, reinforcing a market environment where high-productivity enterprises predominate. Thus, this focus on high-productivity enterprises helps reduce carbon emissions.
3. Empirical Strategy and Data
3.1. Empirical Strategy
The following sets the baseline regression model.
In this model, i represents the city, and t represents the year. Ciit stands for the carbon emission intensity for city i in year t, while lnPolyit stands for urban polycentric degree in the same context. Xkit is the kth control variable in the ith city. Β, γK is the estimated parameters, respectively, and C is a constant term. The model also includes μt and ϑi, which are the fixed effects for time and individual city, respectively. Lastly, εit denotes the error term in the model.
3.2. The Indicator Description and Data Source
3.2.1. Urban Polycentric Structures
The polycentric structure generally includes two types: morphological polycentric and functional polycentric [34,35]. From the perspective of morphological polycentric, this study measures the degree of urban polycentric structures in two steps using intra-city population distribution.
First, this study identifies urban centers using Arcgis10.8 software. Based on the Landscan population spatial distribution data, we only retain rasters with a population density of at least 1500 people per square kilometer. Then, we select the rasters with the top 5% population density. In Beijing, Shanghai, Guangzhou, Shenzhen, and Tianjin, we choose the top 10%. The next step is the fusion of adjacent rasters. An area qualifies as an urban center if it has a total population exceeding 100,000 and includes at least two rasters [36,37,38].
Second, this study quantifies the degree of urban polycentric structure. We build the center equilibrium index (Poly) based on the identification results of urban centers from the previous step [34].
Here, Poly represents the degree of urban polycentric structure. δobs measures the standard deviation of the importance of urban centers, essentially their population sizes. δmax describes the standard deviation between the population of the most significant center and zero. The range of Poly is between zero and one, where values closer to one indicate a higher degree of urban polycentric structure.
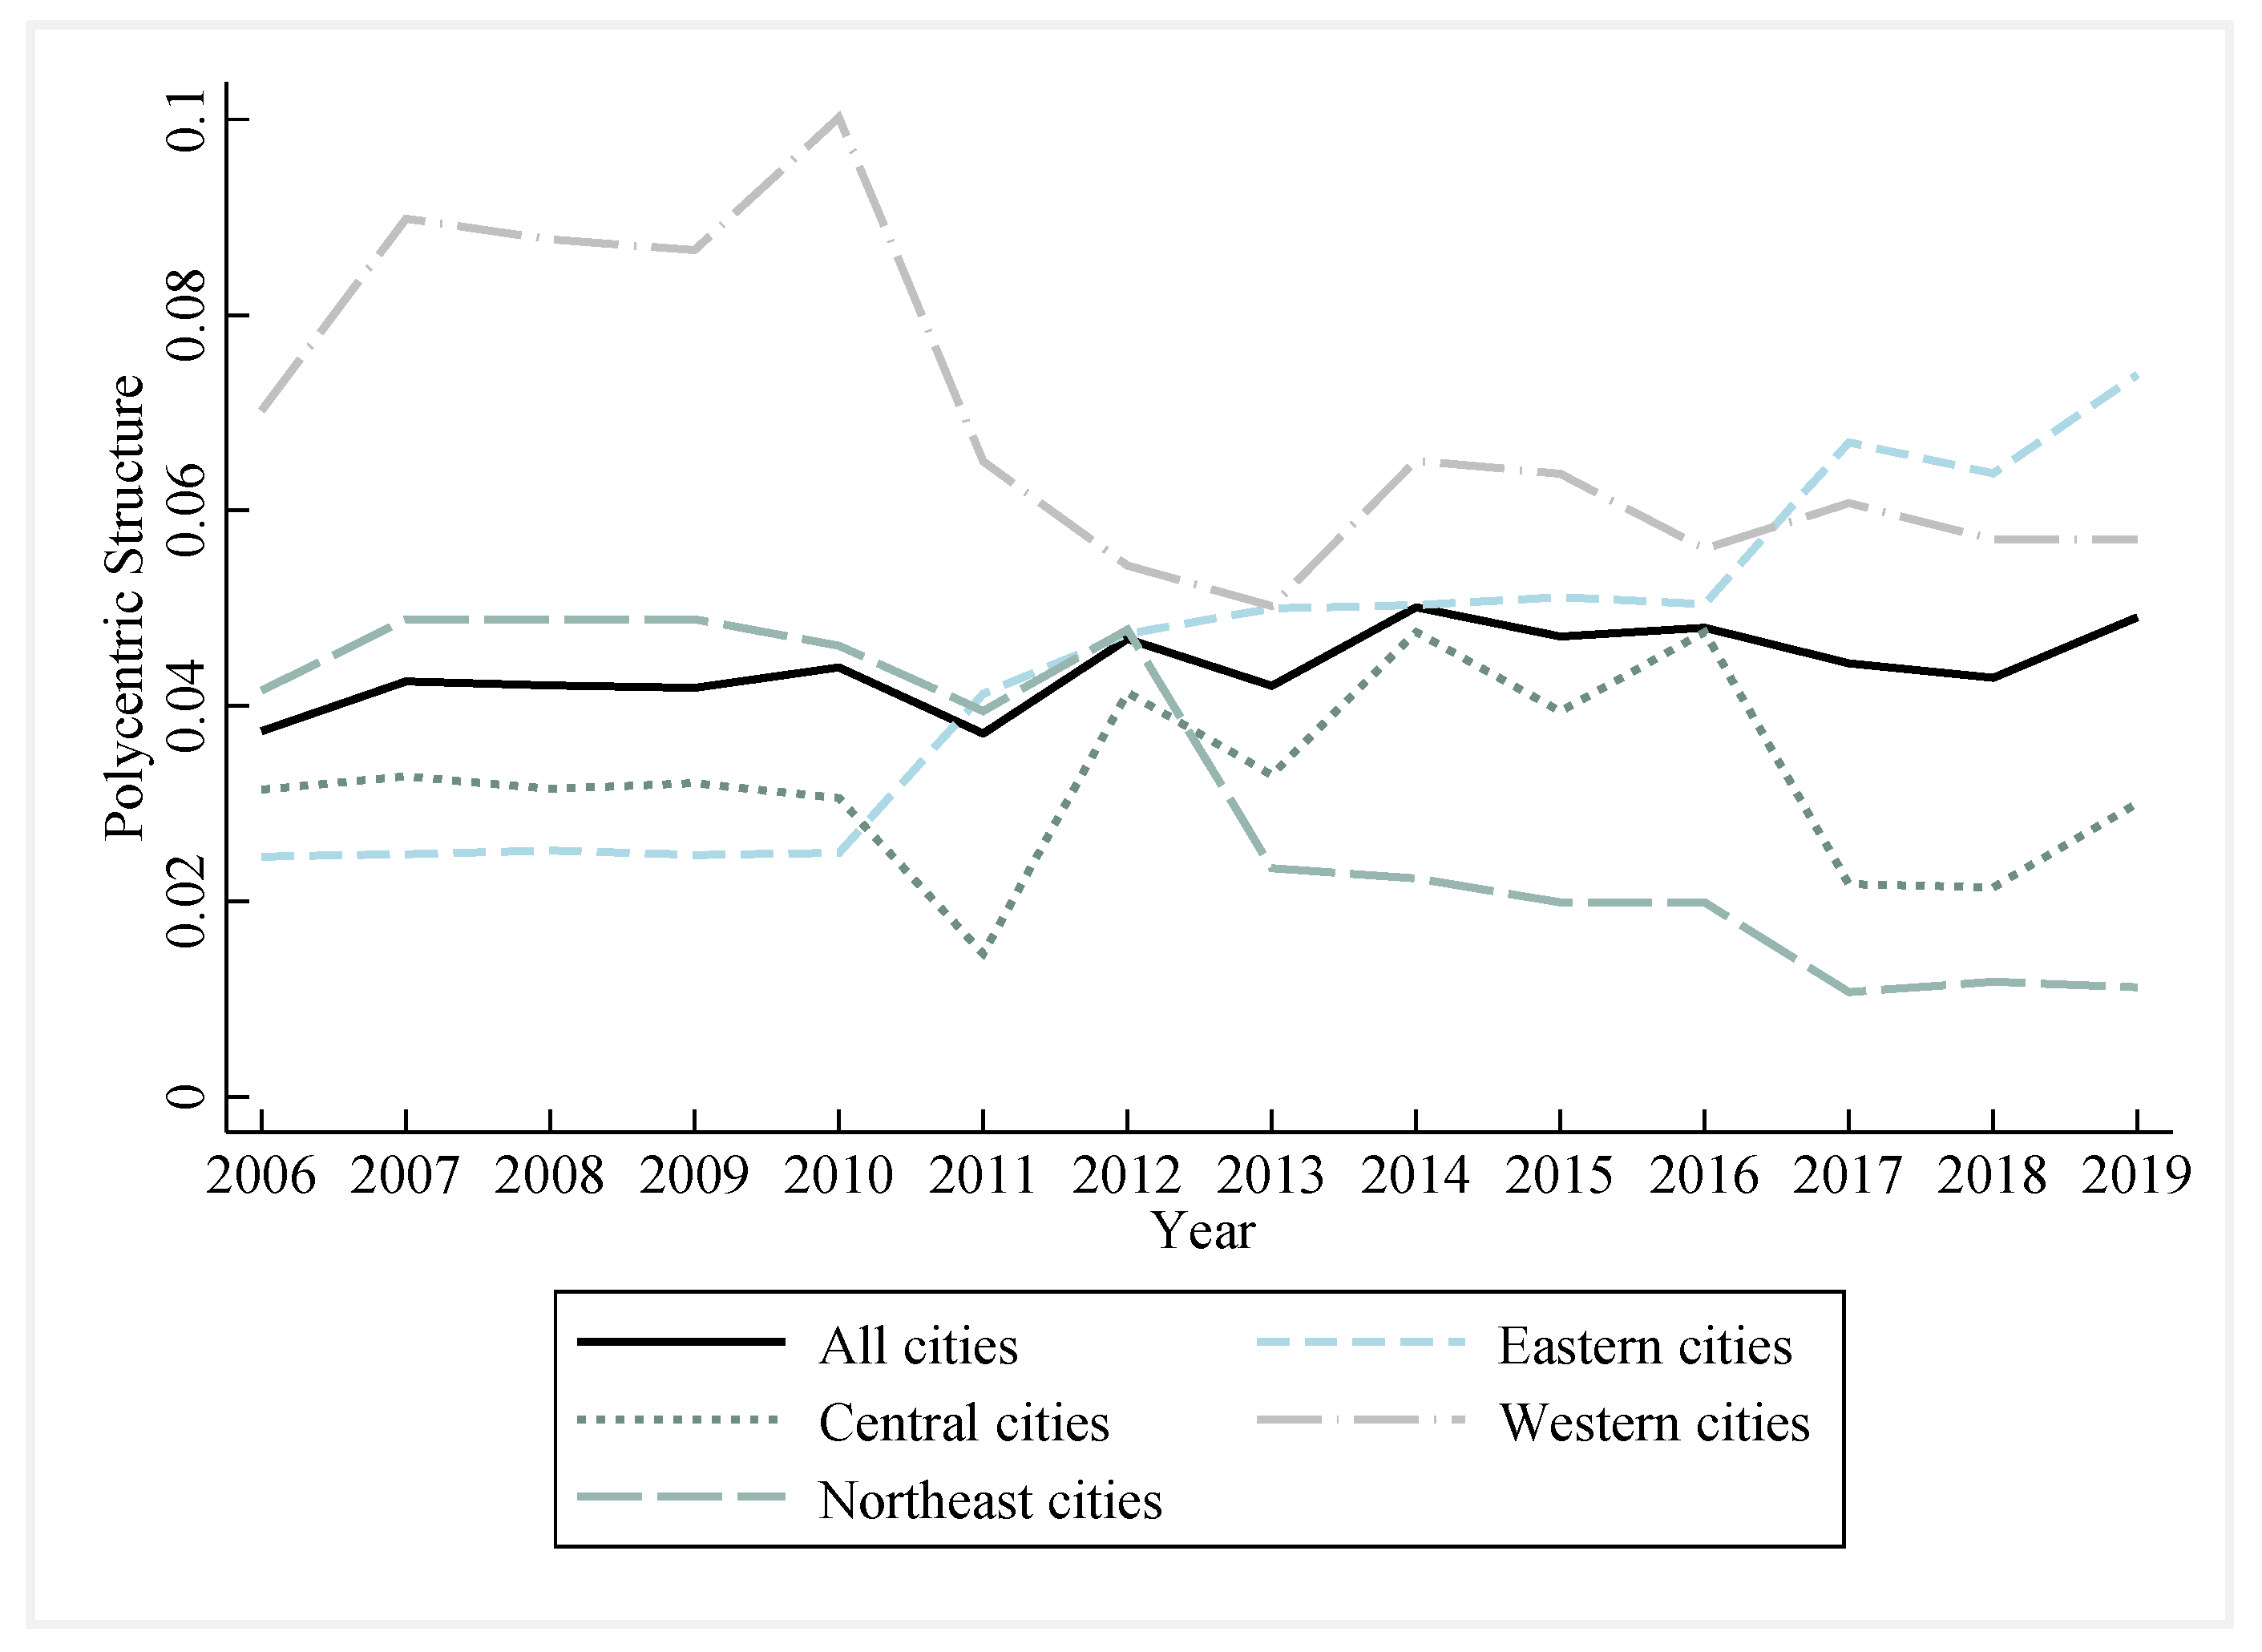
Figure 1 illustrates the evolutionary trend of polycentric structures. Generally, there has been a stable growth in the degree of the polycentric structure, averaging an annual growth rate of about 2.1% from 2006 to 2019. However, significant regional differences are evident. From 2006 to 2019, the polycentric structure levels ranked from highest to lowest were: western, eastern, central, and northeastern cities. Notably, the degree of the polycentric structure in western cities is about twice that of central and northeastern cities.
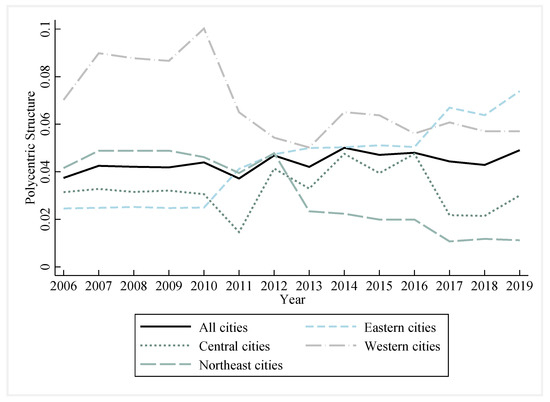
Figure 1.
The evolutionary trend of polycentric structures.
This trend is partly due to geographical factors. Western cities, mostly situated in plateau and hilly areas, have evolved naturally towards a polycentric development model, influenced by their unique geographical characteristics. In contrast, central and northeastern cities, primarily located in plains, tend to favor a single-centric ‘pancake-style’ sprawl due to lower urban expansion costs.
Regarding the rate of change, the degree of the polycentric structure in eastern cities is on the rise and that in central cities remains stable, while western and northeastern cities show a downward trend. The average annual rates of change for these regions are 8.8%, −0.03%, −1.6%, and −3.1%, respectively. While eastern cities show a rising trend in polycentric structures, supported by their economic strength and population inflow, western and northeastern cities face a decline, largely due to population loss and less favorable locational advantages.
3.2.2. Carbon Emission Intensity
The carbon emission intensity (Ci) is the ratio of carbon dioxide emissions to GDP. Carbon dioxide emissions are the sum of carbon emissions generated by liquefied petroleum gas, coal gas, natural gas, power supply, and heating [39]. (1) We directly derived the carbon emissions of liquefied petroleum gas, natural gas, and coal gas from their respective consumption and carbon emission coefficients. (2) We calculated the carbon emissions from power supply by using the electric energy consumption of each city and the baseline emission coefficient of its region (such as North China, Northeast China, East China, Central China, Northwest China, and South China) for each year. (3) Urban heating primarily involves steam and hot water, mostly using raw coal as the raw material. Based on the minimum standard for the thermal efficiency of coal-fired industrial boilers (between 65% and 78%) specified in GB/T15317-2009 Monitoring on Energy Conservation of Coal-fired Industrial Boilers, we assumed an average thermal efficiency of 70% for the 2006–2019 period. We also set the average low calorific value of raw coal at 20,908 kilojoules/kg. We then calculated the consumption of raw coal through the heat supply, thermal efficiency, and raw coal calorific value coefficient. Finally, by considering the raw coal consumption and its carbon emission coefficient, we calculated the carbon emissions from heating.
3.2.3. Control Variable
To avoid serious omitted variable bias, we controlled the relevant influencing factors as much as possible. We selected seven control variables [40,41]: the number of urban residents, GDP per capita, the proportion of fixed asset investment to GDP, the proportion of the non-agricultural population, the proportion of added value of the secondary industry to GDP, the proportion of foreign direct investment to GDP, and the proportion of science and technology expenditure to GDP. They were used to measure the urban scale (Scale), economic development level (Rgdp), investment intensity (Tz), urbanization rate (Urb), industrial structure (Is), foreign investment intensity (Fdi), and scientific research investment (Tech), respectively.
3.2.4. Data Sources
Our study subjects were 214 cities at the prefecture level and above in China, covering the period from 2006 to 2019. During the research period, some cities consistently maintained a non-centric or single-centric spatial structure, leading to insufficient variation in their key explanatory variables. Therefore, this study does not include such cities. The research area, as shown in Figure 2, includes 74 eastern cities, 70 central cities, 44 western cities, and 26 north-eastern cities.
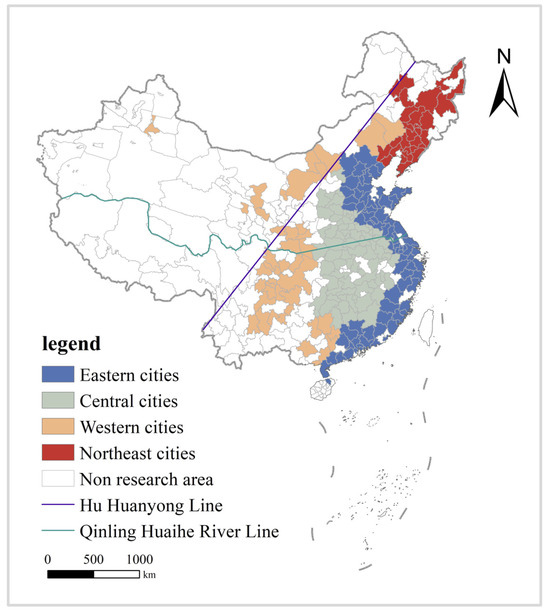
Figure 2.
Research area.
The data originates from the following sources. The population distribution data comes from the LandScan global population distribution raster database, released by the Oak Ridge Laboratory of the United States. The carbon dioxide emission coefficient follows the guidelines from the National Development and Reform Commission’s 2011 ‘Guidelines for the Preparation of Provincial Greenhouse Gas Inventories. The energy consumption and control variable data come mainly from the Statistical Yearbook of Chinese Cities, the Statistical Yearbook of Chinese Energy, and the EPS database. The study deflates the nominal data of all variables involving value forms using relevant indices with 2006 as the base period. Table 1 presents the descriptive statistics of these variables.

Table 1.
Descriptive statistics of the main variables.
4. Empirical Results
4.1. Baseline Regression and the Endogenous Analysis
Table 2 presents the regression results for the impact of urban polycentric structures on carbon emission intensity. In Column (1), the coefficient of lnPoly, calculated without any control variables, is −0.184 and is significant at the 5% level. When we add a series of control variables in columns (2) to (8), lnPoly’s coefficients remain negative, and their absolute values tend to decrease. This trend suggests a cleaner polycentric effect on reducing carbon emissions after removing the impact of other variables. In summary, enhancing the degree of urban polycentric structures helps reduce carbon emission intensity.
Table 2.
Baseline regression and endogenous analysis results.
Considering that the above regression results may be influenced by endogeneity issues, we used the instrumental variable method to mitigate this problem. We used terrain slope as an instrumental variable for the urban polycentric structure2. The rationale is that terrain slope, as a geographical condition, generally does not directly affect carbon emission intensity, thus satisfying the exogeneity conditions well. Additionally, the greater the terrain slope, the higher the cost of urban spatial expansion. Under strict land constraints, a more concentrated spatial structure is likely to form, meeting the relevance condition. The regression results based on 2SLS, reported in Column (9) of Table 2, show that the coefficients of lnPoly are still significantly negative. This indicates that, even after addressing endogeneity concerns, urban polycentric structures continue to play a role in reducing carbon emission intensity, thereby strengthening the reliability of our baseline regression results.
4.2. Robustness Tests
4.2.1. Substituting the Core Explanatory Variable
To substitute the original core explanatory variable in our study, we calculated four distinct indicators. Firstly, we modified the urban center identification criteria, expanding the raster screening proportion to 20% for prefecture-level cities, 25% for sub-provincial cities, and 30% for major cities like Beijing, Shanghai, Guangzhou, Shenzhen, and Tianjin. Secondly, we assessed the urban polycentric degree by using the population ratio of sub-centers to the largest center. Thirdly, we adopted the Herfindahl–Hirschman Index3 as a substitute for the urban polycentric degree, where a higher index signifies a weaker degree of polycentric structures. Fourthly, we further replaced the urban polycentric degree with the count of urban centers, interpreting a higher count as indicating stronger polycentricity. The regression results, as detailed in columns (1), (2), (3), and (4) of Table 3, show the outcomes of replacing the core explanatory variable. These results demonstrate that, even after considering the robustness of the core explanatory variable, a higher urban polycentric degree still contributes to lower carbon emission intensity. This finding confirms the strong robustness of the baseline regression results.
Table 3.
Results of robustness tests with substitutive core variables.
4.2.2. Substituting the Explained Variable
We replaced the original explained variables with two substitutive variables. Firstly, we computed per capita carbon emissions by dividing total carbon emissions by the urban permanent resident population. Secondly, using data from the CEADs database [42], we calculated the carbon emission intensity for our study subject. The regression results, presented in Table 3 in columns (5) and (6), show that the coefficients of lnPoly remain significantly negative with the introduction of these new variables, thereby reinforcing the robustness of our baseline regression results.
4.2.3. Additional Robustness Tests
To mitigate the impact of extreme values, specific cities, and time windows on urban polycentric effects, we employed four methods. First, we applied 1% bilateral tail shrinkage to both Ci and lnPoly to address extreme values, and reported the results in Column (1) of Table 4. Second, to avoid the influence of high-energy-consuming industries, we excluded 77 resource-based cities, such as Zhangjiakou, Chengde, and Tangshan, presenting the results in Column (2) of Table 4. Third, we conducted separate regressions for eastern coastal cities and other cities to analyze regional heterogeneity, showing these results in Columns (3) and (4) of Table 4. Fourth, due to inconsistencies in power supply data from 2018 to 2019, we adjusted the sample period to 2006–2017 and presented the results in Column (5) of Table 4. The coefficients of lnPoly in columns (1) to (5) of Table 4 predominantly appear negative and significant, which reinforces the robustness of our baseline regression conclusion.
Table 4.
Results of additional robustness tests.
5. Mechanism Analysis
5.1. Alleviating the Overcrowding in Downtown Areas
We used the Landscan data to determine the downtown population and the area occupied by the downtown area. The calculation of the downtown agglomeration degree follows Formula (3).
where, Popi, Areai, and Densityi represent the population, area, and population density of the downtown area, respectively. The larger the value, the higher the agglomeration level in the downtown area, and vice versa.
Downtown agglomeration levels vary among cities, so we selected samples from cities with the top 35%, 50%, 65%, and 80% downtown agglomeration levels for regression analysis. Table 5 reports the results: columns (1) to (4) for the impact of the urban polycentric structure on downtown agglomeration, and columns (5) to (8) for the effect of downtown agglomeration on carbon emission intensity. The significantly negative coefficient of lnPoly in Column (1) suggests that in cities with the top 35% downtown agglomeration, an increased urban polycentric degree can reduce downtown agglomeration. This is attributed to the significant dilution effect urban sub-centers have on downtown agglomeration, a trend also observed in the top 50%, 65%, and 80% cities, as shown in columns (2) to (4).
Table 5.
Empirical results of alleviating the overcrowding in downtown areas.
Columns (5) and (6) reveal that the Density coefficients are significantly positive for cities in the top 35% and 50% agglomeration levels, indicating that higher downtown agglomeration raises carbon emission intensity, aligning with our theoretical mechanism. However, the Density coefficients in columns (7) and (8) are insignificant, suggesting that only beyond a certain level does downtown agglomeration affect carbon emission intensity. In summary, while downtown overcrowding increases carbon emission intensity, the urban polycentric structure helps mitigate this by decentralizing downtown agglomeration.
5.2. Optimizing the Inter-Industry Allocation of Labor
If labor moves freely among different industries, then the labor productivity in each industry should be equal in a state of equilibrium. Otherwise, there exists a distortion in the allocation of labor across industries. The calculation of the distortion index appears as shown in Equation (4) [29].
In this study, K denotes the number of industries, and it is set to three. VAi and Li represent the value added and the labor force in the ith industry, respectively. The expression calculates the difference between the share of the labor force and the share of value-added in each industry. Distortion is measured as the Euclidean distance between the value-added and labor shares, with larger values indicating greater distortions and smaller values indicating lesser distortions.
In Table 6, Column (1) shows that the lnPoly coefficient is not significant for the full sample, indicating that urban polycentric development does not substantially impact labor allocation at this level. To explore regional differences, we divided the full sample into two groups: the eastern region and the other regions (central, western, and northeastern), with separate analyses presented in columns (2) and (3). For the eastern region, the lnPoly coefficient is significantly positive. This indicates that urban polycentric development distorts labor allocation, which is contrary to previous theories. This distortion could be attributed to the focus of many sub-centers in eastern cities on advanced manufacturing and high-end services. These industries tend to be more technology- or capital-intensive rather than labor-intensive, leading to a higher output share relative to their labor share, thereby increasing labor allocation distortion. Conversely, in the central, western, and northeastern regions, the lnPoly coefficient is significantly negative. This suggests that urban polycentric development facilitates the free flow of labor across sectors and reduces labor allocation distortion, which is in line with theoretical analysis.
Table 6.
Empirical results of optimizing the inter-industry allocation of labor.
Columns (4) to (6) investigate the relationship between labor allocation distortion and carbon emission intensity. The Distortion coefficients are significantly negative in these columns, suggesting that higher levels of labor allocation distortion correspond to lower carbon emission intensity. This finding may initially seem paradoxical. However, it can be explained by the impact of capital deepening in the manufacturing and service industries. In these sectors, capital and technology often replace labor, leading to significant labor allocation distortion. Although this substitution might initially result in increased carbon emissions, it also contributes to GDP growth. If the GDP growth rate exceeds the rise in carbon emissions, the overall effect is a reduction in carbon emission intensity. This conclusion is in line with the findings of Shen et al. [29].
5.3. Attracting High-Productivity Enterprises to Enter
Based on the latest data published in the China Industrial Enterprise Database for 2006–2015, we selected data from 293,827 new enterprises to estimate their total factor productivity (Tfp) using the Levinshohn and Petrin [43] method (LP). A higher value indicates that more high-productivity enterprises enter this locality and vice versa4.
In Table 7, Column (1) shows that the lnPoly coefficient is not significant. This indicates that, at the full sample level, urban polycentric development does not significantly impact the entry of high-productivity enterprises. The sub-sample regression results for the eastern region and other regions are presented in columns (2) and (3), respectively. In the eastern region (Column 2), the lnPoly coefficient is significantly positive, which suggests that polycentric development encourages the entry of high-productivity enterprises, aligning with prior theoretical analysis. Conversely, in Column (3), the lnPoly coefficient is significantly negative for central, western, and northeastern cities. This indicates that polycentric development in these regions attracts more low-productivity enterprises. The main reason is that these cities have lower land and labor costs and more relaxed administrative constraints, leading them to absorb a significant number of traditional industries from eastern cities. This has resulted in a predominance of low-productivity enterprises. In columns (4) to (6), the lnTfp coefficients are significantly negative. This shows that as more high-productivity enterprises enter, there is a decrease in carbon emission intensity, which is consistent with empirical observations.
Table 7.
Empirical results of attracting high-productivity enterprises to enter.
6. Heterogeneity Analysis
6.1. The Non-Linear Impact of a Polycentric Structure
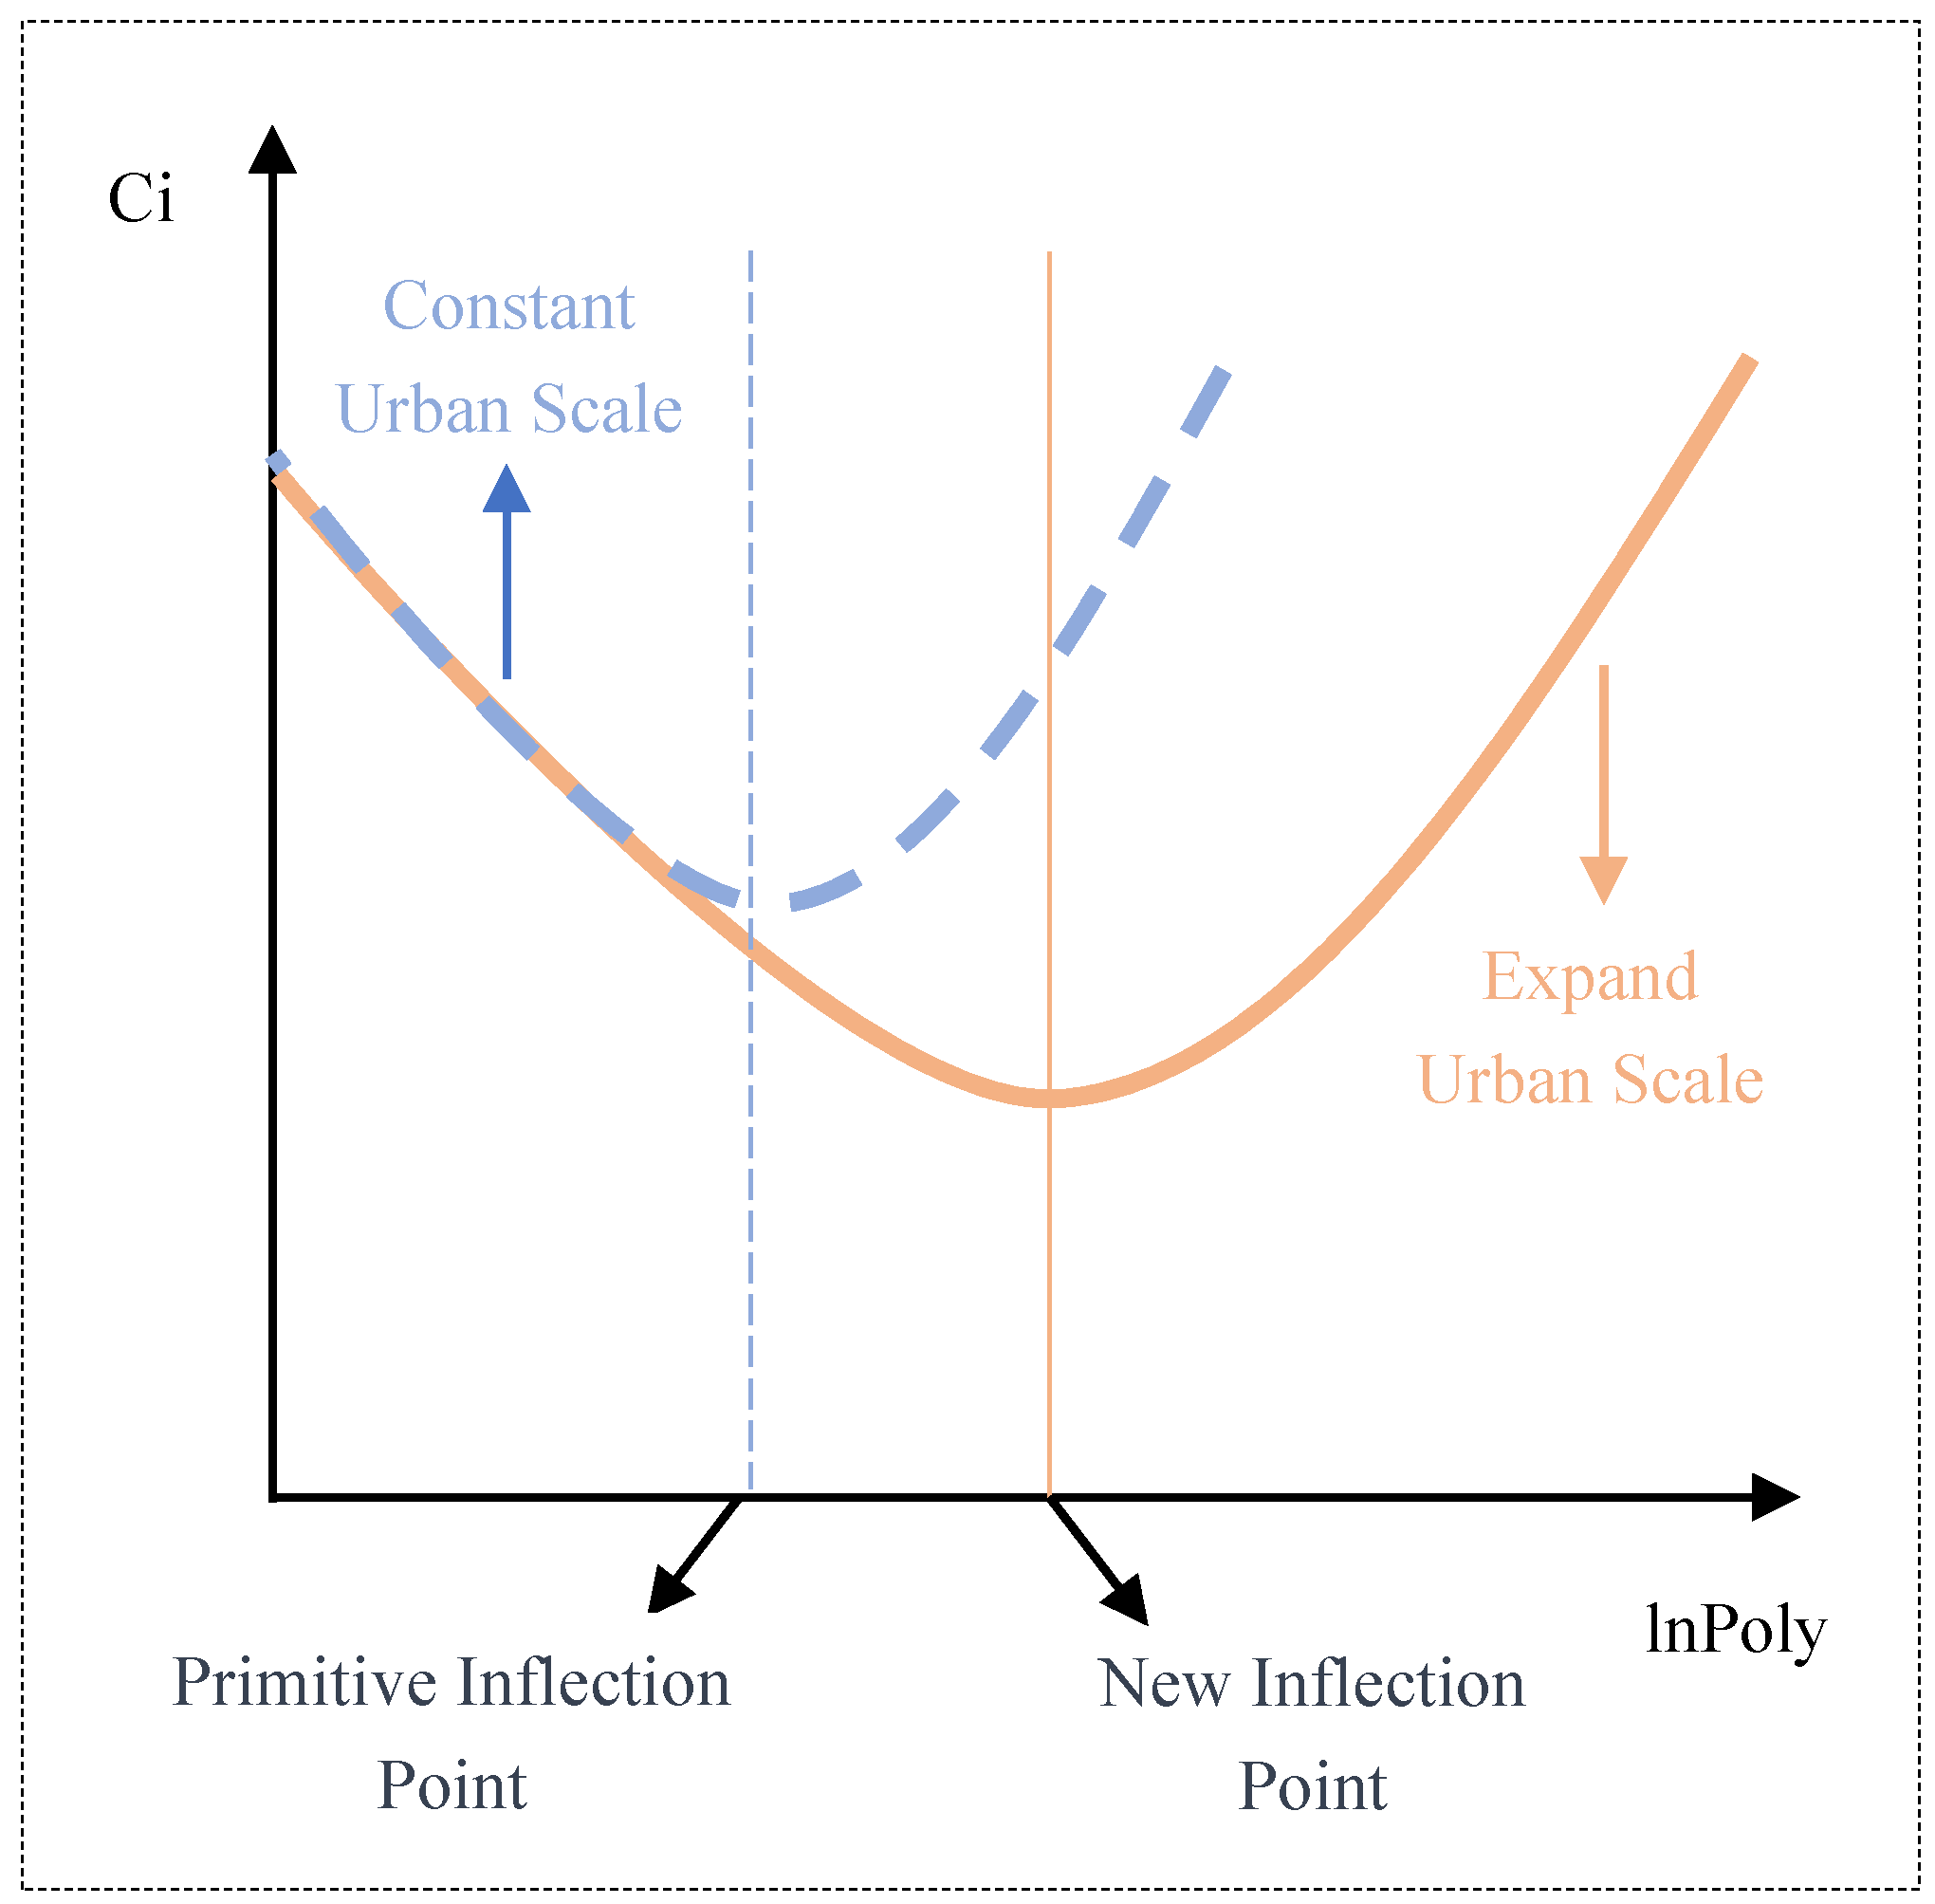
First, we incorporated a quadratic term for urban polycentric degree into our baseline regression model to investigate the potential existence of an optimal polycentricity level. The results, as shown in Column (1) of Table 8, reveal that the lnPoly coefficients are negative for the primary term and positive for the secondary term, with both being significant at a minimum of the 5% level. This pattern indicates a ‘U-shaped’ effect of polycentric structure on carbon emission intensity, which is depicted in Figure 3. We calculated the inflection point to be approximately at lnPoly = 0.33. Through our analysis, we identified smaller cities such as Tangshan, Datong, Baotou, and Fuyang, which constitute about 5.6% of all cities in the study, as having exceeded this inflection point.
Table 8.
Heterogeneity results.
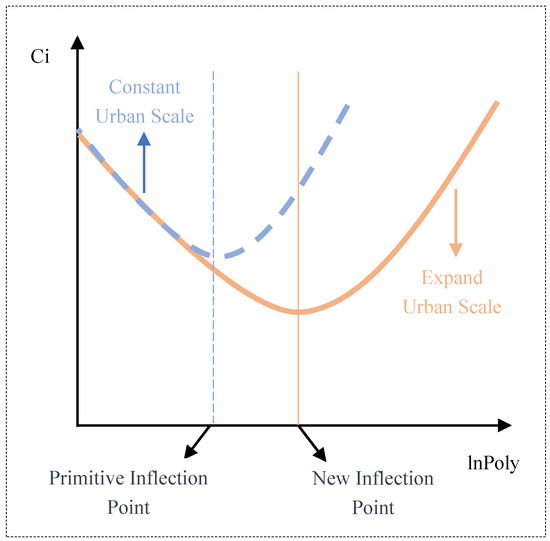
Figure 3.
Inflection point movement.
This suggests that while a moderate polycentric structure can reduce carbon emission intensity, an excessive one might lead to an increase in carbon emissions. The underlying reason could be that some local governments excessively prioritize polycentric development, driven by performance metrics and tax revenue considerations, often overlooking the actual needs of urban development. This leads to a premature shift towards polycentric development, marked by the hasty construction of sub-centers. These emerging sub-centers not only dilute the population of the main urban center, but also struggle to establish significant influence, thereby undermining the benefits of agglomeration economies such as matching, learning, and sharing5. Additionally, the sub-centers, often developed hastily and lacking in quality, struggle to attract high-productivity enterprises. Instead, they become more suited for lower-efficiency businesses, such as energy-intensive industries.
Second, in our nonlinear model, we reintroduced the interaction term between urban polycentric structure and urban scale [46], denoted as lnPoly×lnScale, as shown in Column (2). The model reveals a significant negative coefficient for lnPoly×lnScale at the 5% level, indicating that an increasing urban scale shifts the ‘U-shaped’ curve’s inflection point rightward, as illustrated in Figure 3. This suggests that for cities to reduce carbon emissions sustainably, they must expand in scale alongside their polycentric development. In contrast, excessive polycentric growth without a corresponding expansion in urban scale can lead to increased carbon emissions. This is because when the urban scale is small, an overly developed polycentric structure can weaken the agglomeration benefits in the downtown area. This problem becomes more severe when the urban scale stays constant, making it harder to reduce carbon emission intensity. However, in larger urban scales, a polycentric structure can extend agglomeration benefits over a broader area, maximizing the city’s potential for sharing, matching, and learning, which leads to more significant carbon emission reductions. In such scenarios, the polycentric structure and urban scale synergistically work together to effectively lower carbon emission intensity.
6.2. The Moderating Effect of the External Environment
We examined the factors influencing the decarbonization effect of polycentric structures, focusing on differences in external environments. We considered three main external factors: local government support, urban transportation networks, and communication levels. We measured local government support (lnGovern) as the share of local government fiscal expenditure in GDP, the urban transportation network (lnRoad) as road area per capita, and the communication level (lnInternet) as the proportion of international internet users in the total population. We then incorporated these factors and their interaction terms with the polycentric structure (lnPoly) into the baseline model. The regression results, presented in columns (3) to (5) of Table 8, explore these relationships.
In Table 8, Column (3) displays the regression results related to government support. The significantly negative coefficient of lnPoly×lnGovern suggests that an increase in local government support capacity enhances the decarbonization effect of polycentric structures. This finding underscores the crucial role of government. In China, local governments not only deliver public services but also engage in production and distribution activities. Building sub-centers requires local governments to perform various tasks, including land development, industrial planning, and financial support. Consequently, Therefore, the level and capacity of local government support are key determinants of the speed and quality of sub-center construction, significantly affecting the decarbonization effect of polycentric structures.
Table 8, in Column (4), presents the regression results for the transportation network. The significantly negative coefficient of lnPoly×lnRoad reveals that an improved transportation network strengthens the decarbonization effect of polycentric structures. This finding is of paramount importance as it demonstrates the critical role of transportation networks in reducing transportation costs and enhancing connectivity among centers. Moses and Williamson [47] have highlighted trucking’s impact on manufacturing suburbanization. Enterprises are unlikely to relocate if the rise in transportation costs exceeds labor cost savings. However, a more efficient transportation network lowers these costs, enabling manufacturing firms to cluster in sub-centers, while service sectors remain in downtown areas. This clustering effect contributes to reducing carbon emission intensity, highlighting the transportation network’s critical role in the decarbonization of polycentric structures.
Table 8, in Column (5), highlights the influence of communication technologies. The significantly negative coefficient of lnPoly×lnInternet indicates that the widespread use of communication technology strengthens the decarbonization effect of polycentric structures. The rapid advancement in information and communication technologies has dramatically reduced time and spatial distances, thereby reducing the locational advantage of downtown areas (such as quick access to other enterprises) relative to their disadvantages (like high labor and land costs). As a result, more office activities that do not require face-to-face communication are shifting to sub-centers, which helps to alleviate congestion in downtown areas. Therefore, communication technology plays a profound role in influencing the decarbonization effect of polycentric structures.
7. Conclusions and Policy Implications
Using panel data from Chinese prefecture-level and above cities from 2006 to 2019, our study empirically investigates the impact of urban polycentric structures on carbon emission intensity, along with its mechanisms and heterogeneous effects. The main findings include the following.
Firstly, urban polycentric structures significantly reduce carbon emission intensity. This conclusion is convincing after a series of robustness tests. This insight indicates that such development can balance economic growth with carbon reduction goals and offers significant contributions to the debate on polycentric development. It also serves as a valuable reference for policymakers aiming to harness the potential of polycentric development in cutting down emission levels.
Secondly, distinguishing this from the previous literature, our mechanism analysis indicates that the urban polycentric structure can alleviate the overcrowding of downtown areas in cities with high downtown agglomeration, thus reducing carbon emission intensity. Particularly in eastern regions, urban polycentric structures also affect labor allocation across industries and attract high-productivity enterprises, leading to reduced carbon intensity.
Thirdly, our research innovatively identifies a ‘U-shaped’ relationship between urban polycentric structures and carbon emission intensity. This finding implies that moderate polycentric development can reduce carbon emission intensity, but excessive development in this direction increases it. Nevertheless, expanding the urban scale can alleviate the negative impacts of polycentric structures on carbon emissions. Therefore, to continually harness the decarbonization effect of urban polycentric structures, it is necessary to simultaneously expand the urban scale to achieve a balance.
Fourthly, our findings indicate that government support enhances the quality of sub-center construction, which drives low-carbon urban development. Additionally, optimizing urban transport networks improves connectivity between centers, contributing to carbon emission reduction. Furthermore, advancing communication technology not only increases urban efficiency but also promotes industry-specific clustering, significantly influencing carbon emissions. Hence, for more effective decarbonization in polycentric structures, it is crucial to comprehensively consider these external factors and develop corresponding policies and measures.
Based on the above research findings, this paper attempts to offer the following policy suggestions.
Firstly, although China has a vast territory, the area suitable for development is limited, which highlights the importance of urban spatial structure. The urbanization process introduces challenges, such as overcrowding and uneven resource distribution, which can increase carbon emission intensity. Our research findings show that adopting an effective polycentric urban structure can effectively tackle these challenges. We advocate that the government actively fosters the development of a healthy and stable polycentric structure. This can be achieved through proactive planning leadership, implementing urban renewal initiatives, and strategically allocating land indices. The ultimate goal is to uphold low-carbon development during the urbanization process.
Secondly, government strategies must effectively address the distinct needs of various types of cities in urban spatial structures. For large cities, promoting a polycentric structure is essential. This involves strategically developing urban sub-centers to distribute the population and economic activities more evenly, which helps to relieve overcrowding in downtown areas and maintain a moderate level of downtown agglomeration. Such a balanced approach not only furthers low-carbon development but also supports sustainable growth by accommodating more people in a more efficient manner. In contrast, smaller cities should approach polycentric development with caution. Their focus should be on comprehensive improvements in downtown areas, enhancing public facilities, services, and the overall living and working environments. This approach is preferable over reliance on investment-driven planning, which often prioritizes short-term economic gains over sustainable urban development. Small and medium-sized cities can selectively accept functional and industrial transfers from larger cities. They need to ensure that such transfers bring high-quality investment, which is crucial for promoting local economic diversification and sustainable development.
Thirdly, to maximize the decarbonization effect of polycentric structures, the government needs to implement a range of measures. First, the government should actively support the high-quality development of sub-centers. This support can include tax reductions, direct subsidies, and low-interest loans. Enforcing strong environmental regulations, setting emission limits, and fining polluting companies are also important. Second, the government must enhance transportation infrastructure, such as highways, railways, light rails, and public transit systems, connecting main and sub-centers. This enhancement will reduce transportation costs for people and goods. Finally, the government should continue advancing communication technologies, particularly 5G and the upcoming 6G networks, to support stable and efficient remote work. Additionally, China can learn from global examples of successful urban development. For instance, the ‘Greater Paris Project’ enhances suburban development with new transportation networks and business centers. In another example, London connects various city centers with its extensive subway and bus services, thereby reducing reliance on a single center. Amsterdam’s smart city project focuses on using data analysis to optimize traffic flow and energy management.
Author Contributions
Conceptualization, X.Y. and X.Z.; methodology, X.Y.; software, X.Y.; validation, X.Z., M.L. and Z.W.; formal analysis, X.Y.; investigation, X.Y.; resources, X.Z.; data curation, X.Y.; writing—original draft preparation, X.Y.; writing—review and editing, X.Y. and Z.W.; visualization, M.L.; supervision, M.L.; project administration, X.Z.; funding acquisition, M.L. All authors have read and agreed to the published version of the manuscript.
Funding
This research was funded external by Research Center for Hubei Business Service and Development, Key Research Base of Humanities and Social Science of Hubei Province [2023Z02]. This research was also Supported by the Scientific Research Team Plan of Wuhan Technology and Business University.
Data Availability Statement
The original contributions presented in the study are included in the article, further inquiries can be directed to the corresponding author.
Conflicts of Interest
The authors declare no conflict of interest.
Notes
| 1 | The population densities in downtown Beijing and Shanghai are above 20,000 per square kilometer, while Tokyo and New York are only about 13,000 (Data from “Some Major Issues of National Medium and Long-Term Economic and Social Development Strategy”, released in 2020). |
| 2 | Multiply the terrain slope with the time variable to ensure the variation of the instrumental variable over the time dimension. |
| 3 | . N represents the number of sub-centers, Pij represents the population of the i th sub-center, and Pj represents the total population of the city. |
| 4 | The database is processed as follows. First, referring to Lu et al. [44], erroneous records that did not conform to the fundamental logical relationships in the database are removed. Second, the six-digit administrative division code was adjusted uniformly according to the 2013 standard. Third, referring to Brandt et al. [45], we unified the 2011 National Economic Classification codes according to the 2002 version. Fourth, we deleted data from mining and public utility enterprises. Additionally, the China Industrial Enterprise Database only includes non-state-owned industrial enterprises with an annual primary business income of CNY five million or more; businesses that fall short of this threshold are excluded. Consequently, it is not necessarily a newly established enterprise that first appears in the database. Considering the time it takes for an enterprise to be incorporated and placed into operation, we define a newly established enterprise as one that first appears in the database and has existed for less than two years. |
| 5 | The three main sources of agglomeration economies are matching (enhancing the efficiency of matching between labor and employers), learning (facilitating the exchange and dissemination of information and knowledge), and sharing (businesses sharing infrastructure and services to increase efficiency). |
References
- Zhu, D.; Wang, Y.; Peng, S.; Zhang, F. Influence Mechanism of Polycentric Spatial Structure on Urban Land Use Efficiency: A Moderated Mediation Model. Int. J. Environ. Res. Public Health 2022, 19, 16478. [Google Scholar] [CrossRef]
- Anas, A.; Arnott, R.; Small, K.A. Urban spatial structure. J. Econ. Lit. 1998, 36, 1426–1464. [Google Scholar]
- Anderson, J.E. Cubic-spline urban-density functions. J. Urban Econ. 1982, 12, 155–167. [Google Scholar] [CrossRef]
- Alonso, W. Location and Land Use: Toward a General Theory of Land Rent; Harvard University Press: Cambridge, MA, USA, 1964. [Google Scholar]
- Mills, E.S. An aggregative model of resource allocation in a metropolitan area. Am. Econ. Rev. 1967, 57, 197–210. [Google Scholar]
- Muth, R.F. Cities and Housing; the Spatial Pattern of Urban Residential Land Use; University of Chicago Press: Chicago, IL, USA, 1969. [Google Scholar]
- Sullivan, A.M. A general equilibrium model with agglomerative economies and decentralized employment. J. Urban Econ. 1986, 20, 55–74. [Google Scholar] [CrossRef]
- Wieand, K.F. An extension of the monocentric urban spatial equilibrium model to a multicenter setting: The case of the two-center city. J. Urban Econ. 1987, 21, 259–271. [Google Scholar] [CrossRef]
- Sasaki, K. The establishment of a subcenter and urban spatial structure. Environ. Plan. A 1990, 22, 369–383. [Google Scholar] [CrossRef]
- Fujita, M.; Thisse, J.F.; Zenou, Y. On the endogeneous formation of secondary employment centers in a city. J. Urban Econ. 1997, 41, 337–357. [Google Scholar] [CrossRef]
- White, M.J. Urban areas with decentralized employment: Theory and empirical work. Handb. Reg. Urban Econ. 1999, 3, 1375–1412. [Google Scholar]
- Gordon, P.; Richardson, H.W.; Wong, H.L. The distribution of population and employment in a polycentric city: The case of Los Angeles. Environ. Plan. A 1986, 18, 161–173. [Google Scholar] [CrossRef]
- McMillen, D.P.; McDonald, J.F. Suburban subcenters and employment density in metropolitan Chicago. J. Urban Econ. 1998, 43, 157–180. [Google Scholar] [CrossRef]
- Craig, S.G.; Ng, P.T. Using quantile smoothing splines to identify employment subcenters in a multicentric urban area. J. Urban Econ. 2001, 49, 100–120. [Google Scholar] [CrossRef]
- Fujita, M.; Ogawa, H. Multiple equilibria and structural transition of non-monocentric urban configurations. Reg. Sci. Urban Econ. 1982, 12, 161–196. [Google Scholar] [CrossRef]
- Li, W.; Sun, B.; Zhang, T. Spatial structure and labour productivity: Evidence from prefectures in China. Urban Stud. 2019, 56, 1516–1532. [Google Scholar] [CrossRef]
- Rosenthal, S.S.; Strange, W.C. The attenuation of human capital spillovers. J. Urban Econ. 2008, 64, 373–389. [Google Scholar] [CrossRef]
- Meijers, E.J.; Burger, M.J. Stretching the concept of ‘borrowed size’. Urban Stud. 2015, 54, 269–291. [Google Scholar] [CrossRef]
- Veneri, P.; Burgalassi, D. Questioning polycentric development and its effects. Issues of definition and measurement for the Italian NUTS-2 regions. Eur. Plan. Stud. 2012, 20, 1017–1037. [Google Scholar] [CrossRef]
- Faludi, A. The European spatial development perspective and North-West Europe: Application and the future. Eur. Plan. Stud. 2004, 12, 391–408. [Google Scholar] [CrossRef]
- Zhu, K.; Tu, M.; Li, Y. Did polycentric and compact structure reduce carbon emissions? A spatial panel data analysis of 286 Chinese cities from 2002 to 2019. Land 2022, 11, 185. [Google Scholar] [CrossRef]
- Feng, T.; Zhou, B. Impact of urban spatial structure elements on carbon emissions efficiency in growing megacities: The case of Chengdu. Sci. Rep. 2023, 13, 9939. [Google Scholar] [CrossRef]
- Burgalassi, D.; Luzzati, T. Urban spatial structure and environmental emissions: A survey of the literature and some empirical evidence for Italian NUTS 3 regions. Cities 2015, 49, 134–148. [Google Scholar] [CrossRef]
- Gordon, P.; Richardson, H.W. Beyond polycentricity: The dispersed metropolis, Los Angeles, 1970–1990. J. Am. Plan. Assoc. 1996, 62, 289–295. [Google Scholar] [CrossRef]
- Cervero, R.; Wu, K.L. Polycentrism, Commuting, and Residential Location in the San Francisco Bay Area. Environ. Plan. A Econ. Space 1997, 29, 865–886. [Google Scholar] [CrossRef]
- Otsuka, A. How do population agglomeration and interregional networks improve energy efficiency? Asia-Pac. J. Reg. Sci. 2020, 4, 1–25. [Google Scholar] [CrossRef]
- Bosquet, C.; Overman, H.G. Why does birthplace matter so much? J. Urban Econ. 2019, 110, 26–34. [Google Scholar] [CrossRef]
- Tabuchi, T.; Thisse, J.F.; Zhu, X. Does technological progress magnify regional disparities? Int. Econ. Rev. 2018, 59, 647–663. [Google Scholar] [CrossRef]
- Shen, X.; Chen, Y.; Lin, B. Impact of Technological Progress and Industrial Structure Distortion on Energy Intensity in China. China Financ. Econ. Rev. 2021, 10, 25–46. [Google Scholar]
- Lin, P.Q.; Du, K.R. Understanding changes in China’s energy intensity: An integrated decomposition framework. World Econ. 2014, 4, 69–87. [Google Scholar]
- Yuan, P. Factor decomposition of energy demand growth in China. Res. Quant. Econ. Technol. Econ. 2014, 11, 70–85. [Google Scholar]
- Chen, X.; Qiu, B. Polycentric spatial structure and labor income—Evidence from Chinese industrial firms. Nankai Econ. Res. 2021, 2, 24–45. [Google Scholar]
- Armington, C.; Acs, Z.J. The determinants of regional variation in new firm formation. Reg. Stud. 2002, 36, 33–45. [Google Scholar] [CrossRef]
- Green, N. Functional polycentricity: A formal definition in terms of social network analysis. Urban Stud. 2007, 44, 2077–2103. [Google Scholar] [CrossRef]
- Leslie, T.F. Identification and differentiation of urban centers in Phoenix through a multi-criteria kernel-density approach. Int. Reg. Sci. Rev. 2010, 33, 205–235. [Google Scholar] [CrossRef]
- Liu, X.; Wang, M. How polycentric is urban China and why? A case study of 318 cities. Landsc. Urban Plan. 2016, 151, 10–20. [Google Scholar] [CrossRef]
- Liu, X.; Wang, M.; Qiang, W.; Wu, K.; Wang, X. Urban form, shrinking cities, and residential carbon emissions: Evidence from Chinese city-regions. Appl. Energy 2020, 261, 114409. [Google Scholar] [CrossRef]
- Xie, B.; Jiao, J.; An, Z.; Zheng, Y.; Li, Z. Deciphering the stroke–built environment nexus in transitional cities: Conceptual framework, empirical evidence, and implications for proactive planning intervention. Cities 2019, 94, 116–128. [Google Scholar] [CrossRef] [PubMed]
- Bai, Y.; Deng, X.; Gibson, J.; Zhao, Z.; Xu, H. How does urbanization affect residential CO2 emissions? An analysis on urban agglomerations of China. J. Clean. Prod. 2019, 209, 876–885. [Google Scholar] [CrossRef]
- Jiang, J.; Xie, D.; Ye, B.; Shen, B.; Chen, Z. Research on China’s cap-and-trade carbon emission trading scheme: Overview and outlook. Appl. Energy 2016, 178, 902–917. [Google Scholar] [CrossRef]
- Dong, L.; Fujita, T.; Zhang, H.; Dai, M.; Fujii, M.; Ohnishi, S.; Geng, Y.; Liu, Z. Promoting low-carbon city through industrial symbiosis: A case in China by applying HPIMO model. Energy Policy 2013, 61, 864–873. [Google Scholar] [CrossRef]
- Chen, J.; Gao, M.; Cheng, S.; Hou, W.; Song, M.; Liu, X.; Liu, Y.; Shan, Y. County-level CO2 Emissions and Sequestration in China during 1997~2017. Sci. Data 2020, 7, 391. [Google Scholar] [CrossRef]
- Levinsohn, J.; Petrin, A. Estimating production functions using inputs to control for unobservables. Rev. Econ. Stud. 2003, 70, 317–341. [Google Scholar] [CrossRef]
- Lu, D.G.; Geng, Q.; Jane, Z.; Lu, R. Market Size, Labor Costs and Heterogeneous Firm Location Choices—An Explanation for the Puzzle of Regional Economic and Productivity Gaps in China. Econ. Stud. 2019, 2, 36–53. [Google Scholar]
- Brandt, L.; Van Biesebroeck, J.; Zhang, Y. Creative accounting or creative destruction? Firm-level productivity growth in Chinese manufacturing. J. Dev. Econ. 2012, 97, 339–351. [Google Scholar] [CrossRef]
- Wang, Q.; Liu, X.; Li, C. Spatial structure, city size and innovation performance of Chinese cities. China Ind. Econ. 2021, 5, 114–132. [Google Scholar]
- Moses, L.; Williamson, H.F. The location of economic activity in cities. Am. Econ. Rev. 1967, 57, 211–222. [Google Scholar]

Disclaimer/Publisher’s Note: The statements, opinions and data contained in all publications are solely those of the individual author(s) and contributor(s) and not of MDPI and/or the editor(s). MDPI and/or the editor(s) disclaim responsibility for any injury to people or property resulting from any ideas, methods, instructions or products referred to in the content. |
© 2024 by the authors. Licensee MDPI, Basel, Switzerland. This article is an open access article distributed under the terms and conditions of the Creative Commons Attribution (CC BY) license (https://creativecommons.org/licenses/by/4.0/).