1. Introduction
Land use/land cover change (LULCC) has become a great concern in recent years worldwide, due to its adverse impacts on the environment and the consequent effect on economies and social dynamics. LULCC inhibits sustainable development [
1]. An analysis of global LULCC drivers for the period of 1982–2016 carried out by Song et al. [
2] states that approximately 60% of global land changes are attributed to direct human activity, with the remainder associated with indirect factors such as climate change. Changes in land use and land cover are the result of intricate interactions between people and the environment [
3,
4]. Hence, a complex and holistic approach incorporating both human and environmental dimensions is required for a comprehensive analysis. The identification of the key drivers of LULC changes is challenging due to the strong interdependencies and interconnectedness in socio-ecological systems (SESs) [
5,
6,
7]. SESs are dynamic, and their dynamism implies that we can only identify the main drivers for a brief period of time with a need for systematic monitoring and updates. Remote sensing and a geographic information system analysis play an important role in collecting a sufficient amount of data on LULC changes [
8,
9].
Spatio-temporal analysis of LULCC along with on-site observations, statistics, and quantitative and qualitative data from local people and experts can provide for comprehensive research and a full picture of the ongoing and possible future scenarios, which are essential for effective decision- and policy-making targeted at sustainability in present and future times. An analysis of LULCC drivers is important for designing sustainable development strategies [
10].
The scientific literature states demographic, socio-economic, institutional, technological, and biophysical factors as the main factors shaping land use and land cover change in different countries across the globe, with some of these factors prevailing more or less in certain regions depending on the specifics of the study area and the local context [
11,
12].
Many of these studies analyze developing countries with high rates of urbanization. Calzada et al. [
13] examine land use changes in two contrasting tropical dry regions of Mexico, identifying a swift decline in natural areas due to urban expansion. A future land use simulator predicts reduced agricultural and pasture lands and increased human settlement areas by 2038. Other similar studies have analyzed LULCC in countries such as Ethiopia [
14], Tanzania [
15], and China [
16]. These studies have identified factors such as intensive agriculture, socio-economic developments, population growth, and the quantity of exported goods as determinants of declining agricultural yield, biodiversity loss, increased aridity, land degradation, and water resource decline, exacerbating the gap in land and water supply–demand. Demographic and socio-economic factors emerged as crucial drivers in changes leading to a rise in impervious surfaces.
As argued by these studies, various approaches are employed in the analysis of the driving forces behind LULCC and landscape dynamics. Commonly, GIS and remote sensing techniques are utilized for scrutinizing LULCC changes, offering valuable insights into the spatial distribution and temporal evolution of land use patterns. An assessment of LULCC frequently involves the use of satellite imagery, such as Landsat images captured at different time points [
8,
14]. Landsat satellites, equipped with multispectral sensors, provide a comprehensive view of the Earth’s surface, enabling the monitoring of changes in land use and land cover over specific periods. Moreover, to analyze spatiotemporal changes, some studies adopt integrated approaches like the cellular automata–artificial neural network (CAANN) methodology [
17], which combines cellular automata and artificial neural networks to model and simulate complex land use dynamics, offering a comprehensive understanding of landscape transformations over time. Additionally, researchers often integrate future land use simulation models into their analyses to predict potential scenarios based on current trends and identified drivers, adopting such techniques as Dinamica [
18], Markov-FLUS [
19], SLEUTH cellular automata [
20], artificial neural network–Markov chains [
21], and CLUE-S [
7]. These models serve as valuable tools for understanding and predicting the dynamics of land use across different spatial scales.
On a global basis, technological innovation, demographic change, globalization, urbanization, and climate change are the primary determinants. These principal forces influence the demand and supply of land assets and engage in complex interactions [
22,
23]. The other important driving factor of land use change according to Lambin is also the history of land use [
24,
25], which shapes land practices. Regionally, contextual factors such as cultural preferences, biophysical characteristics, institutional arrangements, prevailing socio-economic conditions, and policy initiatives may mitigate the impacts of global drivers in rural areas and specifically in marginal territories [
23]. For instance, Mack et al. [
26], in their recent research, found that indirect drivers such as migration and migrant money flow of remittances have a strong impact on land systems and consequently on land change. Another study of local drivers carried out by Tahmasebi [
27] suggests that, in rural areas, other often neglected factors such as psychological drivers can also have a strong impact on how land users make their decisions about land practices. Land practices and their management further create various LULCC patterns that can either be harmful or beneficial to other ecosystems [
28]. This is critical if we consider areas with fragile ecosystems, which are less resistant in the face of external influence and have less ability to quickly recover from any negative disturbances and, if pushed forward beyond the threshold, would not sustain any damage. Semi-arid and arid areas are considered fragile systems (they have inherent properties of fragility). However, under increased or unpredictable disturbances caused by natural calamities or anthropogenic impact, they may demonstrate a high level of species alteration in number and composition [
29,
30,
31]. Thus, designing complex, holistic land use strategies and plans is of special significance when it comes to sustainable development, in particular for inner or marginal areas where different land use types often overlap.
This task has become a major challenge, especially in the case of European countries where there exists a multilayer policy-making process along with a multi-faceted wide rural territory. To ease the designing process of tailored local development policies, a ‘place-based vision’ approach has been developed in the EU rural policy practice, as a method to favor sustainable regional development [
32], in specific territorial conditions such as remote and/or marginalized regions [
33]. To develop a strategic place-based vision, it is important to map the current situation in the territory, and often, this starts with mapping the natural resources at hand, the main land use transformations, and their socio-economic determinants. The Mediterranean area has seen several transformations in recent decades, particularly driven by demographic changes leading to considerable variations in LULCC in terms of urban sprawl, abandoned rural areas, and the decrease in agricultural land [
34,
35]. Also, many pastoral regimes have been abandoned, thus causing an increase in natural vegetation of unfertile and unproductive land or changes in wildfire regimes [
36,
37]. The above changes have contributed to worsening global warming and drying climate conditions, particularly in Italy, Spain, Greece and Portugal [
38].
In the context of the fragile and marginalized risky rural area of the Mediterranean basin, our analysis is focused on the micro-transformations that occurred in the area of Gargano, a mountain area in the south of Italy with semi-arid conditions and a predominantly agricultural economy [
39], in the period 2000–2018.
The Gargano area (approximately 170 thousand inhabitants) relies on the key sectors of tourism, agriculture, and industry. Tourism is a major contributor to the local income, with some problems of sustainability linked to seasonality. Despite challenges like abandonment in some areas, agriculture remains crucial, with a multitude of small-scale agricultural activities taking place, particularly in olive tree and vegetable farming. However, the region faces the issue of younger generations migrating in search of better job opportunities elsewhere. The industrial sector experiences limited development, with most companies being smaller than the provincial average.
The purpose of this paper is to assess LULCC in Gargano (South Italy) and provide adequate policy recommendations based on the above transformations. The main research aims that the present study intends to pursue are (1) to identify the major LULCC transformations and (2) to investigate key drivers of these transformations.
The first question is addressed by means of a geographical information system (GIS) analysis, while the related drivers are qualitatively assessed based on the experts’ views. This approach is illustrated in
Section 2, which includes a focus on the case study area before introducing the GIS analysis and the method to assess the influence of drivers. In
Section 3, the results of the analysis are presented.
Section 4 returns to the research question and provides some policy implications and some concluding remarks.
2. Materials and Methods
The information employed in this research was collected from diverse sources: the gray literature for the socio-economic, demographic, climatic, and physiographic data of the case study area, GIS data to observe LULCC, and the scientific literature and expert interviews to identify and assess the major drivers of land use change. To ease the reading, this information has been organized into three subsections, related respectively to the case study, the LULCC analysis, and the assessment of the drivers.
2.1. Case Study Area
Gargano is a historical and geographical sub-region in Foggia, Apulia, southeast Italy, consisting of a wide isolated mountain massif and the Gargano National Park. The region is rich in culture, art, and spirituality, and 35% of all Italian botanical species can be found in the park. The climate is semi-arid, with average temperatures of around 15 °C, with summers between 25 °C and 30 °C, and peaks over 40 °C on the hottest days. Winters are relatively temperate, with temperatures not dropping below 0 °C.
The Gargano region is characterized by sedimentary rocks, particularly limestone and dolomites, created during the Cretaceous and Jurassic periods. The biological landscape is distinguished by its calcareous composition, karst characteristics, caves, sinkholes, and a substantial abundance of woods. The Gargano Promontory constitutes an island separated from the rest of the peninsula by the Tavoliere delle Puglie.
The study area streams are radial and hierarchical, originating from torrential sources and flowing near coastlines. Some flow into Lake Lesina and others towards Lake Varano. Inclines and rocky substrates in river valleys cause frequent flood events and long-term low water levels, transporting solid materials.
This research focuses on 13 municipalities representing more than 80% of the Gargano extension, including Cagnano Varano, Carpino, Ischitella, Manfredonia, Mattinata, Monte Sant’Angelo, Peschici, Rignano Garganico, San Giovanni Rotondo, San Marco in Lamis, Sannicandro Garganico, Vico Del Gargano, and Vieste.
The total area of the study area is 150,857 hectares. There are two commercial ports, in Manfredonia and Rodi Garganico, and the closest airports are located in Foggia (104 km) and Bari (143 km). The rail network there is the least developed infrastructure network in the area, with a couple of regional operators providing short-length connections. There is a fairly good road network connecting small towns and cities, but bus transportation does not fully satisfy transportation needs due to its low frequency (Report on Mediterranean Adventure Tourism, 2020).
The Gargano area, with a population of 172,207 people as of 2019, is characterized by three key sectors: tourism, industrial activities, and agriculture. Tourism accounts for 11% of the national GDP, which is worth 900 million euros [
40], while the agricultural sector plays a significant role in shaping land use patterns. However, some agricultural areas have experienced abandonment due to water scarcity, inadequate infrastructure, and insufficient services.
Most of the local population is employed in small-scale agricultural activities (7367 people), particularly related to olive tree and vegetable farming, and especially in the tourist industry (10,305 people). The area is heavily affected by the migration of the youngest generations to northern Italy and other countries, motivated by the search for better job opportunities [
41].
The industry still has poor development, with low industrialization rates and most companies having a size less than the provincial average. The manufacturing industry contributes 7.5% to the provincial total, with only rare exceptions. The construction industry occupies a small percentage of the provincial GDP (4.40%). Specialized production, such as electrical machinery, electronic and optical equipment, motors, generators, and transformers, enjoys a certain vitality, with workers making up about 91% of the province’s total for this category [
41].
The Rodi Garganico Citrus Oasis is a natural area in the northern part of Gargano, known for its centuries-old production of citrus fruits, such as “Duretta del Gargano” and “Bionda del Gargano” oranges, as well as “Femminello” lemon, which received IGP acknowledgment [
42].
2.2. Geospatial Analysis
Data on land cover, land use and transitions between different categories are some of the most frequently requested pieces of information for the formulation of sustainable land management and planning strategies, needed to provide information to support decision-making processes at community, national and local levels and to verify the effectiveness of environmental policies [
43,
44].
The ever-increasing availability of high-resolution geographic data provided by land government agencies, research infrastructures and environmental agencies is contributing significantly to the ability to study recent soil transformations at unprecedented scales of detail [
45].
As a result, technical–scientific and dissemination initiatives are flourishing, including the periodic reports on land consumption produced by the Higher Institute for Environmental Protection and Research (ISPRA) and the Research Centre on Soil Consumption (CRCS), which provide a very detailed statistical picture of the transformations underway in Italy without, however, going into the merits of the territorial dynamics that triggered, favored, or counteracted them. In this study, therefore, we aim to contextualize the observations on changes in land use and cover in the study area, investigating the determining factors and discussing their possible implications.
The CORINE (Coordination of Information on the Environment) program is mainly based on the remote sensing technique, using classification techniques that depend on the automatic and semi-automatic interpretation of images.
In this context, for the analysis of transformations, of particular importance is the CORINE Land Cover (CLC) initiative, created at the European level specifically for the detection and monitoring of the characteristics of land cover and use, with particular attention to protection needs. The main aim of the initiative is to dynamically verify the state of the environment in the community area, to provide support for the development of common policies, monitor their effects, and propose possible corrective measures. Between 1985 and 1990, the European Commission promoted and financed the CORINE program and set up an information system on the state of the environment in Europe. Nomenclature systems and working methodologies for the creation of the CORINE Land Cover (CLC) database have also been developed and approved at the European level. It was initially implemented in 1990, while subsequent updates refer to the years 2000, 2006, 2012, and 2018.
CLC products are based on the photointerpretation of satellite images following the standard methodology and nomenclature with the following characteristics:
- ▪
A total of 44 land cover classes at the third hierarchical level of the CORINE nomenclature;
- ▪
Minimum mapping unit (MMU) for the coverage of 25 hectares;
- ▪
Minimum amplitude of linear elements of 100 m;
- ▪
MMU for change (LCC) of 5 hectares.
For the analysis of the dynamics of agroforestry land uses, we adapted the methodology proposed in the Territorial Coordination Plan of the Province of Foggia [
40]. Through the application of a land cover change classification matrix that simplifies the interpretation of possible changes between any two classes to a limited number of processes, we obtained the following:
- ▪
Persistences:
- ○
PU: artificial surfaces;
- ○
RA: arable soil;
- ○
PC: permanent crop;
- ○
PP: pastures;
- ○
PH: heterogeneous area;
- ○
PN: natural areas.
- ▪
Agricultural Conversions:
- ○
HE: arable to heterogeneous areas;
- ○
ER: permanent crop to arable areas;
- ○
AP: pasture to other agricultural use;
- ○
TC: other agricultural use to permanent crops;
- ○
OC: heterogeneous areas to permanent crops;
- ○
CP: other agricultural use to pastures.
- ▪
Net Transformation:
- ○
UR: urbanization of natural or agricultural areas;
- ○
DC: deforestation for cropping (e.g., from woods and shrubs to meadows and pastures);
- ○
DP: deforestation for pastures (e.g., from woods and shrublands to complex particulate cropping systems);
- ○
DU: de-urbanization and de-impermeabilization of soils;
- ○
NA: recolonization by natural areas (processes of secondary recolonization by spontaneous vegetation, e.g., from arable land in non-irrigated areas to woods and shrubs).
Despite the consolidated validity of the CORINE system, a limitation of this methodology lies in the fact that the classification adopted by the CORINE program is unable to capture detailed ecosystem variations, especially in natural areas [
46]. It is also important to consider that the CORINE Land Cover (CLC) dataset presents an MMU of 25 hectares for areal phenomena [
47], thus preventing the detection of small territorial fragmentations with dimensions smaller than 25 hectares and with different classifications compared to surrounding surfaces that exceed this threshold. This problem takes on particular relevance in the territorial characteristics of the study area, mainly involving the lands classified as “2.2.1 Vineyards” and “2.2.2 Plantations of fruit trees and berries”. Their extension, especially in coastal areas, often exceeds 25 hectares, highlighting the need for ancillary data for a more accurate estimate [
48].
2.3. Assessment of Land Use Drivers
For the identification of the potential drivers of the observed LULCC in the area studied, we performed a literature analysis based on Science Direct and Scopus. We considered very recent papers (2017–2023) and selected 31 drivers which apply to the study area among those analyzed in these papers [
9,
49,
50,
51,
52].
Table 1 reports the selected drivers grouped as (i) physical and anthropogenic or (ii) socio-economic factors.
Demographic aspects and agricultural practices are the main anthropogenic factors, while soil type, topography and atmospheric phenomena are among the physical ones. The social factors include migration, unemployment, and level of education. The availability of financial resources is mentioned as economic factors.
To assess their relevance as LULCC drivers and their impact for the sustainable development of the rural Gargano, we individually interviewed 11 experts by means of an ad hoc questionnaire.
Table 2 reports the affiliation, scientific background, and research or activity field of the experts interviewed.
The experts were chosen through a process involving the review of published papers, recommendations from fellow scientists, and consultations with local institutions, including the University of Foggia and the National Park of Gargano. An essential criterion was their affiliation with scientific institutions in Italy and their thorough understanding of the causal relationships between driving forces and LULCC in the region.
The questionnaire was based on the information obtained from the geospatial analysis and the literature review. It was formed of two core sections, reserved, respectively, in the assessment and by means of Likert scales, of (i) the land use changes and (ii) their drivers. The LULCCs were assessed with respect to their potential effects on the sustainable development of the case study area. To this end, the experts were asked to consider the LULCC that occurred in the period analyzed (2000–2018), using a geographical representation and a table reporting their extension in hectares and % in terms of the surface in the year 2000. Subsequently, the respondents were provided with a list of the LULCC, divided into three different categories according to the classification described in
Section 2.2 (i.e., persistences, agricultural conversions and net transformations), and asked the following question:
Q1. What potential effects on the sustainable development of the Gargano region can be anticipated as a result of the following LULCC which occurred between 2000 and 2018? (Possible answers: very negative; negative; slightly negative; none; slightly positive; positive; very positive).
It should be borne in mind that Q1 is not a simple question as it requires the respondents to perform an assessment of each single LULCC listed.
Subsequently, the respondents were asked to assess the LULCC drivers with respect to their ability to generate some land use changes in abstract (Q2) and their capability to produce specific LULCC (Q3):
Q2. To what extent have these factors contributed to causing one or more of the described ‘changes’ (persistences, agricultural conversions, or net transformations)? (Possible answers: not at all, they were a collateral cause of marginal importance, they were a relevant contributing factor, they were the main cause, they were almost the sole cause).
Q3. If the following factors have, in some way, contributed to causing the changes indicated in the columns, check the boxes in the corresponding intersections.
As with Q1, Q2 and Q3 are complex questions requiring a reiterated task to the respondent. Q2 has 31 responses (the number of the drivers identified), and Q3 has even a greater number as it requires the comparison of each driver with each LULLC reported from the analysis.
3. Results
3.1. Geospatial Analysis
Table 3 summarizes the geospatial analysis whose results have been aggregated in three land cover macro categories, namely, artificial surfaces, agricultural areas, and natural areas, with a breakdown of agricultural areas into three main sub-categories. The information reported relates to the extension of the categories’ surface in the year 2000 (column a), the loss and the gain of the surface (respectively, columns b and c) in the period 2000–2018, the balance of that period (column d) and the new extension in 2018 (column e).
The first result relates to the remarkable increase in the artificial surface, which, in 2018, was 22% more extended than in 2000, with a net gain of almost one thousand ha. This is especially due to the expansion of urban areas, industrial facilities, port construction, extraction activity and the building of sport and leisure facilities. The loss of 26% of the surface is largely an internal conversion especially related to the transition from different kinds of urban areas and the transformation of some discontinuous urban areas in industrial sites or leisure facilities.
On the contrary, the agricultural areas lost about 3.6 thousand hectares passing from 71 to 67 and reducing by about 5%. This reduction is mainly due to a sharp decline in pastureland, which lost more than 78% of its original surface, and due to the downgrading of heterogenous areas. These two categories declined by more than 5.6 thousand hectares overall, especially in favor of natural areas. At the same time, there has been a significant increase in the areas with more intensive agricultural activity, such as that pertaining to arable soil and permanent crops, gaining more than 1.5 thousand ha.
Another relevant result concerns the extension of the natural areas with a net gain of 2%, corresponding to 2.700 hectares, which have been recolonized by spontaneous vegetation. A large part of the loss and gain for this macro category occurred between internal subcategories and can therefore be conceived as internal conversions. Most of the transformations that affected natural areas in the period 2000–2018 involved surfaces used for agricultural purposes (4.8 thousand ha). Of these, almost half, about 2.4 thousand ha, underwent a sort of hybridization, transitioning from natural areas to heterogeneous surfaces with the following CORINE Land Cover label: “Land principally occupied by agriculture, with significant areas of natural vegetation”. Another thousand hectares were converted into arable land. On the other hand, during the same period, natural areas withdrew 7.6 thousand hectares from agricultural uses. This explains the net increase in natural areas.
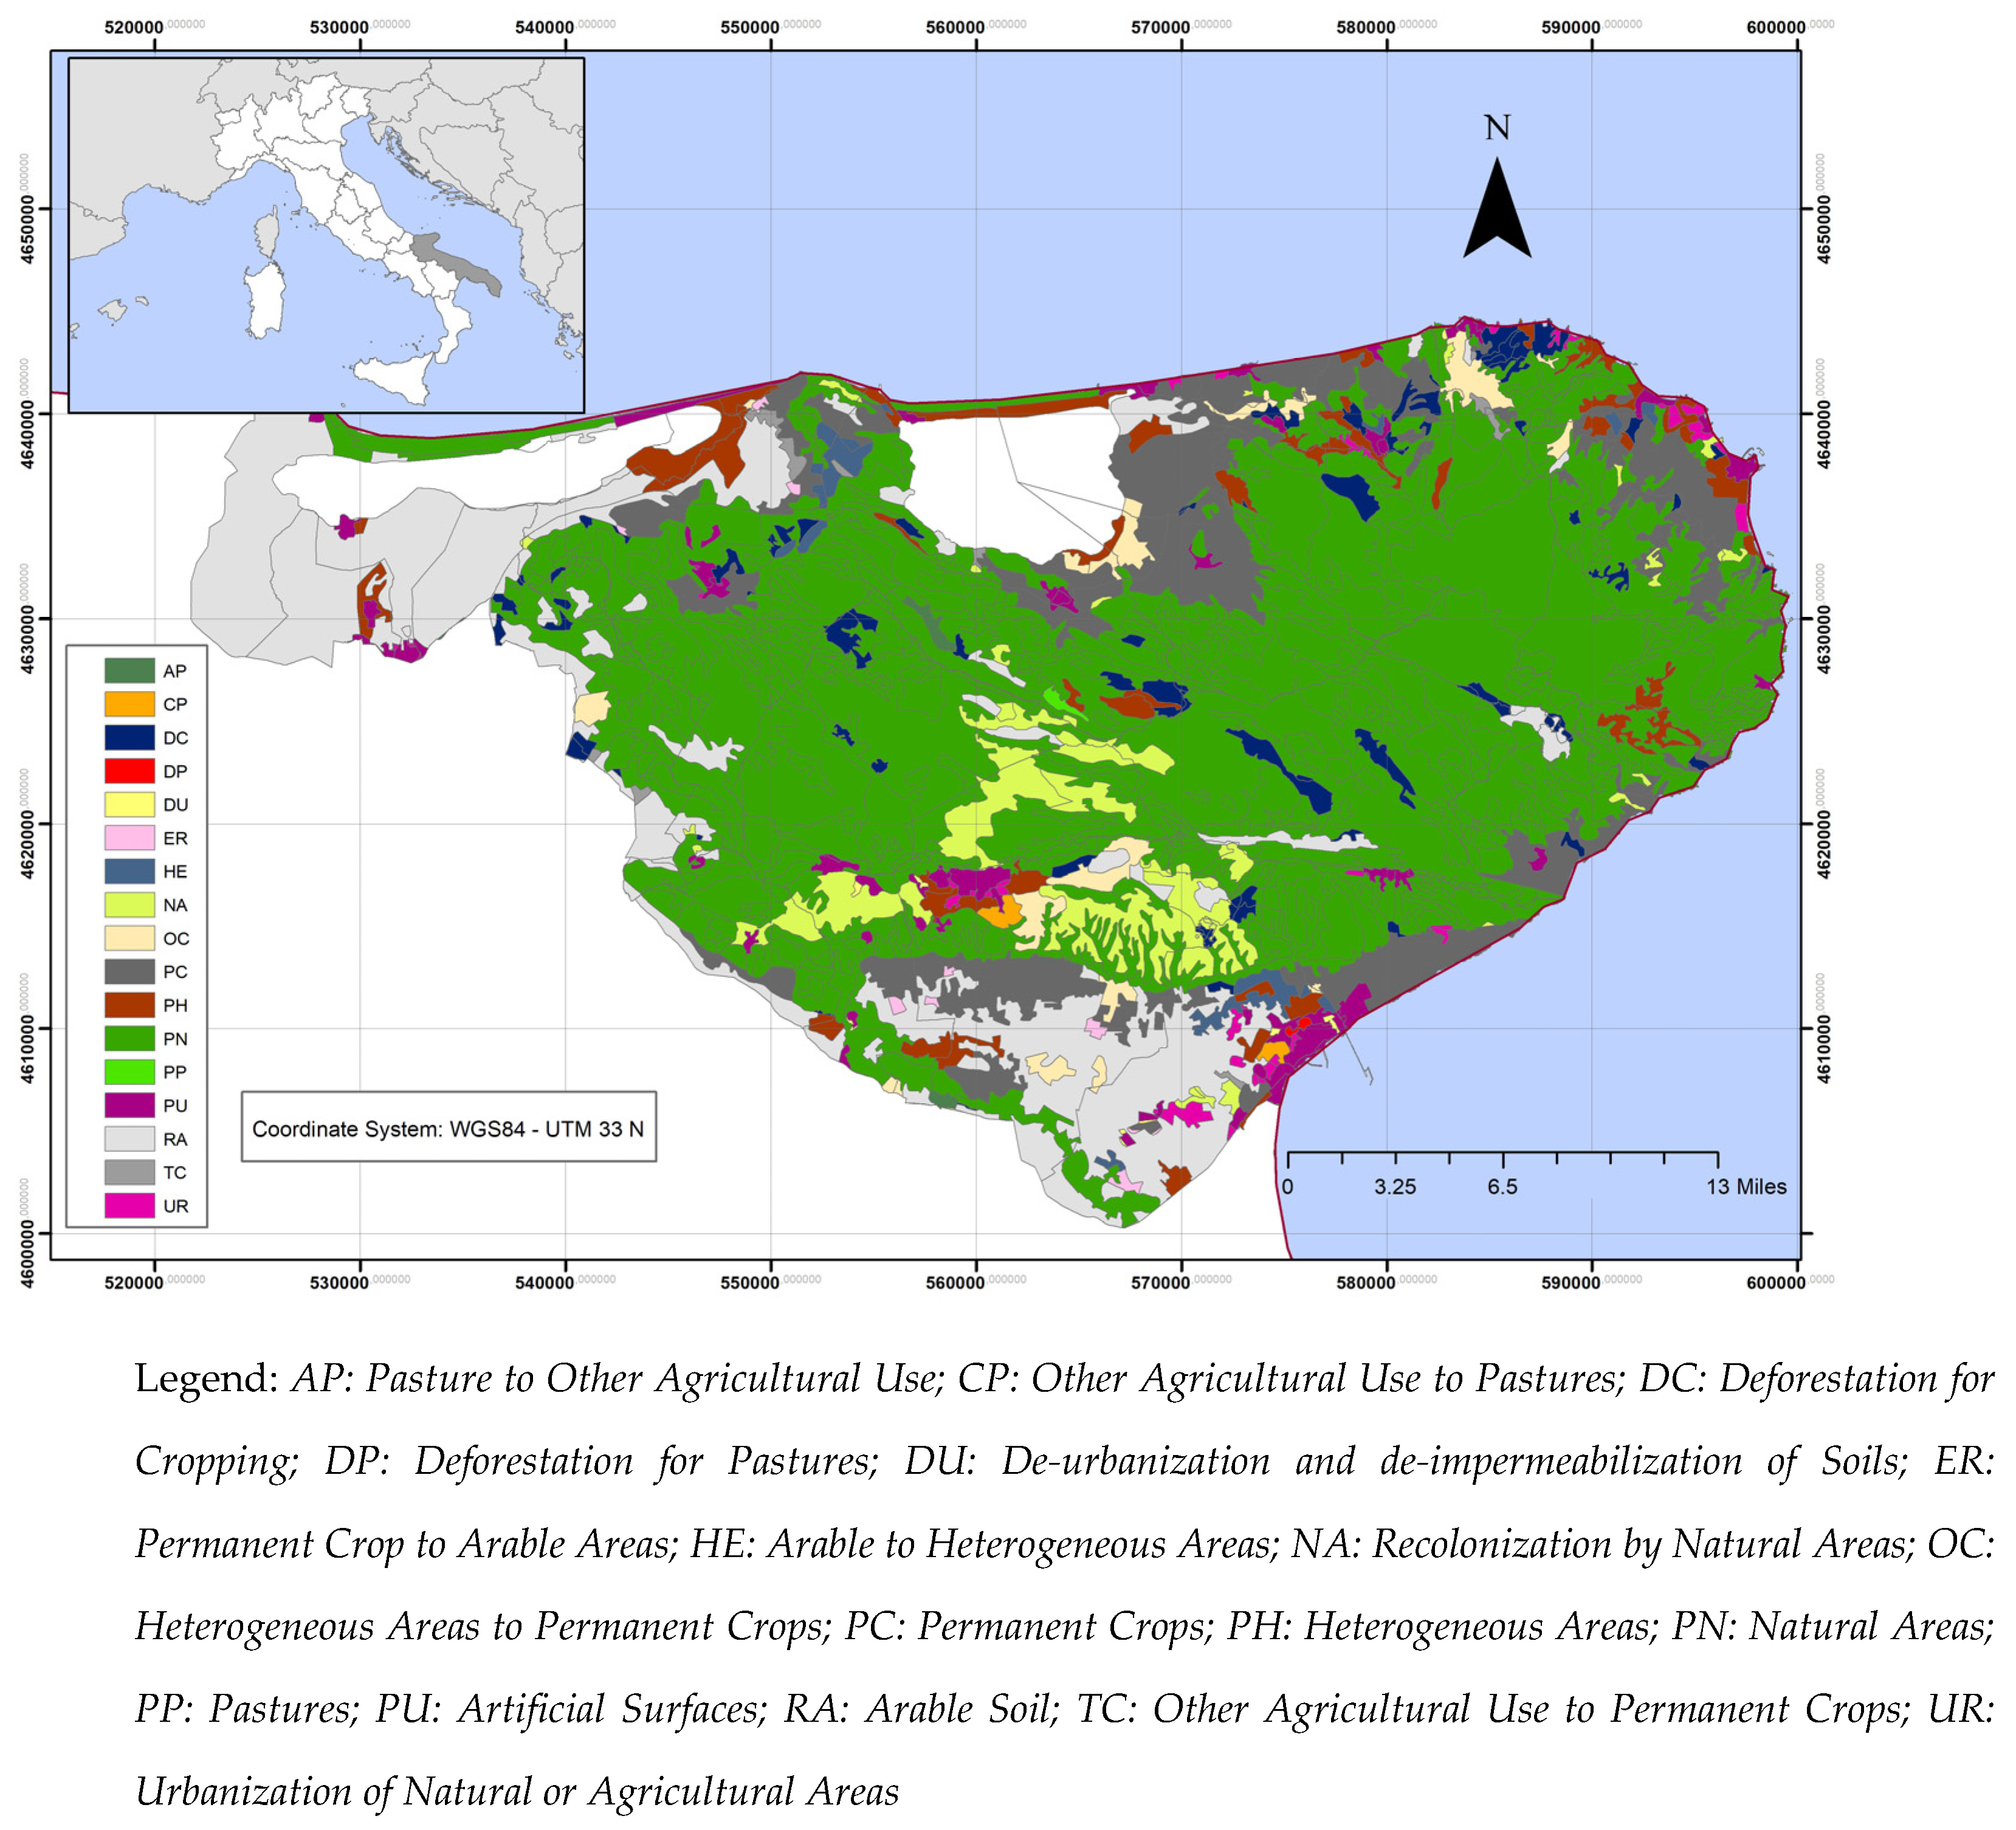
These results are the effect of the transformation dynamics that occurred in the period 2000–2018 in terms of (i) persistences, (ii) agricultural conversions, and (iii) net transformations. These dynamics are reported in
Table 4 which accounts for the surfaces affected by each specific change category in the two reference years: the surface that, in 2018, was affected by the specific change is reported both in absolute terms (expressed in hectares) and in relative terms compared to the extension that, in 2000, was classified in that same category
1. A graphical representation of the data reported in
Table 2 is provided by the map shown in
Figure 1.
Regarding the
Persistences, the analysis reveals that, for the most part, the various land uses have been retained substantially to the same extent in the analyzed period. This is certainly true for the artificial surfaces (PU), which have a persistence of 97%.
Figure 1 shows that the persistence of natural areas (PN) is undoubtedly the most significant in terms of absolute surface quantities, seeing that green, the color indicating the persistence of natural areas, is the dominant color in the map, representing more than 106 thousand ha. Arable soil and permanent crops have also remained quite stable. In contrast, the heterogeneous areas and especially the pastures have undergone a significant transformation, with a low or very low persistence of 46% and 5%, respectively.
Partly, this is due to the Agricultural Conversions: 262 hectares of pastures (about 11% of the land extension in 2000) have been converted to other agricultural uses. Heterogeneous areas have also changed, yielding a substantial 3 thousand hectares (21%) to permanent crops and receiving 1.5 thousand hectares from arable surfaces.
As for the Net Transformations, the most significant one involves the conversion of areas previously destined for other purposes that have been reclaimed by nature. This amounts to over 7.6 thousand hectares subtracted almost exclusively from agricultural uses, comprising 55% (4.2 thousand ha) from heterogeneous areas, 25% (1.9 thousand ha) from pastures, and 15% (1.17 thousand ha) from arable surfaces. The analysis of net transformations highlights another major change represented by deforestation for cropping. In 2000, there were 4.8 thousand hectares of forestland that became agricultural cultivations in 2018. Finally, the urbanization of natural or agricultural areas covers an area of more than 1000 hectares, the majority of which (approximately 90%) were previously used for agriculture.
3.2. Assessment of Land Use Drivers
The information collected from the experts is summarized in
Table 5 and
Table 6. The former is dedicated to the analysis of the drivers’ ability in generating the LULCC. The data reported derive from questions
Q2 and
Q3 described above. The possible responses to question
Q2 were transformed into numbers using the following scoring:
not at all = 0, they were a collateral cause of marginal importance = 1, they were a relevant contributing factor = 2, they were the main cause = 3, they were almost the sole cause = 4. The “Degree of Causality” column in
Table 5 reports, for each driver, the average of the scores it received from each respondent. As this variable is based on the question concerning the extent to which drivers contributed to the observed changes, this value can be regarded as a measure of the drivers’ propensity to generate one or more changes. The columns “# of Changes Caused” and “# of Experts Agreeing on Average” synthesize the responses to
Q3. The first reports the number of different LULCCs caused by each driver according to the experts’ views and is a sort of measure of the effectiveness of the drivers; the second indicates, for each driver, the average number of experts who identified it as a possible cause of the affected LULCC and is a measure of the intensity, perceived by the experts, of the drivers’ action. The details of the information collected with Q3 are reported in
Appendix A.
Among the physical and anthropogenic drivers, the one perceived as the most responsible (Degree of Causality 1.81) for producing LULCC is D13 Topography. It refers to the physical characteristics of the terrain and the morphology of the landscape, which, in the Gargano area, exhibit a significantly diversified territorial pattern with pronounced altimetric gradients, a distinctive mountainous coastline, and extensive forest cover. These elements are evidently perceived as particularly impactful on decisions regarding territorial organization by the interviewed experts. This driver has been identified as the cause of 13 LULCCs with a high level of agreement among the interviewed experts.
Within this group of drivers, D5 Agricultural Extensification (expansion of cultivated areas with lower input intensity) also plays a prominent role, being perceived as potentially responsible for 16 LULCCs, although with a lower causality than D13 but with an even higher level of agreement among the experts. D3, which pertains to the modernization of agriculture, is also a significant driver, gathering the highest convergence among the interviewed experts (3.38) and influencing 13 changes.
Finally, in this category, a mention should also be made of D9 Bushfire, D12 Soil Type and Fertility, D2 Population Growth Urban, and D7 Improved Crop Varieties as being among the major driving forces behind LULCC in Gargano.
Among the socio-economic drivers, there is the one exerting the highest degree of causality overall: D18 Labor Shortage, with an index of 2.09. It is perceived to be the potential cause of 14 changes by an average of three experts. Other indicative drivers associated with a negative socio-economic trend are among the major contributors to land use changes in the Gargano area. These include D17 Migration and D23 Poverty of Rural Farmers, evidently seen as obstacles to maintaining adequately remunerative agricultural activities.
Within the socio-economic factors, there are also drivers representative of the effects of agricultural policy, such as D30 National Agricultural Programs and D31 Fertilizer Subsidies which are conceived as potentially very effective in terms of land use change by the experts.
Table 6 is based on the information from
Q1. For this question, the responses have been encoded into numbers as follows:
Very negative = −3; Negative = −2; Slightly negative = −1; None = 0; Slightly positive = 1; Positive = 2; Very positive = 3. For each LULCC, the table reports the sum of the scores assigned by respondents. This method of aggregation facilitates the interpretation of results, as conflicting connections with opposite signs will result in a decrease in the effect, while agreement reinforces the effect, producing an overall collective picture.
From this table, it emerges that Persistences are seen as substantially positive. PN Natural Areas, which also exhibit the maximum extension, shows the highest score. In other words, among the land cover categories, it is most strongly associated with the sustainable development of the area according to the experts’ perception. This is consistent both with the concept of sustainability itself, which sees the conservation of resources, especially natural ones, as its main operation, and with the purpose of the area: since it is mostly covered by a National Park, it is institutionally a protected area. At the same time, the maintenance of agricultural areas, denoted by RA Arable Soil and PC Permanent Crops, is considered another essential element of the area’s development path.
On the contrary, Net Transformations are generally perceived as negative in terms of sustainable development. DC Deforestation for Cropping, DC Deforestation for Cropping, and DP Deforestation for Pastures are considered warning signs to monitor closely. An exception is DU De-urbanization and De-impermeabilization of Soils, which, with a score of 15, is considered a positive element from the perspective of sustainable development for the area.
Finally, from the analysis of Agricultural Conversions, a clear message emerges: heterogeneous areas and pastures are considered important indicators of the socio-economic and ecological balance of the territory. Their reduction in favor of other agricultural arrangements (ER Permanent Crop to Arable Areas and AP Pasture to Other Agricultural Use) is seen as a potential threat, as evidenced by the strongly negative scores they accumulate. Conversely, their expansion (HE Arable to Heterogeneous Areas and CP Other Agricultural Use to Pastures) is viewed favorably in the context of sustainable development.
4. Discussion
The
Table A1 (
Appendix A) cross-references the drivers with the LULCC, allowing for the identification of the drivers that may have a greater influence on the sustainable development of the territory. These are, in particular, the factors causing the most impactful changes according to the experts’ views. As explained, among these changes, there are
DC: Deforestation for Cropping and
UR: Urbanization of Natural or Agricultural Areas. Concerning the former, the experts identified
D3 Agricultural Intensification: Modern and
D7 Improved Crop Varieties with an agreement of the 63% and 45%, respectively, as possible causes. Other relevant drivers for this change potentially harmful to sustainable development, each identified by 27% of experts, are
D21 Customary Land Tenure System,
D26 Credits by Family, Bank, Government or NGO,
D29 Governmental Laws, and
D31 Fertilizer Subsidies. At the same time,
UR: Urbanization of Natural or Agricultural Areas is influenced by
D2 Population Growth Urban (72%) and
D22 Economic Rising Living Standard.
On the other hand, D13 Topography, D17 Migration, D18 Labor Shortage, and D20 Level of Education, identified by 36%, 54%, 36%, and 36% of experts, respectively, are considered factors influencing the persistence of PN Natural Areas. D17, D18, along with D5 Agricultural extensification, are important drivers also for another sensitive change, DU De-urbanization and De-impermeabilization of Soils.
Given the above, we debate the potential implications that these land use changes may have on fragile ecological balances of the territory and community livelihoods. As for the former, ecological risks take the form of soil erosion, dry lands, water shortage [
53] and biodiversity loss [
54]. These imbalances would, in turn, affect the benefits provided by ecosystem services on nearby communities [
55,
56,
57]. As for the latter, land use changes would alter food and livelihood production and security [
58,
59] and make smallholder farmers more vulnerable to climate variability or income sources so as to alter the original agricultural production into modern and ‘touristic-oriented’ farmhouses [
60].
Nonetheless, these latter transformations ultimately attract new job opportunities [
61], reshape social inclusiveness and social innovation in rural and peri-urban areas [
62,
63], emphasize existing cultural traditions [
64,
65], reduce outbound youth migration [
65,
66], strengthen cooperation among farmers and capitalize on local competitive advantages [
67,
68].
Therefore, land transformations, as a result of human activity, could also have severe impacts on the supply of land and generate conflicts in the local community spanning from private interests and income generation to conservation and restoration goals [
69,
70], thus resulting in diverse land configurations of the territory. Also, agricultural intensification and expansion over time has led to degraded ecosystems, thus affecting soil depletion, overexploitation and loss of the resilience of agro-systems [
71].
Identifying the underlying drivers of the above dynamics is crucial for determining the actions to be taken to guide the LULCC process along desirable development trajectories. In this regard, the present work provides an insightful framework, enabling the distinction of drivers that require attention depending on whether the goal is to (i) control the most concerning LULCC or (ii) promote those that are more desirable.
Factors such as agricultural intensification and other agricultural support policies are among the first group, as they are perceived as potential sources of pressure on the natural component of the territory. On the other hand, these drivers (e.g., improved crop varieties, services provided by extension officers, national agricultural programs, fertilizer subsidies) counteract abandonment, which is promoted by the customary land tenure system and its land ownership fragmentation effects. These drivers play, therefore, a crucial role in the balanced development of the territory.
In the second group, there are drivers like topography, which makes certain areas inaccessible and remain naturally untouched, and other factors such as the level of education and the agricultural extensification process.
Some policy implications that favor a more desirable land cover directly stem from these facts:
- ▪
Supporting agriculture through targeted measures and actions conditioned by compliance with environmental constraints;
- ▪
Addressing the fragmentation of land ownership with initiatives aimed at promoting or rewarding the concentration of agricultural lands;
- ▪
Supporting agricultural extensification by providing forms of diversification and income support for farmers;
- ▪
Promoting environmental awareness aimed at developing an understanding of the natural environment and the local archaeological, naturalistic, historical, and cultural heritage value.
In addition, to combat agricultural abandonment and the loss of important ecosystem services, such as food production or soil fertility, the promotion of ad hoc ‘proximity agriculture’ and 0-km products and cuisine would reduce market asymmetries and sustain small farmers in the long run to ensure the economic viability of local agricultural production [
72]. Further policy measures such as offering payments to farmers’ initiatives (such as crop rotations, biodegradable soil covers) for the preservation of land and natural resources would help promote sustainable practices of the local agriculture.
The Regional Authority [
73] has recently welcomed the latest European Union ‘Farm to Fork’ strategy, which rewards farmers for promoting adequate sustainable practices, creating further opportunities for the ecological transition of agri-businesses that are beneficial to local communities. [
74,
75].
Another value added of the present study is the reproducibility of the employed methodology to similar areas—e.g., other Mediterranean or EU countries—such that the insights deriving from this study can be beneficial in other contexts, other than providing homogeneity of comparisons across regions.
Some limitations of this study are the limited number of experts interviewed; the potential errors occurred in the GIS analysis, especially in areas prone to difficult identification, such as heterogenous or borderline areas; the use of a questionnaire to collect the information, as this facilitated quick data collection, on one hand, but limited the depth of explanations on the other; and the effort required of respondents hindered the collection of additional but relevant information, such as a specific quantification of the causal relationship between drivers and changes.
The next steps include the following: to increase the number of experts to bring additional perspectives; to broaden the temporal analysis by incorporating additional data points along the timeline to achieve a more precise trend assessment; to extend the analysis to quantify the drivers, as many of them can be operationally defined as variables using the latest data from the most recent census; to advance beyond expert perception and establish quantitative causal relationships; to conduct a comparative analysis of the perceptions of different stakeholders to capture diverse viewpoints on the LULCCs that have occurred and on future trends; and to extend the survey to include the perception toward LULCC of the farmer population of the area to quantitatively assess the causal relation between drivers and LULCC.
5. Conclusions
This study delved into the understanding of crucial aspects of land use and land cover change by identifying the major transformations that occurred in the area of Gargano in the period 2000–2018 and exploring the influential factors that played a pivotal role in driving these transformations. This work represents a preliminary analysis of the Gargano region’s evolving land use as a foundational step in its exploration.
The analysis revealed that the area has experienced micro-changes, with a predominant portion characterized by persistences. These persistences, particularly in natural areas and agricultural activities, are perceived positively, signifying their potential contribution to the area’s future sustainable development. More precisely, natural areas have, in general, experienced an increase in the overall surface, despite relinquishing nearly 5 thousand hectares to agriculture and another thousand to urbanization in the period analyzed, as they reclaimed, in the same period, more than 7.5 thousand hectares. It is worth highlighting the importance experts gave to pastures and heterogeneous areas which emerged as significant indicators of the socio-economic and ecological equilibrium of the area: their variations are considered relevant with reductions viewed as potentially detrimental and increases perceived as advantageous in terms of sustainable development. At the same time, urbanization and deforestation emerged as focal points of major concern, reflecting the heightened sensitivity surrounding these transformative processes.
Finally, with an eye to the broader field of rural land use change, the understanding of micro-transformations that occurred in the Gargano area, addressed in the present study, help the decision-making authority to reduce long-term asymmetries in view of adopting ad hoc strategies for land use changes and meeting the green transition more rapidly in the immediate future.


 ,
, 

