Article

Impact of Urbanization on the Sustainable Production of Regional Specialty Food: Evidence from China’s Potato Production

1
School of Economics and Trade, Shandong Management University, Jinan 250357, China
2
School of Economics and Trade, Henan University of Technology, Zhengzhou 450001, China
3
Center of High-Quality Development Research, Beijing Academy of Science and Technology, Beijing 100009, China
4
Institute of Geographic Sciences and Natural Resources Research, Chinese Academy of Sciences, Beijing 100101, China
5
College of Architecture and Landscape, Peking University, Beijing 100871, China
*
Authors to whom correspondence should be addressed.
Land 2024, 13(2), 147; https://doi.org/10.3390/land13020147
Submission received: 22 December 2023 / Revised: 20 January 2024 / Accepted: 22 January 2024 / Published: 26 January 2024
(This article belongs to the Special Issue Agricultural Land Use and Rural Development)

Abstract

:
The rapid urbanization process has gradually deepened its role in the sustainable development of agriculture, especially in the sustainable supply of food in poor areas, and has attracted more attention from international academic circles. However, the impact mechanism of different dimensions of urbanization on food sustainability in poor areas has not yet been fully unpacked. Therefore, this study focuses on potatoes as a specialty food mainly grown in poor areas of China, explores the impact mechanism of urbanization on the carbon emission intensity of potato production (CEIPP) with the spatial Durbin model, and compares with the carbon emission intensity of staple grain (CEISG) results. The main conclusions are as follows: the urbanization of main potato-producing areas developed rapidly from 2002 to 2020, which is in line with the decrease in CEIPP. The decrease in CEIPP has a significant impact on slowing down the growth of total carbon emissions and has greater potential for reduction, especially in Central and Western China, which has a large poverty-stricken population. Compared with traditional staple grain, urbanization has become a key factor influencing CEIPP. The results indicate that different dimensions of urbanization have varying degrees of impact on the sustainable production of regional specialty foods in China. The improvement of comprehensive urbanization, population urbanization, and economic urbanization reduces CEIPP, while land urbanization increases CEIPP. Therefore, to reduce CEIPP and promote its sustainable development, it is necessary to improve population urbanization and economic urbanization, properly avoid the disorderly expansion of land urbanization, and improve the quality and level of comprehensive urbanization.

1. Introduction

Recent climate change, frequent pests and diseases, COVID-19 pandemics, and regional conflicts have posed serious challenges to global food security, threatening the lives and livelihood of people in all countries around the world, especially those in vulnerable groups [1,2,3], and may lead to a failure to achieve the “zero hunger” goal (SDG 2) on schedule [4]. In 2019, 144 million children under the age of five had developmental delays due to hunger and malnutrition [5], and 47 million children were emaciated [6]. Children with developmental delays are mainly found in Asia and Africa, accounting for 95% of the world total [7]. Meanwhile, urbanization in poor areas such as Asia and Africa has also rapidly increased. The rapid urban sprawl promotes not only economic development but also generates enormous environmental burdens and ecological pressures, leading to a series of ecological and environmental problems [8,9]. Does the ecological environment, especially carbon emissions caused by urbanization, affect food production in poor areas? What is the impact mechanism of the rapid urbanization process in poor areas on the sustainable development of regional food? This paper attempts to discuss these issues.
According to gradient theory, the rural population flows massively to cities during urbanization [10,11], and the land scale expands in a disorderly manner, leading to the restructuring of production factor inputs [12], changes in food production methods [13], and technological efficiency [14,15]. This exacerbates the aging of the rural population [16] and leads to the loss of arable land, structural shortage of labor, and the non-agricultural conversion of farmland [17,18,19], which ultimately affects regional food security [20]. Urbanization also promotes the growth of farmers’ non-agricultural income and the diversification of agricultural product consumption structure. This results in non-agricultural conversion of grain production structure [21], which has a crowding-out effect on grain production. The regional imbalance in urbanization causes a serious imbalance in food production [22]. Meanwhile, urbanized areas are generally leaders in the comprehensive green and low-carbon transformation of the economy and society, as well as in the innovation and promotion of green and low-carbon technologies, so they play a crucial role in promoting carbon reduction and improving carbon emission efficiency.
China has experienced the most massive urbanization in human history in the past 40 years. The urban permanent population has increased by 730 million, and the urbanization rate has increased from 17.9% in 1978 to 50.0% in 2010 and then surged to 65.2% in 2022 [23]. Joseph E. Stiglitz observed that the two most significant events of the 21st century were technological progress in the United States and urbanization in China, which fully demonstrates the historical significance and profound impact of urbanization in China [24]. There is no denying, however, that urban population growth and regional expansion in areas with high poverty rates may be more likely to cause systemic damage to the food system. Against the dual background of China’s new urbanization and rural revitalization, the transformation of agricultural production in poverty-stricken areas not only requires attention to the future livelihood status of small farmers [25] but also actively explores ways to achieve sustainable agricultural development.
Potatoes are more stress-resistant, environment-friendly, and more widely used compared with traditional staple grains. They play an important role in increasing grain production and farmers’ income, as well as improving soil, making significant contributions to ensuring sustainable food security in poor areas. Due to the above advantages, potatoes have become the third largest food crop for global cultivation and consumption [26]. Global statistics show that Asian countries are becoming regions with strong growth in potato production [27], and potato production in China has also experienced stable growth for nearly half a century [28]. It has initiated the strategy of developing potatoes as a staple food since 2014 [29] to promote the cultivation and consumption of potatoes [30]. The advantageous potato-producing areas in China are located in Northwest and Southwest China, with a trend of spatial concentration [31]. Urbanization in Central and Western China has accelerated in recent years, driven by major strategies such as the Western Development Strategy and the construction of the “Belt and Road”. However, the typical characteristics of the environment in these regions include many unfavorable factors [32], making it easier for them to concentrate on poverty-stricken populations [33]. Therefore, a comprehensive analysis and assessment of the impact of urbanization in poor areas on carbon emissions from potatoes, as well as food security, is of great significance for a correct understanding of the relationship between urbanization and sustainable food production.
Urbanization is changing the food systems of countries around the world. Previous research on the impact of urbanization on food security has mainly focused on individual aspects of food production or consumption [34,35], with little attention paid to the analysis of urbanization on sustainable food production. Moreover, there is a lack of exploration of the relationship between urbanization and low-carbon production of specialty food in poor areas. Firstly, this study matched the distribution of main potato-producing areas with poverty-stricken counties in China and used the staple grain-producing areas as a control to determine the area of research of this study. Secondly, the urbanization levels and carbon emission intensity of potato production (CEIPP) were calculated based on the multi-dimensional urbanization framework of “economy-population-land”, and an improved potato production carbon emission model, and then evolutions of their spatiotemporal patterns were analyzed. Thirdly, the impact mechanism of urbanization on CEIPP was explored with the spatial Durbin model (SDM). A comparison was made with the results of carbon emission intensity of staple grains (CEISG) to highlight the significance of this study in achieving sustainable food production in poor areas. Finally, targeted urbanization strategies are proposed. The study is also expected to provide empirical references for other middle-income or developing countries and ultimately contribute to achieving global food security and sustainable development.

2. Materials and Methods

2.1. Construction of Urbanization Indicators

Urbanization is a very complex economic phenomenon, which not only means the flow of rural population to cities but also implies changes in lifestyle, land use, and economic development models. This study measures urbanization with indicators of three dimensions: population urbanization (PU), land urbanization (LU), and economic urbanization (EU). Based on this, this paper proposes the concept of a whole set of variables by drawing on Li [36] and obtains the indicator of comprehensive urbanization (CU) by combining the Analytic Hierarchy Process and Entropy Method. Referring to Liu et al. [37], this study defines the indicators of urbanization as follows: PU mainly measures the proportion of the urban population to the total population at the end of each year in each province, LU measures the proportion of built-up areas to the administrative area in each province, and EU measures the proportion of the output value of the secondary and tertiary industries to the GDP in each province.
The weight coefficient of CU is obtained by combining the Analytic Hierarchy Process and Entropy Method, and the comprehensive weight is expressed as:
w i = ( w i a × w i b ) 1 / 2 i = 1 n ( w i a × w i b ) 1 / 2
where w i a is the weight obtained through the Entropy Method, and w i b is the weight obtained through the analytic hierarchy process.
w i a = ( 1 e j ) / j = 1 n ( 1 e j )
e j = 1 ln ( m ) i = 1 m p i j ln p i j
p i j = a i j / i = 1 m a i j
a i j = x i j M i n ( x j ) M a x ( x j ) M i n ( x j )
where p i j is the characteristic proportion of evaluation object i under indicator j, e j is the entropy value of indicator j, a i j is the standard value of positive indicators, and max (xj) and min (xj) represent the maximum and minimum values in indicator j, respectively.
w i b = 1 n j = 1 n ( b i j / k = 1 n b k j )
B = ( b i j ) n × m
where, bij represents the importance of i.

2.2. Calculation of Carbon Emission

Carbon sources of potato production can be classified into six categories: fertilizers, pesticides, agricultural plastic films, diesel fuel consumption, crop irrigation, and tillage. Therefore, the formula of total carbon emissions from potato production (TCEPP) and CEIPP is:
T C E P P i = γ = 1 E i , γ = γ = 1 ( δ i , γ T i , γ ) + E i A C H + E i I C R
C E I P P i = E i t o l / Y i
where T C E P P i is the total carbon emission of potatoes, Y i is the production of potatoes, E i , γ is the emission of carbon source γ , T i γ is the usage (or production) of each carbon source, and δ i , γ is the carbon emission coefficient of each source. C E I P P i is obtained by dividing total carbon emission by production. E i j A C H is carbon emission from pesticides. E i I C R is carbon emission from irrigation and drainage. In the context of ensuring food supply security, the continuous increase in potato production leads to an increase in total carbon emissions in the short term. Therefore, a study of the impact mechanism on CEIPP rather than on TCEPP is more in line with the concept of low-carbon transformation and sustainability of food production. Referring to Tian et al. [38], Zhang and Wang [39], and Wang et al. [40], corresponding emission coefficients are obtained for the following five types of carbon sources. The carbon emission coefficient of fertilizers is 0.897 kg/kg, pesticides 4.9341 kg/kg, agricultural film 5.180 kg/kg, agricultural diesel 0.593 kg/kg, and agricultural tillage 3.126 kg/hm2.
The formula for calculating the carbon emission from potato pesticides is:
E i j A C H = δ A C H ( C O S i j C H / P ¯ i j C H ) A R E i j
where E i j A C H refers to the pesticide carbon emission of potatoes in province j, and C O S i j C H refers to the pesticide cost per Chinese mu in province j, P ¯ i j C H is the average price of potato pesticides in province j, and A R E i j is the planting area of potatoes in province j.
The formula for calculating carbon emission from potato irrigation and drainage is:
E I R i j = [ ( C O S i j W A R i j ) / P E L j ] A R E i j
E i j I R C = P V j E I R i j δ c e
where E i j I R C is the carbon emission from irrigation and drainage of potatoes in province j, E I R i j is electricity consumption for irrigation and drainage in province j, C O S i j is the cost of irrigation and drainage in province j, W A R i j is water fees in province j, P E L j is the average cost of electricity for agricultural irrigation in province j, A R E i j is the planting area of potatoes in the province j, P V j is the proportion of thermal power in province j, δ c e is the carbon emission coefficient of standard coal, with a value of 0.69 (US Energy Information Administration, EIA), is the coefficient of converting electricity into standard coal, with a value of 0.1229 kg of standard coal/KWH (derived from the China Electricity Statistical Yearbook).

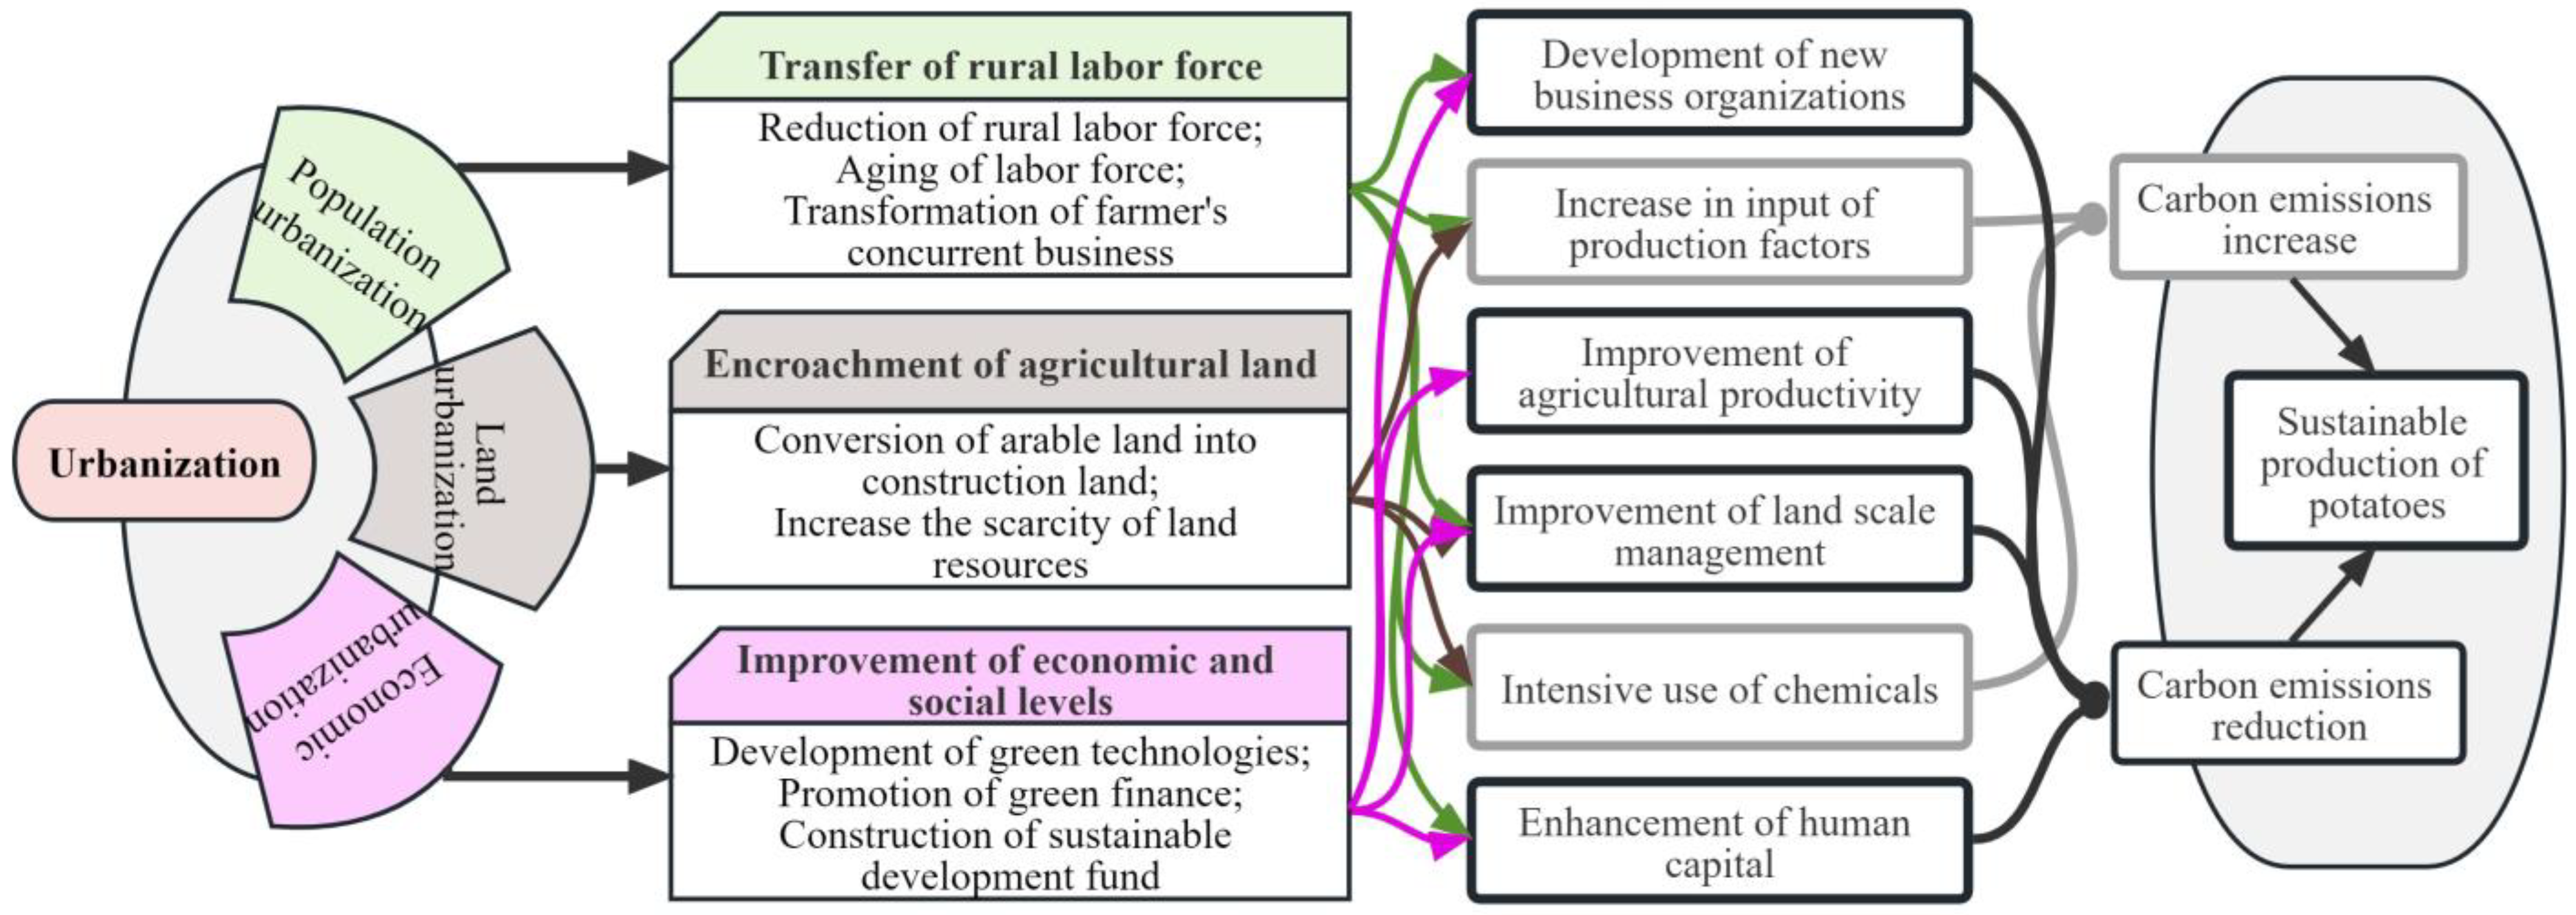
2.3. The Impact Mechanism of Urbanization on Carbon Emissions from Potato Production

This study draws on the research on the impact of urbanization on agricultural carbon emissions to explore the mechanism of its impact on carbon emissions of potato production. There is an inherent correlation between the changes in economic, social, and resource factors brought about by urbanization and the changes in carbon emissions from agricultural production [41,42]. Factors such as the transfer of rural labor to urban areas, the upgrading of residents’ consumption structure and the rapid development of rural areas driven by urban radiation may all lead to changes in agricultural productivity and resource utilization efficiency. Therefore, urbanization is an important factor affecting carbon emissions from agricultural production. Extensive research has been conducted on the relationship between urbanization and carbon emissions from agricultural land use, and it can be summarized that urbanization may affect carbon emissions in the following ways: (1) In terms of PU, urbanization promotes the transfer of agricultural labor. Employment in the primary industry in China has decreased from a peak of 390.98 million in 1991 to 177.15 million in 2021. After the successful rural reform, a large number of young and middle-aged rural laborers migrated to cities to work, leaving aged agricultural labor [43]. The reduction of agricultural labor has multiple impacts on carbon emissions. On the one hand, it increases land use intensity, with increased input of such factors as fertilizers and pesticides, which poses greater pressure on agricultural land carbon emissions. On the other hand, it promotes the development of new agricultural management entities and agricultural production trusteeship and expands the land management scale, which has a negative impact on the input of agricultural chemicals, thereby suppressing agricultural carbon emissions [44]. (2) In terms of LU, the massive expansion of urban land has encroached on agricultural land [45]. For a long time in the past, urbanization in China basically followed a path of outward expansion, characterized by high consumption, high emission, and high expansion, which is non-green extensive development [46]. This model has a high demand for new construction land. With cities constantly expanding to peripheral rural areas, a large amount of arable land is converted into construction land [47], intensifying the scarcity of arable land resources [48]. (3) In terms of EU, the rapid development of the secondary and tertiary industries provides technical and financial support for low-carbon agriculture. The improvement of technology and labor brought about by EU drives the improvement of agricultural productivity and promotes the transformation toward low-carbon and green agricultural production [49]. Based on the analysis above, the impact mechanism of urbanization on carbon emissions from potato production is shown in Figure 1.

2.4. Spatial Econometric Model

2.4.1. Moran Index

Spatial characteristics are important factors that must be taken into consideration in the study of urbanization [50]. The commonly used method for measuring spatial correlation is the Moran index, which includes the Global Moran Index and local Moran index. The former is used to analyze the overall spatial agglomeration, while the latter focuses on the spatial agglomeration in a region. This study uses the Global Moran Index to explore the spatiotemporal characteristics of CEIPP in China. The Global Moran Index is:
G M I = n S 0 i = 1 n j = 1 n w i , j z i z j i = 1 n z i 2 ;   z i = x i x ¯ ,   z j = x j x ¯
S 0 = i = 1 n j = 1 n w i , j ;   Z I = I E I V [ I ]
E I = 1 / n 1 ;   V I = E I 2 E I 2
where w i , j is the spatial weight. The value range of the Global Moran Index is 1,1 . Among them, a value greater than zero indicates a positive correlation, less than zero indicates a negative correlation, and zero indicates no correlation. A value close to 1 indicates clustering of identical attributes, while that close to −1 indicates clustering of distinct attributes.

2.4.2. Spatial Panel Model

A spatial panel model of provinces in China is constructed to explore the regional differences in the impact of factors on CEIPP, and to further analyze its impact mechanism. The spatial panel model is:
F i t = a + τ F i , t 1 + ρ w i F i t + β i j = 1 k X i , j , t + δ i w i j = 1 k X i , j , t + η t + μ i + ε i t ε i t = λ m i ε i + υ i t
where X i , j , t is the influencing factor j in a module in region i, w i is row i of the spatial weight matrix, and W is constructed to include distance weight, economic weight, and carbon emission weight, η t is time effect, ( μ i + ε i t ) is a composite disturbance term, mi is row i of the disturbance spatial weight matrix M. When τ 0 , the equation is a spatial panel model, and when λ = 0 , it is SDM.

2.5. Selection of Control Variables and Data Sources

2.5.1. Selection of Control Variables

Besides urbanization, there are many other factors affecting carbon emissions from food production. Some studies show that economic growth is an important factor affecting agricultural carbon emissions by verifying the inverted U-shaped relationship between agricultural carbon emissions and economic growth in China [37,51]. Agricultural soil and water resources and per capita arable land are inhibitory factors of agricultural carbon emissions [38]. Agricultural policies are negatively related to agricultural carbon emissions [39]. Agricultural technological progress and efficiency are considered important factors in suppressing carbon emissions [40], and agricultural carbon emissions are negatively correlated with mechanization [43]. The scale of agricultural land management has both direct and indirect impacts on carbon emissions [44]. These studies provide important references for the calculation of carbon emissions from potato production and the influencing factors analysis in this study.
Production technical efficiency (PTE) is calculated by drawing on the EBM model proposed by Tone [45], and this study takes potato planting area, direct cost, indirect cost, and labor quantity as input indicators and potato production as the output indicator. Compared with traditional DEA methods, the model advantages in relaxing the “proportional changes in factor inputs” assumption and makes the results more realistic. Per capita agricultural output (PCAO) is calculated by dividing the total agricultural output value by the number of employees in the primary industry. The proportion of disaster areas (PDA) is measured by the proportion of potato disaster-affected areas to total planting areas. Potato industrial structure (PIS) is measured with the proportion of potato output value to the total food output value. Agricultural openness (AO) is measured by the proportion of the total agricultural import and export value of each province to the added value of agriculture. Production agglomeration levels (PAL) are used in the location entropy calculation method, and the specific formula is PAL = (output value of potatoes of each province/total output value of each province)/(total output value of potatoes in the country/total output value in the country). The proportion of agricultural fiscal expenditures (AFE) is measured with the proportion of agricultural fiscal expenditures to the total regional fiscal expenditure. The proportion of environmental protection fiscal expenditure (EPFE) is measured with the proportion of environmental protection fiscal expenditure to the total regional fiscal expenditure.

2.5.2. Data Sources

Over 90% of the 592 national-level poverty-stricken counties in China grow potatoes, and 192 out of 393 main potato planting counties in China are nation-level poverty-stricken counties, which means there is a strong correlation between them, as shown in Figure 2a. This article draws on Li et al. [52] and selects 15 regions as the main potato-producing areas, including Hebei, Shanxi, Inner Mongolia, Liaoning, Heilongjiang, Hubei, Chongqing, Sichuan, Guizhou, Yunnan, Shaanxi, Gansu, Qinghai, Ningxia, and Xinjiang. Potato production in these 15 regions was 16.539 million tons in 2020, accounting for 91.97% of the total in China, so they are highly representative. Potatoes are more profitable than other staple grains in poor areas due to their strong adaptability and stress resistance. The “Guiding Opinions on Promoting the Development of the Potato Industry” has developed the potato industry into a specialty industry in Western China [53], helping poverty-stricken households to overcome poverty. In addition, data on the cultivation of Chinese staple grains (wheat, corn, and rice) are introduced to highlight the necessity of this study. Heilongjiang, Jilin, Liaoning, etc., are classified as staple grain-producing areas according to SCPRC [16]. The distribution of staple grain production in the main producing areas is shown in Figure 2b. In a comparison of a and b in Figure 2, it can be concluded that there are very few poverty-stricken counties in major producing areas of stable grain, while most poverty-stricken counties are located in non-major producing areas of stable grain. Therefore, a study of the carbon emissions from potato production in these regions is of great significance for promoting the achievement of SDG 1, SDG 2, and SDG 12. This study ultimately selects a sample from 2002 to 2020 to calculate TCEPP and CEIPP in 15 regions, including Hebei, Shanxi, Inner Mongolia, etc., due to the availability of data.
Data on potato planting areas, potato production, total population, urban population, rural population, agricultural disaster-affected areas, local fiscal expenditure, local agricultural fiscal expenditure, and local environmental protection fiscal expenditure are from the National Bureau of Statistics. Data on the input of potatoes are from the “National Compilation of Agricultural Product Cost and Benefit”. Data on employment in the primary industry, output value of the tertiary industry, GDP, built-up area, and administrative area are from statistical yearbooks of each province. The total food output value and potato output value come from the “China Rural Statistical Yearbook”. Data on the import and export volumes of agricultural products are from the China Customs database. The electricity prices for agricultural production are from the State Grid website (www.sgcc.com.cn, accessed on 5 February 2023). Diesel prices come from the Wind database. The guidance on the use of potato pesticides is from the Ministry of Agriculture and Rural Affairs of China, and data on the price of pesticides are from Century Pesticide Network (www.nongyao001.com, accessed on 7 February 2023). Value data, such as local fiscal expenditure, local agricultural fiscal expenditure, and local environmental protection fiscal expenditure, are deflated with deflators (GDP deflator, CPI deflator, agricultural product production price index, and agricultural means of production price index), taking 2001 as the base period to obtain comparable data. The descriptive statistics of the main variables are shown in Table A1.

3. Results and Analysis

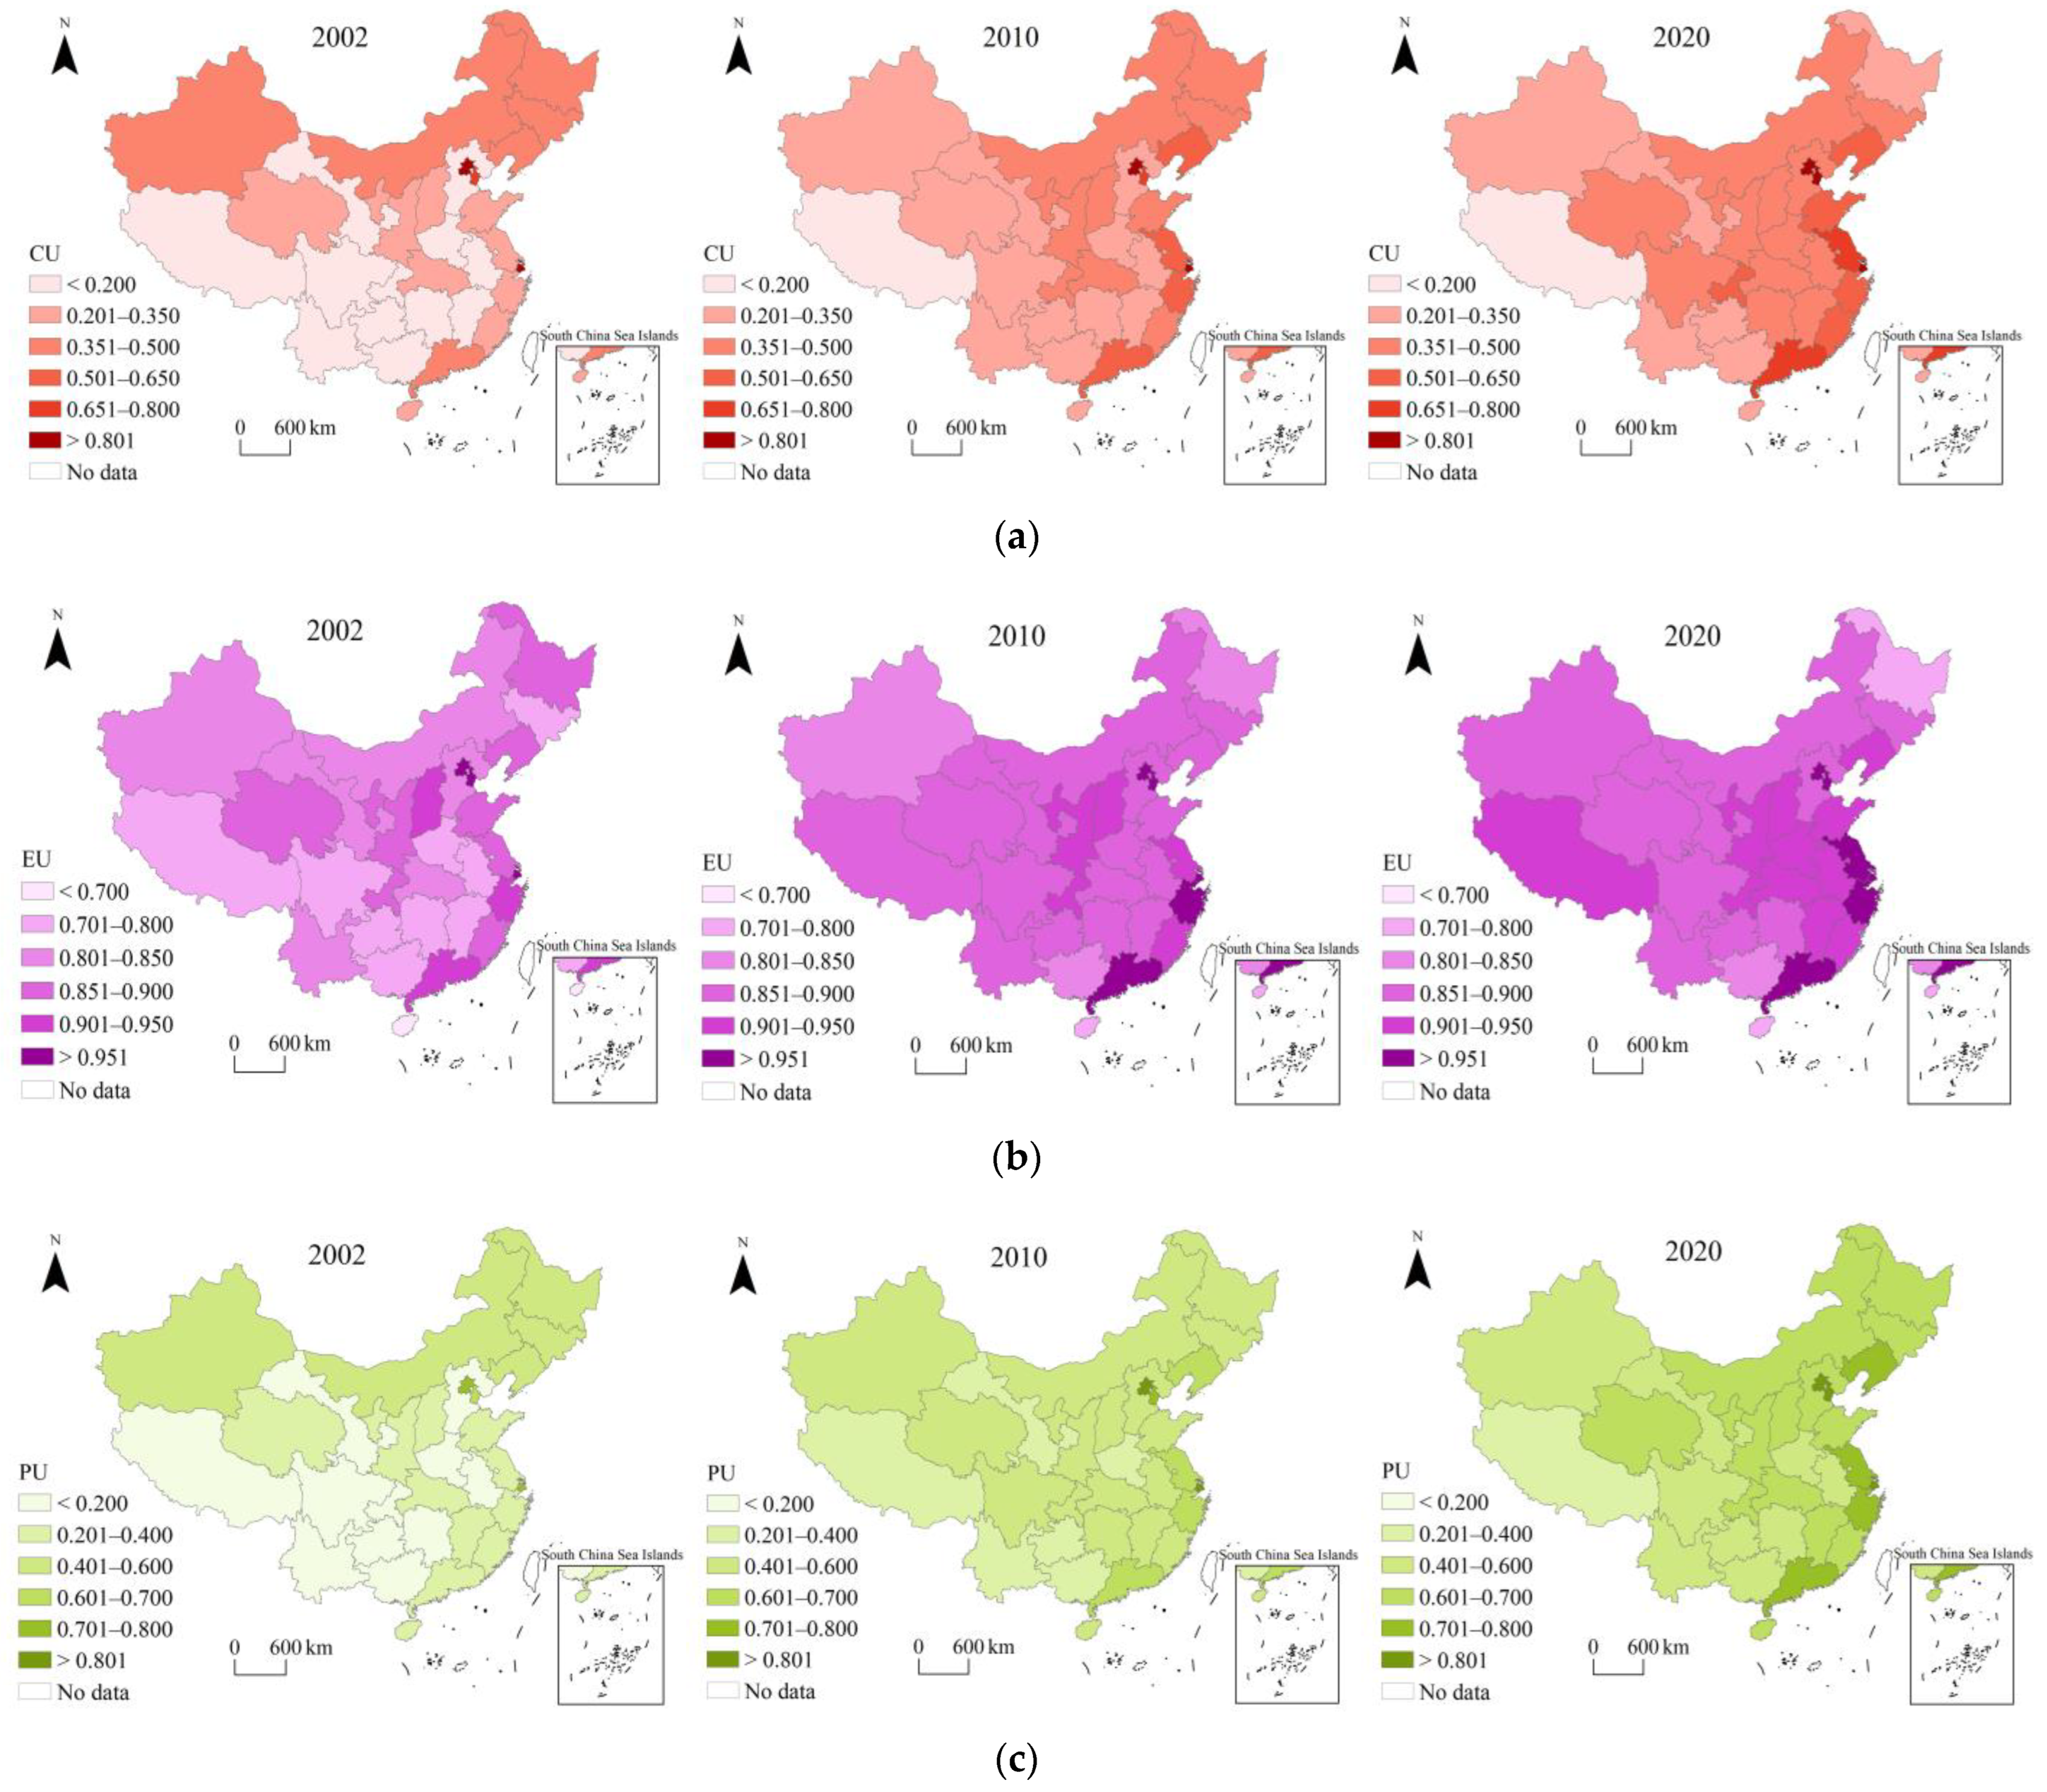
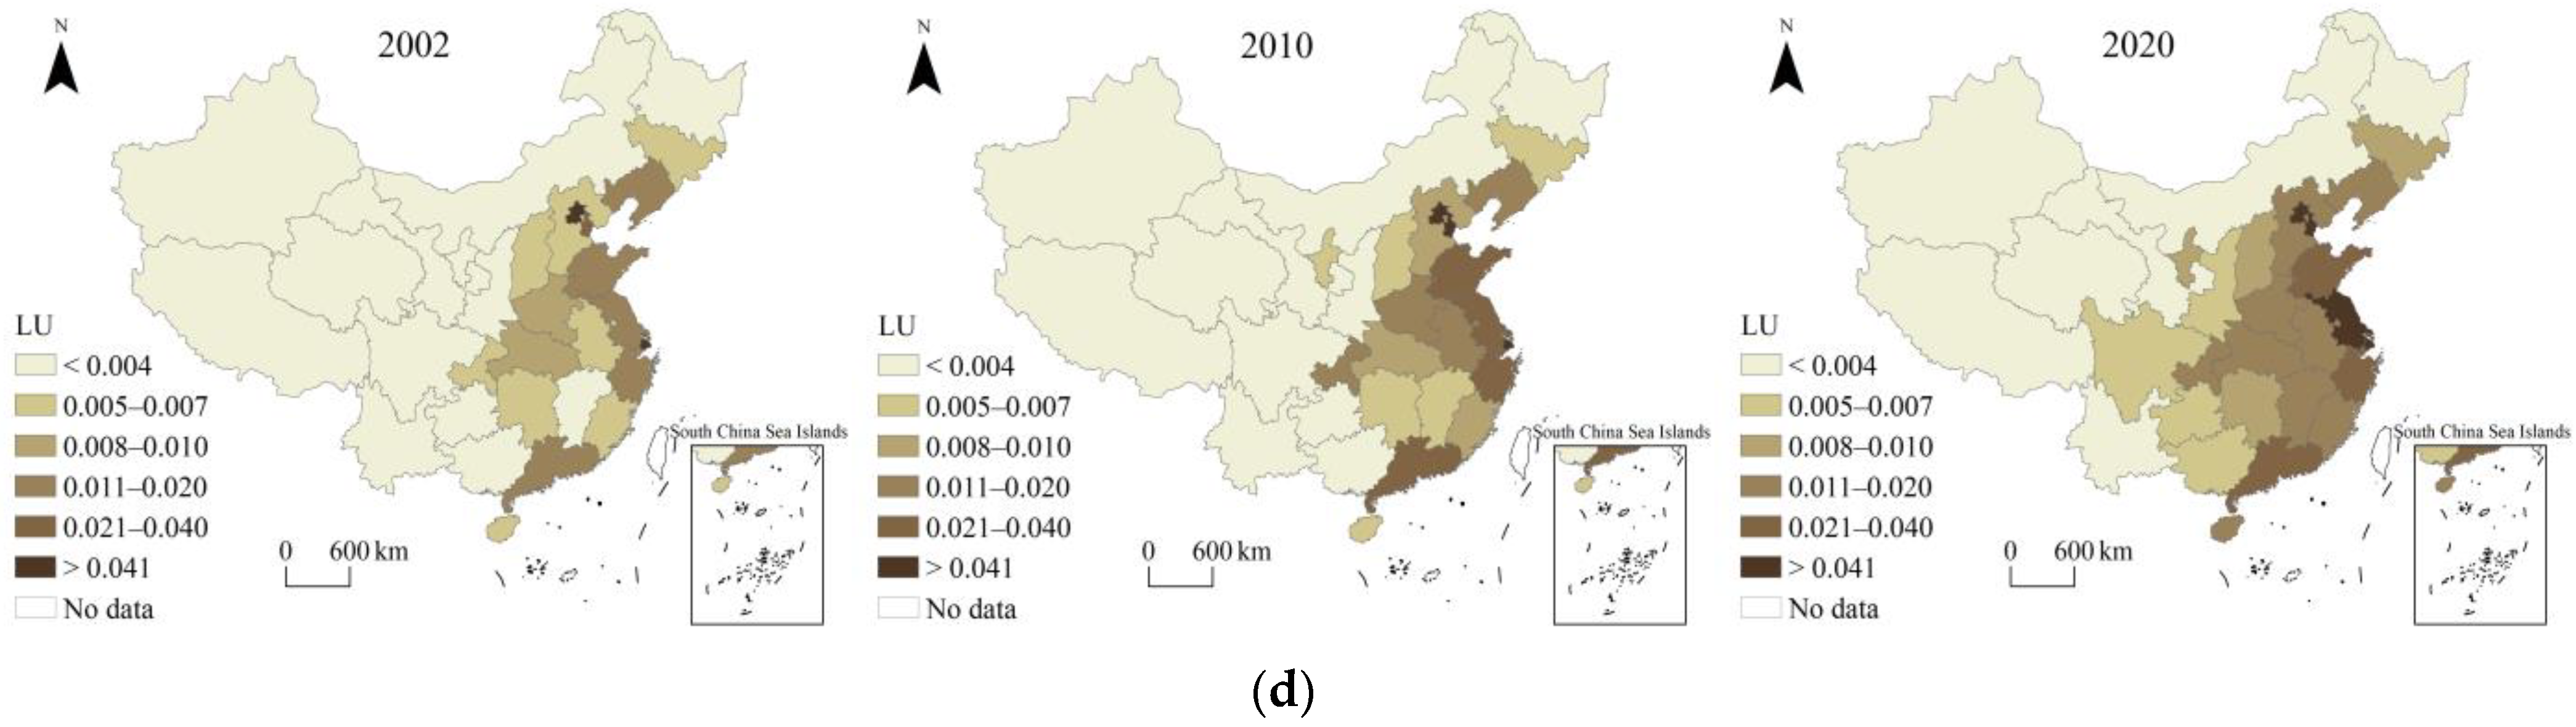
3.1. Spatial Evolution Characteristics of Urbanization in China

Overall, China’s CU has shifted from the eastern coastal areas in 2002 to the central and western regions in 2020, and the gap between and within regions has gradually narrowed, as shown in Figure 3a. In 2020, China’s CU showed a decreasing trend from the eastern coastal areas to the central and western regions. CU of the Southwest and Northwest China are close to each other, while they significantly lag behind that of the Eastern regions. Meanwhile, the CU of the main potato-producing area located near the Hu Huanyong Line developed rapidly from 2002 to 2020, under the strategy of the Rise of Central China and the Western Region Development.
The high-value areas of EU gradually gathered toward the eastern coastal areas from 2002 to 2020, as shown in Figure 3b. The average EU in the main potato-producing areas reached a high level of 0.883 in 2020, with Sichuan and Guizhou, which have the highest potato production, experiencing the highest EU growth. The high-value areas of PU in China evolved from concentrated distribution in the north to belt distribution along the coast, as shown in Figure 3c. The average PU in the main potato-producing areas reached 0.611 in 2020, and the average PU in Chongqing, Sichuan, and Guizhou, which have higher potato production, are significantly higher than that of other provinces. The high-value areas of LU in China evolved from the agglomeration in the eastern coastal areas to the coordinated development of the central and eastern regions, as shown in Figure 3d. The average LU in the main potato-producing areas in 2020 increased by 124.242% compared with that in 2002, and the LU in Sichuan and Guizhou, which have the highest potato production, increased by 165.574% and 249.379%, respectively. Therefore, the changes in urbanization of the main potato-producing areas contribute to the spatial evolution of urbanization in China.

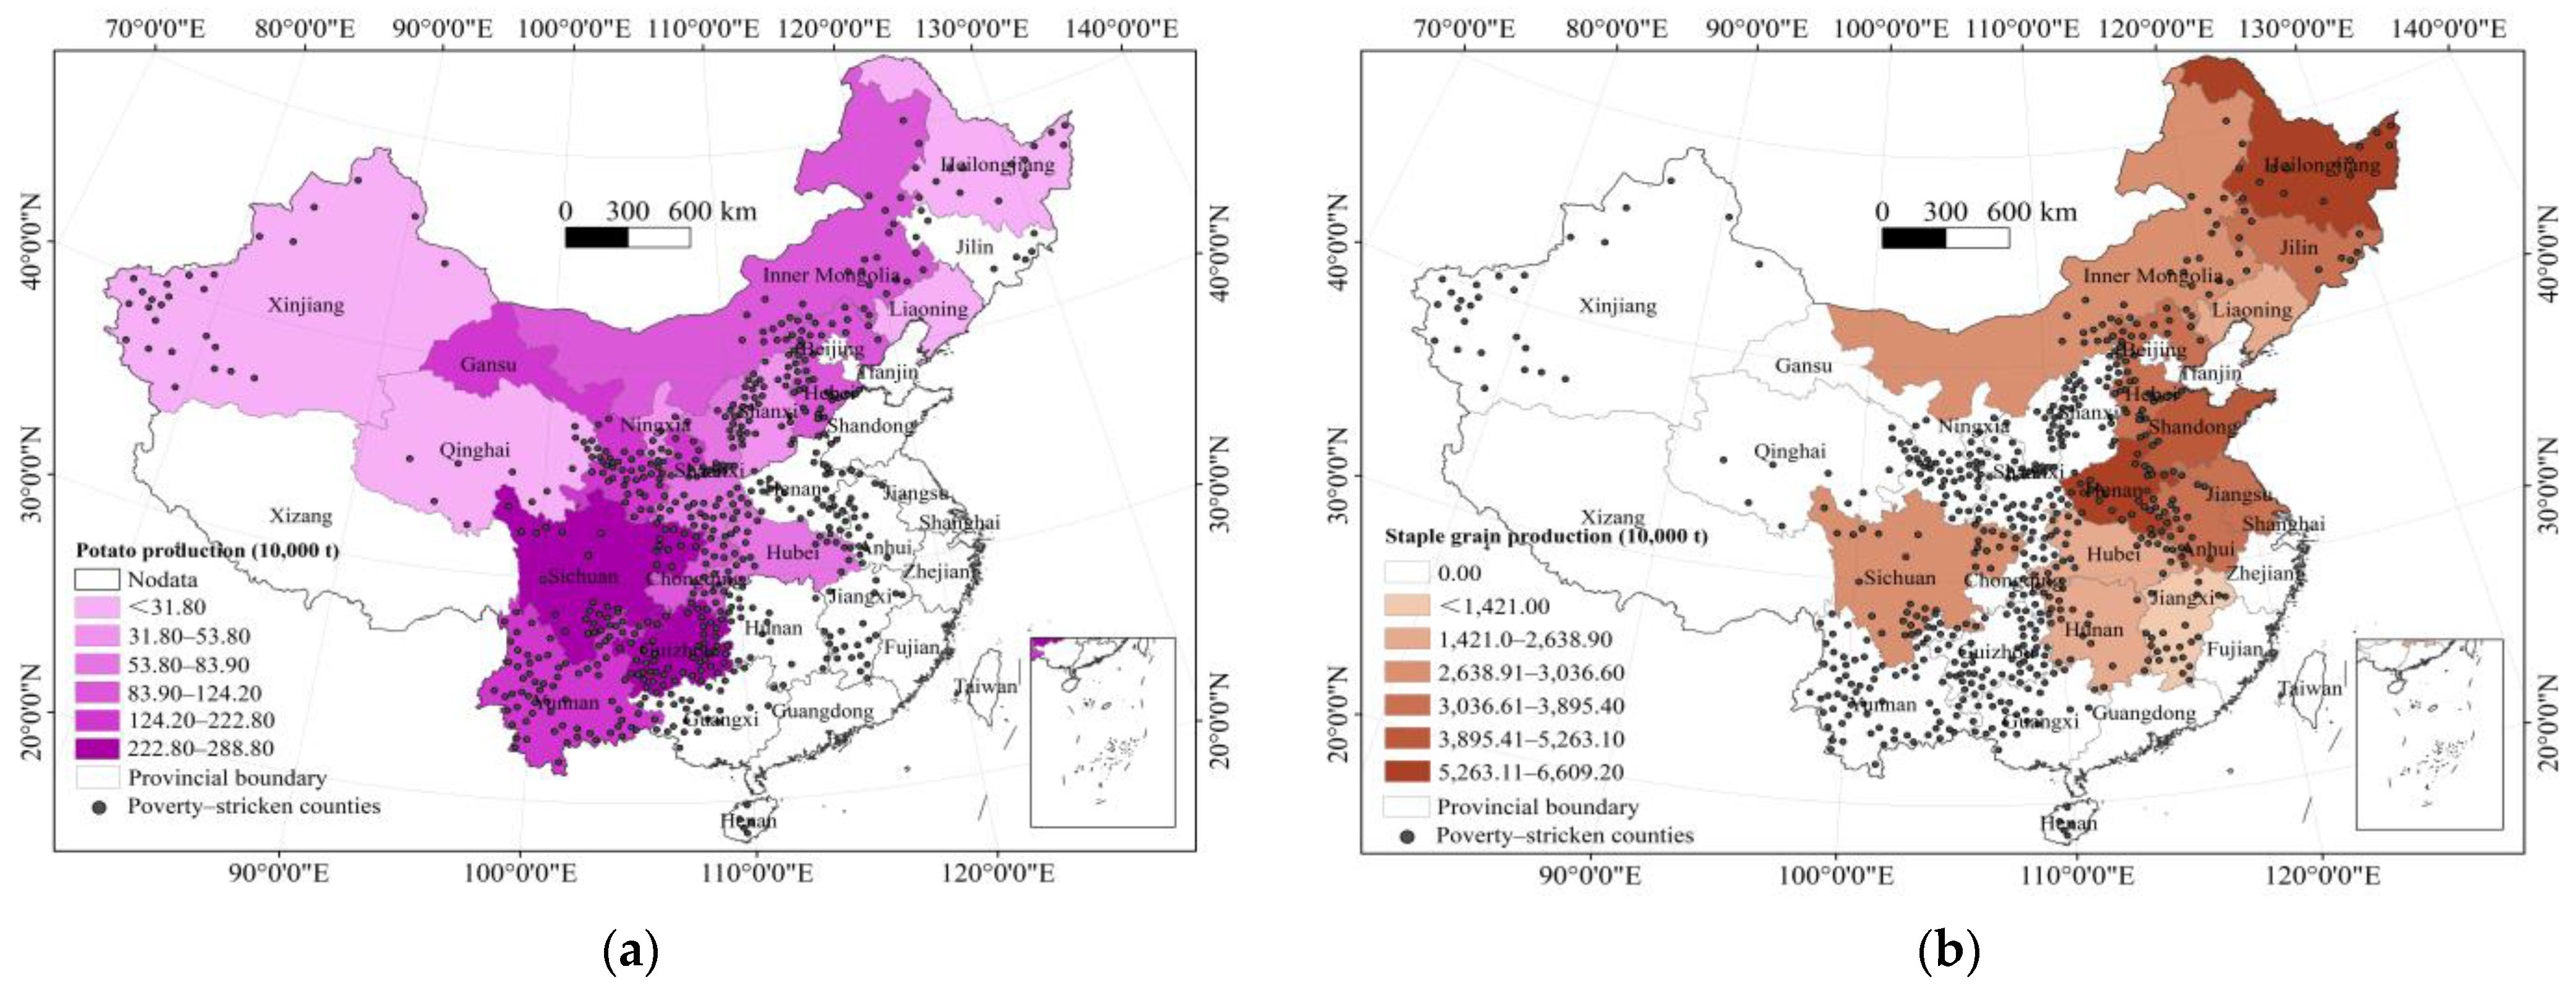
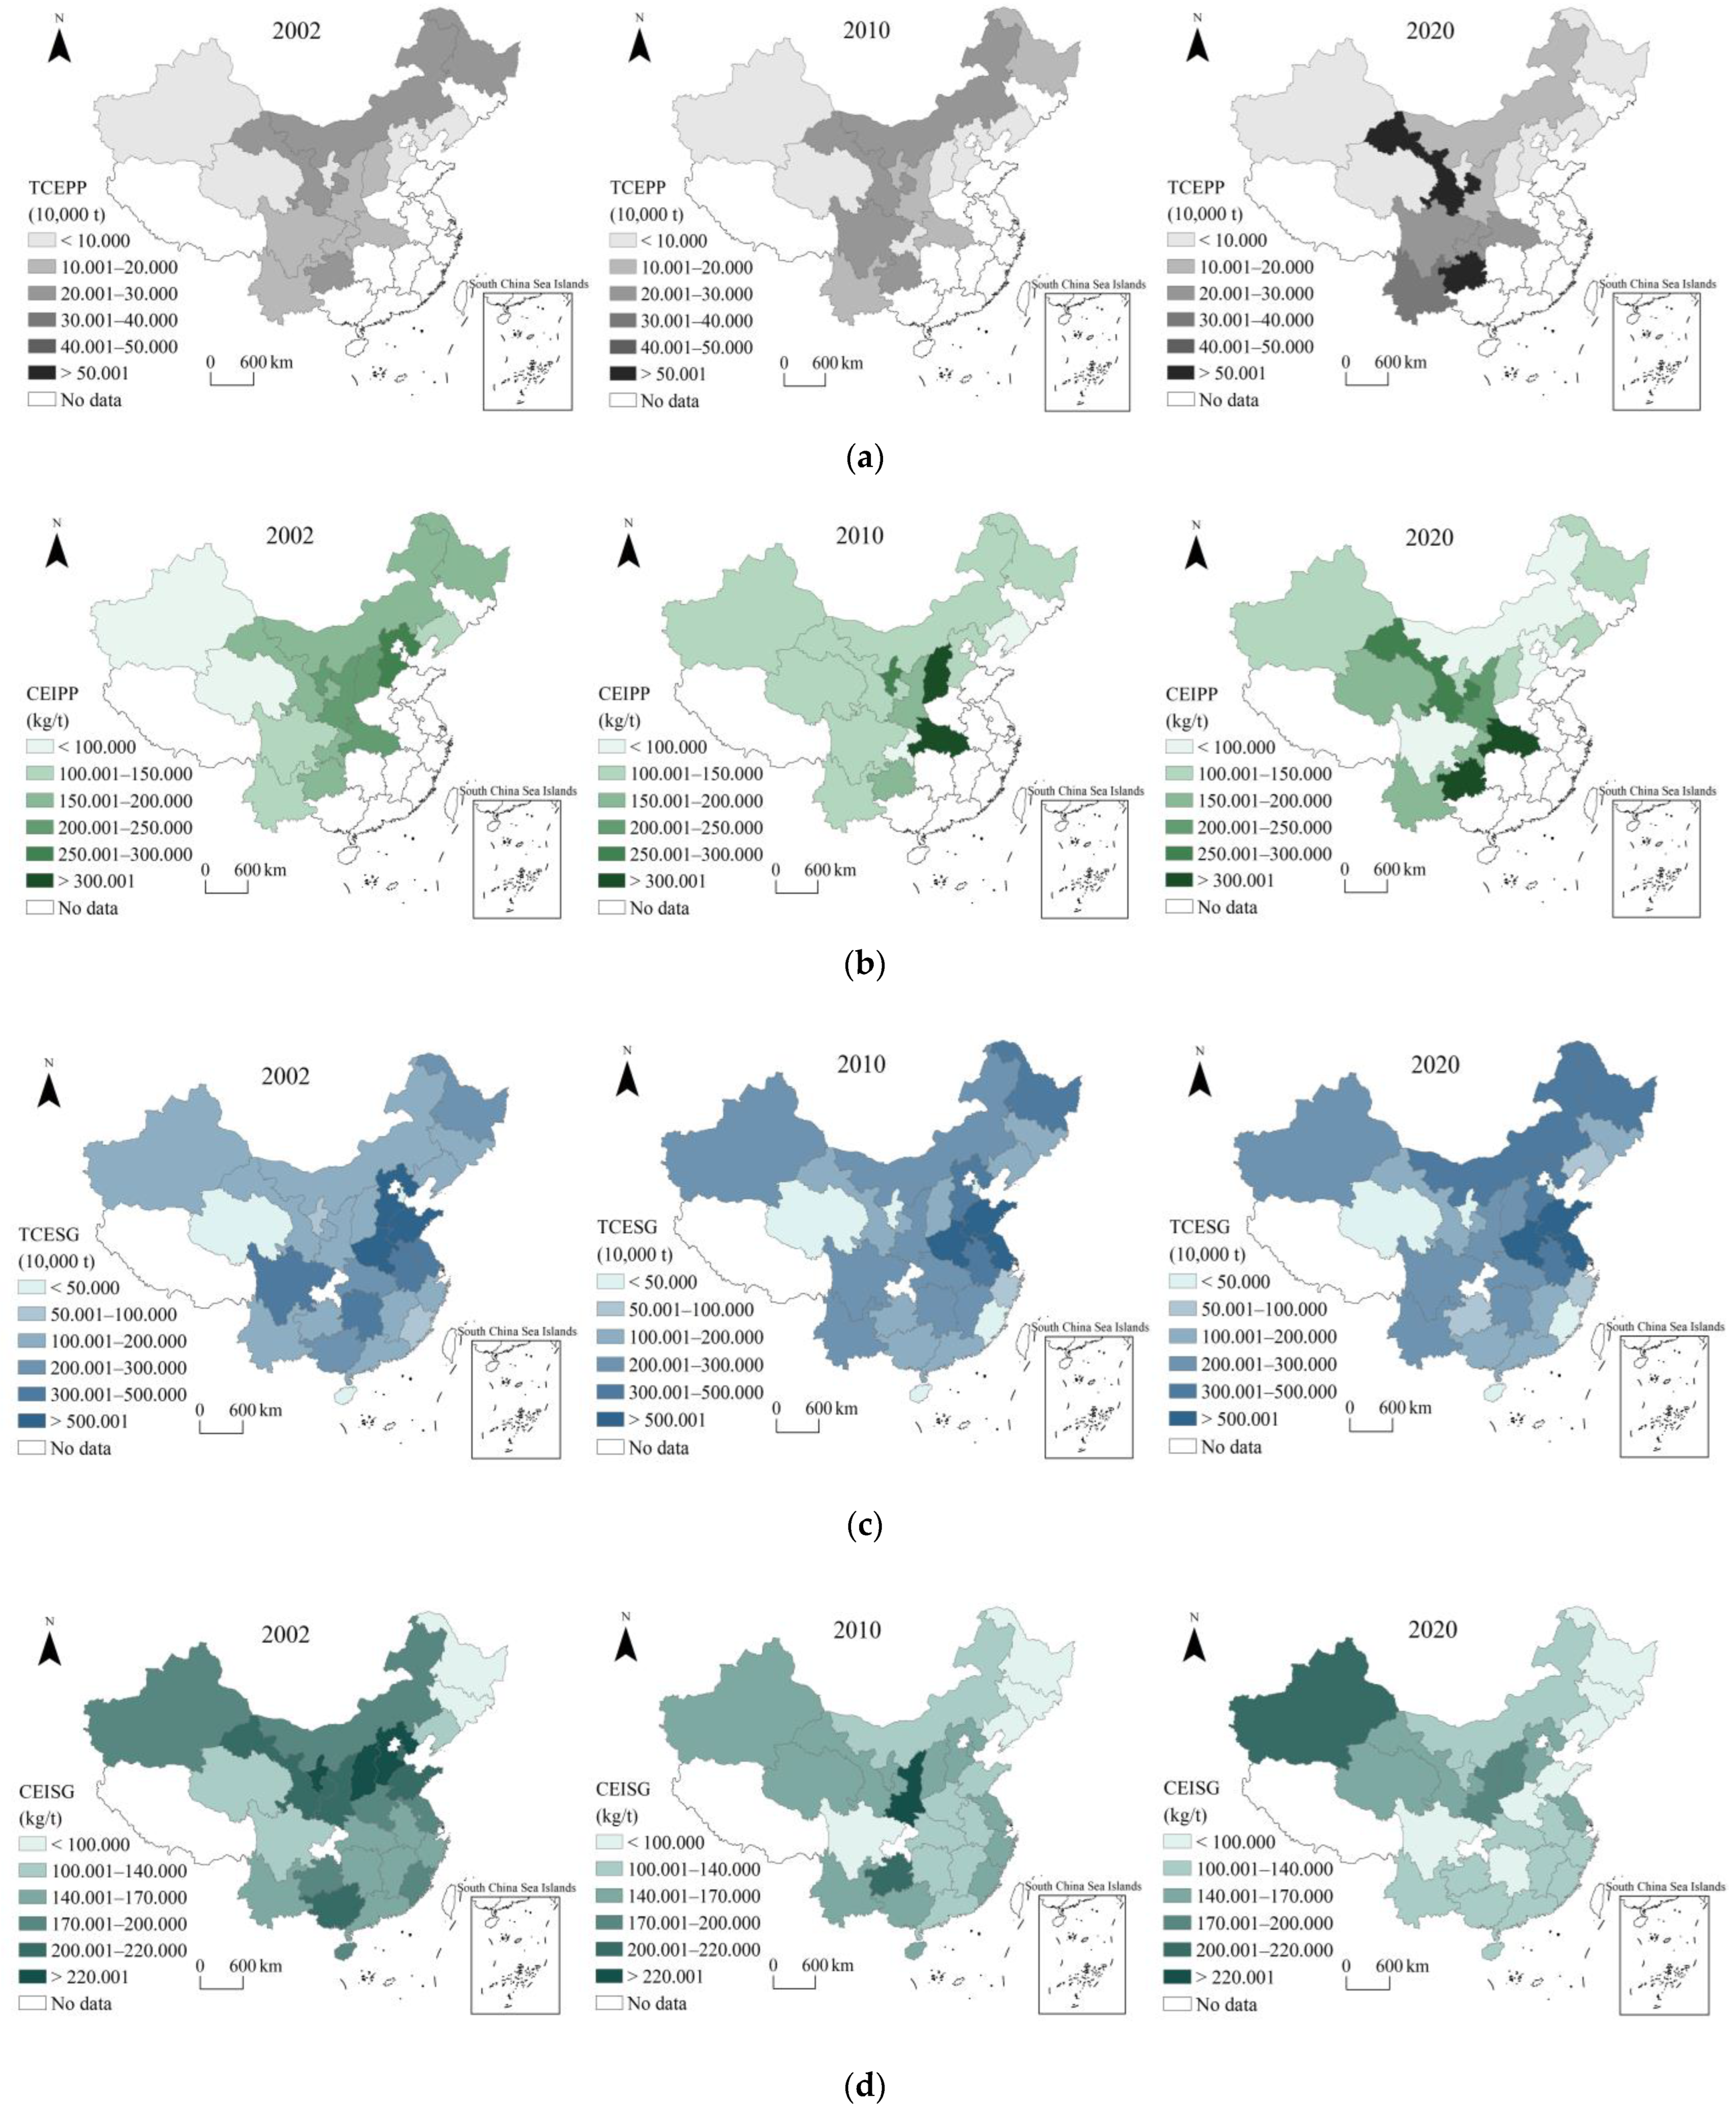
3.2. Spatial Evolution Characteristics of Carbon Emissions from Potato Production

TCEPP showed a V-shaped trend from 2002 to 2020, as shown in Figure 4a. In terms of spatial distribution, the high carbon emission concentration areas shifted from the Northeast, North China, and Southwest China in 2002 to Southwest and Northwest China in 2020. During the same period, the average CEIPP showed a fluctuating downward trend, decreasing from 2672.742 kg/t in 2002 to 2550.977 kg/t in 2020. In terms of spatial distribution, CEIPP gradually shifted from Northeast and North China to Northwest, Southwest, and Hubei, as shown in Figure 4b. Combining the data of TCEPP and CEIPP, we can see that the decrease in CEIPP has an effect on the slowing down of the TCEPP growth rate. Moreover, comparison with urbanization data shows that CEIPP has significantly decreased in provinces such as Sichuan, Hebei, and Ningxia, which are experiencing rapid urbanization. Therefore, the development of urbanization has an impact on carbon emissions from potato production.
TCESG showed a fluctuating decline trend from 2002 to 2020, with high-value areas shifting from the Yangtze River and East China to North China and Heilongjiang, as shown in Figure 4c. CEISG showed a decreasing trend from 2002 to 2020, and its high-value areas gradually shifted from North China to the Northwest, as shown in Figure 4d. CEISG of Hebei Province decreased the most, corresponding to its largest decrease in TCESG in China. Therefore, it can be concluded from the spatial evolution of TCESG and CEISG in China that the decrease in CEISG in North China and the provinces in the middle and lower reaches of the Yellow River is the main reason for the slowing down of TCESG growth in these regions. These regions are not the main distribution areas of poverty, but the above analysis also provides us with some inspiration.
The average CEIPP in the main potato-producing areas decreased from 178.183 kg/t in 2002 to 170.065 kg/t in 2020, a decrease of 4.556%, while the average CEISG in the region decreased from 181.793 to 128.930 kg/t, a decrease of 29.079%, far exceeding CEIPP. Compared with the decrease of CEISG, potato carbon emission has greater potential for future reduction, especially in Central and Western China that have higher CEIPP (such as Guizhou, Chongqing, Gansu, Shaanxi, etc.) and are the main areas of poverty. Recently, the input of production factors has been gradually digitalized and green because of the improvement of potato technology and the development and transformation of the industry. Accordingly, carbon emissions from potato production will be significantly reduced in the future, which contributes to the sustainable development of the potato industry. It can be inferred that there is a significant potential for potato carbon emission decrease, and to some extent, it can also have a significant impact on carbon emissions from food production, thereby promoting sustainable and safe food production in China. Therefore, a study of the carbon emissions from potato production in these regions is of great significance for promoting the achievement of SDG 1, SDG 2, and SDG 12.

3.3. Analysis of the Impact of Urbanization

The spatial correlation of CEIPP is examined with spatial econometric models before empirical analysis. This study tests the spatial correlation of CEIPP from 2002 to 2020 with the Global Moran Index, and the results are shown in Table A2. The spatial correlation of CEIPP is moderately significant under the adjacency matrix, and it is remarkably significant under the distance matrix, economic matrix, and emission matrix. Therefore, this study constructs spatial panel models of the adjacency matrix, distance matrix, economy matrix, and emission matrix. Drawing on Elhorst and Chen [55,56], using Wald and Lratio tests to determine the model’s suitability (SAR, SAC, SEM, SDM), and uses Hausman test to determine whether it is fixed effects or random effects, and the test results are shown in Table A3. A fixed effect SDM model is selected, and STATA is adopted for regression of the influencing factors of CEIPP under the adjacency spatial matrix, distance spatial matrix, economic spatial matrix, and carbon emission spatial matrix, respectively. The results are shown in Table 1 and Table A4. Based on the significance of spatial autoregressive coefficients of the matrix and integrating the significance of variable parameters and Log-likelihood, the SDM models under the carbon emission spatial matrix are finally selected to analyze the influencing factors of CEIPP.

3.3.1. Analysis of the Impact of Urbanization on CEIPP

CU has a significant negative impact on CEIPP (Table 1). Urbanization is not only a process of agglomeration of industries and population and rapid economic and social development but also a leader in the comprehensive green and low-carbon transformation, as well as in innovation and promotion of green and low-carbon technologies. Southwest and Northwest China, where the main potato-producing areas are located, are the main spillover areas of urbanization. Green production becomes the primary choice in these areas due to the poor production and living conditions and low environmental carrying capacity and has gradually become the key to the transformation of economic development mode [57]. Moreover, as an important food and economic crop in the region, potato production and resource utilization efficiency are easily affected by general productivity. Therefore, the transformation into green production brought about by the improvement of CU has a significant spillover effect on the sustainable production of potatoes.
PU has a significant negative impact on CEIPP (Table 1). A likely explanation is that the areas with a higher degree of population agglomeration tend to be more developed economically, and they are more active in implementing the environmental protection system to achieve energy conservation and emission reduction [58,59]. The large-scale transfer of rural labor to cities and the improvement of population quality have made large-scale operations in agriculture realistic. The intensive and efficient use of agricultural capital reduces carbon emission intensity. Qinghai, Gansu, Inner Mongolia, and Yunnan in Western China, where the rural population accounts for a high proportion, are experiencing rapid urbanization. According to the Yunnan Provincial Bureau of Statistics, Yunnan Province has been promoting a new type of people-oriented urbanization since 2010, featuring steady growth of the population and a rise in the urbanization rate. In 2020, 5.477 million of the population have a university education (college and above), and the focus on education has shifted to a higher level [60], which will reduce CEIPP by increasing human capital levels.
LU has the largest positive impact among all variables (Table 1). The improvement of LU is accompanied by a decrease in agricultural land, posing greater pressure on agricultural land use. Therefore, agricultural producers have to increase multiple cropping and increase the input of chemical fertilizers, pesticides, and other production factors to substitute for the decrease of land and the transfer of rural labor, causing an increase in carbon emissions. The main potato-producing areas are located in the Northwest and Southwest China. China’s Western Development Strategy, especially the implementation of the Targeted Poverty Alleviation Strategy, provided these areas with a large amount of capital, which led to rapid urbanization of land and a decrease in arable land area. Statistics show that China invested 1.6 trillion yuan in financial special poverty alleviation funds at all levels from 2012 to 2020. For example, Guizhou province has completed the relocation of 1.92 million people in poor areas, accounting for nearly one-fifth of that in the nation [61]. The relocation of poor people and poverty alleviation can improve production mechanization, management, and intensive use of land resources in the long run, but in the short term, the reduction of farmland and the mismatch of resources leads to an increase in carbon emissions in potato production.
EU has a significant negative impact on CEIPP (Table 1). The main potato-producing areas, such as Southwest and Northwest China, have low EU, and they are in the stage of accelerated development. With the advancement of EU, the proportion of the output of the tertiary industry in GDP increases, and the capital investment in technological research and development increases accordingly. The technological effects spill over to rural areas. Green, ecological and low-carbon production technologies penetrate into the agricultural sector, and environment-friendly ecological resources replace petrochemical products, which reduces carbon emissions. The green economy in poor areas such as Northwest and Southwest China has developed rapidly, especially with the support of digital technology. For example, the use of the Internet of Things Network and sensor technology for real-time monitoring in potato production enables modern management and precise input of production factors. This not only reduces costs and improves efficiency but also reduces carbon emissions. The introduction of digital monitoring and an early warning system for potato late blight helps to avoid the abuse of drugs in the prevention and control of the disease, thus reducing environmental pollution and providing a strong guarantee for the sustainable development of the potato industry.

3.3.2. Effect Decomposition of Urbanization on CEIPP

The results are shown in Table 2. The direct effect of CU on CEIPP is significantly negative (−2.5818), the indirect effect is significantly positive (1.9283), and the total effect is negative, indicating that CP reduces carbon emissions from potato production in the region but not in adjacent regions. Generally, however, it inhibits carbon emissions from potato production. The direct effect of PU on CEIPP is significantly negative (−2.9479), the indirect effect is significantly positive (1.0661), and the total effect is negative, indicating that agglomeration of population to cities enhances large-scale, mechanized, information and green production in agriculture, which reduces CEIPP. However, the siphon effect of large cities in adjacent regions hinders PU, leading to the opposite effect. Both the direct and indirect effects of LU on CEIPP are positive, but the estimates did not pass the significance test, reflecting that current LU in the main potato-producing areas could not effectively reduce CEIPP. This is because the reduction of agricultural land results in an increase in the substitution of agricultural inputs, excessively intensive use of agricultural land and other negative effects, thus hindering the decline of CEIPP. The direct effect of EU on CEIPP is significantly negative (−1.0210), the indirect effect is significantly positive (1.9355), and the total effect is positive, indicating that the improvement of EU reduces CEIPP in the region but not in adjacent regions. It also reflects that the impact of EU on CEIPP in adjacent regions is higher than that in the locality.
This study uses the estimation results of the impact of urbanization on CEISG in the study area for comparison. The decomposition of the effect is shown in Table 3. The estimates of the direct effect (−0.1221) and indirect effect (0.1169) of urbanization on the CEISG did not pass the significance test, indicating that the improvement of urbanization in the main potato-producing areas in this study has no significant impact on CEISG. In addition, in terms of the significance of the estimated values of each variable, the direct effect (−0.1102) and the total effect (−0.0863) of technical efficiency on CEISG are significantly negative, indicating that the improvement of technical efficiency can reduce CEISG. The direct effect of the proportion of disaster-affected areas on CEISG is significantly positive (0.0244), indicating that a larger affected area means higher CEISG. The direct effect (−0.1250) and total effect (−0.0690) of agricultural openness on the CEISG are significantly negative, reflecting that higher agricultural openness means more awareness of green production, which helps to lower CEISG. Urbanization has a more significant impact on CEIPP, compared with the decomposition of effect on CEIPP. Urbanization in poor areas has a greater impact on the sustainable development of specialty food in these areas and is of great significance for the achievement of SDG 1, SDG 2, and SDG 12 in these areas.

4. Discussion

Based on the empirical analysis, the study found that urbanization can generally reduce the carbon emission of potato production and promote its sustainable development. Obviously, this is different from the traditional view that urbanization has a negative impact on food security and the ecological environment [20,62,63,64]. Scholars have gradually realized that urbanization has a positive impact on food security in middle-income or developing countries [21,65,66]. Urbanization has led to the release of rural land and a decrease in rural population, as well as a reduction in fragmentation of arable land, thereby promoting economies of scale and environmental protection [66,67]. Urbanization has promoted the development of agricultural mechanization and water-saving technology, solved the impact of labor shortage, reduced the water footprint, and promoted the sustainable development of food production. This is consistent with the conclusion of this study, which is that the rapid urbanization process in impoverished areas of China has led to a decrease in the carbon emission intensity of potato production and favored promoting green and sustainable development. We will further explore the impact of urbanization on carbon emissions from potatoes and staple crops based on China’s actual situation and propose policy suggestions to promote sustainable development of the potato industry.
Firstly, analyses of the factors influencing CEIPP show that urbanization-related variables (CU, PU, LU and EU) have the largest coefficient and the most remarkable impact. The rapid development of urbanization leads to a decrease in agricultural population, so the large-scale operation of potatoes has become a trend [25,65], and mechanization, greening, informatization, and service socialization have become important choices. The modernization of potato production also means a reduction in CEIPP. Therefore, it can be concluded that urbanization is the key factor affecting CEIPP. Consequently, it is necessary to promote new urbanization to achieve emission reduction and efficiency increase in potato production. The main potato-producing areas in China are located in the Southwest and Northwest with poor agricultural resource endowment and fragile ecological environment. It is urgent to promote sustainable urban development and thereby drive emission reduction and efficiency increase in potato production. Meanwhile, advantageous production areas and leading enterprises are encouraged to jointly promote potato-characterized urbanization [68].
Secondly, according to the influencing factors of CEIPP and decomposition of the effects, CU, PU and EU have significant negative impacts on CEIPP, and the direct effects are also significantly negative, reflecting that the improvement of CU, PU, and EU can reduce CEIPP. Therefore, in order to reduce CEIPP and promote its sustainable development, it is necessary to improve PU and EU, and improve the quality and level of CU. On the one hand, the role of technology and financial development in the process of economic urbanization should be strengthened. It is necessary to improve the agricultural technology innovation service system and invest more in green technologies and financial capital in the modern production of potatoes. On the other hand, it is essential to fully leverage the spillover effect of population urbanization on agricultural carbon emissions reduction [69] and improve the supporting mechanism for urban and rural education. In potato advantageous production areas, it is necessary to increase the scale of human capital accumulation, improve the quality of human capital [70,71], and optimize the spatial layout of human capital to promote balanced regional development.
Thirdly, according to the influencing factors of CEIPP and the decomposition of the effect, LU has a significant positive impact on CEIPP, and the direct and indirect effects are both positive, indicating that the improvement of LU increases CEIPP. Therefore, it is necessary to enhance the efficiency of land use in the process of land urbanization and, to a certain extent, avoid disorderly expansion of land urbanization [72,73]. Based on the economic conditions of potato advantageous production areas, reasonable urbanization policies can be formulated to improve land use efficiency, manage agricultural land effectively, and improve the compensation mechanism for land acquisition [74]. It is important to leverage the comparative advantages of potato production regions based on their resource endowment, transform potato production methods through spillover effects of technology, improve land use efficiency [75], avoid excessive land occupation by agricultural production, and ultimately achieve quality and efficiency improvement in potato production.
Finally, the decomposition of the effect of urbanization on CEIPP and CEISG in poor areas shows that the improvement of CU helps to reduce CEIPP, but its impact on CEISG is not significant, indicating the different impact of urbanization on CEIPP and CEISG. Besides, existing studies show that potato planting has obvious advantages over the other three staple foods in terms of income and cost-profit ratio [76]. Therefore, the promotion of the potato industry in poor areas in the process of urbanization will not only help to improve farmers’ income but also help to reduce the intensity of agricultural carbon emissions and promote the green and sustainable production of specialty food. It has become an important way to achieve SDG 1, SDG 2, and SDG 12 in these areas [77,78].

5. Conclusions and Limitations

5.1. Conclusions

The rapid urbanization process has gradually deepened its role in the sustainable development of agriculture, especially in the sustainable supply of food in poor areas. However, the impact mechanism of different dimensions of urbanization on food sustainability in poor areas has not yet been fully unpacked. Therefore, this study focuses on the specialty food potatoes mainly grown in poor areas of China, explores the impact mechanism of urbanization on the carbon emission intensity of potato production (CEIPP) with the spatial Durbin model, and compares with the carbon emission intensity of staple grain (CEISG) results. This study matched the distribution of main potato-producing areas with national-level poverty-stricken counties in China and contrasted with the main staple grain-producing areas to determine the research area. Then, an improved carbon emission model for potato production and a multi-dimensional urbanization framework of “economy-population-land” were used to calculate CEIPP and the urbanization levels, respectively. The mechanism of the impact of urbanization on CEIPP was explored with the spatial Durbin model (SDM), which was compared with CEISG results. The main conclusions are as follows:
Urbanization of main potato-producing areas developed rapidly from 2002 to 2020, which is in line with the decrease of CEIPP. The decrease in CEIPP has a significant impact on slowing down the growth of total carbon emissions and has greater potential for reduction, especially in Central and Western China, which has a large poverty-stricken population. This is of great significance in promoting the realization of SDG 1, SDG 2, and SDG 12. Compared with traditional staple grain, urbanization has become a key factor influencing CEIPP. The results indicate that different dimensions of urbanization can explain the impact of urbanization on the sustainable production of regional specialty food in China to varying degrees. The improvement of comprehensive urbanization, population urbanization, and economic urbanization reduces CEIPP, while land urbanization increases CEIPP. Therefore, to reduce CEIPP and promote its sustainable development, it is necessary to improve population urbanization and economic urbanization, properly avoid the disorderly expansion of land urbanization, and improve the quality and level of comprehensive urbanization. The study is also expected to provide empirical references for other middle-income or developing countries and ultimately contribute to achieving global food security and sustainable development.

5.2. Contributions and Limitations

This paper has made some contributions to the study of the relationship between urbanization and sustainable food production, especially in poor areas. Firstly, this paper constructs a theoretical analysis framework of the multi-dimensional urbanization (economy-population-land) impact mechanism on sustainable food development, deeply explores the relationship between urbanization and sustainable food production, inspires divergent thinking on the impact mechanism of various types of urbanization on sustainable food production, and enriched the understanding of factors affecting sustainable food security. Secondly, compared with existing research, this paper mainly focuses on the urbanization process and the sustainable production of regional specialty foods in poor areas. Taking potato production, the regional specialty food in poor areas of Central and Western China, as an example, this study explores the impact mechanism of multi-dimensional urbanization in poor areas on the carbon emission intensity of potato production. This study provides a new perspective on enhancing the ability of urban development in poor areas to cope with climate change and exploring low-carbon agricultural production and sustainable nutrition improvement.
It is undeniable that this paper may have some limitations. Firstly, this paper lacks the latest data support. Thus, future research interests should focus on collecting the latest data and substituting the new data into empirical models for analysis to verify the robustness of this study. Secondly, we only selected potatoes, the most representative specialty food in poor areas of Central and Western China, as the research object. However, there are also some other specialty foods in these poor areas, such as barley and millet, which are also important entities affecting regional food security and nutrition improvement and are also affected by rapid urbanization. In future research, the scope of study on regional specialty foods can be expanded to supplement the research on the impact of urbanization on sustainable food security in poor areas. Thirdly, Chinese-style urbanization integrates the synchronous development of industrialization and modernization, and the urbanization process in poor areas selected in this paper is closely related to the Western Development Strategy implemented by the Chinese government; meanwhile, the Chinese government has been promoting potatoes as the staple food since 2014, and currently, potatoes have become a star brand of industrial poverty alleviation projects in many poor areas. Therefore, the conclusions of this study might be less representative of other nations’ agricultural efforts. In the future, research perspectives should be expanded to a global scale, and the impact of urbanization on sustainable food security in different regions or groups should be discussed.

Author Contributions

Conceptualization, Y.N. and J.L.; methodology, Y.N. and J.L.; software, J.L. and Y.J.; validation, Z.L. and J.L.; formal analysis, Y.N. and Z.L.; investigation, J.L. and Y.J.; resources, Y.N. and Z.L.; data curation, Z.L.; writing—original draft preparation, Y.N. and Z.L.; writing—review and editing, Y.N. and J.L.; visualization, J.L. and Y.J.; supervision, J.L.; project administration, Z.L.; funding acquisition, Z.L. and J.L. All authors have read and agreed to the published version of the manuscript.

Funding

This research was funded by the Priority Research Program of Chinese Academy of Sciences (Grant No. XDA20010102) and the National Social Science Foundation of China (Grant No. 20CJY054).

Institutional Review Board Statement

Not applicable.

Informed Consent Statement

Not applicable.

Data Availability Statement

Data will be made available on request.

Conflicts of Interest

The authors declare no conflicts of interest.

Appendix A

Table A1. Descriptive statistics of variables.
VariableSymbolUnitsMeanMaxMinStd. Dev.
Total carbon emissions from potato productionTCEPPkt74.2601830.07870109.5726
Carbon emission intensity of potato productionCEIPPkg/t151.1928430.927546.767666.4279
Total carbon emissions of staple grainTCESGkt227.0389659.16634.8246170.9339
Carbon emission intensity of staple grainCEISGkg/t141.7795288.837341.438744.3048
Per capita agricultural output valuePCAO104 CNY/Person1.56567.51700.16421.2313
Comprehensive urbanizationCU0.40621.00000.09120.1998
Economy urbanizationEU0.50330.94150.13080.1710
Population urbanizationPU0.01740.19520.00010.0305
Land urbanizationLU0.88510.99730.65330.0615
Production technical efficiencyPTE0.85531.50900.00000.3068
Proportion of disaster areasPDA0.26010.69180.02120.1511
Potato industrial structurePIS0.56060.74000.33900.0906
Agricultural opennessAO0.07420.52700.00000.1038
Production agglomeration levelsPAL1.39224.23280.60700.6033
Proportion of agricultural fiscal expendituresAFE0.11540.20380.02950.0333
Proportion of environmental protection fiscal expenditureEPFE0.02530.06730.00000.0176
Note: “—” represents no data.
Table A2. Global Moran index of CEIPP.
YearAdjacency MatrixDistance MatrixEconomic MatrixEmission Matrix
20020.175 (0.174) *0.932 (0.331) ***0.909 (0.325) ***0.821 (0.324) ***
20030.070 (0.175)0.945 (0.334)***0.905 (0.328) ***0.845 (0.326) ***
20040.160 (0.159) *0.893 (0.300) ***0.831 (0.295) ***0.796 (0.293) ***
20050.241 (0.169) **0.968 (0.321) ***0.951 (0.315) ***0.935 (0.314) ***
20060.364 (0.182) ***0.956 (0.348) ***0.935 (0.342) ***0.935 (0.341) ***
20070.121 (0.176)0.969 (0.336) ***0.964 (0.330) ***0.934 (0.328) ***
20080.036 (0.157)0.979 (0.296) ***0.969 (0.291) ***0.961 (0.289) ***
20090.016 (0.172)0.967 (0.326) ***0.942 (0.321) ***0.941 (0.319) ***
2010−0.004 (0.160)0.903 (0.302) ***0.848 (0.297) ***0.875 (0.296) ***
2011−0.149 (0.148)0.980 (0.278) ***0.965 (0.273) ***0.963 (0.272) ***
20120.207 (0.167) **0.969 (0.317) ***0.954 (0.312) ***0.947 (0.311) ***
20130.233 (0.176) **0.969 (0.336) ***0.946 (0.330) ***0.947 (0.329) ***
2014−0.102 (0.134)0.989 (0.247) ***0.983 (0.243) ***0.980 (0.242) ***
2015−0.164 (0.169)0.959 (0.321) ***0.945 (0.316) ***0.932 (0.315) ***
2016−0.070 (0.166)0.947 (0.315) ***0.940 (0.310) ***0.921 (0.309) ***
20170.042 (0.169)0.942 (0.321) ***0.956 (0.315) ***0.950 (0.314) ***
20180.150 (0.154) *0.978 (0.290) ***0.988 (0.285) ***0.983 (0.284) ***
20190.149 (0.162) *0.972 (0.306) ***0.972 (0.301) ***0.969 (0.299) ***
20200.099 (0.175)0.953 (0.333) ***0.961 (0.328) ***0.966 (0.326) ***
Note: the standard error of coefficient estimation is shown in brackets; ‘*’, ‘**’, and ‘***’ represent the significance levels of 10%, 5% and 1%, respectively; “—” represents no data.
Table A3. Wald, LR, and Hausman test results of model selection.
Adjacency MatrixDistance MatrixEconomic MatrixEmission Matrix
StatisticpStatisticpStatisticpStatisticp
Wald-SDM-SLM252.2240.000240.9830.000322.5960.000368.4520.000
Wald-SDM-SEM293.7090.000280.0790.000390.3630.000435.6490.000
LR-SDM-SLM95.0790.00098.4460.000118.6460.000164.0950.000
LR-SDM-SEM122.2840.000125.1620.000150.0310.000200.0410.000
Hausman53.2260.00059.3150.00086.3370.00097.1210.000
Table A4. Results of factors influencing CEIPP under adjacency matrix and distance matrix in SDM.
VariableAdjacency MatrixDistance Matrix
CU−0.3290−11.3582 *
(0.8262)(6.1638)
PU−1.1750 **−7.2467
(0.4739)(8.6210)
LU−4.968214.0057
(4.7371)(12.7668)
EU0.824315.3329
(1.0016)(45.6396)
PTE−1.4298 ***−1.3608 ***−1.5201 ***−1.4745 ***−1.0710−1.0851 ***−1.1611 **−1.5269 ***
(0.1920)(0.2036)(0.1705)(0.1881)(0.7859)(0.4119)(0.6683)(0.4159)
PCAO0.0178−0.0867 *−0.0680 *−0.1200 **0.03250.05020.01720.1158 **
(0.0577)(0.0481)(0.0398)(0.0595)(0.0513)(0.0612)(0.0475)(0.0576)
PDA0.0561−0.13330.14160.0795−0.1445−0.1622−0.14770.3960
(0.2788)(0.2104)(0.2554)(0.2501)(0.2271)(0.2389)(1.2721)(1.1855)
PIS0.46310.74410.25470.13660.82670.7826 **0.8984 **−8.0887
(0.7384)(0.6364)(0.5476)(0.7431)(0.9920)(0.3922)(0.4282)(5.1992)
AO−0.05230.0868−0.2470−0.1578−0.0811−0.0502−4.1114−1.8751 *
(0.3766)(0.3337)(0.3929)(0.2717)(0.3116)(0.2792)(5.2539)(1.0826)
PAL0.04580.13160.2070 *0.2631 **−0.02870.93350.01793.6272
(0.1261)(0.1041)(0.1176)(0.1239)(0.1120)(0.8417)(0.0746)(4.6921)
AFE−0.34560.24410.83770.06250.50040.50160.6734−2.6097
(1.5895)(1.2199)(1.5512)(1.3506)(1.4122)(1.4370)(1.5680)(9.5515)
EPFE−1.5566−1.02242.30352.5033−1.6838−1.3391−1.74023.0220
(2.1128)(2.2679)(3.2289)(2.7901)(2.2124)(2.2168)(2.5643)(5.0685)
W·CU11.6368 *
(6.2993)
W·PU7.1821
(6.4663)
W·LU2.4569 ***
(0.3821)
W·EU−11.3238
(7.8992)
W·PCAO0.2654 **
(0.1220)
W·PDA−0.9169 **−0.7677−0.7739 *−0.3063 ****
(0.3908)(0.4064)(0.4283)(0.1392)
W·PIS3.0743 **3.9243 *3.2303 *9.7015 ***
(1.5041)(2.1423)(1.9399)(4.2911)
W·AO−0.4033 **3.7553 **3.4167 **4.1666
(0.1969)(1.8099)(1.7217)(5.3817)
W·PAL−0.4549 *−0.3569 *−0.5893 **−1.0038−3.6665 *
(0.2992)(0.2083)(0.2997)(0.8649)(2.2663)
W·EPFE−5.9141 *−6.0740 **
(3.2737)(2.6441)
Spatial−0.0270−0.0223−0.0261−0.02130.25260.24070.21110.2037
R20.47720.61620.76820.70080.33080.40810.43700.3883
Log-likelihood−147.3083−141.9783−142.6348−141.2104−152.3276−152.6529−152.9239−153.6696
Note: the standard error of coefficient estimation is shown in brackets; ‘*’, ‘**’, and ‘***’ represent the significance levels of 10%, 5% and 1%, respectively; “—” represents no data.

References

  1. FAO. The State of Food and Agriculture 2021: Making Agri-Food Systems More Resilient to Shocks and Stresses. Available online: https://www.fao.org/3/CB4476EN/online/CB4476EN.html (accessed on 11 January 2023).
  2. Malik, A.; Li, M.; Lenzen, M.; Fry, J.; Liyanapathirana, N.; Beyer, K.; Boylan, S.; Lee, A.; Raubenheimer, D.; Geschke, A.; et al. Impacts of climate change and extreme weather on food supply chains cascade across sectors and regions in Australia. Nat. Food 2022, 3, 631–643. [Google Scholar] [CrossRef]
  3. Okolie, C.C.; Ogundeji, A.A. Effect of COVID-19 on agricultural production and food security: A scientometric analysis. Humanit. Soc. Sci. Commun. 2022, 9, 64. [Google Scholar] [CrossRef]
  4. Li, J.; Song, Z. Dynamic Impacts of External Uncertainties on the Stability of the Food Supply Chain: Evidence from China. Foods 2022, 11, 2552. [Google Scholar] [CrossRef]
  5. FSIn platform. Food Security Information Network. Global Report on Food Crises 2020. Available online: https://wwww.fsinplatform.org/global-report-food-crises-2020 (accessed on 20 August 2020).
  6. FAO. The State of Food Security and Nutrition in the World 2020: Transforming Food Systems for Affordable Healthy Diets. Available online: https://www.fao.org/policy-support/tools-and-publications/resources-details/en/c/1298217/ (accessed on 7 January 2023).
  7. De Onis, M.; Borghi, E.; Arimond, M.; Webb, P.; Croft, T.; Saha, K.; De-Regil, L.M.; Thuita, F.; Heidkamp, R.; Krasevec, J.; et al. Prevalence thresholds for wasting, overweight and stunting in children under 5 years. Public Health Nutr. 2018, 22, 175–179. [Google Scholar] [CrossRef]
  8. Chen, D.; Lu, X.; Hu, W.; Zhang, C.; Lin, Y. How urban sprawl influences eco-environmental quality: Empirical research in China by using the Spatial Durbin model. Ecol. Indic. 2021, 131, 108113. [Google Scholar] [CrossRef]
  9. Liang, L.; Wang, Z.; Li, J. The effect of urbanization on environmental pollution in rapidly developing urban agglomerations. J. Clean. Prod. 2019, 237, 117649. [Google Scholar] [CrossRef]
  10. Selod, H.; Shilpi, F. Rural-urban migration in developing countries: Lessons from the literature. Reg. Sci. Urban Econ. 2021, 91, 103713. [Google Scholar] [CrossRef]
  11. He, C.; Chen, T.; Mao, X.; Zhou, Y. Economic transition, urbanization and population redistribution in China. Habitat Int. 2016, 51, 39–47. [Google Scholar] [CrossRef]
  12. Yue, W.; Liu, Y.; Fan, P. Measuring urban sprawl and its drivers in large Chinese cities: The case of Hangzhou. Land Use Policy 2013, 31, 358–370. [Google Scholar] [CrossRef]
  13. Liu, L. Urbanization is reshaping food production in China. Nature 2023, 621, 42. [Google Scholar] [CrossRef]
  14. Song, W.; Pijanowski, B.C. The effects of China’s cultivated land balance program on potential land productivity at a national scale. Appl. Geogr. 2014, 46, 158–170. [Google Scholar] [CrossRef]
  15. Li, J.; Li, Y. Influence measurement of rapid urbanization on agricultural production factors based on provincial panel data. Socio-Econ. Plan. Sci. 2019, 67, 69–77. [Google Scholar] [CrossRef]
  16. Tselios, V. Urbanization and Socioeconomic Status in the European Regions: The Role of Population Ageing and Capital City Regions. Eur. Plan. Stud. 2014, 22, 1879–1901. [Google Scholar] [CrossRef]
  17. Beckers, V.; Poelmans, L.; Van Rompaey, A.; Dendoncker, N. The impact of urbanization on agricultural dynamics: A case study in Belgium. J. Land Use Sci. 2020, 15, 626–643. [Google Scholar] [CrossRef]
  18. Skog, K.L.; Steinnes, M. How do centrality, population growth and urban sprawl impact farmland conversion in Norway? Land Use Policy 2016, 59, 185–196. [Google Scholar] [CrossRef]
  19. Liu, Y. Introduction to land use and rural sustainability in China. Land Use Policy 2018, 74, 1–4. [Google Scholar] [CrossRef]
  20. Szabo, S. Urbanisation and Food Insecurity Risks: Assessing the Role of Human Development. Oxf. Dev. Stud. 2015, 44, 28–48. [Google Scholar] [CrossRef]
  21. De Bruin, S.; Dengerink, J.; van Vliet, J. Urbanisation as driver of food system transformation and opportunities for rural livelihoods. Food Secur. 2021, 13, 781–798. [Google Scholar] [CrossRef]
  22. Zhuang, L.; Ye, C. Changing imbalance: Spatial production of national high-tech industrial development zones in China (1988–2018). Land Use Policy 2020, 94, 104512. [Google Scholar] [CrossRef]
  23. Wang, P. What are the changes in population size? Econ. Dly. 2023. [Google Scholar] [CrossRef]
  24. GOV. Expectations for China’s Reform of the World: Reducing “Tuition Fees” for Urbanization in China. Available online: https://www.gov.cn/zhuanti/2014-02/20/content_2624290.htm (accessed on 20 February 2014).
  25. Ge, D.; Long, H.; Qiao, W.; Wang, Z.; Sun, D.; Yang, R. Effects of rural–urban migration on agricultural transformation: A case of Yucheng City, China. J. Rural Stud. 2020, 76, 85–95. [Google Scholar] [CrossRef]
  26. Molina, C.A.; Dudenhoefer, D.; Polar, V.; Scurrah, M.; Ccanto, R.C.; Heider, B. Gender Roles and Native Potato Diversity Management in Highland Communities of Peru. Sustainability 2022, 14, 3455. [Google Scholar] [CrossRef]
  27. FAO. Production of Potatoes: Top Ten Producers 2019. Available online: https://www.fao.org/faostat/en/#data/QCL/visualize (accessed on 15 November 2022).
  28. Mudege, N.N.; Sarapura Escobar, S.; Polar, V. Gender Topics on Potato Research and Development. In The Potato Crop; Campos, H., Ortiz, O., Eds.; Springer: Cham, Switzerland, 2020; pp. 475–506. [Google Scholar]
  29. GOV. Ministry of Agriculture and Rural Affairs of the People’s Republic of China (MARAPRC). Available online: https://www.gov.cn/xinwen/2015-01/07/content_2801539.htm (accessed on 7 January 2015).
  30. Scott, G.J.; Suarez, V. From Mao to McDonald’s: Emerging Markets for Potatoes and Potato Products in China 1961–2007. Am. J. Potato Res. 2012, 89, 216–231. [Google Scholar] [CrossRef]
  31. Lv, C.; Sun, G. Study on the characteristics and driving factors of production regional distribution for potato in China—Based on the panel data of the main production areas. Chin. J. Agric. Resour. Reg. Plan. 2019, 40, 34–41. [Google Scholar] [CrossRef]
  32. Subedi, K.; Chhetri, N.B.; Karki, T. Land Use Practices, Cropping Systems and Climate Change Vulnerability to Mountain Agro-Ecosystems of Nepal; Nova Science Publishers, Inc.: New York, NY, USA, 2016; pp. 103–132. [Google Scholar]
  33. Tobgay, S.; Mischler, F.; Covarrubias, K.; Zezza, A. Fighting Hunger: The Right to Food Way; FAO: Rome, Italy, 2015. [Google Scholar]
  34. Liu, X.; Xu, Y.; Engel, B.A.; Sun, S.; Zhao, X.; Wu, P.; Wang, Y. The impact of urbanization and aging on food security in developing countries: The view from Northwest China. J. Clean. Prod. 2021, 292, 126067. [Google Scholar] [CrossRef]
  35. Bren d’Amour, C.; Reitsma, F.; Baiocchi, G.; Barthel, S.; Güneralp, B.; Erb, K.-H.; Haberl, H.; Creutzig, F.; Seto, K. Future urban land expansion and implications for global croplands. Proc. Natl. Acad. Sci. USA 2017, 114, 8939–8944. [Google Scholar] [CrossRef]
  36. Li, B. An empirical study on the effectiveness of China’s monetary policy. J. Financ. Res. 2001, 7, 10–17. [Google Scholar]
  37. Liu, F.; Xu, H.; Wang, S. Analysis on spatial-temporal coupling coordinate degree among population, land and economy urbanization: Based on China provincial panel data. Urban Dev. Stud. 2014, 21, 7–11. [Google Scholar]
  38. Tian, Y.; Zhang, J.; Li, B. Agricultural Carbon Emissions in China: Calculation, Spatial-Temporal Comparison and Decoupling Effects. Resour. Sci. 2012, 34, 2097–2105. [Google Scholar]
  39. Zhang, G.; Wang, S. China’s Agricultural Carbon Emission: Structure, Efficiency and Its Determinants. Issues Agric. Econ. 2014, 35, 18–26+110. [Google Scholar] [CrossRef]
  40. Wang, X.; Ma, S.; Pu, C.; Zhao, X.; Wang, Y.; Zhang, H. Trends and influencing factors of agricultural carbon emissions in the Southwest China. China Popul. Resour. Environ. 2017, 27, 231–234. [Google Scholar]
  41. Wojewodzki, M.; Wei, Y.; Cheong, T.S.; Shi, X. Urbanization, agriculture and convergence of carbon emissions nexus: Global distribution dynamics analysis. J. Clean. Prod. 2023, 385, 135697. [Google Scholar] [CrossRef]
  42. Shi, R.; Shen, Y.; Du, R.; Yao, L.; Zhao, M. The impact of agricultural productive service on agricultural carbon efficiency—From urbanization development heterogeneity. Sci. Total Environ. 2024, 906, 167604. [Google Scholar] [CrossRef]
  43. Liu, J.; Fang, Y.; Wang, G.; Liu, B.; Wang, R. The aging of farmers and its challenges for labor-intensive agriculture in China: A perspective on farmland transfer plans for farmers’ retirement. J. Rural Stud. 2023, 100, 103013. [Google Scholar] [CrossRef]
  44. Zhu, W.; Wang, R. Impact of farm size on intensity of pesticide use: Evidence from China. Sci. Total Environ. 2021, 753, 141696. [Google Scholar] [CrossRef]
  45. Rahman, G.; Chandio, N.H.; Moazzam, M.F.U.; Al Ansari, N. Urban expansion impacts on agricultural land and thermal environment in Larkana, Pakistan. Front. Environ. Sci. 2023, 11, 1115553. [Google Scholar] [CrossRef]
  46. Liu, X.; Sun, T.; Feng, Q. Dynamic spatial spillover effect of urbanization on environmental pollution in China considering the inertia characteristics of environmental pollution. Sustain. Cities Soc. 2020, 53, 101903. [Google Scholar] [CrossRef]
  47. Bai, Y.; Deng, X.; Jiang, S.; Zhang, Q.; Wang, Z. Exploring the relationship between urbanization and urban eco-efficiency: Evidence from prefecture-level cities in China. J. Clean. Prod. 2018, 195, 1487–1496. [Google Scholar] [CrossRef]
  48. Seto, K.C.; Sánchez-Rodríguez, R.; Fragkias, M. The New Geography of Contemporary Urbanization and the Environment. Annu. Rev. Environ. Resour. 2010, 35, 167–194. [Google Scholar] [CrossRef]
  49. Yue, L.; Xue, D. Study on the Impact of New-type Urbanization on Urban Land Use Efficiency in China. Inq. Into Econ. Issues 2020, 110–120. [Google Scholar]
  50. Ma, M.; Tang, J. Nonlinear impact and spatial effect of tourism urbanization on human settlement environment: Evidence from the Yellow River Basin, China. J. Clean. Prod. 2023, 428, 139432. [Google Scholar] [CrossRef]
  51. Zhang, L.; Wang, Y.; Guo, Y. A research on the coordination of land urbanization and economic urbanization in China. East China Econ. Manag. 2016, 30, 111–117. [Google Scholar] [CrossRef]
  52. Li, Y.; Liu, Y.; Liu, M. Review on external risks of global supply chain and Its Countermeasures. Study Explor. 2019, 6, 134–143. [Google Scholar] [CrossRef]
  53. MOA. Ministry of Agriculture and Rural Affairs of the People’s Republic of China (MARAPRC). Available online: http://www.moa.gov.cn/nybgb/2016/disanqi/201711/t20171126_5919565.htm (accessed on 26 November 2017).
  54. GOV. The Central People’s Government of the People’s Republic of China. Available online: http://bzdt.ch.mnr.gov.cn (accessed on 23 September 2023).
  55. Elhorst, J. MATLAB software for spatial panels. Int. Reg. Sci. Rev. 2012, 37, 389–405. [Google Scholar] [CrossRef]
  56. Chen, D.; Hu, W.; Li, Y.; Zhang, C.; Lu, X.; Cheng, H. Exploring the temporal and spatial effects of city size on regional economic integration: Evidence from the Yangtze River Economic Belt in China. Land Use Policy 2023, 132, 106770. [Google Scholar] [CrossRef]
  57. Li, J.; Lin, Q. Threshold effects of green technology application on sustainable grain production: Evidence from China. Front. Plant Sci. 2023, 14, 1107970. [Google Scholar] [CrossRef] [PubMed]
  58. Ohlan, R. The impact of population density, energy consumption, economic growth and trade openness on CO2 emissions in India. Nat. Hazards 2015, 79, 1409–1428. [Google Scholar] [CrossRef]
  59. He, L.; Zhang, X.; Zhang, X. Urbanization with the pursuit of efficiency and ecology: Theory and evidence from China. Environ. Impact Assess. Rev. 2023, 103, 107274. [Google Scholar] [CrossRef]
  60. YN. Release of Main Data from the Seventh National Population Census of Yunnan Province. Available online: https://www.yn.gov.cn/sjfb/sjyw/202105/t20210515_222144.html (accessed on 15 April 2021).
  61. GOV. The Central People’s Government of the People’s Republic of China (CPGPRC). The Whole Country Is Working Together to Overcome Difficulties: From Guizhou’s Victory in the Poverty Alleviation Battle to See the Advantages of the Socialist System with Chinese Characteristics. Available online: https://www.gov.cn/xinwen/2022-09/10/content_5709332.htm (accessed on 10 September 2022).
  62. Martellozzo, F.; Ramankutty, N.; Hall, R.J.; Price, D.T.; Purdy, B.; Friedl, M.A. Urbanization and the loss of prime farmland: A case study in the Calgary–Edmonton corridor of Alberta. Reg. Environ. Chang. 2014, 15, 881–893. [Google Scholar] [CrossRef]
  63. Peña-Rodríguez, F.-J.; Entrena-Durán, F.; Ivorra-Cano, A.; Llorca-Linde, A. Changes in Land Use and Food Security: The Case of the De La Vega Agrarian Shire in the Southern Spanish Province of Granada. Land 2023, 12, 747. [Google Scholar] [CrossRef]
  64. Kousar, S.; Ahmed, F.; Pervaiz, A.; Bojnec, Š. Food Insecurity, Population Growth, Urbanization and Water Availability: The Role of Government Stability. Sustainability 2021, 13, 12336. [Google Scholar] [CrossRef]
  65. Li, S.; Ji, Q.; Liang, W.; Fu, B.; Lü, Y.; Yan, J.; Jin, Z.; Wang, Z.; Li, Y. Urbanization does not endanger food security: Evidence from China’s Loess Plateau. Sci. Total Environ. 2023, 871, 162053. [Google Scholar] [CrossRef] [PubMed]
  66. Wang, S.; Bai, X.; Zhang, X.; Reis, S.; Chen, D.; Xu, J.; Gu, B. Urbanization can benefit agricultural production with large-scale farming in China. Nat. Food 2021, 2, 183–191. [Google Scholar] [CrossRef]
  67. Wang, Q.; Yu, L.; Yang, Y. From Fragmentation to Intensification: Land Reform in China’s “New Era”. Int. J. Environ. Res. Public Health 2022, 19, 11223. [Google Scholar] [CrossRef] [PubMed]
  68. Zou, Y.; Zhao, W. Searching for a new dynamic of industrialization and urbanization: Anatomy of China’s characteristic town program. Urban Geogr. 2018, 39, 1060–1069. [Google Scholar] [CrossRef]
  69. Yanfeng, G.; Qinfeng, X.; Ziwei, Y. Matching degree evaluation between new urbanization and carbon emission system in China: A case study of Anhui Province in China. Sci. Rep. 2023, 13, 11724. [Google Scholar] [CrossRef]
  70. Sheng, Y.; Zhao, Y.; Zhang, Q.; Dong, W.; Huang, J. Boosting rural labor off-farm employment through urban expansion in China. World Dev. 2022, 151, 105727. [Google Scholar] [CrossRef]
  71. Wang, X.; Huang, J.; Rozelle, S. Off-farm employment and agricultural specialization in China. China Econ. Rev. 2017, 42, 155–165. [Google Scholar] [CrossRef]
  72. Koroso, N.H.; Lengoiboni, M.; Zevenbergen, J.A. Urbanization and urban land use efficiency: Evidence from regional and Addis Ababa satellite cities, Ethiopia. Habitat Int. 2021, 117, 102437. [Google Scholar] [CrossRef]
  73. Koroso, N.H.; Zevenbergen, J.A.; Lengoiboni, M. Urban land use efficiency in Ethiopia: An assessment of urban land use sustainability in Addis Ababa. Land Use Policy 2020, 99, 105081. [Google Scholar] [CrossRef]
  74. Ji, Y.; Guo, X.; Zhong, S.; Wu, L. Land Financialization, Uncoordinated Development of Population Urbanization and Land Urbanization, and Economic Growth: Evidence from China. Land 2020, 9, 481. [Google Scholar] [CrossRef]
  75. Xie, X.; Fang, B.; Xu, H.; He, S.; Li, X. Study on the coordinated relationship between Urban Land use efficiency and ecosystem health in China. Land Use Policy 2021, 102, 105235. [Google Scholar] [CrossRef]
  76. Zhang, Q.; Liu, Q. Comparative cost-benefit study of potato and the three major staple foods—On the feasibility of replacing maize with potatoes in the “sickle bend” region? J. Chengdu Univ. (Soc. Sci.) 2019, 1, 42–47. [Google Scholar]
  77. Chen, M.; Chen, L.; Cheng, J.; Yu, J. Identifying interlinkages between urbanization and Sustainable Development Goals. Geogr. Sustain. 2022, 3, 339–346. [Google Scholar] [CrossRef]
  78. Viana, C.M.; Freire, D.; Abrantes, P.; Rocha, J.; Pereira, P. Agricultural land systems importance for supporting food security and sustainable development goals: A systematic review. Sci. Total Environ. 2022, 806, 150718. [Google Scholar] [CrossRef]
Figure 1. Impact mechanism of urbanization on carbon emissions from potato production.
Land 13 00147 g001
Figure 2. Spatial distribution of potato-producing areas, staple grain-producing areas, and national poverty-stricken counties in China: (a) Potato production in main potato-producing areas and distribution of national poverty-stricken counties; (b) Staple grain production in major producing areas of stable grain and distribution of national poverty-stricken counties. Note: The base map is sourced from the Standard Map Service System of the Ministry of Natural Resources, with the base map review number GS (2019) 1822 [54]; the data on potato production and staple grain production are from the National Bureau of Statistics.
Land 13 00147 g002
Figure 3. Spatial evolution characteristics of urbanization in China: (a) Spatial evolution of CU; (b) Spatial evolution of EU; (c) Spatial evolution of PU; (d) Spatial evolution of LU.
Land 13 00147 g003aLand 13 00147 g003b
Figure 4. Spatial evolution characteristics of carbon emissions from food production: (a) Spatial evolution of TCEPP; (b) Spatial evolution of CEIPP; (c) Spatial evolution of TCESG; (d) Spatial evolution of CEISG.
Land 13 00147 g004
Table 1. Results of factors influencing CEIPP under the economic matrix and emission matrix in SDM.
VariableEconomic MatrixEmission Matrix
CU−8.1560 **−6.6033 ***
(3.8198)(1.8330)
PU−5.6442−5.8359 ***
(5.8748)(2.1286)
LU13.169415.1825 *
(13.1261)(8.0461)
EU−0.8002 *
(0.4657)
−3.6589 **
(1.8157)
PTE−1.1470 *−1.1453 *−1.1674 *−1.1718 *−0.9207 ***−0.9169 ***−0.9693 ***−0.9505 ***
(0.6980)(0.6967)(0.6792)(0.7239)(0.2837)(0.2802)(0.2872)(0.3177)
PCAO0.03710.05370.02180.03610.02340.02950.38120.0227
(0.0568)(0.0679)(0.0494)(0.0395)(0.0378)(0.0260)(0.3675)(0.0277)
PDA−0.1484−0.1716−0.1468−0.17210.10330.5184 **0.3564 *0.2211 **
(0.2278)(0.2351)(0.2287)(0.2310)(0.1559)(0.2411)(0.2062)(0.1057)
PIS0.86050.78740.63760.6154−0.04660.70750.75050.6835
(1.1080)(1.0586)(0.9317)(0.9441)(0.8951)(0.5947)(0.6101)(0.6614)
AO−0.1275−0.0973−0.1792−0.1243−2.0896 *−1.9327 *−1.9928 *−1.7308 *
(0.3506)(0.3102)(0.3717)(0.3380)(1.2094)(1.1169)(1.2893)(1.0252)
PAL−0.04140.6896 *0.9199 *1.0771 *0.5125 **0.8757 *0.5780 *0.0354
(0.1233)(0.3435)(0.5178)(0.6292)(0.2498)(0.5011)(0.3320)(0.0748)
AFE0.55850.60930.79690.46600.45782.76711.35401.7748
(1.5064)(1.5414)(1.5349)(1.5594)(1.1996)(1.4519)(1.0021)(2.1858)
EPFE−2.0634−1.4826−1.5932−1.7387−1.5771 *−1.9311 *−0.8969 **−1.7860 *
(2.3053)(2.2909)(2.3653)(2.4121)(0.9043)(1.1304)(0.4425)(1.1219)
W·CU8.3907 **6.8300 ***
(3.8226)(1.9291)
W·PU5.5337 **5.8700 ***
(2.7024)(2.1262)
W·LU−17.2351 **
(8.5926)
W·EU7.6009 *
(4.0343)
W·PDA0.4993 *0.4216 *
(0.3023)(0.2389)
W·PIS0.7935 **
(0.3908)
W·AO2.1416 *2.0368 *1.99611.5131 **
(1.2808)(1.1902)(1.4888)(0.7196)
W·PAL−0.7445 *−0.7709 *−0.9419 *−1.092 *
(0.4145)(0.5161)(0.5362)(0.6333)
Spatial0.18870.3914 **0.20010.17510.3822 **0.3849 **0.3683 **0.3634 **
R20.41740.42450.50550.44110.63930.68840.71080.6432
Log-likelihood−152.4583−152.4356−152.6347−152.8957−141.0648−139.8980−136.8646−140.6961
Note: the standard error of coefficient estimation is shown in brackets, ‘*’, ‘**’, ‘***’ represent the significance levels of 10%, 5% and 1%, respectively; “—” represent no data.
Table 2. Effect decomposition of factors influencing CEIPP under emission matrix.
VariableDirect EffectIndirect Effect
CU−2.5818 ***1.9283 ***
(0.8126)(0.3949)
PU−2.9479 **1.0661 ***
(1.3979)(0.2444)
LU11.85406.2697
(14.596)(1.6931)
EU−1.0210 *1.9355 ***
(0.5693)(0.4396)
PTE−1.4241 ***−1.3767 *−1.5022 ***−1.3159 **−0.1831 ***−0.10066 **−0.1093 *−0.1391 *
(0.2446)(0.8057)(0.3391)(0.5916)(0.0617)(0.0493)(0.0601)(0.0789)
PCAO0.04160.33290.0148−0.0202−0.5026−0.4472−0.9271 *−1.0613 *
(0.0622)(0.2940)(0.3764)(1.0466)(0.4065)(0.3056)(0.4396)(0.5648)
PDA0.6428 **0.8406 *1.17841.0901−0.50590.50600.58330.6810
(0.2964)(0.4830)(0.8165)(0.8064)(0.3608)(0.3270)(0.6650)(0.9707)
PIS0.9436 *0.9043 *1.0157 **0.5865 *−0.8151 **−0.6136 **−0.8382 *−0.3237 ***
(0.5173)(0.5248)(0.4898)(0.3372)(0.4019)(0.2875)(0.4846)(0.1031)
AO−0.5109 *0.1387−0.2427−0.08190.4952 **0.22500.12080.1926
(0.3471)(0.7181)(1.1515)(1.3026)(0.2434)(0.5786)(2.0381)(0.3761)
PAL−0.3066 **−0.2403 ***−0.1716 **−0.14220.2034 **0.22840.15130.1074
(0.1482)(0.0815)(0.0796)(0.1306)(0.1091)(0.2691)(0.1603)(0.1311)
AFE0.43920.44871.17341.1450−0.4076 *−0.4266 **−1.0927 ***−1.072 ***
(0.9169)(0.6793)(1.4399)(1.6786)(0.2343)(0.1924)(0.2813)(0.2267)
EPFE−2.3667−1.6259−1.1818−2.0335−0.9513 ***−0.7314 ***−1.8510 ***−1.6598 ***
(2.4673)(2.2444)(1.5935)(2.1941)(0.2887)(0.2376)(0.1984)(0.1250)
Note: the standard error of coefficient estimation is shown in brackets; ‘*’, ‘**’, and ‘***’ represent the significance levels of 10%, 5% and 1%, respectively; “—” represents no data.
Table 3. Effect decomposition of factors influencing CEISG under emission matrix.
VariableDirect EffectIndirect EffectTotal Effect
CU−0.1221 (1.5377)0.1169 (1.3704)−0.0051 (0.6802)
PTE−0.1102 (0.0585) *0.0239 (0.4806)−0.0863 (0.0464) *
PCAO0.0264 (0.5814)−0.0410 (0.5286)−0.0146 (0.4648)
PDA0.0244 (0.0103) ***−0.0152 (0.1449)0.0111 (0.2332)
PIS−0.1935 (0.8113)0.1236 (0.9328)−0.0699 (1.0954)
AO−0.1250 (0.0294) ***0.0560 (0.0417)−0.0690 (0.0310) ***
PAL0.0130 (0.7409)0.0125 (0.6805)0.0255 (0.4413)
AFE−0.2414 (1.6306)0.1367 (1.5129)−0.1046 (0.8954)
EPFE0.1103 (2.6425)−0.2973 (2.5579)−0.1869 (2.3567)
Note: the standard error of coefficient estimation is shown in brackets, ‘*’ and ‘***’ represent the significance levels of 10%, 5% and 1%, respectively.
Disclaimer/Publisher’s Note: The statements, opinions and data contained in all publications are solely those of the individual author(s) and contributor(s) and not of MDPI and/or the editor(s). MDPI and/or the editor(s) disclaim responsibility for any injury to people or property resulting from any ideas, methods, instructions or products referred to in the content.

