
Assessing the Vulnerability of Medicinal and Aromatic Plants to Climate and Land-Use Changes in a Mediterranean Biodiversity Hotspot

 ,
,  ,
,  , ,
, ,  ,
,  ,
, 
Abstract
1. Introduction
- the uncontrolled and unsustainable harvesting for personal use and also trade. This underlies the need for conservation and local cultivation of valued plants and sustainability training for harvesters and certification of commercial material [84],
- the land use changes and habitat fragmentation, and
- A.
- Species-specific responses to drivers of global change
- 1.
- How will climate and land-use change affect the MAP taxa in Chelmos-Vouraikos National Park?
- 2.
- Will climate change or land-use change pose a more significant threat to MAP taxa, and will the effects be species-specific?
- 3.
- How will the spatial distribution of MAP taxa within the Chelmos-Vouraikos National Park evolve in response to these changes?
- B.
- Biodiversity hotspots over time
- 4.
- Which areas within the Chelmos-Vouraikos National Park serve as taxonomically and phylogenetically geographically weighted hotspots?
- 5.
- How will these areas shift in altitude and size over time?
- 6.
- Which areas within the Chelmos-Vouraikos National Park will experience high taxonomic and phylogenetic temporal turnover?
- C.
- Conservation strategies
- 7.
- What is the vulnerability of the Medicinal and Aromatic Plant taxa in Chelmos-Vouraikos National Park?
2. Materials and Methods
2.1. Species Occurrence Data
2.2. Environmental Data
- three different periods, i.e., the 2020s (2011–2040), 2050s (2041–2070) and 2080s (2071–2100) [119],
- three global circulation models (GCMs) (i.e., other (CCSM4, HadGEM2, and an ensemble of 15 global circulation models), and
2.3. Species Distribution Models
2.4. Biodiversity Hotspots Detection
2.5. Temporal Beta Diversity
2.6. Sensitivity, Exposure and Vulnerability to Climate and Land-Use Change
3. Results
3.1. Species Distribution Models
- The LULC category ‘Needle-leaf evergreen temperate trees’ for the LULCC model
- The precipitation of the wettest month for the CC model and
- Aspect for the CC-LULCC model
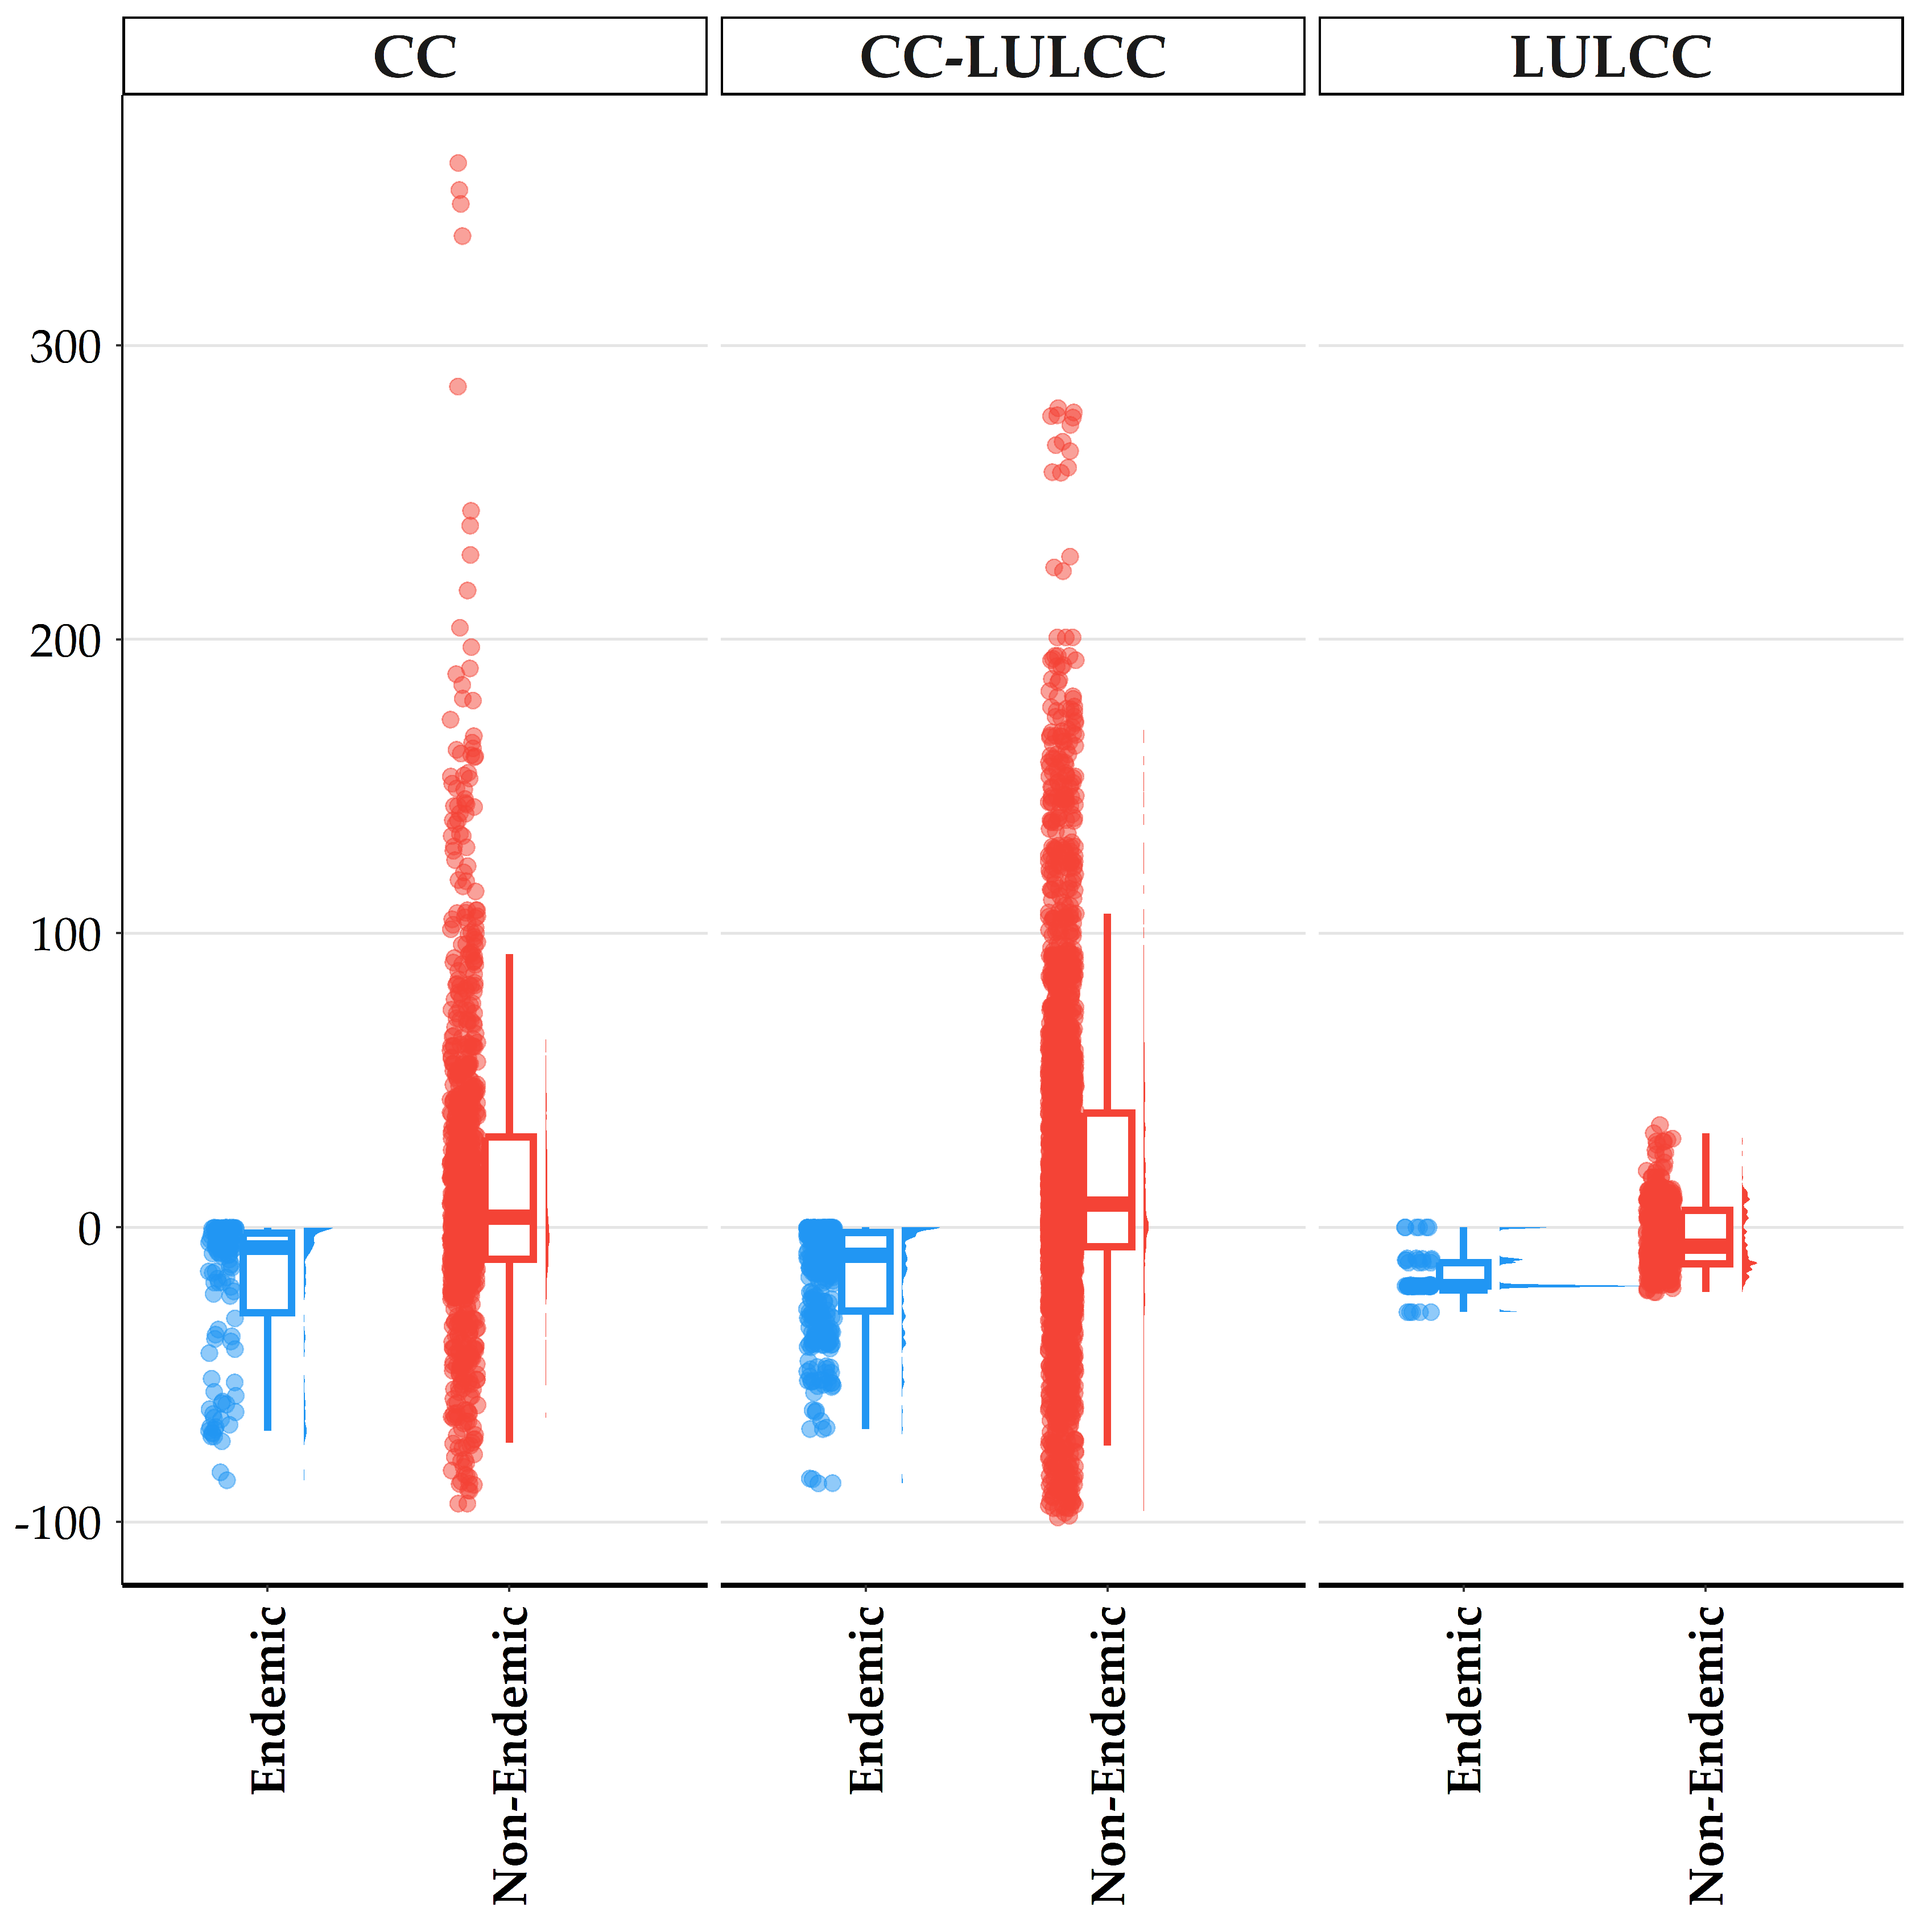
3.2. Habitat Suitability Range Change
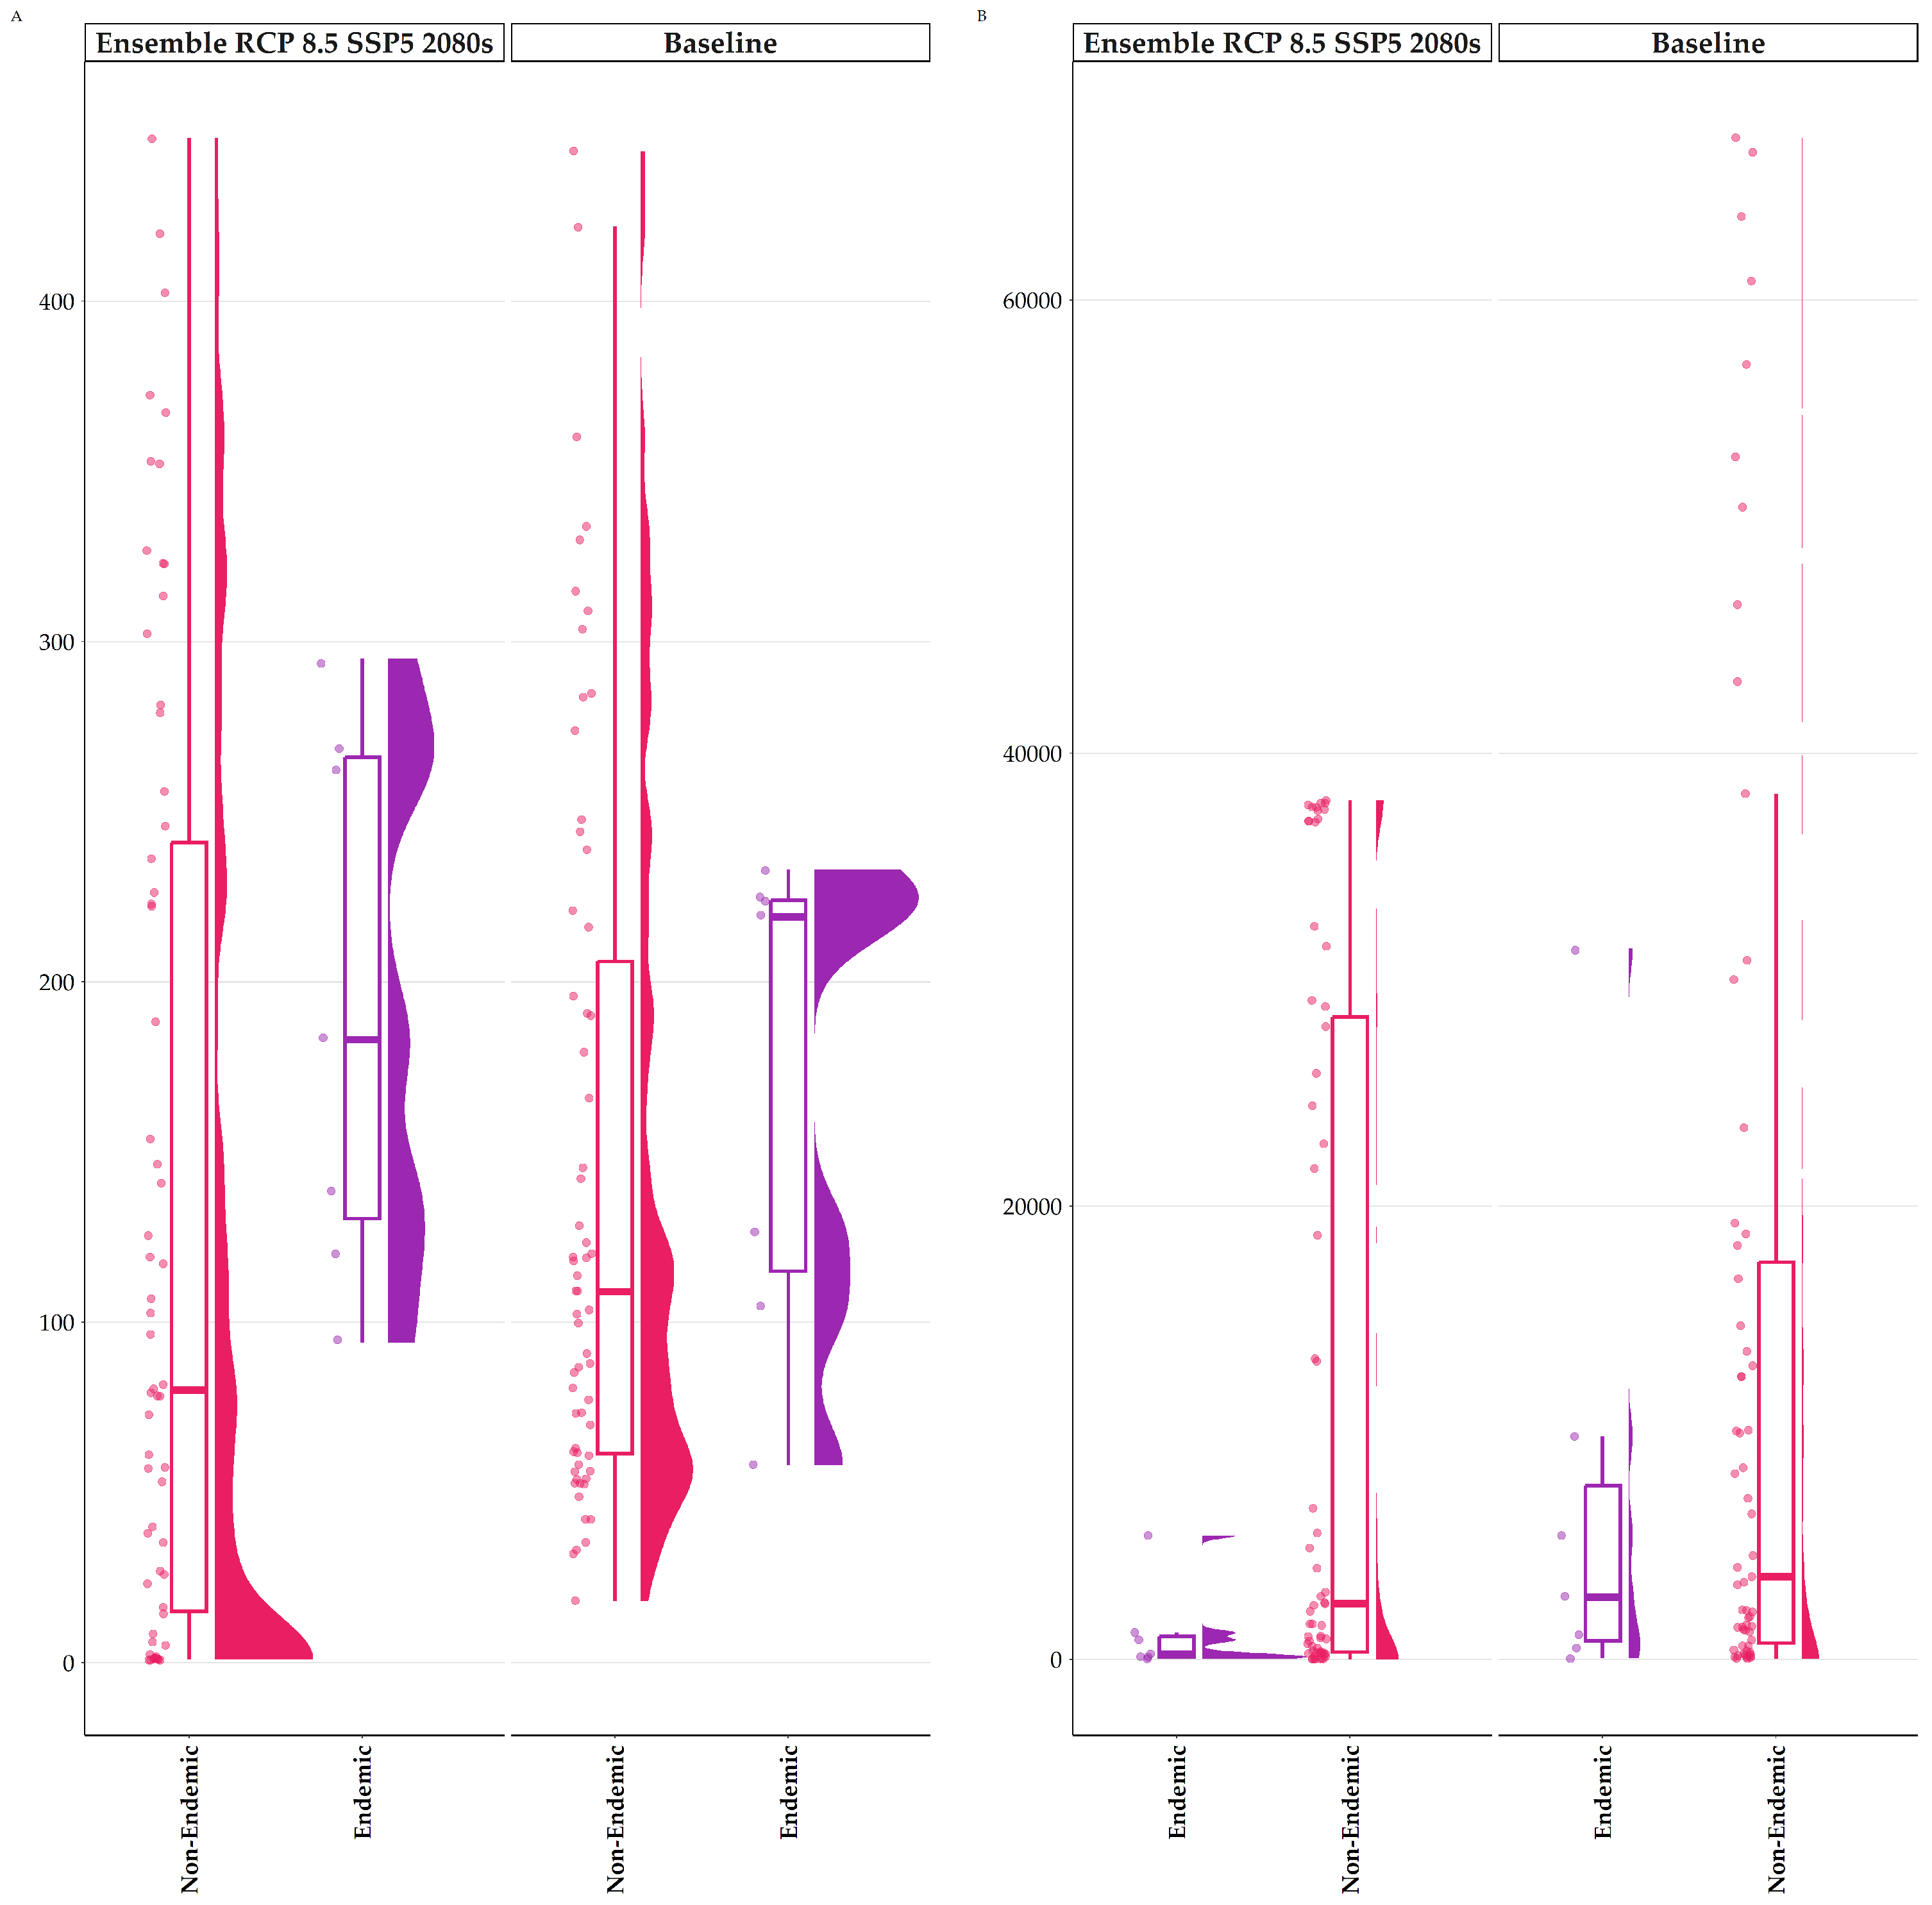
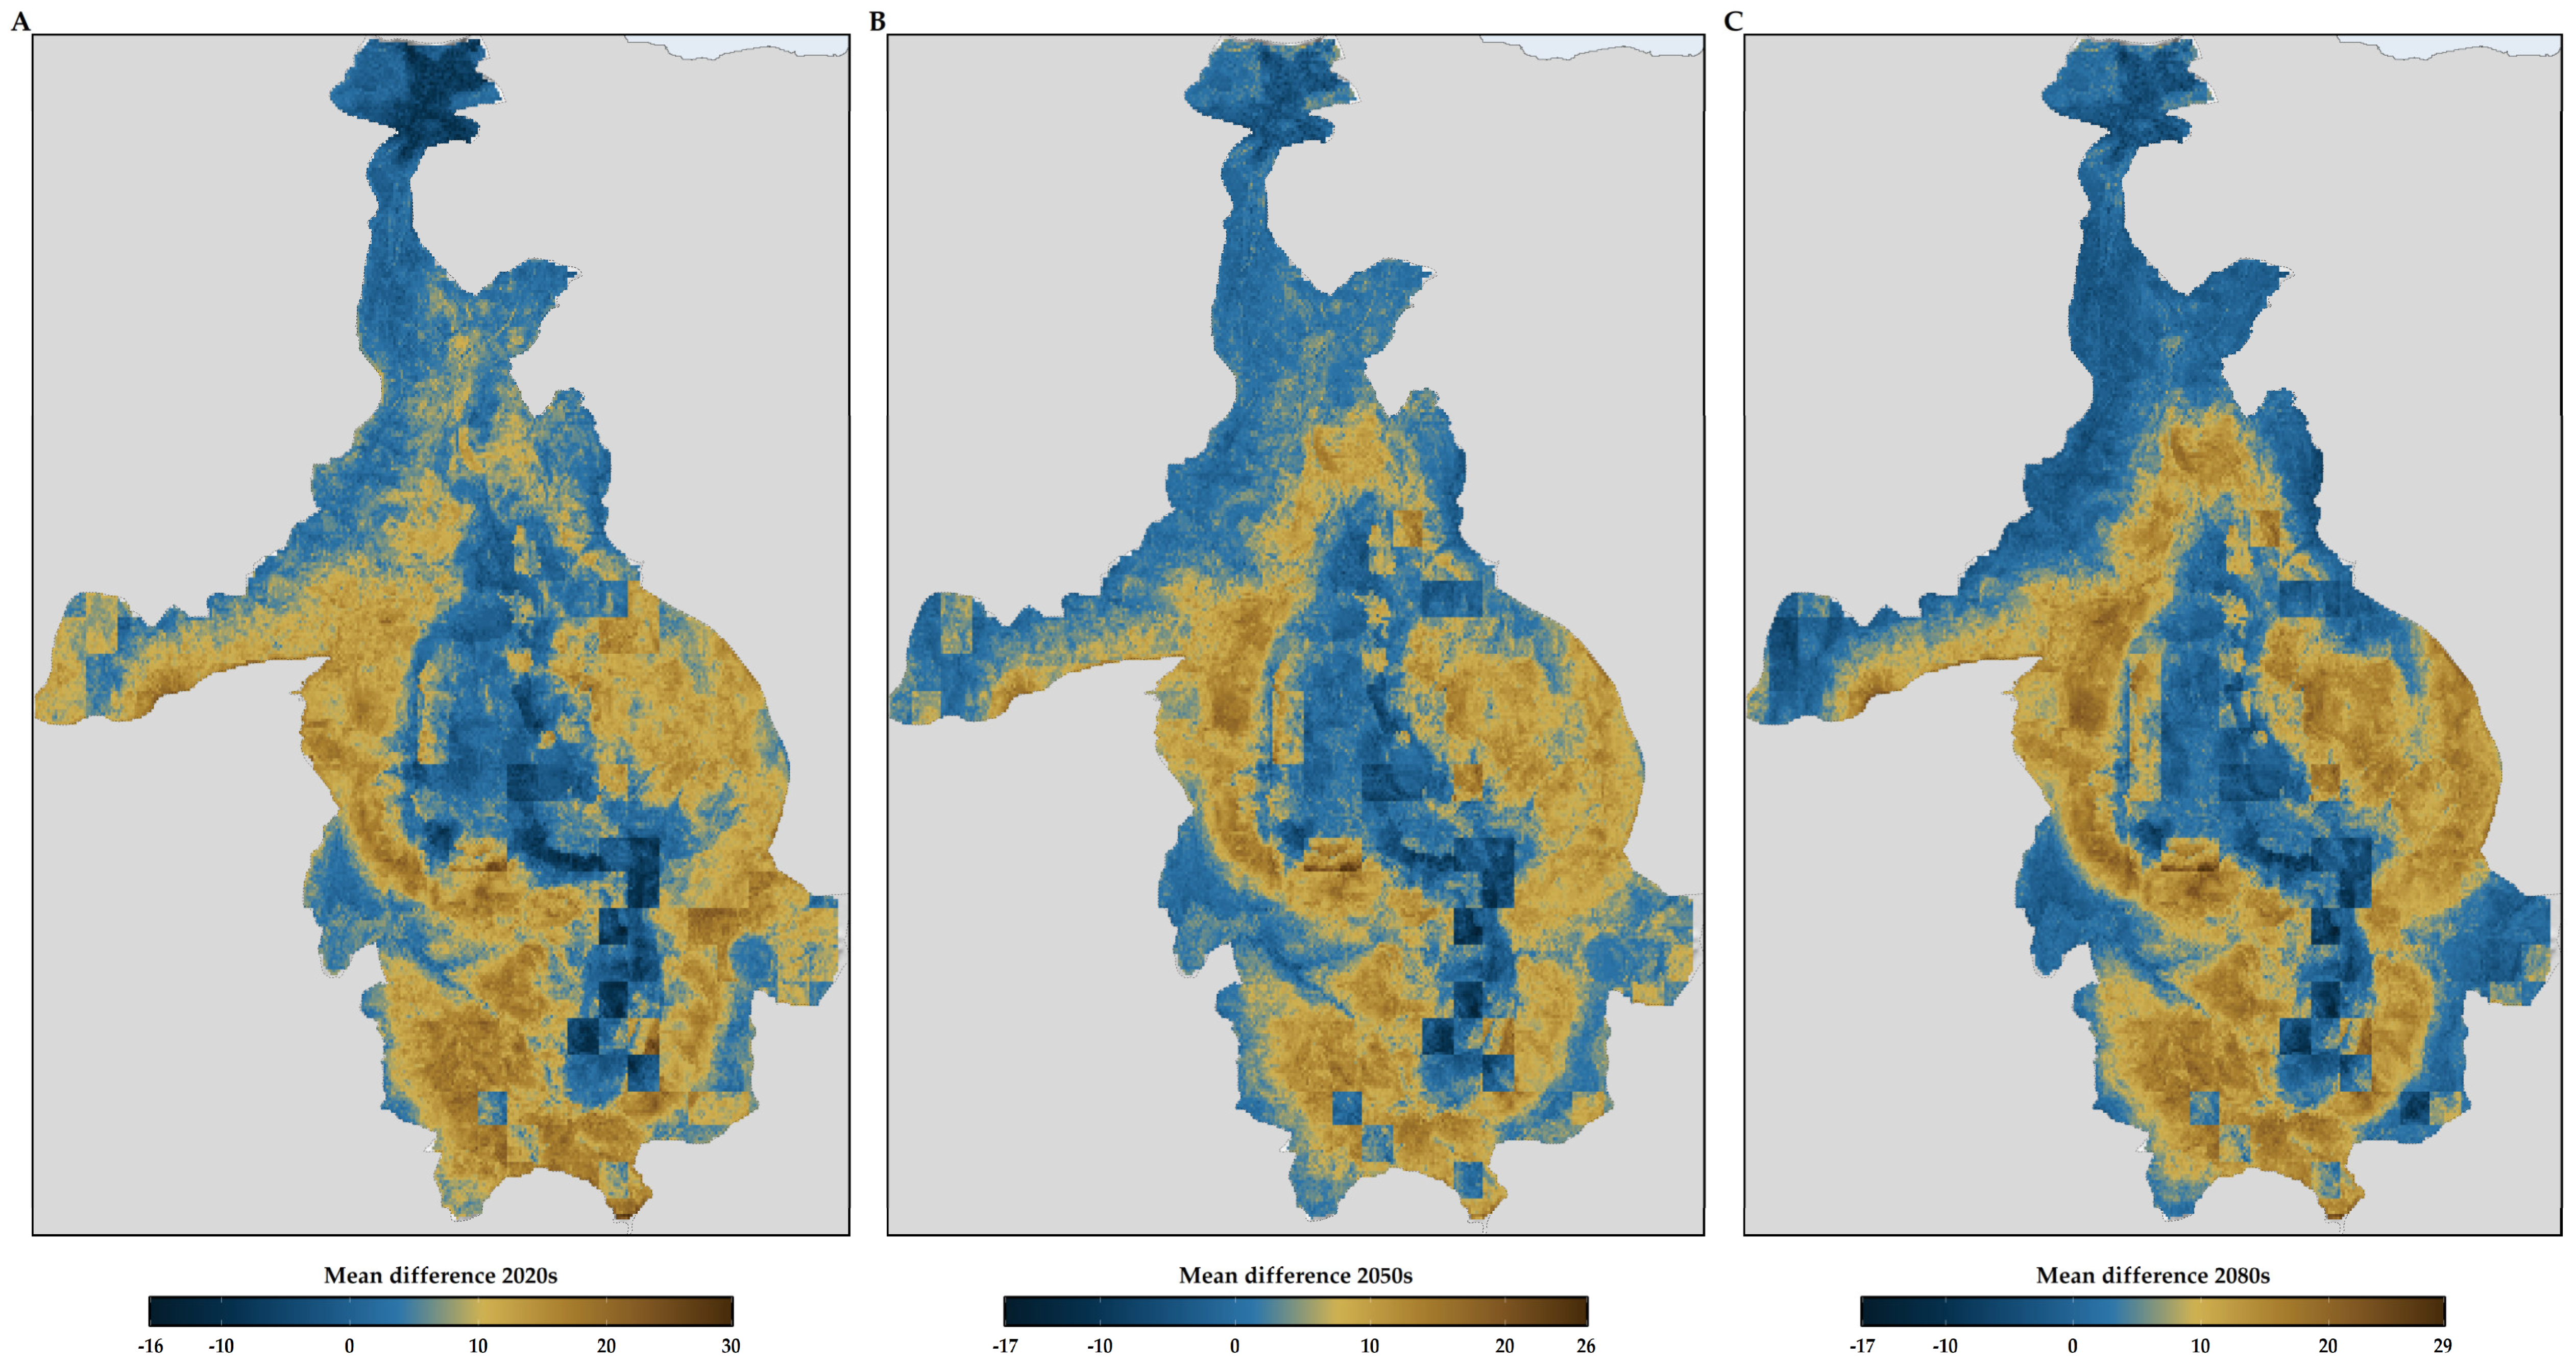
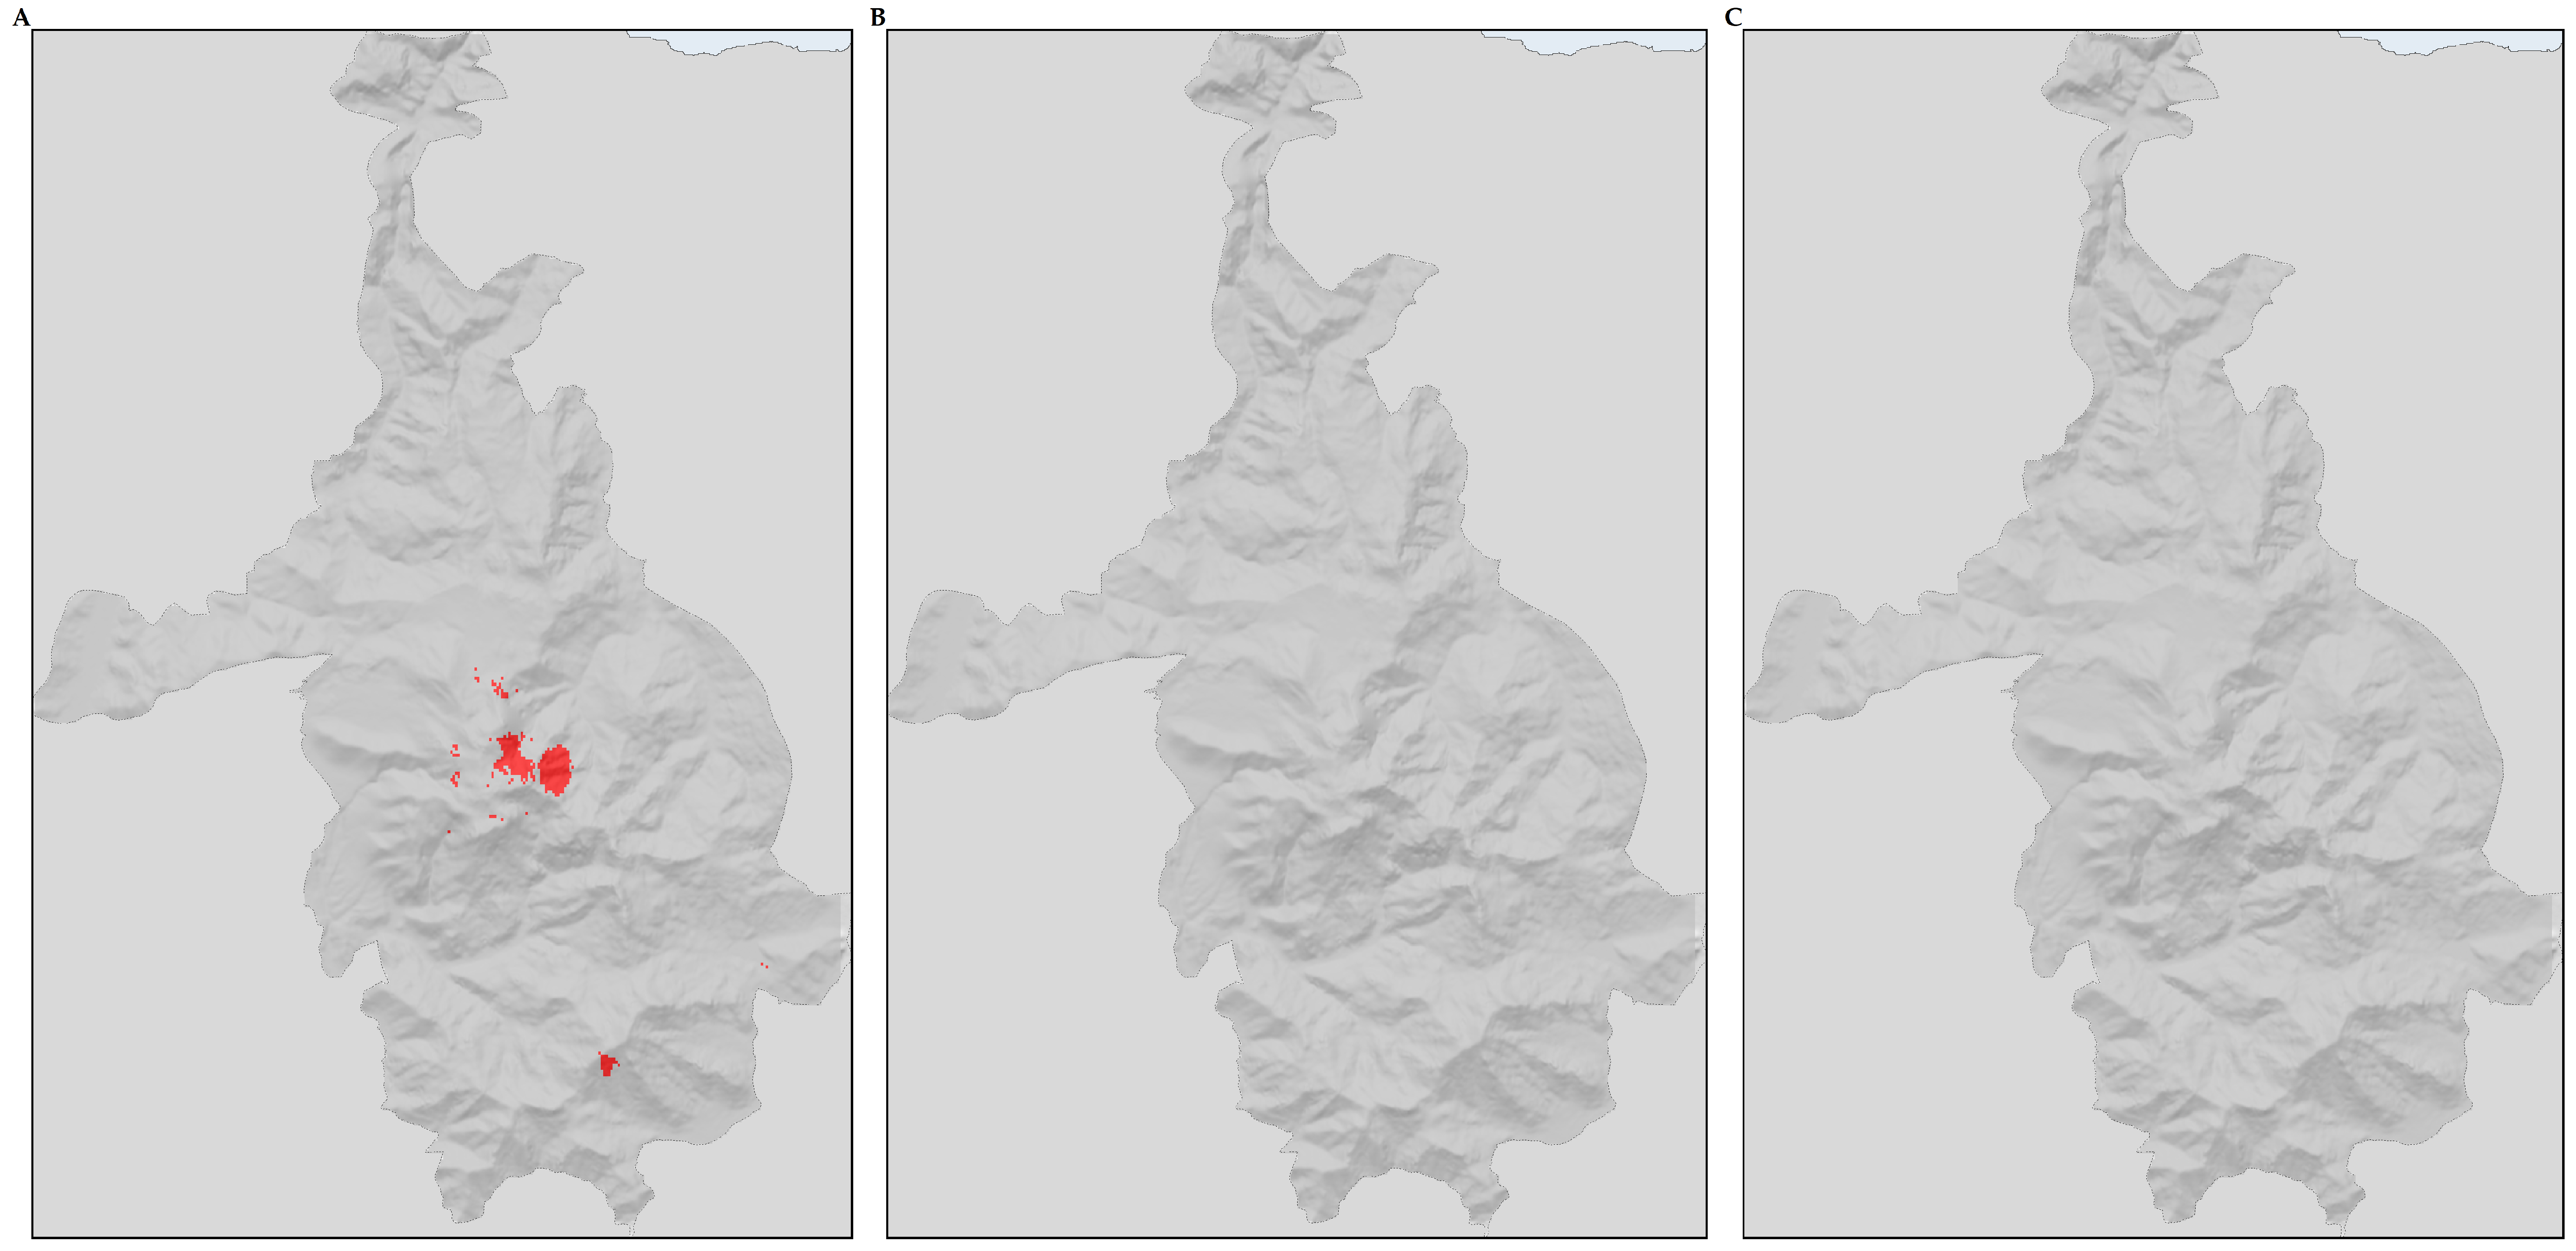
3.3. Biodiversity Hotspots
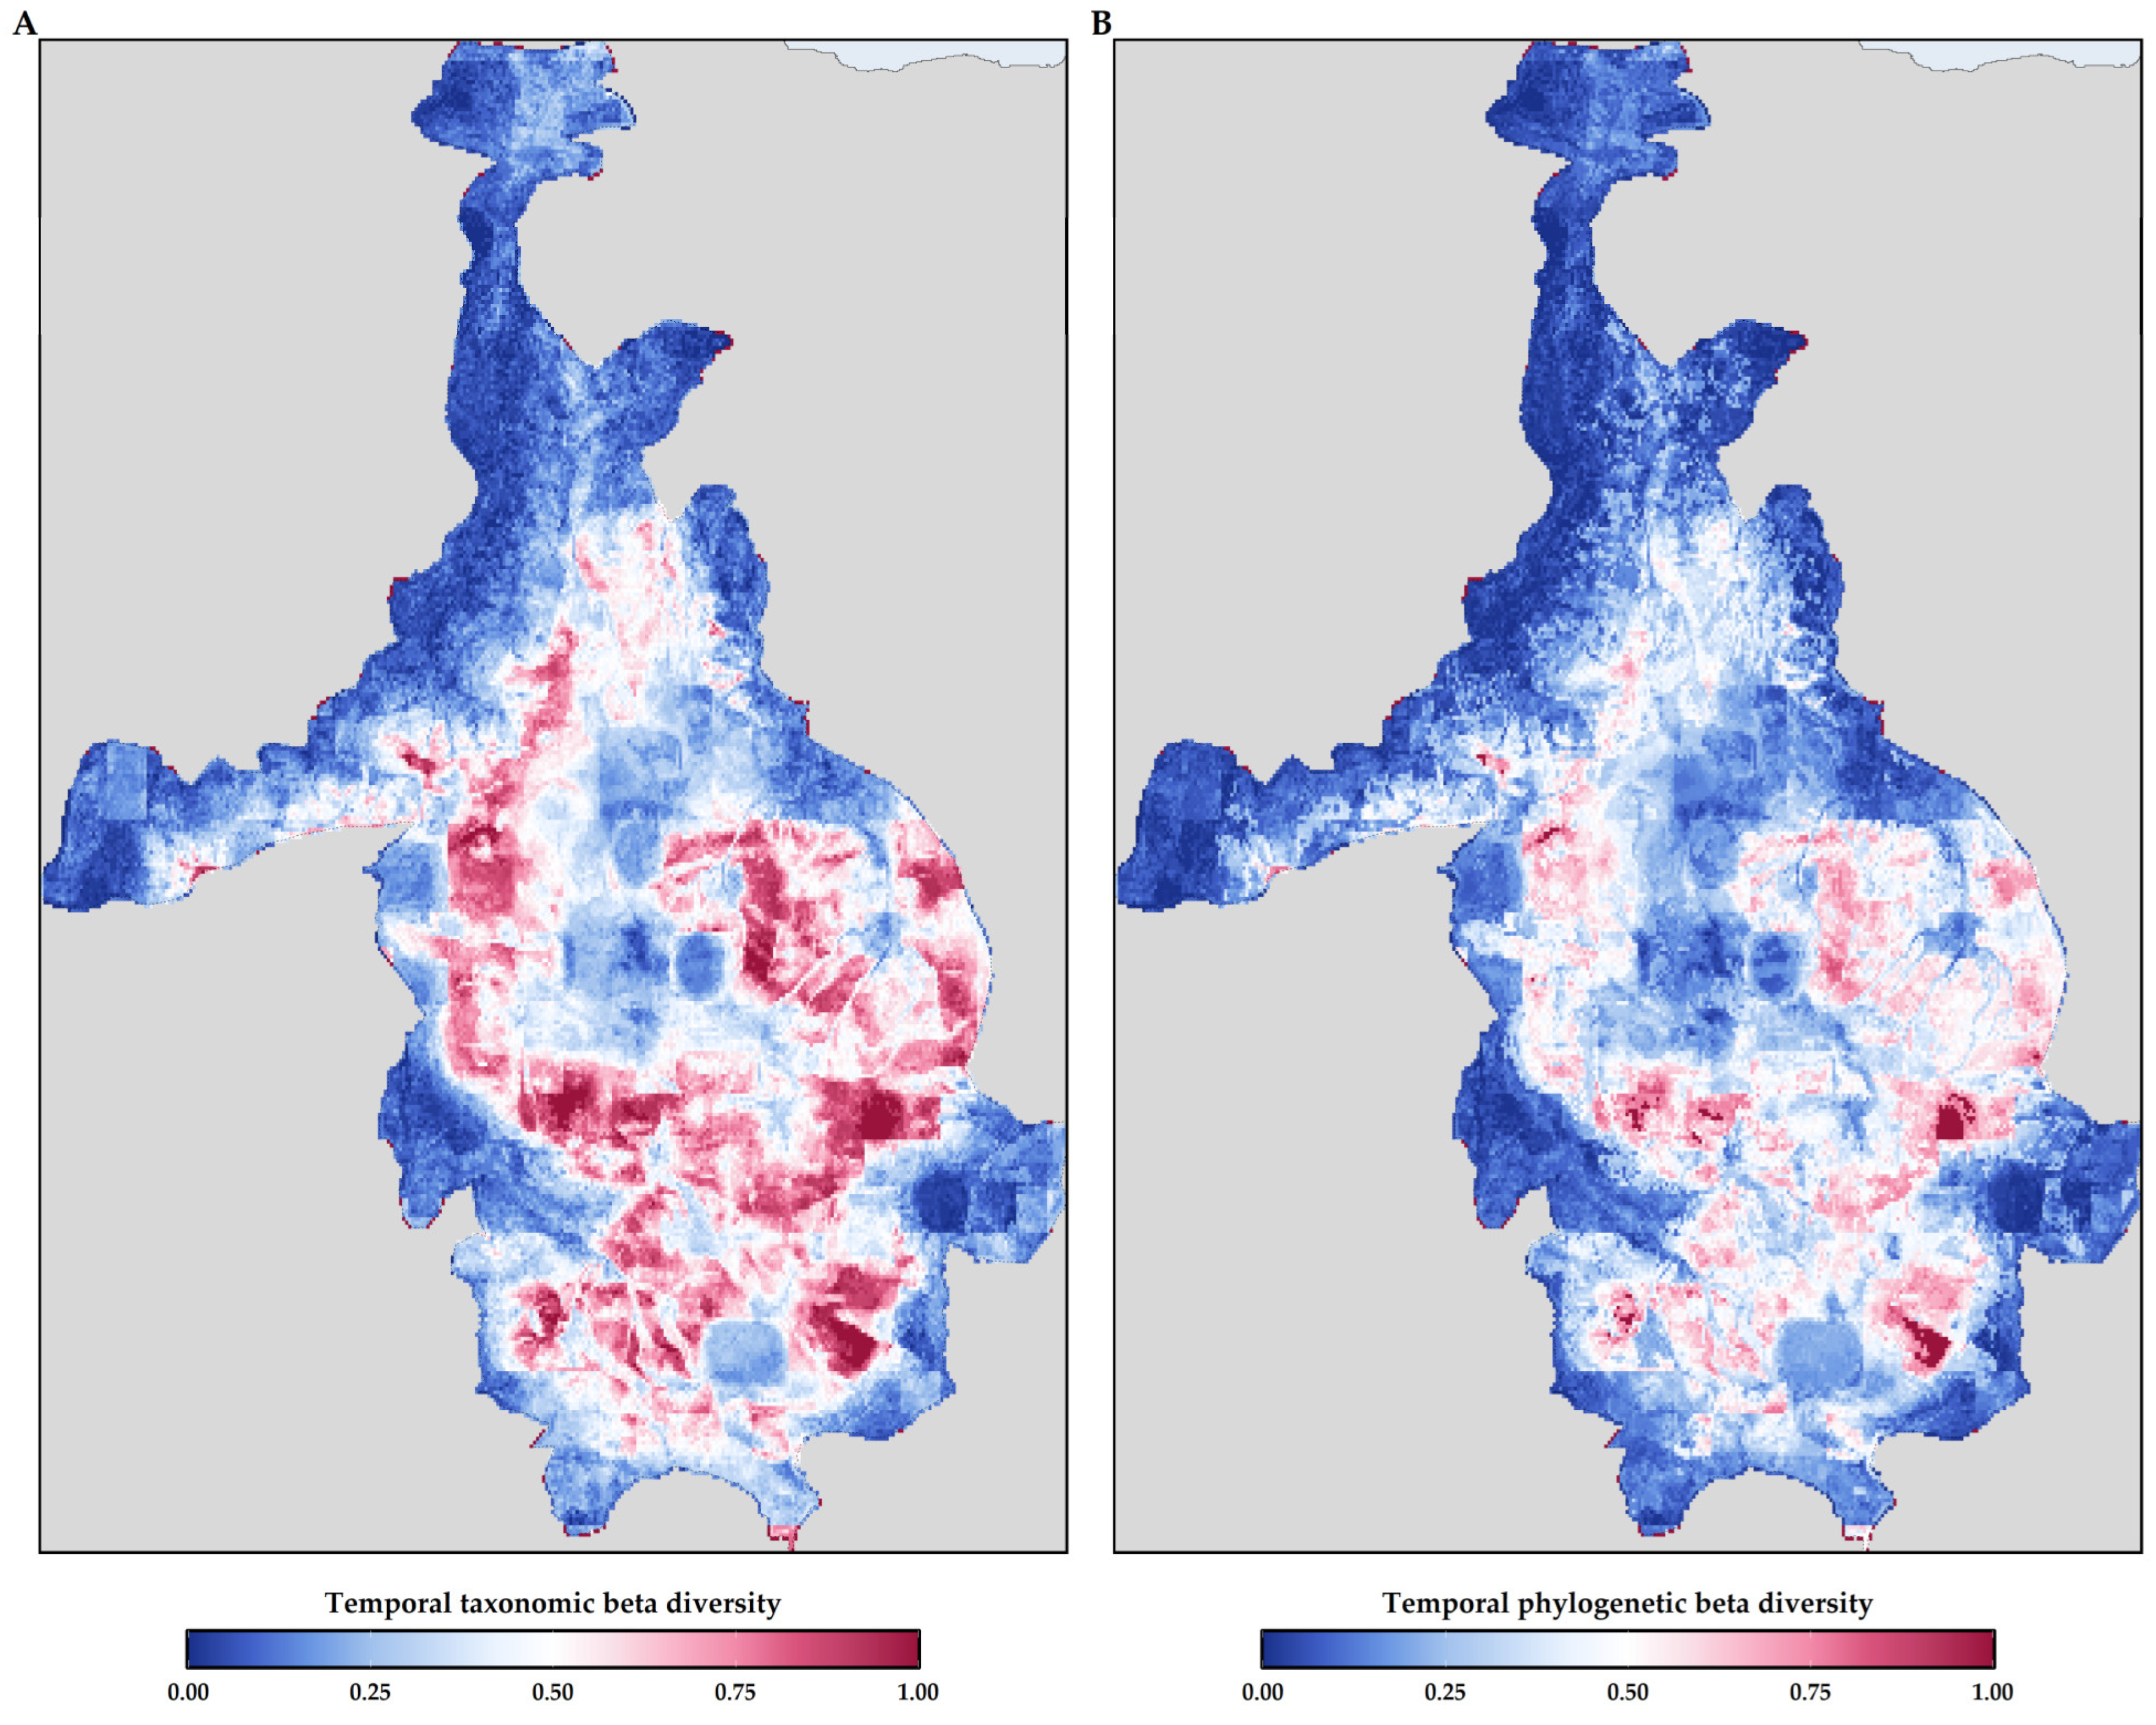
3.4. Temporal Beta Diversity
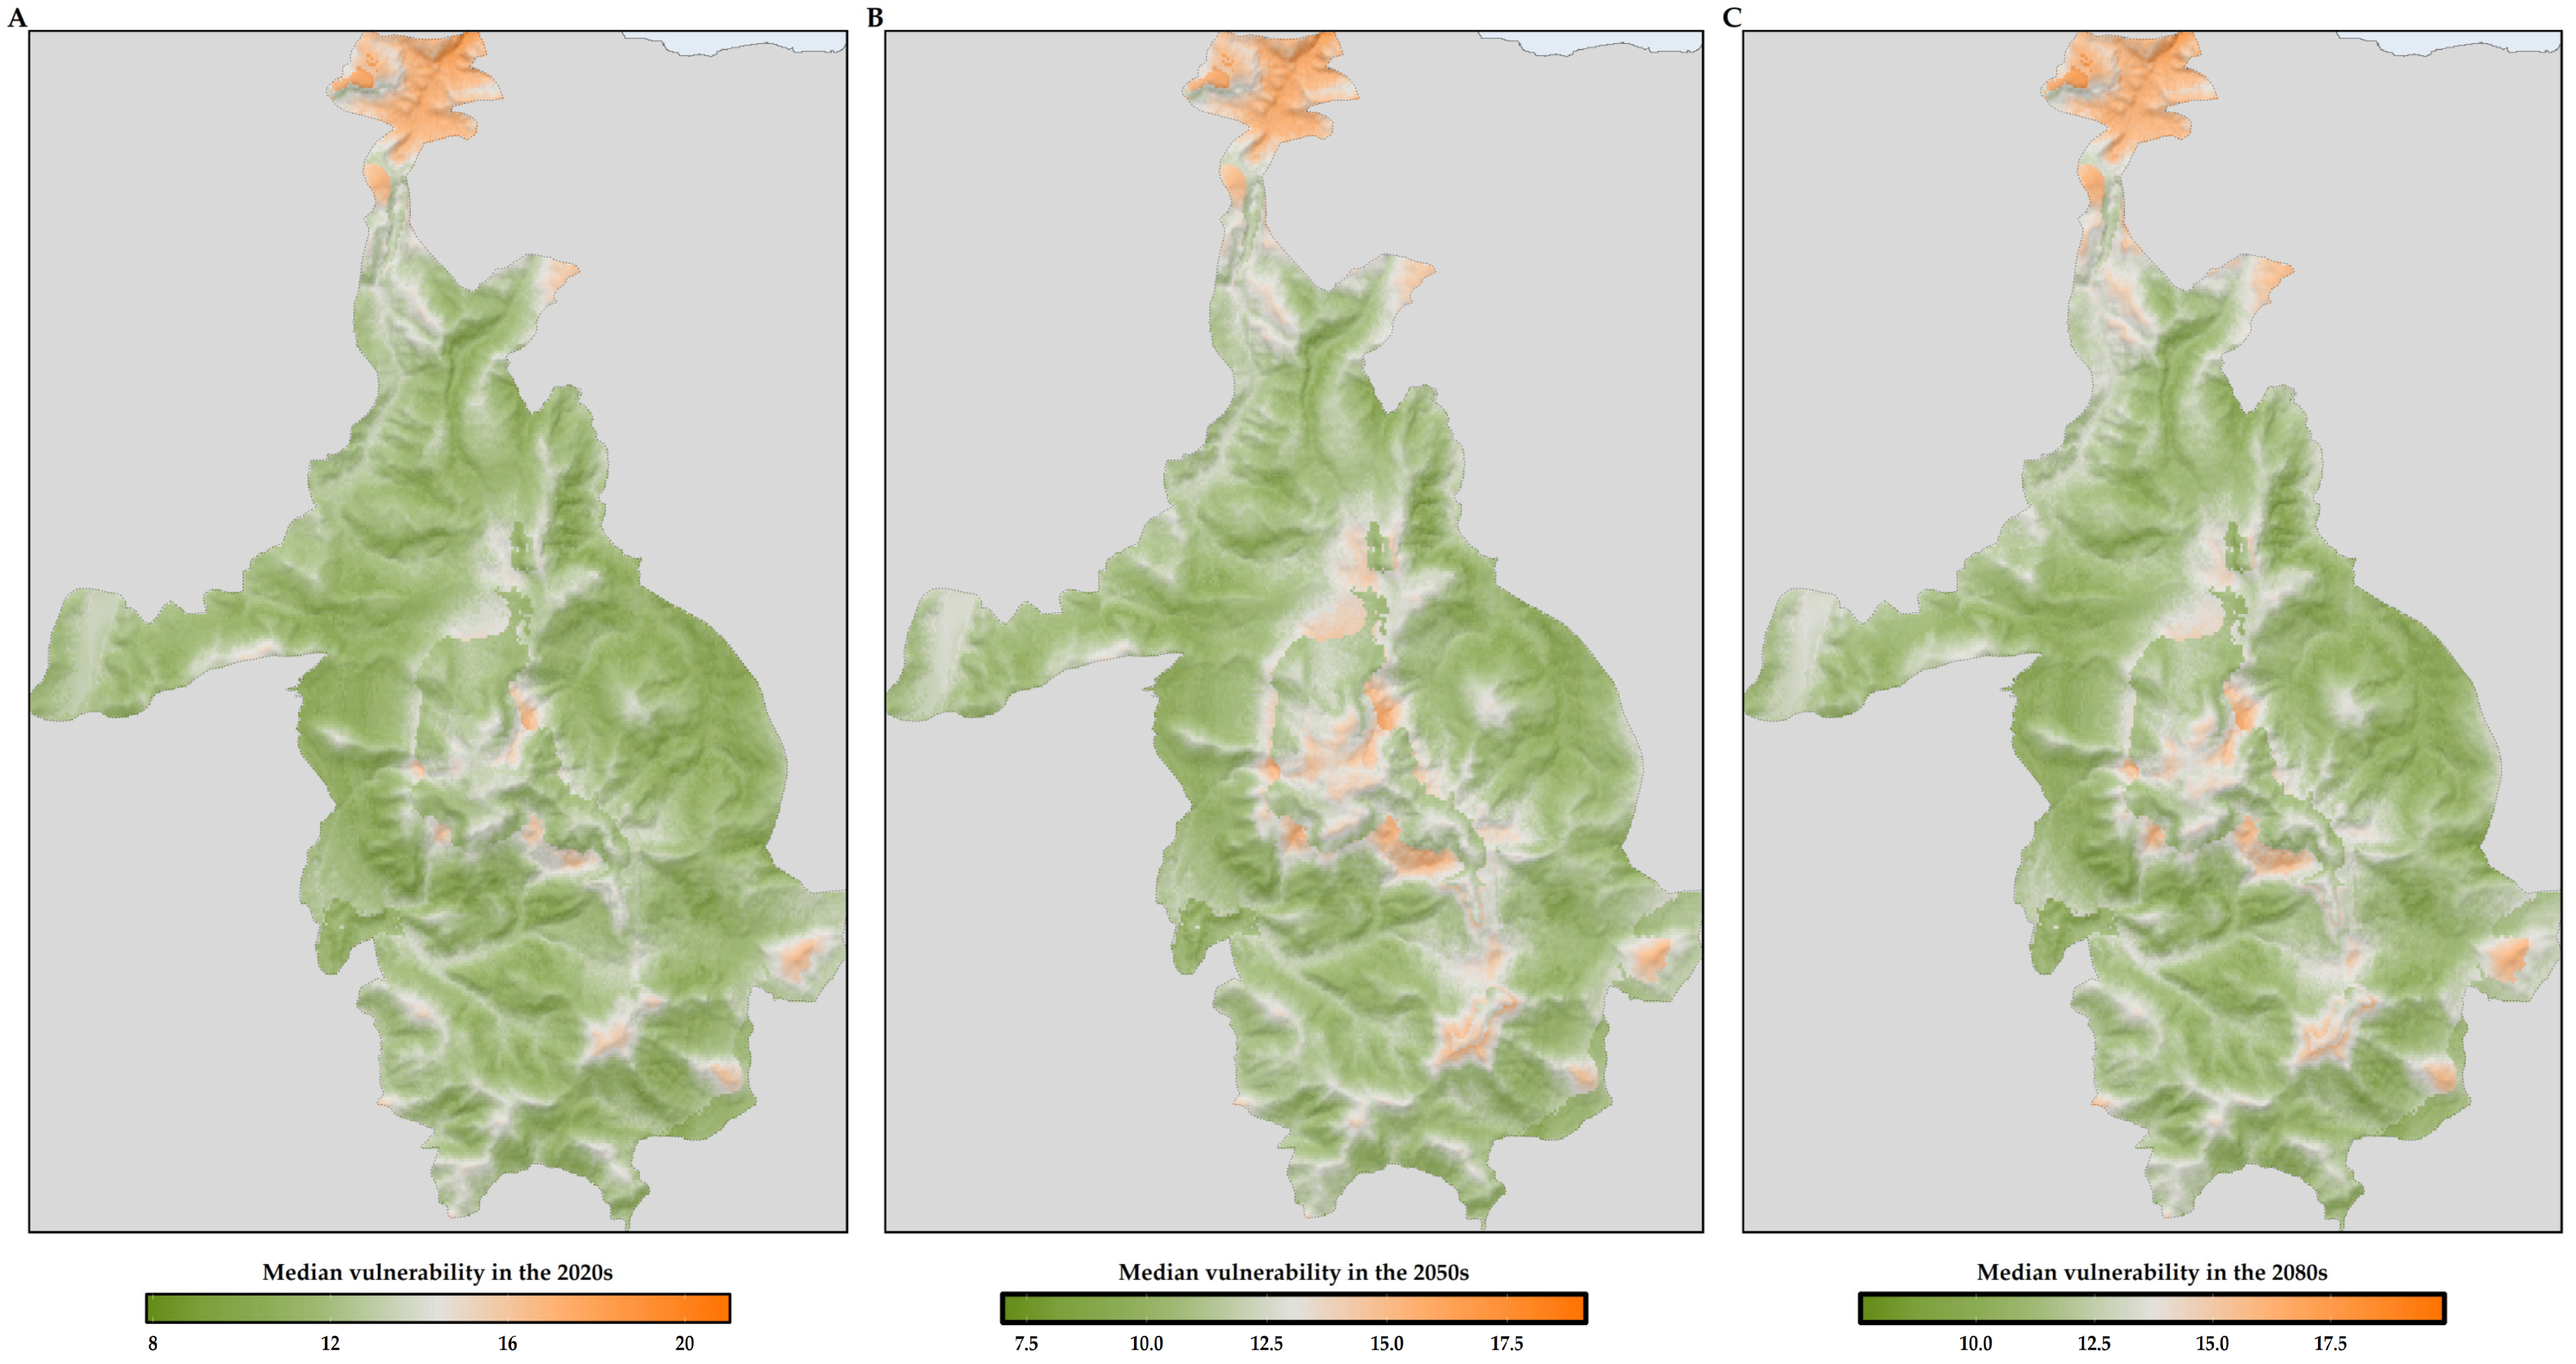
3.5. Sensitivity, Exposure and Vulnerability to Climate and Land-Use Change
4. Discussion
4.1. Species-Specific Responses to Drivers of Global Change
4.2. Biodiversity Hotspots
4.3. Conservation Strategies
4.4. Policy Implications
5. Conclusions
Supplementary Materials
Author Contributions
Funding
Data Availability Statement
Conflicts of Interest
References
- Cai, L.; Kreft, H.; Taylor, A.; Denelle, P.; Schrader, J.; Essl, F.; van Kleunen, M.; Pergl, J.; Pyšek, P.; Stein, A.; et al. Global models and predictions of plant diversity based on advanced machine learning techniques. New Phytol. 2023, 237, 1432–1445. [Google Scholar] [CrossRef] [PubMed]
- Cai, L.; Kreft, H.; Taylor, A.; Schrader, J.; Dawson, W.; Essl, F.; van Kleunen, M.; Pergl, J.; Pyšek, P.; Winter, M.; et al. Climatic stability and geological history shape global centers of neo- and paleoendemism in seed plants. Proc. Natl. Acad. Sci. USA 2023, 120, e2300981120. [Google Scholar] [CrossRef]
- Tietje, M.; Antonelli, A.; Forest, F.; Govaerts, R.; Smith, S.A.; Sun, M.; Baker, W.J.; Eiserhardt, W.L. Global hotspots of plant phylogenetic diversity. New Phytol. 2023, 240, 1636–1646. [Google Scholar] [CrossRef] [PubMed]
- Sabatini, F.M.; Jiménez-Alfaro, B.; Jandt, U.; Chytrý, M.; Field, R.; Kessler, M.; Lenoir, J.; Schrodt, F.; Wiser, S.K.; Arfin Khan, M.A.S.; et al. Global patterns of vascular plant alpha diversity. Nat. Commun. 2022, 13, 4683. [Google Scholar] [CrossRef] [PubMed]
- Qian, H.; Zhang, J.; Jiang, M. Global patterns of taxonomic and phylogenetic diversity of flowering plants: Biodiversity hotspots and coldspots. Plant Divers. 2023, 45, 265–271. [Google Scholar] [CrossRef]
- Le Roux, J.J.; Hui, C.; Castillo, M.L.; Iriondo, J.M.; Keet, J.H.; Khapugin, A.A.; Médail, F.; Rejmánek, M.; Theron, G.; Yannelli, F.A.; et al. Recent Anthropogenic Plant Extinctions Differ in Biodiversity Hotspots and Coldspots. Curr. Biol. 2019, 29, 2912–2918.e2. [Google Scholar] [CrossRef] [PubMed]
- Moreira, H.; Kuipers, K.J.J.; Posthuma, L.; Zijp, M.C.; Hauck, M.; Huijbregts, M.A.J.; Schipper, A.M. Threats of land use to the global diversity of vascular plants. Divers. Distrib. 2023, 29, 688–697. [Google Scholar] [CrossRef]
- Asamoah, E.F.; Beaumont, L.J.; Maina, J.M. Climate and land-use changes reduce the benefits of terrestrial protected areas. Nat. Clim. Chang. 2021, 11, 1105–1110. [Google Scholar] [CrossRef]
- Robiansyah, I.; Primananda, E.; Zulkarnaen, R.N.; Helmanto, H.; Kusuma, Y.W.C.; Yudaputra, A. Climate Change Impact on Medicinal Plants: An Insight from the IUCN Red List of Threatened Species. In Medicinal Plants: Biodiversity, Biotechnology and Conservation; Springer: Singapore, 2023; pp. 115–131. [Google Scholar]
- Ekka, P.; Patra, S.; Upreti, M.; Kumar, G.; Kumar, A.; Saikia, P. Land Degradation and Its Impacts on Biodiversity and Ecosystem Services. In Land and Environmental Management through Forestry; Wiley: Hoboken, NJ, USA, 2023; pp. 77–101. [Google Scholar]
- Minachilis, K.; Kougioumoutzis, K.; Petanidou, T. Climate change effects on multi-taxa pollinator diversity and distribution along the elevation gradient of Mount Olympus, Greece. Ecol. Indic. 2021, 132, 108335. [Google Scholar] [CrossRef]
- Kougioumoutzis, K.; Kaloveloni, A.; Petanidou, T. Assessing Climate Change Impacts on Island Bees: The Aegean Archipelago. Biology 2022, 11, 552. [Google Scholar] [CrossRef]
- He, X.; Liang, J.; Zeng, G.; Yuan, Y.; Li, X. The effects of interaction between climate change and land-use/cover change on biodiversity-related ecosystem services. Glob. Chall. 2019, 3, 1800095. [Google Scholar] [CrossRef] [PubMed]
- Cuttelod, A.; García, N.; Malak, D.A.; Temple, H. The mediterranean: A biodiversity hotspot under threat. In Wildlife in a Changing World—An Analysis of the 2008 IUCN Red List of Threatened Species; Vié, J.-C., Hilton-Taylor, C., Stuart, S.N., Eds.; IUCN: Gland, Switzerland, 2008; p. 16. [Google Scholar]
- Medail, F.; Quezel, P. Hot-spots analysis for conservation of plant biodiversity in the Mediterranean Basin. Ann. Mo. Bot. Gard. 1997, 84, 112–127. [Google Scholar] [CrossRef]
- Médail, F.; Myers, N. Mediterranean Basin; Mittermeier, C.G., Lamoreux, J., Fonseca, G.A.B., Eds.; Sierra: Cheyenne, WY, USA, 2004. [Google Scholar]
- Médail, F. The specific vulnerability of plant biodiversity and vegetation on Mediterranean islands in the face of global change. Reg. Environ. Chang. 2017, 17, 1775–1790. [Google Scholar] [CrossRef]
- Kougioumoutzis, K.; Kokkoris, I.P.; Panitsa, M.; Kallimanis, A.; Strid, A.; Dimopoulos, P. Plant Endemism Centres and Biodiversity Hotspots in Greece. Biology 2021, 10, 72. [Google Scholar] [CrossRef] [PubMed]
- Médail, F.; Diadema, K. Glacial refugia influence plant diversity patterns in the Mediterranean Basin. J. Biogeogr. 2009, 36, 1333–1345. [Google Scholar] [CrossRef]
- Monnet, A.-C.; Cilleros, K.; Médail, F.; Albassatneh, M.C.; Arroyo, J.; Bacchetta, G.; Bagnoli, F.; Barina, Z.; Cartereau, M.; Casajus, N.; et al. WOODIV, a database of occurrences, functional traits, and phylogenetic data for all Euro-Mediterranean trees. Sci. Data 2021, 8, 89. [Google Scholar] [CrossRef] [PubMed]
- Cheikh Albassatneh, M.; Escudero, M.; Monnet, A.; Arroyo, J.; Bacchetta, G.; Bagnoli, F.; Dimopoulos, P.; Hampe, A.; Leriche, A.; Médail, F.; et al. Spatial patterns of genus-level phylogenetic endemism in the tree flora of Mediterranean Europe. Divers. Distrib. 2021, 27, 913–928. [Google Scholar] [CrossRef]
- Kougioumoutzis, K.; Kokkoris, I.P.; Panitsa, M.; Strid, A.; Dimopoulos, P. Extinction Risk Assessment of the Greek Endemic Flora. Biology 2021, 10, 195. [Google Scholar] [CrossRef]
- Hammoud, C.; Kougioumoutzis, K.; Rijsdijk, K.F.; Simaiakis, S.M.; Norder, S.J.; Foufopoulos, J.; Georgopoulou, E.; Van Loon, E.E. Past connections with the mainland structure patterns of insular species richness in a continental-shelf archipelago (Aegean Sea, Greece). Ecol. Evol. 2021, 11, 5441–5458. [Google Scholar] [CrossRef]
- Kougioumoutzis, K.; Simaiakis, S.M.; Tiniakou, A. Network biogeographical analysis of the central Aegean archipelago. J. Biogeogr. 2014, 41, 1848–1858. [Google Scholar] [CrossRef]
- Kougioumoutzis, K.; Valli, A.T.; Georgopoulou, E.; Simaiakis, S.M.; Triantis, K.A.; Trigas, P. Network biogeography of a complex island system: The Aegean Archipelago revisited. J. Biogeogr. 2017, 44, 651–660. [Google Scholar] [CrossRef]
- Matthews, T.J.; Rigal, F.; Kougioumoutzis, K.; Trigas, P.; Triantis, K.A. Unravelling the small-island effect through phylogenetic community ecology. J. Biogeogr. 2020, 47, 2341–2352. [Google Scholar] [CrossRef]
- Valli, A.T.; Kougioumoutzis, K.; Iliadou, E.; Panitsa, M.; Trigas, P. Determinants of alpha and beta vascular plant diversity in Mediterranean island systems: The Ionian islands, Greece. Nord. J. Bot. 2019, 37, e02156. [Google Scholar] [CrossRef]
- Panitsa, M.; Kagiampaki, A.; Kougioumoutzis, K. Plant diversity and biogeography of the Aegean Archipelago: A New Synthesis. In Biogeography and Biodiversity of the Aegean. In Honour of Prof. Moysis Mylonas; Sfenthourakis, S., Pafilis, P., Parmakelis, A., Poulakakis, N., Triantis, K., Eds.; Broken Hill Publishers Ltd.: Nicosia, Cyprus, 2018; pp. 223–244. ISBN 9789925563784. [Google Scholar]
- Simaiakis, S.M.; Rijsdijk, K.F.; Koene, E.F.M.; Norder, S.J.; Van Boxel, J.H.; Stocchi, P.; Hammoud, C.; Kougioumoutzis, K.; Georgopoulou, E.; Van Loon, E.; et al. Geographic changes in the Aegean Sea since the Last Glacial Maximum: Postulating biogeographic effects of sea-level rise on islands. Palaeogeogr. Palaeoclimatol. Palaeoecol. 2017, 471, 108–119. [Google Scholar] [CrossRef]
- Dagallier, L.P.M.J.; Janssens, S.B.; Dauby, G.; Blach-Overgaard, A.; Mackinder, B.A.; Droissart, V.; Svenning, J.C.; Sosef, M.S.M.; Stévart, T.; Harris, D.J.; et al. Cradles and museums of generic plant diversity across tropical Africa. New Phytol. 2020, 225, 2196–2213. [Google Scholar] [CrossRef] [PubMed]
- López-Pujol, J.; Zhang, F.-M.; Sun, H.-Q.; Ying, T.-S.; Ge, S. Mountains of Southern China as “Plant Museums” and “Plant Cradles”: Evolutionary and Conservation Insights. Mt. Res. Dev. 2011, 31, 261–269. [Google Scholar] [CrossRef]
- Körner, C.; Paulsen, J.; Spehn, E.M. A definition of mountains and their bioclimatic belts for global comparisons of biodiversity data. Alp. Bot. 2011, 121, 73–78. [Google Scholar] [CrossRef]
- Perrigo, A.; Hoorn, C.; Antonelli, A. Why mountains matter for biodiversity. J. Biogeogr. 2020, 47, 315–325. [Google Scholar] [CrossRef]
- Rahbek, C.; Borregaard, M.K.; Antonelli, A.; Colwell, R.K.; Holt, B.G.; Nogues-Bravo, D.; Rasmussen, C.M.Ø.; Richardson, K.; Rosing, M.T.; Whittaker, R.J.; et al. Building mountain biodiversity: Geological and evolutionary processes. Science 2019, 365, 1114–1119. [Google Scholar] [CrossRef]
- Rahbek, C.; Borregaard, M.K.; Colwell, R.K.; Dalsgaard, B.; Holt, B.G.; Morueta-Holme, N.; Nogues-Bravo, D.; Whittaker, R.J.; Fjeldså, J. Humboldt’s enigma: What causes global patterns of mountain biodiversity? Science 2019, 365, 1108–1113. [Google Scholar] [CrossRef]
- Kougioumoutzis, K.; Kokkoris, I.P.; Panitsa, M.; Trigas, P.; Strid, A.; Dimopoulos, P. Plant Diversity Patterns and Conservation Implications under Climate-Change Scenarios in the Mediterranean: The Case of Crete (Aegean, Greece). Diversity 2020, 12, 270. [Google Scholar] [CrossRef]
- Kougioumoutzis, K.; Kokkoris, I.P.; Panitsa, M.; Trigas, P.; Strid, A.; Dimopoulos, P. Spatial Phylogenetics, Biogeographical Patterns and Conservation Implications of the Endemic Flora of Crete (Aegean, Greece) under Climate Change Scenarios. Biology 2020, 9, 199. [Google Scholar] [CrossRef] [PubMed]
- Guardiola, M.; Sáez, L. Are Mediterranean Island Mountains Hotspots of Taxonomic and Phylogenetic Biodiversity? The Case of the Endemic Flora of the Balearic Islands. Plants 2023, 12, 2640. [Google Scholar] [CrossRef] [PubMed]
- González-Orozco, C.E. Unveiling evolutionary cradles and museums of flowering plants in a neotropical biodiversity hotspot. R. Soc. Open Sci. 2023, 10, 230917. [Google Scholar] [CrossRef] [PubMed]
- Pauli, H.; Gottfried, M.; Dullinger, S.; Abdaladze, O.; Akhalkatsi, M.; Alonso, J.L.B.; Coldea, G.; Dick, J.; Erschbamer, B.; Calzado, R.F.; et al. Recent plant diversity changes on Europe’s mountain summits. Science 2012, 336, 353–355. [Google Scholar] [CrossRef] [PubMed]
- Alexander, J.M.; Chalmandrier, L.; Lenoir, J.; Burgess, T.I.; Essl, F.; Haider, S.; Kueffer, C.; McDougall, K.; Milbau, A.; Nuñez, M.A.; et al. Lags in the response of mountain plant communities to climate change. Glob. Change Biol. 2018, 24, 563–579. [Google Scholar] [CrossRef] [PubMed]
- Rumpf, S.B.; Hülber, K.; Klonner, G.; Moser, D.; Schütz, M.; Wessely, J.; Willner, W.; Zimmermann, N.E.; Dullinger, S. Range dynamics of mountain plants decrease with elevation. Proc. Natl. Acad. Sci. USA 2018, 115, 1848–1853. [Google Scholar] [CrossRef] [PubMed]
- Steinbauer, M.J.; Grytnes, J.A.; Jurasinski, G.; Kulonen, A.; Lenoir, J.; Pauli, H.; Rixen, C.; Winkler, M.; Bardy-Durchhalter, M.; Barni, E.; et al. Accelerated increase in plant species richness on mountain summits is linked to warming. Nature 2018, 556, 231–234. [Google Scholar] [CrossRef]
- Ernakovich, J.G.; Hopping, K.A.; Berdanier, A.B.; Simpson, R.T.; Kachergis, E.J.; Steltzer, H.; Wallenstein, M.D. Predicted responses of arctic and alpine ecosystems to altered seasonality under climate change. Glob. Change Biol. 2014, 20, 3256–3269. [Google Scholar] [CrossRef]
- Noroozi, J.; Talebi, A.; Doostmohammadi, M.; Rumpf, S.B.; Linder, H.P.; Schneeweiss, G.M. Hotspots within a global biodiversity hotspot-areas of endemism are associated with high mountain ranges. Sci. Rep. 2018, 8, 10345. [Google Scholar] [CrossRef]
- Kougioumoutzis, K.; Kokkoris, I.P.; Strid, A.; Raus, T.; Dimopoulos, P. Climate-Change Impacts on the Southernmost Mediterranean Arctic-Alpine Plant Populations. Sustainability 2021, 13, 13778. [Google Scholar] [CrossRef]
- Kaltsas, D.; Trichas, A.; Kougioumoutzis, K.; Chatzaki, M. Ground beetles respond to grazing at assemblage level, rather than species-specifically: The case of Cretan shrublands. J. Insect Conserv. 2013, 17, 681–697. [Google Scholar] [CrossRef]
- Kokkoris, I.P.; Kougioumoutzis, K.; Charalampopoulos, I.; Apostolidis, E.; Apostolidis, I.; Strid, A.; Dimopoulos, P. Conservation Responsibility for Priority Habitats under Future Climate Conditions: A Case Study on Juniperus drupacea Forests in Greece. Land 2023, 12, 1976. [Google Scholar] [CrossRef]
- Geppert, C.; Bertolli, A.; Prosser, F.; Marini, L. Red-listed plants are contracting their elevational range faster than common plants in the European Alps. Proc. Natl. Acad. Sci. USA 2023, 120, e2211531120. [Google Scholar] [CrossRef] [PubMed]
- Cañadas, E.M.; Fenu, G.; Peñas, J.; Lorite, J.; Mattana, E.; Bacchetta, G. Hotspots within hotspots: Endemic plant richness, environmental drivers, and implications for conservation. Biol. Conserv. 2014, 170, 282–291. [Google Scholar] [CrossRef]
- Dimopoulos, P.; Raus, T.; Bergmeier, E.; Constantinidis, T.; Iatrou, G.; Kokkini, S.; Strid, A.; Tzanoudakis, D. Englera. In Vascular Plants of Greece: An Annotated Checklist; Botanic Garden and Botanical Museum Berlin-Dahlem: Berlin, Germany, 2013; pp. 1–372. [Google Scholar]
- Dimopoulos, P.; Raus, T.; Bergmeier, E.; Constantinidis, T.; Iatrou, G.; Kokkini, S.; Strid, A.; Tzanoudakis, D. Vascular plants of Greece: An annotated checklist. Supplement. Willdenowia 2016, 46, 301–348. [Google Scholar] [CrossRef]
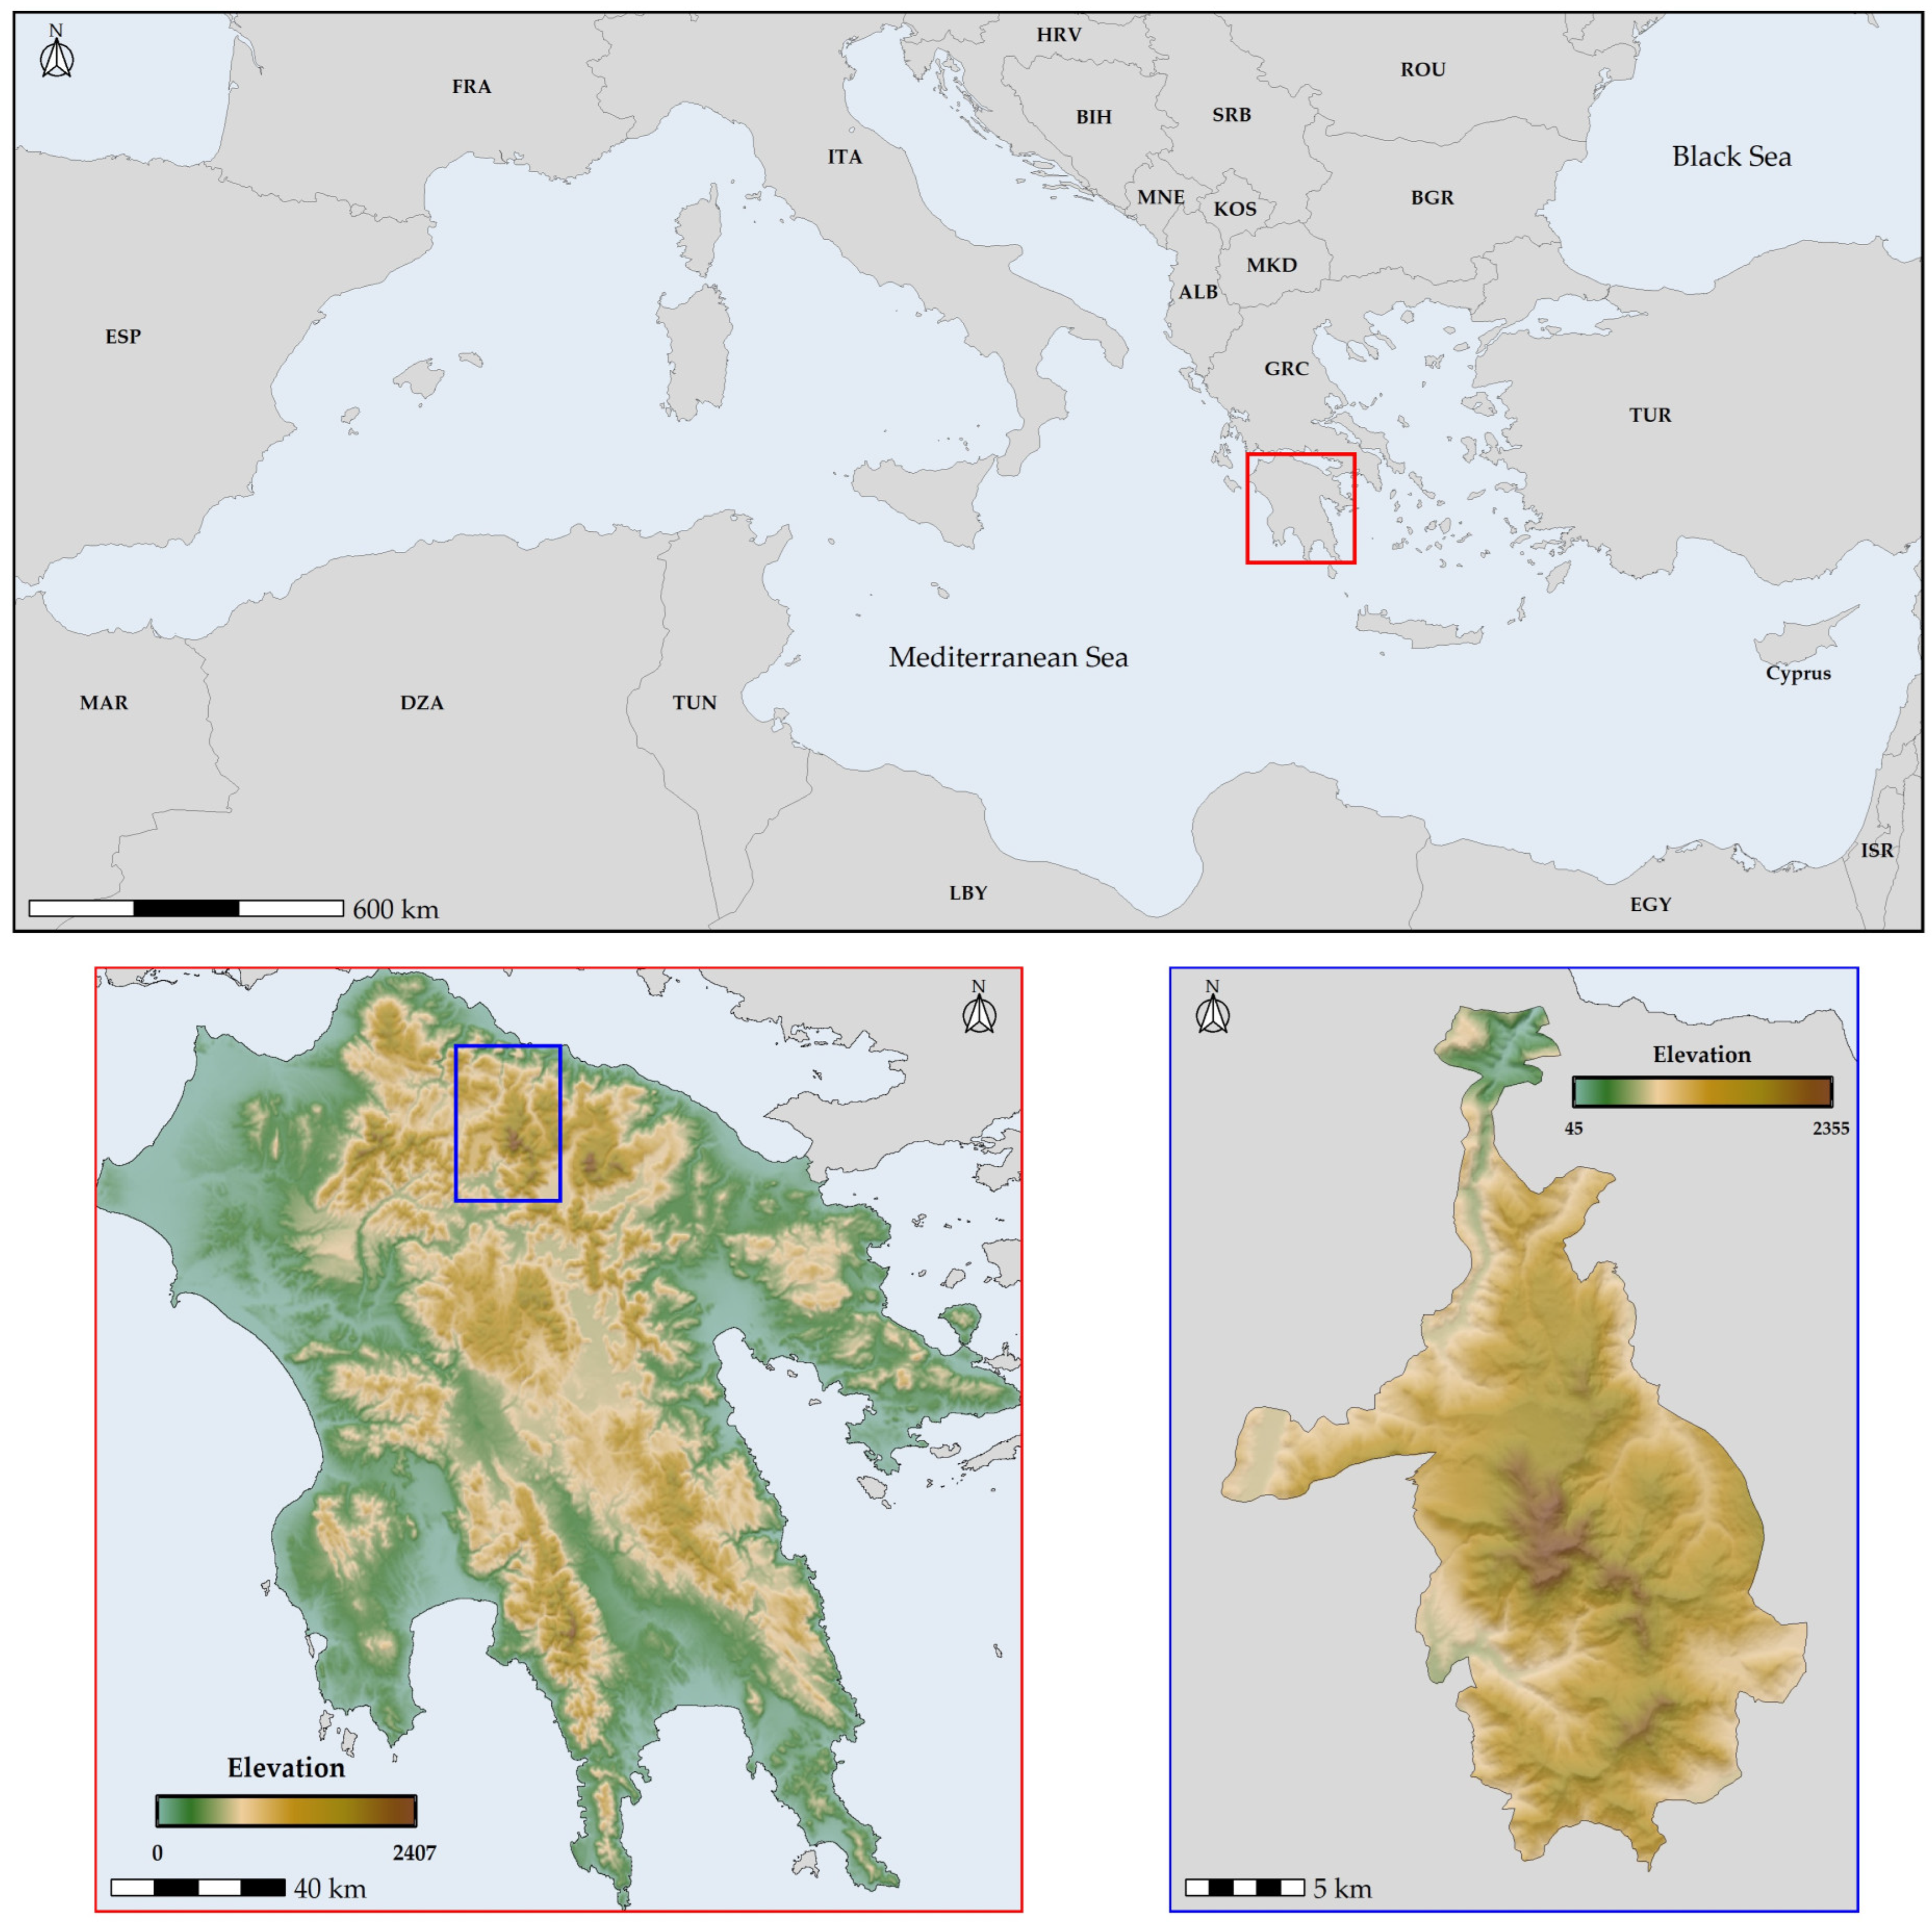
- Tsakiri, M.; Koumoutsou, E.; Kokkoris, I.P.; Trigas, P.; Iliadou, E.; Tzanoudakis, D.; Dimopoulos, P.; Iatrou, G. National park and unesco global geopark of chelmos-vouraikos (Greece): Floristic diversity, ecosystem services and management implications. Land 2022, 11, 33. [Google Scholar] [CrossRef]
- Kougioumoutzis, K.; Trigas, P.; Tsakiri, M.; Kokkoris, I.P.; Koumoutsou, E.; Dimopoulos, P.; Tzanoudakis, D.; Iatrou, G.; Panitsa, M. Climate and Land-Cover Change Impacts and Extinction Risk Assessment of Rare and Threatened Endemic Taxa of Chelmos-Vouraikos National Park (Peloponnese, Greece). Plants 2022, 11, 3548. [Google Scholar] [CrossRef] [PubMed]
- Tsakiri, M.; Kokkoris, I.P.; Trigas, P.; Tzanoudakis, D.; Iatrou, G. Contribution to the vascular flora of Chelmos-Vouraikos National Park (N Peloponnese, Greece). Phytol. Balc. 2020, 26, 523. [Google Scholar]
- Castañeda-Álvarez, N.P.; Khoury, C.K.; Achicanoy, H.A.; Bernau, V.; Dempewolf, H.; Eastwood, R.J.; Guarino, L.; Harker, R.H.; Jarvis, A.; Maxted, N.; et al. Global conservation priorities for crop wild relatives. Nat. Plants 2016, 2, 16022. [Google Scholar] [CrossRef]
- Chen, S.L.; Yu, H.; Luo, H.M.; Wu, Q.; Li, C.F.; Steinmetz, A. Conservation and sustainable use of medicinal plants: Problems, progress, and prospects. Chin. Med. 2016, 121, 37. [Google Scholar] [CrossRef] [PubMed]
- Hamilton, A.C. Medicinal plants, conservation and livelihoods. Biodivers. Conserv. 2004, 13, 1477–1517. [Google Scholar] [CrossRef]
- Sklirou, A.D.; Angelopoulou, M.T.; Argyropoulou, A.; Chaita, E.; Boka, V.I.; Cheimonidi, C.; Niforou, K.; Mavrogonatou, E.; Pratsinis, H.; Kalpoutzakis, E.; et al. Phytochemical study and in vitro screening focusing on the anti-aging features of various plants of the greek flora. Antioxidants 2021, 10, 1206. [Google Scholar] [CrossRef] [PubMed]
- Stavropoulou, M.I.; Angelis, A.; Aligiannis, N.; Kalpoutzakis, E.; Mitakou, S.; Duke, S.O.; Fokialakis, N. Phytotoxic triterpene saponins from Bellis longifolia, an endemic plant of Crete. Phytochemistry 2017, 144, 71–77. [Google Scholar] [CrossRef] [PubMed]
- Solomou, A.D.; Martinos, K.; Skoufogianni, E.; Danalatos, N.G. Medicinal and Aromatic Plants Diversity in Greece and Their Future Prospects: A Review. Agric. Sci. 2016, 4, 9–20. [Google Scholar] [CrossRef]
- Charitonidou, M.; Stara, K.; Kougioumoutzis, K.; Halley, J.M. Implications of salep collection for the conservation of the Elder-flowered orchid (Dactylorhiza sambucina) in Epirus, Greece. J. Biol. Res. 2019, 26, 1–13. [Google Scholar] [CrossRef] [PubMed]
- Tomou, E.-M.; Skaltsa, H.; Economou, G.; Trichopoulou, A. Sustainable diets & medicinal aromatic plants in Greece: Perspectives towards climate change. Food Chem. 2022, 374, 131767. [Google Scholar] [CrossRef]
- Hanlidou, E.; Karousou, R.; Lazari, D. Essential oils of three taxa of the nepeta argolica aggregate from Greece. Chem. Biodivers. 2012, 9, 1559–1566. [Google Scholar] [CrossRef]
- Karousou, R.; Hanlidou, E.; Lazari, D. Essential-oil diversity of three Calamintha species from Greece. Chem. Biodivers. 2012, 9, 1364–1372. [Google Scholar] [CrossRef]
- Dardioti, A.; Hanlidou, E.; Lanaras, T.; Kokkini, S. The essential oils of the greek endemic Satureja horvatii ssp. macrophylla in relation to bioclimate. Chem. Biodivers. 2010, 7, 1968–1977. [Google Scholar] [CrossRef]
- Aligiannis, N.; Kalpoutzakis, E.; Mitaku, S.; Chinou, I.B. Composition and Antimicrobial Activity of the Essential Oils of Two Origanum Species. J. Agric. Food Chem. 2001, 49, 4168–4170. [Google Scholar] [CrossRef] [PubMed]
- Kalpoutzakis, E.; Chatzimitakos, T.; Athanasiadis, V.; Mitakou, S.; Aligiannis, N.; Bozinou, E.; Gortzi, O.; Skaltsounis, L.A.; Lalas, S.I. Determination of the Total Phenolics Content and Antioxidant Activity of Extracts from Parts of Plants from the Greek Island of Crete. Plants 2023, 12, 1092. [Google Scholar] [CrossRef] [PubMed]
- Argyropoulou, A.; Lemus Ringele, G.B.; Fotopoulou, A.; Nastos, C.; Papachristodoulou, A.; Stavropoulos, G.; Pratsinis, H.; Kletsas, D.; Kalpoutzakis, E.; Halabalaki, M. Chemical and biological evaluation of plants from the Greek flora towards their use as cosmetics. In Proceedings of the GA—70th Annual Meeting, Thessaloniki, Greece, 28–31 August 2022. [Google Scholar]
- Grabarska, A.; Wróblewska-łuczka, P.; Kukula-Koch, W.; Łuszczki, J.J.; Kalpoutzakis, E.; Adamczuk, G.; Skaltsounis, A.L.; Stepulak, A. Palmatine, a bioactive protoberberine alkaloid isolated from berberis cretica, inhibits the growth of human estrogen receptor-positive breast cancer cells and acts synergistically and additively with doxorubicin. Molecules 2021, 26, 6253. [Google Scholar] [CrossRef] [PubMed]
- Androutsopoulou, C.; Christopoulou, S.D.; Hahalis, P.; Kotsalou, C.; Lamari, F.N.; Vantarakis, A. Evaluation of essential oils and extracts of rose geranium and rose petals as natural preservatives in terms of toxicity, antimicrobial, and antiviral activity. Pathogens 2021, 10, 494. [Google Scholar] [CrossRef] [PubMed]
- Gkioni, M.D.; Zeliou, K.; Dimaki, V.D.; Trigas, P.; Lamari, F.N. GC-MS and LC-DAD-MS Phytochemical Profiling for Characterization of Three Native Salvia Taxa from Eastern Mediterranean with Antiglycation Properties. Molecules 2022, 28, 93. [Google Scholar] [CrossRef] [PubMed]
- World Health Organization. WHO Global Report on Traditional and Complementary Medicine 2019; World Health Organization: Geneva, Switzerland, 2019; ISBN 9241515430. [Google Scholar]
- Uprety, Y.; Asselin, H.; Dhakal, A.; Julien, N. Traditional use of medicinal plants in the boreal forest of Canada: Review and perspectives. J. Ethnobiol. Ethnomed. 2012, 8, 7. [Google Scholar] [CrossRef] [PubMed]
- Jimoh, M.A.; Jimoh, M.O.; Saheed, S.A.; Bamigboye, S.O.; Laubscher, C.P.; Kambizi, L. Commercialization of Medicinal Plants: Opportunities for Trade and Concerns for Biodiversity Conservation. In Sustainable Uses and Prospects of Medicinal Plants; Taylor and Francis: Abingdon, UK, 2023; pp. 309–332. [Google Scholar]
- Barata, A.M.; Rocha, F.; Lopes, V.; Carvalho, A.M. Conservation and sustainable uses of medicinal and aromatic plants genetic resources on the worldwide for human welfare. Ind. Crops Prod. 2016, 88, 8–11. [Google Scholar] [CrossRef]
- Lange, D. The role of east and southeast Europe in the medicinal and aromatic plants’ trade. Med. Plant Conserv. 2002, 8, 14–18. [Google Scholar]
- Qazi, M.A.; Molvi, K.I. Herbal medicine: A comprehensive review. Int. J. Pharm. Res. 2016, 8, 1–5. [Google Scholar]
- Vasisht, K.; Sharma, N.; Karan, M. Current perspective in the international trade of medicinal plants material: An update. Curr. Pharm. Des. 2016, 22, 4288–4336. [Google Scholar] [CrossRef]
- Ten Kate, K.; Laird, S.A. The Commercial Use of Biodiversity: Access to Genetic Resources and Benefit-Sharing; Routledge: London, UK, 2019; ISBN 1000699366. [Google Scholar]
- Saeed, S.T.; Samad, A. Emerging threats of begomoviruses to the cultivation of medicinal and aromatic crops and their management strategies. Virus Dis. 2017, 28, 1–17. [Google Scholar] [CrossRef]
- Qian, J.; Zhuang, H.; Yang, W.; Chen, Y.; Chen, S.; Qu, Y.; Zhang, Y.; Yang, Y.; Wang, Y. Selecting flagship species to solve a biodiversity conservation conundrum. Plant Divers. 2020, 42, 488–491. [Google Scholar] [CrossRef] [PubMed]
- Rajasekharan, P.E.; Wani, S.H. Distribution, diversity, conservation and utilization of threatened medicinal plants. In Conservation and Utilization of Threatened Medicinal Plants; Springer: Cham, Switzerland, 2020; pp. 3–30. [Google Scholar]
- Applequist, W.L.; Brinckmann, J.A.; Cunningham, A.B.; Hart, R.E.; Heinrich, M.; Katerere, D.R.; Van Andel, T. Scientists’ warning on climate change and medicinal plants. Planta Med. 2020, 86, 10–18. [Google Scholar] [PubMed]
- Gairola, S.; Shariff, N.M.; Bhatt, A.; Kala, C.P. Influence of climate change on production of secondary chemicals in high altitude medicinal plants: Issues needs immediate attention. J. Med. Plants Res. 2010, 4, 1825–1829. [Google Scholar]
- Kaky, E.; Gilbert, F. Assessment of the extinction risks of medicinal plants in Egypt under climate change by integrating species distribution models and IUCN Red List criteria. J. Arid Environ. 2019, 170, 103988. [Google Scholar] [CrossRef]
- Patni, B.; Bhattacharyya, M.; Kumari, A.; Purohit, V.K. Alarming influence of climate change and compromising quality of medicinal plants. Plant Physiol. Rep. 2022, 27, 1–10. [Google Scholar] [CrossRef]
- Gupta, A.; Singh, P.P.; Singh, P.; Singh, K.; Singh, A.V.; Singh, S.K.; Kumar, A. Medicinal plants under climate change: Impacts on pharmaceutical properties of plants. In Climate Change and Agricultural Ecosystems; Elsevier: Amsterdam, The Netherlands, 2019; pp. 181–209. [Google Scholar]
- Munt, D.D.; Muñoz-Rodríguez, P.; Marques, I.; Saiz, J.C.M. Effects of climate change on threatened Spanish medicinal and aromatic species: Predicting future trends and defining conservation guidelines. Isr. J. Plant Sci. 2016, 63, 309–319. [Google Scholar] [CrossRef]
- Mishra, T. Climate change and production of secondary metabolites in medicinal plants: A review. Int. J. Herb. Med. 2016, 4, 27–30. [Google Scholar]
- Sun, Y.; Alseekh, S.; Fernie, A.R. Plant secondary metabolic responses to global climate change: A meta-analysis in medicinal and aromatic plants. Glob. Change Biol. 2023, 29, 477–504. [Google Scholar] [CrossRef]
- Kougioumoutzis, K.; Papanikolaou, A.; Kokkoris, I.P.; Strid, A.; Dimopoulos, P.; Panitsa, M. Climate Change Impacts and Extinction Risk Assessment of Nepeta Representatives (Lamiaceae) in Greece. Sustainability 2022, 14, 4269. [Google Scholar] [CrossRef]
- Cheminal, A.; Kokkoris, I.P.; Strid, A.; Dimopoulos, P. Medicinal and Aromatic Lamiaceae Plants in Greece: Linking Diversity and Distribution Patterns with Ecosystem Services. Forests 2020, 11, 661. [Google Scholar] [CrossRef]
- Cheminal, A.; Kokkoris, I.P.; Zotos, A.; Strid, A.; Dimopoulos, P. Assessing the Ecosystem Services Potential of Endemic Floras: A Systematic Review on the Greek Endemics of Peloponnese. Sustainability 2022, 14, 5926. [Google Scholar] [CrossRef]
- Karousou, R.; Deirmentzoglou, S. The herbal market of Cyprus: Traditional links and cultural exchanges. J. Ethnopharmacol. 2011, 133, 191–203. [Google Scholar] [CrossRef] [PubMed]
- Karousou, R.; Balta, M.; Hanlidou, E.; Kokkini, S. “Mints”, smells and traditional uses in Thessaloniki (Greece) and other Mediterranean countries. J. Ethnopharmacol. 2007, 109, 248–257. [Google Scholar] [CrossRef] [PubMed]
- Hanlidou, E.; Karousou, R.; Kleftoyanni, V.; Kokkini, S. The herbal market of Thessaloniki (N Greece) and its relation to the ethnobotanical tradition. J. Ethnopharmacol. 2004, 91, 281–299. [Google Scholar] [CrossRef]
- Petrakou, K.; Iatrou, G.; Lamari, F.N. Ethnopharmacological survey of medicinal plants traded in herbal markets in the Peloponnisos, Greece. J. Herb. Med. 2020, 19, 100305. [Google Scholar] [CrossRef]
- Bariotakis, M.; Georgescu, L.; Laina, D.; Koufaki, M.; Souma, M.; Douklias, S.; Giannakakis, K.A.; Chouli, K.N.; Paoli, L.; Loppi, S. Climate Change Dependence in Ex Situ Conservation of Wild Medicinal Plants in Crete, Greece. Biology 2023, 12, 1327. [Google Scholar] [CrossRef] [PubMed]
- Fassou, G.; Kougioumoutzis, K.; Iatrou, G.; Trigas, P.; Papasotiropoulos, V. Genetic diversity and range dynamics of Helleborus odorus subsp. cyclophyllus under different climate change scenarios. Forests 2020, 11, 620. [Google Scholar] [CrossRef]
- Spiliopoulou, K.; Dimitrakopoulos, P.G.; Brooks, T.M.; Kelaidi, G.; Paragamian, K.; Kati, V.; Oikonomou, A.; Vavylis, D.; Trigas, P.; Lymberakis, P. The Natura 2000 network and the ranges of threatened species in Greece. Biodivers. Conserv. 2021, 30, 945–961. [Google Scholar] [CrossRef]
- Spiliopoulou, K.; Brooks, T.M.; Dimitrakopoulos, P.G.; Oikonomou, A.; Karavatsou, F.; Stoumboudi, M.T.; Triantis, K.A. Protected areas and the ranges of threatened species: Towards the EU Biodiversity Strategy 2030. Biol. Conserv. 2023, 284, 110166. [Google Scholar] [CrossRef]
- Lai, Q.; Hoffmann, S.; Jaeschke, A.; Beierkuhnlein, C. Emerging spatial prioritization for biodiversity conservation indicated by climate change velocity. Ecol. Indic. 2022, 138, 108829. [Google Scholar] [CrossRef]
- Kokkoris, I.P.; Mallinis, G.; Bekri, E.S.; Vlami, V.; Zogaris, S.; Chrysafis, I.; Mitsopoulos, I.; Dimopoulos, P. National Set of MAES Indicators in Greece: Ecosystem Services and Management Implications. Forests 2020, 11, 595. [Google Scholar] [CrossRef]
- Maroulis, G.; Artelari, R. A floristic report from Mount Erimanthos (NW-Peloponnisos, Greece). Fl. Medit. 2005, 15, 109–120. [Google Scholar]
- Zizka, A.; Silvestro, D.; Andermann, T.; Azevedo, J.; Duarte Ritter, C.; Edler, D.; Farooq, H.; Herdean, A.; Ariza, M.; Scharn, R. CoordinateCleaner: Standardized cleaning of occurrence records from biological collection databases. Methods Ecol. Evol. 2019, 10, 744–751. [Google Scholar] [CrossRef]
- Smith, A.B. enmSdm: Tools for Modeling Species Niches and Distributions; R Package Version 0.5.1.5 2020; R Core Team: Cary, CA, USA, 2020. [Google Scholar]
- Aiello-Lammens, M.E.; Boria, R.A.; Radosavljevic, A.; Vilela, B.; Anderson, R.P. spThin: An R package for spatial thinning of species occurrence records for use in ecological niche models. Ecography 2015, 38, 541–545. [Google Scholar] [CrossRef]
- Clark, P.J.; Evans, F.C. Distance to Nearest Neighbor as a Measure of Spatial Relationships in Populations. Ecology 1954, 35, 445–453. [Google Scholar] [CrossRef]
- Evans, J.S. spatialEco; R Package Version 1.2-0 2019; R Core Team: Cary, CA, USA, 2019. [Google Scholar]
- Robertson, M.P.; Visser, V.; Hui, C. Biogeo: An R package for assessing and improving data quality of occurrence record datasets. Ecography 2016, 39, 394–401. [Google Scholar] [CrossRef]
- van Proosdij, A.S.J.; Sosef, M.S.M.; Wieringa, J.J.; Raes, N. Minimum required number of specimen records to develop accurate species distribution models. Ecography 2016, 39, 542–552. [Google Scholar] [CrossRef]
- Fick, S.E.; Hijmans, R.J. WorldClim 2: New 1-km spatial resolution climate surfaces for global land areas. Int. J. Climatol. 2017, 37, 4302–4315. [Google Scholar] [CrossRef]
- Booth, T.H. The Need for a Global Tree Trial Database. New For. 2023, 54, 1–7. [Google Scholar] [CrossRef]
- Booth, T.H.; Nix, H.A.; Busby, J.R.; Hutchinson, M.F. Bioclim: The first species distribution modelling package, its early applications and relevance to most current MaxEnt studies. Divers. Distrib. 2014, 20, 1–9. [Google Scholar] [CrossRef]
- Title, P.O.; Bemmels, J.B. ENVIREM: An expanded set of bioclimatic and topographic variables increases flexibility and improves performance of ecological niche modeling. Ecography 2018, 41, 291–307. [Google Scholar] [CrossRef]
- Jarvis, A.; Reuter, H.I.; Nelson, A.; Guevara, E. Hole-Filled SRTM for the Globe Version 4. 2008. Available online: http//srtm.csi.cgiar.org (accessed on 25 July 2023).
- Hijmans, R.; Philipps, S.; Leathwick, J.; Elith, J. dismo: Species Distribution Modeling; R Package Version 1.1-4 2017; R Core Team: Cary, CA, USA, 2017. [Google Scholar]
- Marchi, M.; Castellanos-Acuña, D.; Hamann, A.; Wang, T.; Ray, D.; Menzel, A. ClimateEU, scale-free climate normals, historical time series, and future projections for Europe. Sci. Data 2020, 7, 428. [Google Scholar] [CrossRef]
- Hamann, A.; Wang, T.; Spittlehouse, D.L.; Murdock, T.Q. A Comprehensive, High-Resolution Database of Historical and Projected Climate Surfaces for Western North America. Bull. Am. Meteorol. Soc. 2013, 94, 1307–1309. [Google Scholar] [CrossRef]
- Wang, T.; Hamann, A.; Spittlehouse, D.L.; Murdock, T.Q. ClimateWNA—High-Resolution Spatial Climate Data for Western North America. J. Appl. Meteorol. Climatol. 2012, 51, 16–29. [Google Scholar] [CrossRef]
- Hengl, T.; de Jesus, J.M.; Heuvelink, G.B.M.; Gonzalez, M.R.; Kilibarda, M.; Blagotić, A.; Shangguan, W.; Wright, M.N.; Geng, X.; Bauer-Marschallinger, B.; et al. SoilGrids250m: Global gridded soil information based on machine learning. PLoS ONE 2017, 12, e0169748. [Google Scholar] [CrossRef] [PubMed]
- Chen, G.; Li, X.; Liu, X. Global land projection based on plant functional types with a 1-km resolution under socio-climatic scenarios. Sci. Data 2022, 9, 125. [Google Scholar] [CrossRef] [PubMed]
- Hijmans, R. Terra: Spatial Data Analysis; R Package Version 1.7-46 2023; R Core Team: Cary, CA, USA, 2023. [Google Scholar]
- Hijmans, R.J. Package ‘raster’—Geographic Data Analysis and Modeling. CRAN Repos. 2019. Available online: https://cran.r-project.org/web/packages/raster/index.html (accessed on 15 November 2023).
- Cao, Y.; Wang, F.; Tseng, T.-H.; Carver, S.; Chen, X.; Zhao, J.; Yu, L.; Li, F.; Zhao, Z.; Yang, R. Identifying ecosystem service value and potential loss of wilderness areas in China to support post-2020 global biodiversity conservation. Sci. Total Environ. 2022, 846, 157348. [Google Scholar] [CrossRef]
- Dormann, C.F.; Elith, J.; Bacher, S.; Buchmann, C.; Carl, G.; Carré, G.; Marquéz, J.R.G.; Gruber, B.; Lafourcade, B.; Leitão, P.J.; et al. Collinearity: A review of methods to deal with it and a simulation study evaluating their performance. Ecography 2013, 36, 27–46. [Google Scholar] [CrossRef]
- Naimi, B.; Hamm, N.A.S.; Groen, T.A.; Skidmore, A.K.; Toxopeus, A.G. Where is positional uncertainty a problem for species distribution modelling? Ecography 2014, 37, 191–203. [Google Scholar] [CrossRef]
- Breiner, F.T.; Nobis, M.P.; Bergamini, A.; Guisan, A. Optimizing ensembles of small models for predicting the distribution of species with few occurrences. Methods Ecol. Evol. 2018, 9, 802–808. [Google Scholar] [CrossRef]
- Breiner, F.T.; Guisan, A.; Nobis, M.P.; Bergamini, A. Including environmental niche information to improve IUCN Red List assessments. Divers. Distrib. 2017, 23, 484–495. [Google Scholar] [CrossRef]
- Breiner, F.T.; Guisan, A.; Bergamini, A.; Nobis, M.P. Overcoming limitations of modelling rare species by using ensembles of small models. Methods Ecol. Evol. 2015, 6, 1210–1218. [Google Scholar] [CrossRef]
- Broennimann, O.; Di Cola, V.; Guisan, A. ecospat: Spatial Ecology Miscellaneous Methods; R Package Version 3.2 2021; R Core Team: Cary, CA, USA, 2021. [Google Scholar]
- Valavi, R.; Elith, J.; Lahoz-Monfort, J.J.; Guillera-Arroita, G. Modelling species presence-only data with random forests. Ecography 2021, 44, 1731–1742. [Google Scholar] [CrossRef]
- Valavi, R.; Guillera-Arroita, G.; Lahoz-Monfort, J.J.; Elith, J. Predictive performance of presence-only species distribution models: A benchmark study with reproducible code. Ecol. Monogr. 2022, 92, e01486. [Google Scholar] [CrossRef]
- Valavi, R.; Elith, J.; Lahoz-Monfort, J.J.; Guillera-Arroita, G. Flexible species distribution modelling methods perform well on spatially separated testing data. Glob. Ecol. Biogeogr. 2023, 32, 369–383. [Google Scholar] [CrossRef]
- Jimenez-Valverde, A. Prevalence affects the evaluation of discrimination capacity in presence-absence species distribution models. Biodivers. Conserv. 2021, 30, 1331–1340. [Google Scholar] [CrossRef]
- Velazco, S.J.E.; Rose, M.B.; de Andrade, A.F.A.; Minoli, I.; Franklin, J. flexsdm: An R package for supporting a comprehensive and flexible species distribution modelling workflow. Methods Ecol. Evol. 2022, 13, 1661–1669. [Google Scholar] [CrossRef]
- Barbet-Massin, M.; Jiguet, F.; Albert, C.H.; Thuiller, W. Selecting pseudo-absences for species distribution models: How, where and how many? Methods Ecol. Evol. 2012, 3, 327–338. [Google Scholar] [CrossRef]
- Liu, C.; White, M.; Newell, G. Selecting thresholds for the prediction of species occurrence with presence-only data. J. Biogeogr. 2013, 40, 778–789. [Google Scholar] [CrossRef]
- Inman, R.; Franklin, J.; Esque, T.; Nussear, K. Comparing sample bias correction methods for species distribution modeling using virtual species. Ecosphere 2021, 12, e03422. [Google Scholar] [CrossRef]
- Dubos, N.; Préau, C.; Lenormand, M.; Papuga, G.; Monsarrat, S.; Denelle, P.; Le Louarn, M.; Heremans, S.; May, R.; Roche, P. Assessing the effect of sample bias correction in species distribution models. Ecol. Indic. 2022, 145, 109487. [Google Scholar] [CrossRef]
- Roberts, D.R.; Bahn, V.; Ciuti, S.; Boyce, M.S.; Elith, J.; Guillera-Arroita, G.; Hauenstein, S.; Lahoz-Monfort, J.J.; Schröder, B.; Thuiller, W.; et al. Cross-validation strategies for data with temporal, spatial, hierarchical, or phylogenetic structure. Ecography 2017, 40, 913–929. [Google Scholar] [CrossRef]
- Santini, L.; Benítez-López, A.; Maiorano, L.; Čengić, M.; Huijbregts, M.A.J. Assessing the reliability of species distribution projections in climate change research. Divers. Distrib. 2021, 27, 1035–1050. [Google Scholar] [CrossRef]
- Raes, N.; ter Steege, H. A null-model for significance testing of presence-only species distribution models. Ecography 2007, 30, 727–736. [Google Scholar] [CrossRef]
- Allouche, O.; Tsoar, A.; Kadmon, R. Assessing the accuracy of species distribution models: Prevalence, kappa and the true skill statistic (TSS). J. Appl. Ecol. 2006, 43, 1223–1232. [Google Scholar] [CrossRef]
- Hirzel, A.H.; Le Lay, G.; Helfer, V.; Randin, C.; Guisan, A. Evaluating the ability of habitat suitability models to predict species presences. Ecol. Modell. 2006, 199, 142–152. [Google Scholar] [CrossRef]
- Fielding, A.H.; Bell, J.F. A review of methods for the assessment of prediction errors in conservation presence/absence models. Environ. Conserv. 1997, 24, 38–49. [Google Scholar] [CrossRef]
- Sofaer, H.R.; Hoeting, J.A.; Jarnevich, C.S. The area under the precision-recall curve as a performance metric for rare binary events. Methods Ecol. Evol. 2019, 10, 565–577. [Google Scholar] [CrossRef]
- Liu, C.; White, M.; Newell, G. Measuring and comparing the accuracy of species distribution models with presence-absence data. Ecography 2011, 34, 232–243. [Google Scholar] [CrossRef]
- Hammer, B.; Frasco, M. Metrics: Evaluation Metrics for Machine Learning; R Package Version 0.1.4 2018; R Core Team: Cary, CA, USA, 2018. [Google Scholar]
- Márcia Barbosa, A.; Real, R.; Muñoz, A.R.; Brown, J.A. New measures for assessing model equilibrium and prediction mismatch in species distribution models. Divers. Distrib. 2013, 19, 1333–1338. [Google Scholar] [CrossRef]
- Schwarz, J.; Heider, D. GUESS: Projecting machine learning scores to well-calibrated probability estimates for clinical decision-making. Bioinformatics 2019, 35, 2458–2465. [Google Scholar] [CrossRef] [PubMed]
- Signorell, A.; Aho, K.; Anderegg, N.; Aragon, T.; Arppe, A.; Baddeley, A.; Bolker, B.; Caeiro, F.; Champely, S.; Chessel, D. DescTools: Tools for descriptive statistics; R Package Version 0.99-40 2021; R Core Team: Cary, CA, USA, 2021. [Google Scholar]
- Thuiller, W.; Georges, D.; Engler, R.; Breiner, F. biomod2: Ensemble Platform for Species Distribution Modeling. CRAN Repository. 2016. Available online: https://cran.r-project.org/web/packages/biomod2/index.html (accessed on 15 November 2023).
- Liu, C.; Berry, P.M.; Dawson, T.P.; Pearson, R.G. Selecting thresholds of occurrence in the prediction of species distributions. Ecography 2005, 28, 385–393. [Google Scholar] [CrossRef]
- Liu, C.; Newell, G.; White, M. On the selection of thresholds for predicting species occurrence with presence-only data. Ecol. Evol. 2016, 6, 337–348. [Google Scholar] [CrossRef] [PubMed]
- Elith, J.; Kearney, M.; Phillips, S. The art of modelling range-shifting species. Methods Ecol. Evol. 2010, 1, 330–342. [Google Scholar] [CrossRef]
- McGarigal, K. FRAGSTATS: Spatial Pattern Analysis Program for Categorical Maps. Computer Software Program Produced by the Authors at the University of Massachusetts, Amherst. 2002. Available online: www.umass.edu/landeco/research/fragstats/fragstats.html (accessed on 25 July 2023).
- Hesselbarth, M.H.K.; Sciaini, M.; With, K.A.; Wiegand, K.; Nowosad, J. landscapemetrics: An open-source R tool to calculate landscape metrics. Ecography 2019, 42, 1648–1657. [Google Scholar] [CrossRef]
- Bouchet, P.J.; Miller, D.L.; Roberts, J.J.; Mannocci, L.; Harris, C.M.; Thomas, L. dsmextra: Extrapolation assessment tools for density surface models. Methods Ecol. Evol. 2020, 11, 1464–1469. [Google Scholar] [CrossRef]
- Mannocci, L.; Roberts, J.J.; Halpin, P.N.; Authier, M.; Boisseau, O.; Bradai, M.N.; Cañadas, A.; Chicote, C.; David, L.; Di-Méglio, N.; et al. Assessing cetacean surveys throughout the Mediterranean Sea: A gap analysis in environmental space. Sci. Rep. 2018, 8, 3126. [Google Scholar] [CrossRef]
- Linder, H.P. Plant diversity and endemism in sub-Saharan tropical Africa. J. Biogeogr. 2001, 28, 169–182. [Google Scholar] [CrossRef]
- Linder, H.P. On areas of endemism, with an example from the African restionaceae. Syst. Biol. 2001, 50, 892–912. [Google Scholar] [CrossRef]
- Rosauer, D.; Laffan, S.W.; Crisp, M.D.; Donnellan, S.C.; Cook, L.G. Phylogenetic endemism: A new approach for identifying geographical concentrations of evolutionary history. Mol. Ecol. 2009, 18, 4061–4072. [Google Scholar] [CrossRef]
- Daru, B.H.; Karunarathne, P.; Schliep, K. Phyloregion: R package for biogeographical regionalization and macroecology. Methods Ecol. Evol. 2020, 11, 1483–1491. [Google Scholar] [CrossRef]
- Daru, B.H.; Elliott, T.L.; Park, D.S.; Davies, T.J. Understanding the Processes Underpinning Patterns of Phylogenetic Regionalization. Trends Ecol. Evol. 2017, 32, 845–860. [Google Scholar] [CrossRef] [PubMed]
- Daru, B.H.; Farooq, H.; Antonelli, A.; Faurby, S. Endemism patterns are scale dependent. Nat. Commun. 2020, 11, 2115. [Google Scholar] [CrossRef] [PubMed]
- Tsirogiannis, C.; Sandel, B. PhyloMeasures: A package for computing phylogenetic biodiversity measures and their statistical moments. Ecography 2016, 39, 709–714. [Google Scholar] [CrossRef]
- González-Orozco, C.E.; Pollock, L.J.; Thornhill, A.H.; Mishler, B.D.; Knerr, N.; Laffan, S.W.; Miller, J.T.; Rosauer, D.F.; Faith, D.P.; Nipperess, D.A.; et al. Phylogenetic approaches reveal biodiversity threats under climate change. Nat. Clim. Chang. 2016, 6, 1110–1114. [Google Scholar] [CrossRef]
- Magurran, A.E. Measuring biological diversity. Curr. Biol. 2021, 31, R1174–R1177. [Google Scholar] [CrossRef] [PubMed]
- Carvalho, J.C.; Cardoso, P.; Gomes, P. Determining the relative roles of species replacement and species richness differences in generating beta-diversity patterns. Glob. Ecol. Biogeogr. 2012, 21, 760–771. [Google Scholar] [CrossRef]
- Baselga, A. Partitioning the turnover and nestedness components of beta diversity. Glob. Ecol. Biogeogr. 2010, 19, 134–143. [Google Scholar] [CrossRef]
- Cardoso, P.; Rigal, F.; Carvalho, J.C. BAT—Biodiversity Assessment Tools, an R package for the measurement and estimation of alpha and beta taxon, phylogenetic and functional diversity. Methods Ecol. Evol. 2015, 6, 232–236. [Google Scholar] [CrossRef]
- Mota, F.M.M.; Alves-Ferreira, G.; Talora, D.C.; Heming, N.M. Divraster: An R package to calculate taxonomic, functional and phylogenetic diversity from rasters. Ecography 2023, 2023, e06905. [Google Scholar] [CrossRef]
- Rinnan, D.S.; Lawler, J. Climate-niche factor analysis: A spatial approach to quantifying species vulnerability to climate change. Ecography 2019, 42, 1494–1503. [Google Scholar] [CrossRef]
- Rinnan, D.S. CENFA: Climate and Ecological Nich Factor Analysis; R Core Team: Cary, CA, USA, 2018. [Google Scholar]
- Hirzel, A.H.; Hausser, J.; Chessel, D.; Perrin, N. Ecological-niche factor analysis: How to compute habitat-suitability maps without absence data? Ecology 2002, 83, 2027–2036. [Google Scholar] [CrossRef]
- Nunez, S.; Alkemade, R. Exploring interaction effects from mechanisms between climate and land-use changes and the projected consequences on biodiversity. Biodivers. Conserv. 2021, 30, 3685–3696. [Google Scholar] [CrossRef]
- Groner, V.P.; Nicholas, O.; Mabhaudhi, T.; Slotow, R.; Akçakaya, H.R.; Mace, G.M.; Pearson, R.G. Climate change, land cover change, and overharvesting threaten a widely used medicinal plant in South Africa. Ecol. Appl. 2022, 32, e2545. [Google Scholar] [CrossRef] [PubMed]
- Karami, S.; Ejtehadi, H.; Moazzeni, H.; Vaezi, J.; Behroozian, M. Minimal climate change impacts on the geographic distribution of Nepeta glomerulosa, medicinal species endemic to southwestern and central Asia. Sci. Rep. 2022, 12, 19893. [Google Scholar] [CrossRef] [PubMed]
- Cramer, W.; Guiot, J.; Fader, M.; Garrabou, J.; Gattuso, J.P.; Iglesias, A.; Lange, M.A.; Lionello, P.; Llasat, M.C.; Paz, S.; et al. Climate change and interconnected risks to sustainable development in the Mediterranean. Nat. Clim. Chang. 2018, 8, 972–980. [Google Scholar] [CrossRef]
- Cahyaningsih, R.; Phillips, J.; Magos Brehm, J.; Gaisberger, H.; Maxted, N. Climate change impact on medicinal plants in Indonesia. Glob. Ecol. Conserv. 2021, 30, e01752. [Google Scholar] [CrossRef]
- Kunwar, R.M.; Thapa-Magar, K.B.; Subedi, S.C.; Kutal, D.H.; Baral, B.; Joshi, N.R.; Adhikari, B.; Upadhyaya, K.S.; Thapa-Magar, S.; Ansari, A.S.; et al. Distribution of important medicinal plant species in Nepal under past, present, and future climatic conditions. Ecol. Indic. 2023, 146, 109879. [Google Scholar] [CrossRef]
- Shaban, M.; Ghehsareh Ardestani, E.; Ebrahimi, A.; Borhani, M. Climate change impacts on optimal habitat of Stachys inflata medicinal plant in central Iran. Sci. Rep. 2023, 13, 6580. [Google Scholar] [CrossRef]
- Gafna, D.J.; Obando, J.A.; Kalwij, J.M.; Dolos, K.; Schmidtlein, S. Climate Change Impacts on the Availability of Anti-malarial Plants in Kenya. Clim. Change Ecol. 2023, 5, 100070. [Google Scholar] [CrossRef]
- Tshabalala, T.; Mutanga, O.; Abdel-Rahman, E.M. Predicting the Geographical Distribution Shift of Medicinal Plants in South Africa Due to Climate Change. Conservation 2022, 2, 694–708. [Google Scholar] [CrossRef]
- Guo, Y.; Wei, H.; Lu, C.; Gao, B.; Gu, W. Predictions of potential geographical distribution and quality of Schisandra sphenanthera under climate change. PeerJ 2016, 4, e2554. [Google Scholar] [CrossRef] [PubMed]
- Boyd, J.N.; Anderson, J.T.; Brzyski, J.; Baskauf, C.; Cruse-Sanders, J. Eco-evolutionary causes and consequences of rarity in plants: A meta-analysis. New Phytol. 2022, 235, 1272–1286. [Google Scholar] [CrossRef] [PubMed]
- Manes, S.; Costello, M.J.; Beckett, H.; Debnath, A.; Devenish-Nelson, E.; Grey, K.-A.; Jenkins, R.; Khan, T.M.; Kiessling, W.; Krause, C. Endemism increases species’ climate change risk in areas of global biodiversity importance. Biol. Conserv. 2021, 257, 109070. [Google Scholar] [CrossRef]
- Zhang, J.; Nielsen, S.E.; Chen, Y.; Georges, D.; Qin, Y.; Wang, S.S.; Svenning, J.C.; Thuiller, W. Extinction risk of North American seed plants elevated by climate and land-use change. J. Appl. Ecol. 2017, 54, 303–312. [Google Scholar] [CrossRef]
- Peng, S.; Zhang, J.; Zhang, X.; Li, Y.; Liu, Y.; Wang, Z. Conservation of woody species in China under future climate and land-cover changes. J. Appl. Ecol. 2022, 59, 141–152. [Google Scholar] [CrossRef]
- da Silva, J.M.C.; Rapini, A.; Barbosa, L.C.F.; Torres, R.R. Extinction risk of narrowly distributed species of seed plants in Brazil due to habitat loss and climate change. PeerJ 2019, 7, e7333. [Google Scholar] [CrossRef]
- Kougioumoutzis, K.; Kotsakiozi, P.; Stathi, E.; Trigas, P.; Parmakelis, A. Conservation genetics of four critically endangered greek endemic plants: A preliminary assessment. Diversity 2021, 13, 152. [Google Scholar] [CrossRef]
- Charitonidou, M.; Kougioumoutzis, K.; Halley, J.M. An orchid in retrograde: Climate-driven range shift patterns of Ophrys helenae in Greece. Plants 2021, 10, 470. [Google Scholar] [CrossRef] [PubMed]
- Sandel, B.; Arge, L.; Dalsgaard, B.; Davies, R.G.; Gaston, K.J.; Sutherland, W.J.; Svenning, J.C. The influence of late quaternary climate-change velocity on species endemism. Science 2011, 334, 660–664. [Google Scholar] [CrossRef] [PubMed]
- Dornelas, M.; Gotelli, N.J.; Shimadzu, H.; Moyes, F.; Magurran, A.E.; McGill, B.J. A balance of winners and losers in the Anthropocene. Ecol. Lett. 2019, 22, 847–854. [Google Scholar] [CrossRef] [PubMed]
- Kress, W.J.; Krupnick, G.A. Lords of the biosphere: Plant winners and losers in the Anthropocene. Plants People Planet 2022, 4, 350–366. [Google Scholar] [CrossRef]
- Thuiller, W.; Lavorel, S.; Araújo, M.B.; Sykes, M.T.; Prentice, I.C. Climate change threats to plant diversity in Europe. Proc. Natl. Acad. Sci. USA 2005, 102, 8245–8250. [Google Scholar] [CrossRef] [PubMed]
- Newbold, T.; Hudson, L.N.; Contu, S.; Hill, S.L.L.; Beck, J.; Liu, Y.; Meyer, C.; Phillips, H.R.P.; Scharlemann, J.P.W.; Purvis, A. Widespread winners and narrow-ranged losers: Land use homogenizes biodiversity in local assemblages worldwide. PLoS Biol. 2018, 16, e2006841. [Google Scholar] [CrossRef] [PubMed]
- Newbold, T.; Oppenheimer, P.; Etard, A.; Williams, J.J. Tropical and Mediterranean biodiversity is disproportionately sensitive to land-use and climate change. Nat. Ecol. Evol. 2020, 4, 1630–1638. [Google Scholar] [CrossRef] [PubMed]
- Newbold, T. Future effects of climate and land-use change on terrestrial vertebrate community diversity under different scenarios. Proc. R. Soc. B Biol. Sci. 2018, 285, 20180792. [Google Scholar] [CrossRef]
- Orsenigo, S.; Mondoni, A.; Rossi, G.; Abeli, T. Some like it hot and some like it cold, but not too much: Plant responses to climate extremes. Plant Ecol. 2014, 215, 677–688. [Google Scholar] [CrossRef]
- Sweeney, C.P.; Jarzyna, M.A. Assessing the Synergistic Effects of Land Use and Climate Change on Terrestrial Biodiversity: Are Generalists Always the Winners? Curr. Landsc. Ecol. Rep. 2022, 7, 41–48. [Google Scholar] [CrossRef]
- Schulte to Bühne, H.; Tobias, J.A.; Durant, S.M.; Pettorelli, N. Improving Predictions of Climate Change–Land Use Change Interactions. Trends Ecol. Evol. 2021, 36, 29–38. [Google Scholar] [CrossRef]
- Crisp, M.D.; Laffan, S.; Linder, H.P.; Monro, A. Monro Endemism in the Australian flora. J. Biogeogr. 2001, 28, 183–198. [Google Scholar] [CrossRef]
- Laffan, S.W.; Rosauer, D.F.; Di Virgilio, G.; Miller, J.T.; González-Orozco, C.E.; Knerr, N.; Thornhill, A.H.; Mishler, B.D. Range-weighted metrics of species and phylogenetic turnover can better resolve biogeographic transition zones. Methods Ecol. Evol. 2016, 7, 580–588. [Google Scholar] [CrossRef]
- Meineke, E.K.; Davies, T.J.; Daru, B.H.; Davis, C.C. Biological collections for understanding biodiversity in the Anthropocene. Philos. Trans. R. Soc. B Biol. Sci. 2019, 374, 20170386. [Google Scholar] [CrossRef] [PubMed]
- Médail, F.; Baumel, A. Using phylogeography to define conservation priorities: The case of narrow endemic plants in the Mediterranean Basin hotspot. Biol. Conserv. 2018, 224, 258–266. [Google Scholar] [CrossRef]
- Cotto, O.; Wessely, J.; Georges, D.; Klonner, G.; Schmid, M.; Dullinger, S.; Thuiller, W.; Guillaume, F. A dynamic eco-evolutionary model predicts slow response of alpine plants to climate warming. Nat. Commun. 2017, 8, 15399. [Google Scholar] [CrossRef] [PubMed]
- Kokkoris, I.P.; Skuras, D.; Maniatis, Y.; Dimopoulos, P. Natura 2000 public awareness in EU: A prerequisite for successful conservation policy. Land Use Policy 2023, 125, 106482. [Google Scholar] [CrossRef]
- Charitonidou, M.; Kougioumoutzis, K.; Karypidou, M.C.; Halley, J.M. ‘Fly to a Safer North’: Distributional Shifts of the Orchid Ophrys insectifera L. Due to Climate Change. Biology 2022, 11, 497. [Google Scholar] [CrossRef]
- Myers, N.; Mittermeier, R.A.; Mittermeier, C.G.; Da Fonseca, G.A.B.; Kent, J. Biodiversity hotspots for conservation priorities. Nature 2000, 403, 853–858. [Google Scholar] [CrossRef]
- Cancellario, T.; Miranda, R.; Baquero, E.; Fontaneto, D.; Martínez, A.; Mammola, S. Climate change will redefine taxonomic, functional, and phylogenetic diversity of Odonata in space and time. npj Biodivers. 2022, 1, 1. [Google Scholar] [CrossRef]
- Saladin, B.; Pellissier, L.; Graham, C.H.; Nobis, M.P.; Salamin, N.; Zimmermann, N.E. Rapid climate change results in long-lasting spatial homogenization of phylogenetic diversity. Nat. Commun. 2020, 11, 4663. [Google Scholar] [CrossRef] [PubMed]
- Spalink, D.; Kriebel, R.; Li, P.; Pace, M.C.; Drew, B.T.; Zaborsky, J.G.; Rose, J.; Drummond, C.P.; Feist, M.A.; Alverson, W.S.; et al. Spatial phylogenetics reveals evolutionary constraints on the assembly of a large regional flora. Am. J. Bot. 2018, 105, 1938–1950. [Google Scholar] [CrossRef]
- Guo, W.-Y.; Serra-Diaz, J.M.; Eiserhardt, W.L.; Maitner, B.S.; Merow, C.; Violle, C.; Pound, M.J.; Sun, M.; Slik, F.; Blach-Overgaard, A. Climate change and land use threaten global hotspots of phylogenetic endemism for trees. Nat. Commun. 2023, 14, 6950. [Google Scholar] [CrossRef]
- Paliogiannis, C.; Koedam, N.; Cliquet, A. The impact of the economic crisis on the implementation of the EU Nature Directives in Greece: An expert-based view. J. Nat. Conserv. 2019, 48, 36–46. [Google Scholar] [CrossRef]
- Chodorow-Reich, G.; Karabarbounis, L.; Kekre, R. The macroeconomics of the Greek depression. Am. Econ. Rev. 2023, 113, 2411–2457. [Google Scholar] [CrossRef]
- Antoniades, A.; Antonarakis, A.S. Financial crises, environment and transition. In Financial Crises, Poverty and Environmental Sustainability: Challenges in the Context of the SDGs and Covid-19 Recovery; Springer: Cham, Switzerland, 2022; pp. 25–43. [Google Scholar]
- Monsarrat, S.; Jarvie, S.; Svenning, J.C. Anthropocene refugia: Integrating history and predictive modelling to assess the space available for biodiversity in a human-dominated world. Philos. Trans. R. Soc. B Biol. Sci. 2019, 374, 20190219. [Google Scholar] [CrossRef] [PubMed]
- Brown, S.C.; Wigley, T.M.L.; Otto-Bliesner, B.L.; Rahbek, C.; Fordham, D.A. Persistent Quaternary climate refugia are hospices for biodiversity in the Anthropocene. Nat. Clim. Change 2020, 10, 244–248. [Google Scholar] [CrossRef]
- Sales, L.P.; Pires, M.M. Identifying climate change refugia for South American biodiversity. Conserv. Biol. 2023, 37, e14087. [Google Scholar] [CrossRef]
- Baranzelli, M.C.; Cosacov, A.; Sede, S.M.; Nicola, M.V.; Sérsic, A.N. Anthropocene refugia in Patagonia: A macrogenetic approach to safeguarding the biodiversity of flowering plants. Biol. Conserv. 2022, 268, 109492. [Google Scholar] [CrossRef]
- Domic, A.I.; Capriles, J.M. Distribution shifts in habitat suitability and hotspot refugia of Andean tree species from the last glacial maximum to the Anthropocene. Neotrop. Biodivers. 2021, 7, 297–309. [Google Scholar] [CrossRef]
- Di Marco, M.; Daskalova, G.; Dragonetti, C. The exposure of the world’s mountains to global change drivers. Preprint 2023. [Google Scholar] [CrossRef]
- Kadis, C.; Thanos, C.A.; Laguna Lumbreras, E. Plant Micro-Reserves: From Theory to Practice; Experiences Gained from EU LIFE and Other Related Projects; Utopia: Athens, Greece, 2013; ISBN 9786188064720. [Google Scholar]
- Laguna, E.; Deltoro, V.I.; Pérez-Botella, J.; Pérez-Rovira, P.; Serra, L.; Olivares, A.; Fabregat, C. The role of small reserves in plant conservation in a region of high diversity in eastern Spain. Biol. Conserv. 2004, 119, 421–426. [Google Scholar] [CrossRef]
- Meineri, E.; Hylander, K. Fine-grain, large-domain climate models based on climate station and comprehensive topographic information improve microrefugia detection. Ecography 2017, 40, 1003–1013. [Google Scholar] [CrossRef]
- Lannuzel, G.; Balmot, J.; Dubos, N.; Thibault, M.; Fogliani, B. High-resolution topographic variables accurately predict the distribution of rare plant species for conservation area selection in a narrow-endemism hotspot in New Caledonia. Biodivers. Conserv. 2021, 30, 963–990. [Google Scholar] [CrossRef]
- Cogoni, D.; Fenu, G.; Dessì, C.; Deidda, A.; Giotta, C.; Piccitto, M.; Bacchetta, G. Importance of Plants with Extremely Small Populations (PSESPs) in Endemic-Rich Areas, Elements Often Forgotten in Conservation Strategies. Plants 2021, 10, 1504. [Google Scholar] [CrossRef] [PubMed]
- Xia, C.; Huang, Y.; Qi, Y.; Yang, X.; Xue, T.; Hu, R.; Deng, H.; Bussmann, R.W.; Yu, S. Developing long-term conservation priority planning for medicinal plants in China by combining conservation status with diversity hotspot analyses and climate change prediction. BMC Biol. 2022, 20, 89. [Google Scholar] [CrossRef] [PubMed]
- Pore, A.; Bais, S.; Bhausaheb Sathe, A. Commercial Cultivation and Collection Aspects of Medicinal and Aromatic Plants. Asian J. Res. Chem. 2023, 16, 184–191. [Google Scholar] [CrossRef]
- Brinckmann, J.A.; Kathe, W.; Berkhoudt, K.; Harter, D.E.V.; Schippmann, U. A New Global Estimation of Medicinal and Aromatic Plant Species in Commercial Cultivation and Their Conservation Status. Econ. Bot. 2022, 76, 319–333. [Google Scholar] [CrossRef]
- Schippmann, U.; Leaman, D.; Cunningham, A.B. A Comparison of Cultivation and Wild Collection of Medicinal and Aromatic Plants Under Sustainability Aspects. In Medicinal and Aromatic Plants; Springer: Dordrecht, The Netherlands, 2007. [Google Scholar]
- Sharma, N.; Kala, C.P. Harvesting and management of medicinal and aromatic plants in the Himalaya. J. Appl. Res. Med. Aromat. Plants 2018, 8, 1–9. [Google Scholar] [CrossRef]
- Labokas, J.; Karpavičienė, B. On the Prospects of In Situ Conservation of Medicinal- and Aromatic-Plant Genetic Resources at Ancient-Hillfort Sites: A Case Study from Lithuania. Plants 2023, 12, 861. [Google Scholar] [CrossRef]
- Zimmer, H.C.; Auld, T.D.; Cuneo, P.; Offord, C.A.; Commander, L.E. Conservation translocation—An increasingly viable option for managing threatened plant species. Aust. J. Bot. 2019, 67, 501–509. [Google Scholar] [CrossRef]
- Silcock, J.L.; Simmons, C.L.; Monks, L.; Dillon, R.; Reiter, N.; Jusaitis, M.; Vesk, P.A.; Byrne, M.; Coates, D.J. Threatened plant translocation in Australia: A review. Biol. Conserv. 2019, 236, 211–222. [Google Scholar] [CrossRef]
- Sourabh, P.; Sourabh, P.; Thakur, J.; Sharma, P.; Uniyal, P.L.; Pandey, A.K. Habitat Distribution Modelling for Reintroduction of Endangered Medicinal Plants—Ephedra gerardiana, Lilium polyphyllum, Crepidium acuminatum, Pittosporum eriocarpum and Skimmia anquetilia in India. Int. J. Ecol. Environ. Sci. 2018, 44, 207–216. [Google Scholar]
- Schäfer, D.; Vincent, H.; Fischer, M.; Kempel, A. The importance of genetic diversity for the translocation of eight threatened plant species into the wild. Glob. Ecol. Conserv. 2020, 24, e01240. [Google Scholar] [CrossRef]
- Rossetto, M.; Bragg, J.; Brown, D.; van der Merwe, M.; Wilson, T.C.; Yap, J.Y.S. Applying simple genomic workflows to optimise practical plant translocation outcomes. Plant Ecol. 2023, 224, 803–816. [Google Scholar] [CrossRef]
- Abeli, T.; Dalrymple, S.E. Advances in plant conservation translocation. Plant Ecol. 2023, 224, 741–744. [Google Scholar] [CrossRef]
- Fenu, G.; Calderisi, G.; Boršić, I.; Bou Dagher Kharrat, M.; García Fernández, A.; Kahale, R.; Panitsa, M.; Cogoni, D. Translocations of threatened plants in the Mediterranean Basin: Current status and future directions. Plant Ecol. 2023, 224, 765–775. [Google Scholar] [CrossRef]
- Monks, L.; Yen, J.; Dillon, R.; Standish, R.; Coates, D.; Byrne, M.; Vesk, P. Herbivore exclusion and water availability improve success across 76 translocations of 50 threatened plant species in a biodiversity hotspot with a Mediterranean climate. Plant Ecol. 2023, 224, 817–830. [Google Scholar] [CrossRef]
- Maschinski, J.; Albrecht, M.A. Center for Plant Conservation’s Best Practice Guidelines for the reintroduction of rare plants. Plant Divers. 2017, 39, 390–395. [Google Scholar] [CrossRef]
- Tariq, M.; Nandi, S.K.; Bhatt, I.D.; Bhavsar, D.; Roy, A.; Pande, V. Phytosociological and niche distribution study of Paris polyphylla smith, an important medicinal herb of Indian Himalayan region. Trop. Ecol. 2021, 62, 163–173. [Google Scholar] [CrossRef]
- Sarma, B.; Baruah, P.S.; Tanti, B. Habitat distribution modeling for reintroduction and conservation of Aristolochia indica L.—A threatened medicinal plant in Assam, India. J. Threat. Taxa 2018, 10, 12531–12537. [Google Scholar] [CrossRef]
- Fenu, G.; Bacchetta, G.; Charalambos, S.C.; Fournaraki, C.; Giusso del Galdo, G.P.; Gotsiou, P.; Kyratzis, A.; Piazza, C.; Vicens, M.; Pinna, M.S.; et al. An early evaluation of translocation actions for endangered plant species on Mediterranean islands. Plant Divers. 2019, 41, 94–104. [Google Scholar] [CrossRef] [PubMed]
- Julien, M.; Schatz, B.; Robert, A.; Colas, B. Monitoring time of conservation-driven and mitigation-driven plant translocations in Europe. Plant Ecol. 2023, 224, 791–802. [Google Scholar] [CrossRef]
- Gauthier, P.; Pons, V.; Letourneau, A.; Klesczewski, M.; Papuga, G.; Thompson, J.D. Combining population monitoring with habitat vulnerability to assess conservation status in populations of rare and endangered plants. J. Nat. Conserv. 2017, 37, 83–95. [Google Scholar] [CrossRef]
- Gauthier, P.; Pons, V.; Fisogni, A.; Murru, V.; Berjano, R.; Dessena, S.; Maccioni, A.; Chelo, C.; de Manincor, N.; Doncieux, A.; et al. Assessing vulnerability of listed Mediterranean plants based on population monitoring. J. Nat. Conserv. 2019, 52, 125758. [Google Scholar] [CrossRef]
- Ferretti-Gallon, K.; Griggs, E.; Shrestha, A.; Wang, G. National parks best practices: Lessons from a century’s worth of national parks management. Int. J. Geoheritage Parks 2021, 9, 335–346. [Google Scholar] [CrossRef]
- Mallinis, G.; Chalkidou, S.; Roustanis, T.; Kokkoris, I.P.; Chrysafis, I.; Karolos, I.-A.; Vagiona, D.; Kavvadia, A.; Dimopoulos, P.; Mitsopoulos, I. A national scale web mapping platform for mainstreaming ecosystem services in Greece. Ecol. Inform. 2023, 78, 102349. [Google Scholar] [CrossRef]
- United Nations; System of Environmental Economic Accounting. System of Environmental-Economic Accounting—Ecosystem Accounting (SEEA EA); White Cover Publication, Pre-Edited Text Subject to Official Editing; United Nations: New York, NY, USA, 2021. [Google Scholar]
- Vallecillo, S.; Maes, J.; Teller, A.; Babí Almenar, J.; Barredo, J.; Trombetti, M.; Abdul Malak, D.; Paracchini, M.L.; Carré, A.; Addamo, A.; et al. EU-Wide Methodology to Map and Assess Ecosystem Condition Towards a Common Approach Consistent with a Global Statistical Standard; EU: Luxembourg, 2022. [Google Scholar]
Disclaimer/Publisher’s Note: The statements, opinions and data contained in all publications are solely those of the individual author(s) and contributor(s) and not of MDPI and/or the editor(s). MDPI and/or the editor(s) disclaim responsibility for any injury to people or property resulting from any ideas, methods, instructions or products referred to in the content. |
© 2024 by the authors. Licensee MDPI, Basel, Switzerland. This article is an open access article distributed under the terms and conditions of the Creative Commons Attribution (CC BY) license (https://creativecommons.org/licenses/by/4.0/).
Share and Cite
Kougioumoutzis, K.; Tsakiri, M.; Kokkoris, I.P.; Trigas, P.; Iatrou, G.; Lamari, F.N.; Tzanoudakis, D.; Koumoutsou, E.; Dimopoulos, P.; Strid, A.; et al. Assessing the Vulnerability of Medicinal and Aromatic Plants to Climate and Land-Use Changes in a Mediterranean Biodiversity Hotspot. Land 2024, 13, 133. https://doi.org/10.3390/land13020133
Kougioumoutzis K, Tsakiri M, Kokkoris IP, Trigas P, Iatrou G, Lamari FN, Tzanoudakis D, Koumoutsou E, Dimopoulos P, Strid A, et al. Assessing the Vulnerability of Medicinal and Aromatic Plants to Climate and Land-Use Changes in a Mediterranean Biodiversity Hotspot. Land. 2024; 13(2):133. https://doi.org/10.3390/land13020133
Chicago/Turabian StyleKougioumoutzis, Konstantinos, Maria Tsakiri, Ioannis P. Kokkoris, Panayiotis Trigas, Gregoris Iatrou, Fotini N. Lamari, Dimitris Tzanoudakis, Eleni Koumoutsou, Panayotis Dimopoulos, Arne Strid, and et al. 2024. "Assessing the Vulnerability of Medicinal and Aromatic Plants to Climate and Land-Use Changes in a Mediterranean Biodiversity Hotspot" Land 13, no. 2: 133. https://doi.org/10.3390/land13020133
APA StyleKougioumoutzis, K., Tsakiri, M., Kokkoris, I. P., Trigas, P., Iatrou, G., Lamari, F. N., Tzanoudakis, D., Koumoutsou, E., Dimopoulos, P., Strid, A., & Panitsa, M. (2024). Assessing the Vulnerability of Medicinal and Aromatic Plants to Climate and Land-Use Changes in a Mediterranean Biodiversity Hotspot. Land, 13(2), 133. https://doi.org/10.3390/land13020133