Article

How Does Agricultural Land Lease Policy Affect Agricultural Carbon Emission? Evidence of Carbon Reduction Through Decreasing Transaction Costs in the Context of Heterogeneous Efficiency

School of Economics and Management, Beijing Forestry University, Beijing 100083, China
*
Author to whom correspondence should be addressed.
Land 2024, 13(12), 2192; https://doi.org/10.3390/land13122192
Submission received: 18 November 2024 / Revised: 13 December 2024 / Accepted: 13 December 2024 / Published: 15 December 2024

Abstract

:
Given the increasing environmental pressures, it is essential that agriculture achieves the goal of sustainable and low-carbon development. In 2010, China, as the top carbon emitter, introduced a policy on agricultural land lease (ALL), which has been met with considerable approval from farmers and has resulted in a notable surge in the rate of ALL within the country. Nevertheless, the question of how the ALL policy affects agricultural carbon emissions (ACEs) remains unanswered. What are the transmission mechanisms? To answer these questions, this paper presents an equilibrium model that accounts for the heterogeneous production efficiency among farmers. It offers a theoretical analysis of the impact of ALL policy on agricultural carbon emission reduction (ACER) and presents an empirical test of this impact using a difference-in-differences (DID) model. Our research shows that the ALL policy gives impetus to ACER. This conclusion persists even after conducting the robustness and endogeneity tests. The mechanism posits that the policy achieves ACER through reducing the proportion of rural agricultural employees. Heterogeneity analysis indicates that the policy effect is significant in both the northern and southern regions of China. Nonetheless, the effect is only observable in economically developed areas, regions with high chemical fertilizer application rates, and areas with restricted agricultural progress. This study elucidates the connection between land transfer and agricultural carbon emissions, offering empirical evidence to support the advancement of green and low-carbon agricultural development.

1. Introduction

Greenhouse gas (GHG) emissions from agricultural land account for 10–20% of total global anthropogenic GHG emissions, making agriculture the second largest source of carbon in the world [1,2,3]. China’s agricultural carbon emissions (ACEs) account for 11–17% of the country’s total emissions, with an average annual increase of more than 5% in some years [4,5]. This is mainly due to the extensive use of chemical fertilizers and pesticides in agricultural production and the energy consumption of agricultural machinery and equipment [3,6]. In the past decade, with the abandonment of traditional raw material production and management methods in China’s agricultural production, the growth rate of ACE has slowed down, but the total amount is still increasing [7]. China is committed to achieving carbon peak by 2030 and carbon neutrality by 2060, and the “dual-carbon” goal has added new content and new requirements to the green development of agriculture [8]. Therefore, it is imperative to promote ACER [9,10].
Studies have shown that one of the factors contributing to the high ACE in China is the status of small-scale agricultural operations [11,12]. First of all, the land management mode with low scale and fragmented land distribution makes it difficult for modern agriculture, characterized by mechanization, to play the role of efficiency improvement and carbon reduction [13]. Second, this state of operation leads to an increase in farmers’ part-time activities and an intensification of agricultural sideline farming, which in turn prevents the widespread promotion and application of new agricultural technologies and production methods and also leads to farmers’ tendency to invest in intensive chemicals and produce excess carbon emissions [14].
In 2010, China launched the first national standard text of ALL. The release of this text marks the effective and rapid development of China’s ALL market. As indicated in the China Rural Management Statistics Annual Report (CRMSAR), the national average ALL rate from 2005 to 2009 was 9.04%. China’s ALL market has developed effectively and rapidly, with the national average ALL rate increasing from 17.92% from 2010 to 2012 to 33.06% from 2013 to 2020. These changes have increased the scale of land management [15] and promoted the development of new agricultural management entities such as professional farmers and large planters [16].
The positive role of ALL in promoting agricultural production has been recognized by most scholars, but the academic community has different views on whether ALL can achieve ACER. On the one hand, the ALL may reduce the ACE [17,18,19,20,21,22,23,24,25,26,27]. On the other hand, the ALL may increase the ACE [13,28,29,30,31]. The specific perspectives of the relevant studies are shown in Table 1.
With the deepening of the research on ALL and ACER, scholars have gradually realized that the heterogeneity of farmers may be one of the key factors leading to the different results of ALL on ACER. Song [32] and Yu [33]’s study found that older, less-educated farmers transferring land to younger, well-educated farmers may contribute to ACER, but their study does not further explore whether this phenomenon is driven by heterogeneity in farmers’ productivity. Yasmeen [34]’s research shows that farmers with higher productivity have significantly lower ACE than farmers with lower productivity. Chari [35]’s research further found that farmers with higher productivity tend to flow from land, while farmers with lower productivity tend to flow out of land. However, there is no direct confirmation of whether ALL based on the heterogeneity of production efficiency among farmers can effectively promote ACER.
In addition, as the first national-level formal contract for ALL, this text clearly and specifically defines the rights and obligations of both parties to the ALL, provides a solid guarantee mechanism for the standardized implementation of ALL, and effectively reduces the transaction costs in the process of ALL. Jiang [36] sees this policy as a quasi-natural experiment and finds that the ALL policy promotes the development of agricultural finance activities. Song [37]’s research further reveals the positive effect of ALL policies in reducing the rate of farmland abandonment. Huo [38]’s research focuses on the effect of ALL policies on sustainable agricultural production in China. The existing literature has shown that in the industrial and urban sectors, the reduction in transaction costs can effectively contribute to carbon emission reduction [39]. However, there is no clear answer to the question of whether the transaction costs reduced by the ALL policy can also promote ACER.
In order to answer the above questions, this study constructs a theoretical model to explore the behavioral motivation of farmers to choose to participate in or exit the ALL market in the context of heterogeneous production efficiency, further clarify the relationship between farmers’ production efficiency and ACER, and construct an analytical framework to analyze how the decrease in transaction costs caused by ALL policy affects ACER through farmers’ heterogeneous production efficiency. This study verifies the theoretical model through empirical analysis, aiming to provide a theoretical basis and policy implications for improving the ALL market, optimizing the allocation of rural resources, and promoting low-carbon and high-quality development in the agricultural field.
The marginal contribution of this study is mainly reflected in two aspects: first, this study innovatively applies Melitz [40]’s heterogeneous production efficiency model to the field of ACER and theoretically analyzes how farmers with different production efficiency can achieve ACER through ALL. Second, this study combines ALL policy with ACER for the first time, filling the gap in the research on reducing transaction costs in the field of ACER.

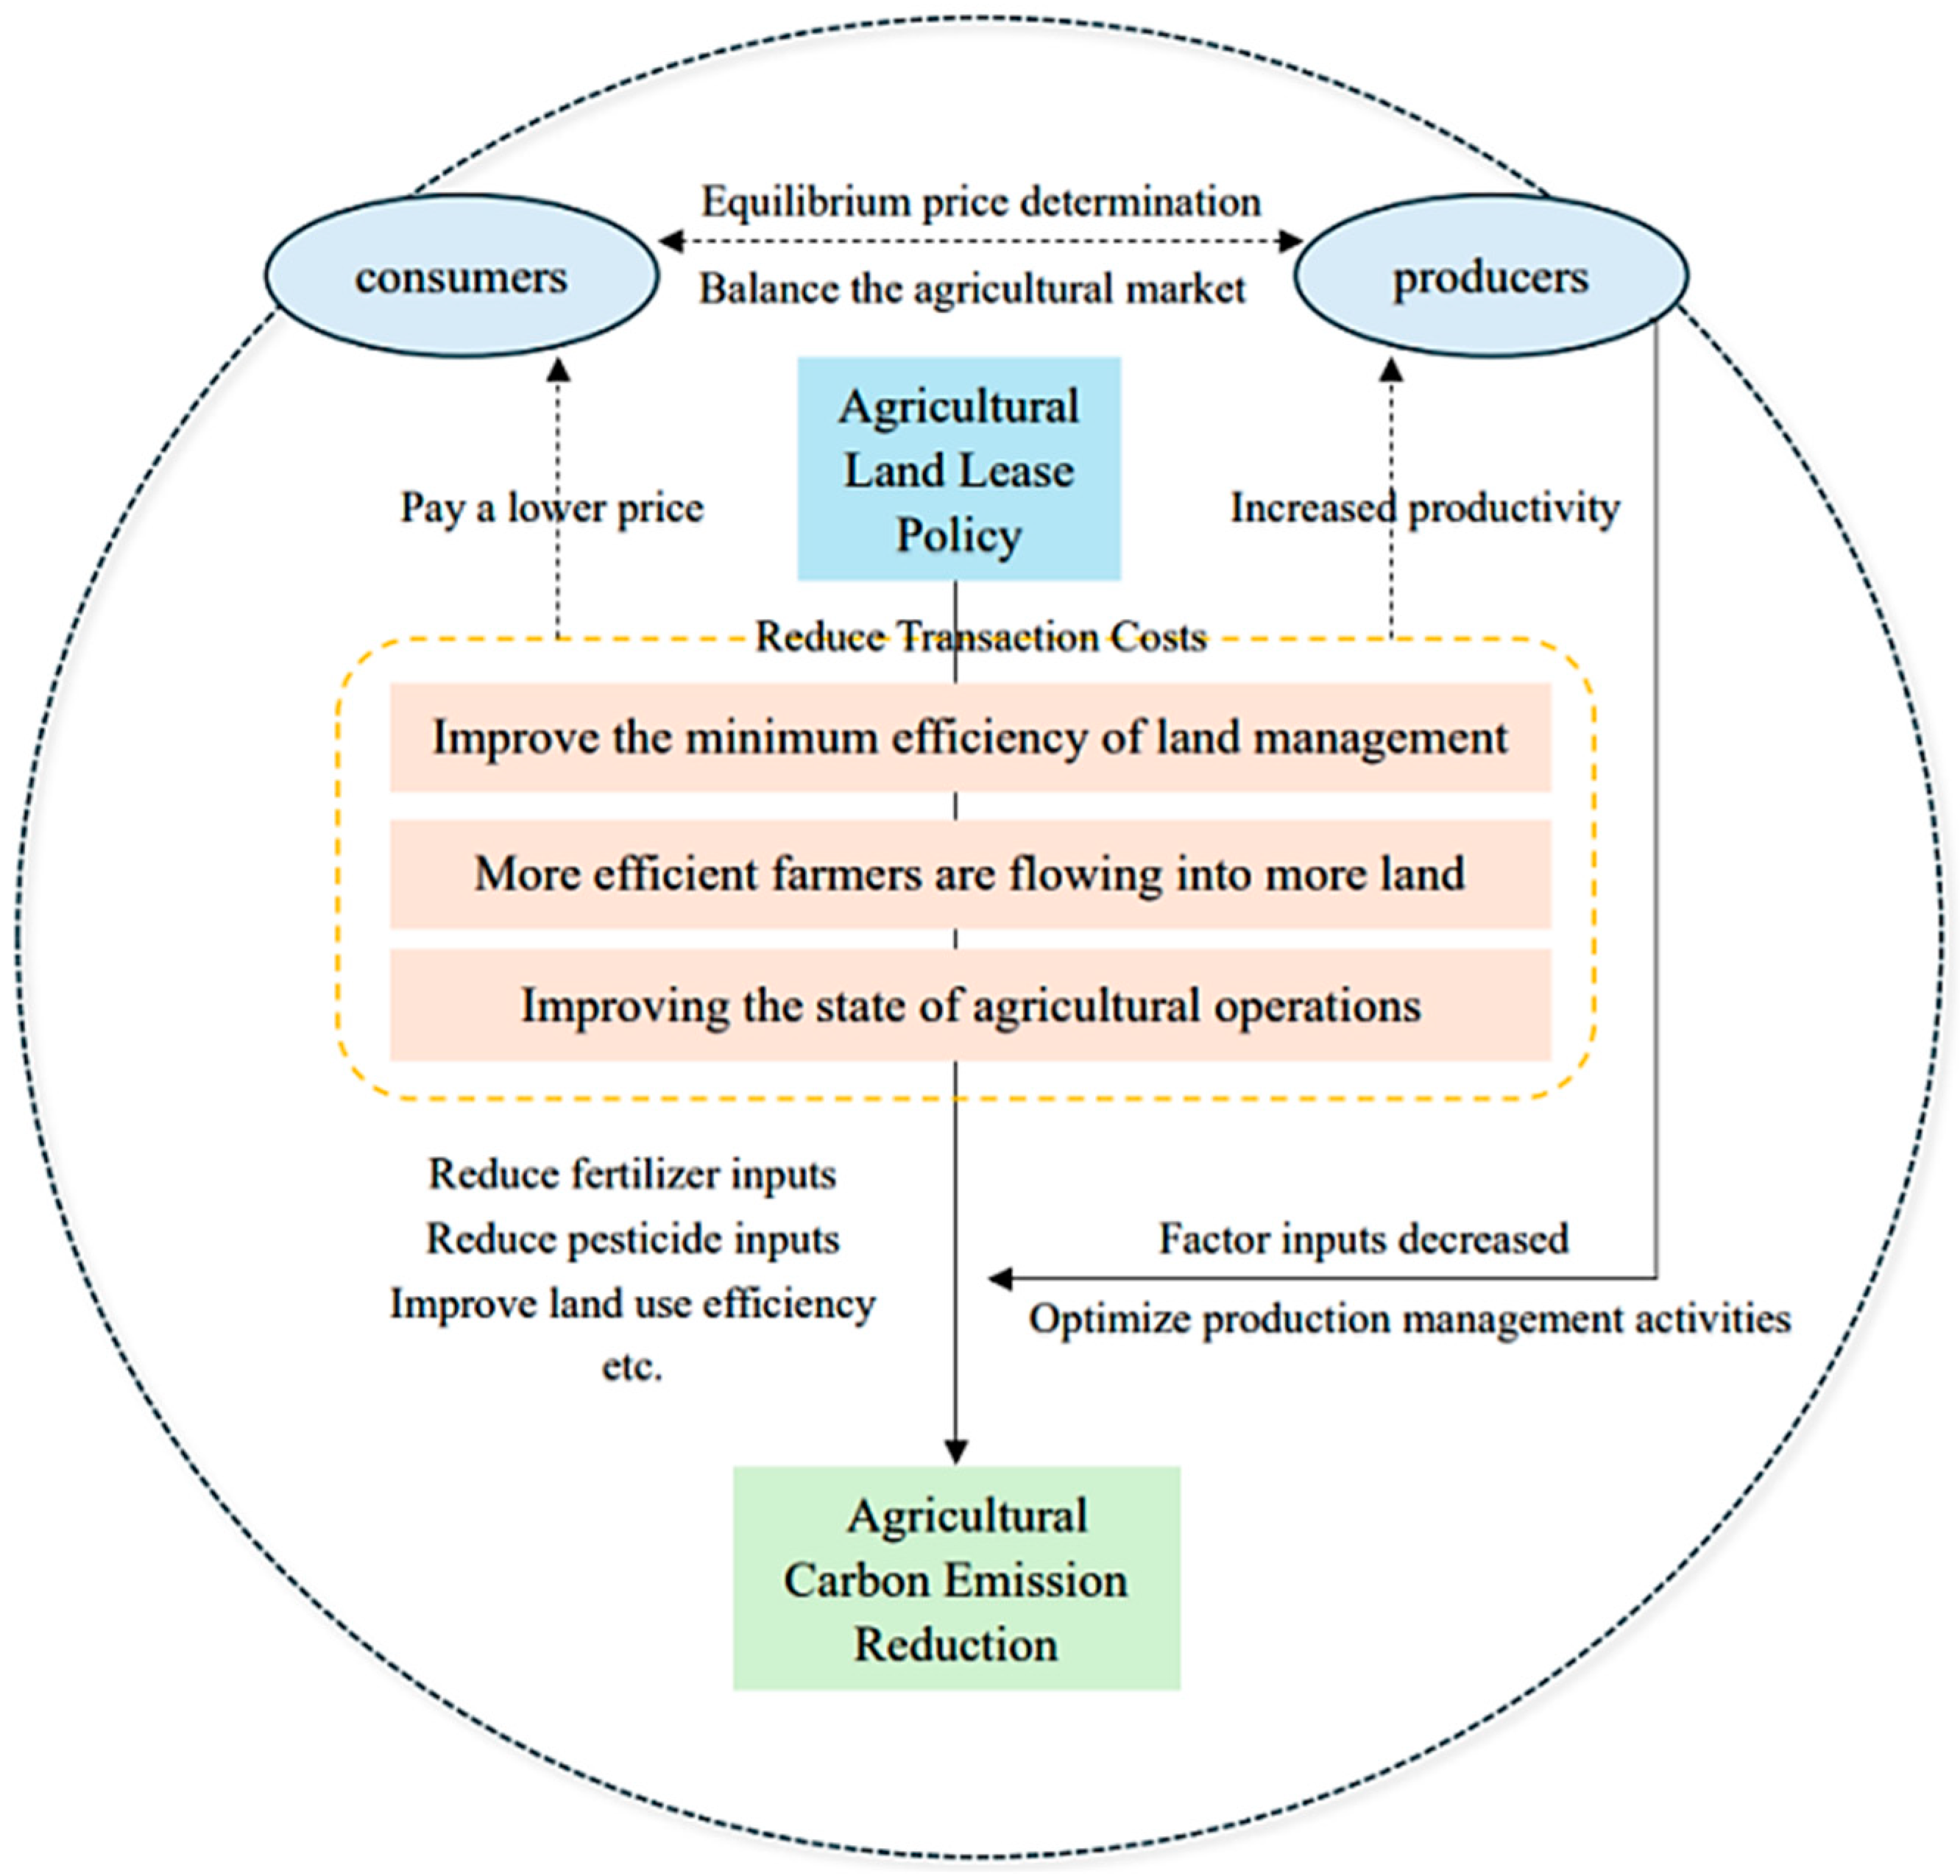
2. Theoretical Analysis and Research Hypotheses

This paper elucidates how the decrease in transaction costs resulting from the ALL policy enhances ACER, utilizing Melitz [40]’s heterogeneous production efficiency model. It constructs a theoretical framework linking the ALL to farmers’ production efficiency, grounded in the constant elasticity of substitution (CES) utility function, thereby proposing a research hypothesis.

2.1. Consumption Choice

Assumptions:
(1)
There is a large and continuous set of goods Ω , given that consumers have the same utility function, and representative consumer preferences are in the form of CES utility functions as follows: U = [ ω Ω q ( ω ) ρ d ω ] 1 ρ ; where q ω represents the demand for a good ω, there is substitutability between goods such that 0 < ρ < 1 , with the elasticity of substitution between any two goods being σ = 1 / ( 1 ρ ) > 1 .
(2)
The consumption expenditure function of the representative consumer for all goods is R = ω Ω p ( ω ) q ( ω ) d ω , where p ( ω ) represents the price of the ω .
The solution gives a demand function for ω as follows: q ( ω ) = R p ( ω ) σ ω Ω p ( ω ) 1 σ d ω . Let the price summation among commodities be P = [ ω Ω p ( ω ) 1 σ d ω ] 1 1 σ , then the demand function of commodity ω is q ω = R p ω σ P σ 1 . The total number of goods consumed by the representative consumer is Q = R P . The share of goods ω in the total number of goods consumed and the share of expenditures are, respectively, as follows:
q ω Q = [ p ω P ] σ
r ω R = [ p ω P ] 1 σ

2.2. Agricultural Supply and Carbon Emissions

Assumptions:
(1)
Agricultural production uses Θ as an input factor and thus causes carbon emissions. Individual farmers produce the required number of inputs θ and cause carbon emissions φ , with the standardized unit price of inputs being 1.
(2)
Agricultural products ω are supplied by a large number of farmers with heterogeneous production efficiencies, where τ represents the production efficiency of each farmer. The heterogeneity of farmers follows the exogenously given initial production efficiency, which is distributed as g ( τ ) , where g τ [ 0 , ] and G ( τ ) represent the cumulative probability distributions.
(3)
A profit-maximizing farmer follows a marginal cost markup strategy, with elasticity of substitution between commodities σ and markup ratio σ / ( σ 1 ) = ρ .
(4)
Factor inputs and outputs are linearly related: q = θ τ , and the more efficient a farmer is, the less factor inputs are required for the same output.
The production cost function of the farmer is c = f + θ = f + q τ , where f is the fixed input cost of the farmer’s production. From the markup ratio ρ , the price of agricultural products is p φ = 1 ρ τ . In the following sections, r ω ( τ ) is simplified to r τ . Similar treatments include q ω being simplified to q , etc. The agricultural income function and the agricultural profit function of the farmer are r τ = p τ q and π τ = r τ c , which can be obtained by combining Equations (1) and (2) with the cost function and the price function as follows:
r τ = p τ q = R ( P ρ τ ) σ 1
π τ = r τ c = R P ρ τ σ 1 σ f
Since p τ τ < 0 , r τ τ > 0 , π τ τ > 0 , increased production efficiency correlates with reduced prices of agricultural products, elevated agricultural income and profits for farmers, and enhanced motivation to undertake and expand agricultural production.
More importantly, the input factor θ generates carbon emissions φ , φ θ > 0 , that is, the more factor inputs, the more agricultural carbon emissions. Since c τ = θ τ < 0 , then:
φ τ = φ θ θ τ < 0
Consequently, more efficient farmers generate less ACE for equivalent yields. In addition, as China has not yet regulated ACE, farmers’ production and management decisions only take into account agricultural profits π .

2.3. Farmer Choice and Equilibrium

For analytical purposes, it is presumed that the farmer’s business cycle in relocating to new land is infinite. It is assumed that there are transaction costs f g and per period land rental costs f e . The supply of agricultural products takes place in a perfectly competitive market environment, that is, anyone who pays a fee is free to operate.
For those who vacate their lands, f e returns are obtained in each period. For the transferor, the profit is π τ = π τ f e per period, while each period faces a certain probability of risk occurrence δ resulting in the farmer’s withdrawal from land operations. Then, the expected profit value of the transferred land obtained by the farmer in the whole life cycle is t = 0 ( 1 δ ) t π τ = π τ δ . Whether the farmer continues to operate on land after transferring to the new land depends on whether it is profitable or not as follows: ν τ = m a x { 0 , π τ δ } .
If π τ is negative, the farmer will not relocate to new land; π τ will also be negative at this point, and the farmer will choose to leave the business. Since π τ τ > 0 , the more efficient the agricultural production, the higher the farmer’s profit. There exists a certain value of production efficiency at which π τ is zero. More efficient farmers will have a greater π τ , and the farmer with positive π τ has an incentive to relocate to a new land.
Assuming that the minimum efficiency of exiting farmers is τ * , since farmers below this efficiency choose to exit the business, the distribution probability of the efficiency of continuing farmers μ τ is the conditional distribution probability of the initial distribution probability g τ : μ τ = g τ 1 G ( τ * ) ,     τ τ *           0           ,     τ < τ * . After ALL, the average production efficiency of all farmers is τ ~ : τ ~ τ * = [ 1 1 G ( τ * ) τ * τ σ 1 g τ d τ ] 1 σ 1 .
After ALL, the actual operating farmers change from the initial [ 0 , ] distribution to [ τ * , ] . At the same time, the average productivity τ ~ τ * of farming households increases accordingly. At this time, the average income r τ ~ and the average profit π τ ~ of the farmer transferring to a new land are both determined by τ * : r τ ~ r τ * = ( τ ~ τ * ) σ 1 and π τ ~ = ( τ ~ τ * ) σ 1 r τ * τ f , where f = f + f e . Since π ( τ * ) = r τ * σ f = 0 :
π τ ~ = f [ ( τ ~ τ * ) σ 1 1 ]
It can be shown that π τ ~ τ * < 0 , defining this relationship is represented by the surface I in Figure 1. The surface I represents the profitability of farmers transferring to a new land. As the productivity of the least efficient farmer increases, the relative advantage of the efficient farmer diminishes. Again, since the least efficient farmer is in a zero-profit position, the real profitability resulting from the transfer of the efficient farmer to a new land declines; in this case, φ π = φ τ τ π > 0 . In order to achieve higher profits, farmers increase planting intensity, which in turn increases ACE [28,29].
Since there is a transaction cost f g , the farmer considers the net value of the land transferred, ν g : ν g = 1 G τ * π τ ~ δ f g . This is obtained in a perfectly competitive state with ν g = 0 :
π τ ~ = δ f g 1 G τ *
It can be shown that π τ ~ τ * > 0 . Defining this relationship is represented by surface II. The surface II represents the zero net value situation of the transferred land. Highly productive farmers possess elevated profit expectations and exhibit a greater willingness to pay for land transfers. Since ν g = 0 under perfect competition, the zero net value of land corresponds to a higher level of profitability as the least efficient farmers become more productive. In this case, φ π = φ τ τ π < 0 . A greater zero net value indicates that only proficient farmers possess the capacity to transition to a new land, and efficient farmers have better ACER performance.
This leads to two relationships between   φ , π ( τ * ) , and τ * , as shown in Figure 1. The intersection of the two surfaces is the minimum operating efficiency τ * , below which farmers will opt out of the business.

2.4. Impact of ALL Policy and Research Assumptions

In China, the core principle of agricultural land distribution schemes is equity, which usually means that land is distributed evenly according to the size of the farmer family, taking into account the fertility and size of the land. However, this distribution pattern can lead to a loss of agricultural production efficiency and exacerbate the ACE. The implementation of the ALL policy aims to expand the area of land operated by reducing transaction costs and encouraging some farmers to lease more land. This change will help to optimize the spatial distribution of farmland use, reduce the degree of restriction of land resources and the probability of abandonment, and improve the matching degree between farmland and farmers’ production and operation capabilities. In this way, the ALL policy is conducive to the promotion and application of new agricultural technologies and enriches the comprehensive benefits of land. Specifically, the ALL policy promotes the rational circulation of land and makes more efficient use of land resources, which not only helps to improve agricultural production efficiency but also reduces the damage to land, water resources, and biodiversity and maintains ecological balance through the adoption of environmentally friendly agricultural technologies and management measures. In addition, the ALL policy also helps to promote the development of green agriculture to achieve resource conservation and environmental friendliness, which is of great significance for reducing food contamination and improving the health level and quality of life of the people.
By promoting the optimal allocation of land resources and the application of new agricultural technologies, the ALL policy not only improves agricultural production efficiency but also helps to promote the development of green agriculture and achieve the dual goals of sustainable agricultural development and ecological environmental protection. Based on this, the following assumptions are proposed:
H1: 
When the ALL policy is proposed, it will have a positive impact on ACER.
The ALL policy has led to a reduction in δ f g (transaction costs). On the one hand, the policy makes it easier to negotiate ALL. Unlike previous policies, the ALL policy introduced in 2010 for the first time paid attention to the operability of ALL activities and issued specific guidelines on grassroots coordination, information communication, contract execution, and price assessment. The release and acquisition of ALL information has become more convenient, and both parties or even multiple parties have more reliable anchors for ALL negotiations, so information and negotiation costs are relatively lower, leading to a reduction in f g .
On the other hand, the implementation of the ALL policy, as evidenced by the official publication of the standard text of ALL contracts, has led to a decrease in the incidence of ALL disputes. Compared with the previous non-standard oral contracts, the template makes a standard definition of the responsibilities and obligations of the two parties for the transfer, which makes the land transfer contract more standardized and more adequately protected at the law. In this way, the implementation of the land transfer contract becomes smoother, which lowers the probability of leaving the business in each period δ .
When δ f g declines, surface II flattens downward to surface II’, as shown in Figure 1. The ALL policy reduces the transaction cost and weakens the barriers that occur in ALL. More intense competitions make more non-highly productive farmers be squeezed out of the land operation, and the minimum efficiency of exiting farmers shifts rightward from τ * to τ * , which makes the land resources to be operated by more efficient farmers through ALL. As the exit threshold increases, φ ~ τ * rises accordingly.
What is more, since φ τ < 0 , as τ * and τ ~ τ * are increased, the ACE decreases accordingly. The influence of ALL policy on ACER can be encapsulated as follows: “ALL policy—reduces transaction costs—enhances the average production efficiency of farmers—attains ACER,” as illustrated in Figure 2. However, at the macro scale, it is difficult to observe the changes in the production efficiency of microfarmers.
At the macro level, it is indeed difficult to observe the changes in the production efficiency of microfarmers. However, according to Wang [41] and Yang [42], they used microfarmer data to find that when agricultural labor is transferred to the non-agricultural sector, farmers’ agricultural productivity actually increases. This finding suggests that the decline in the number of agricultural workers may be a measure of the improvement in farmers’ productivity. In addition, Lewis [43]’s dualistic structure theory proposed in 1954 also states that a decrease in the number of agricultural workers may lead to an increase in the productivity of surplus labor.
In order to cope with the impact of the decline in agricultural workers, farmers are more inclined to adopt modern agricultural techniques and management methods in the production process. As the shift of agricultural labor to the non-agricultural sector has led to a narrowing of the income gap between agriculture and the non-agricultural sector, the surplus agricultural labor force has been able to obtain more skills training and capital allocation, leading to more efficient production methods. This structural change will help to increase the productivity of the surplus agricultural workforce, which in turn will drive the development of agricultural production methods in a more efficient and environmentally friendly direction and ultimately contribute to the realization of ACER. Based on the above analysis, the following hypotheses are proposed:
H2: 
ALL policies reduce carbon emissions by reducing transaction costs, increasing the minimum efficiency value of existing operations, and reducing the number of rural agricultural workers.

3. Research Design and Data

3.1. Model Establishment

In order to explore the impact of ALL policy on ACER, according to Fortson [44], the DID model was used for our assessments in this paper as follows:
l n C O 2 i t = α 1 + β 1 ( t r e a t i t × p o s t i t ) + γ X i t + η i + μ t + ε i t
where C O 2 i t is the explanatory variable representing carbon emissions from agriculture in the year t in the province i ; t r e a t i t × p o s t i t is the core explanatory variable, where t r e a t i t represents the land transfer in the year t in the province i and p o s t i t represents whether the province i is affected by the land transfer policy in the year t . If the policy is implemented in the year t , it takes the value of 1. Otherwise, it takes the value of 0. η i and μ_t represent the province fixed effect and time fixed effect, respectively; ε i t represents the random disturbance term affecting agricultural carbon emissions; β 1 represents the effect of the land transfer policy on agricultural carbon emissions; and X i t represents a set of control variables.

3.2. Description of Variables

Explanatory variable ACE. This paper refers to Du [5], Jin [6], Lal [45], Tian [46], and Wang [3]’s approach and sets the formula for measuring ACE as follows: A C E = C j T j , where C j is the carbon emission coefficient of the j th category of carbon sources, and T j is the absolute amount of consumption of the jth category of carbon sources.
Explanatory variable ALL policy: The ALL policy in this paper is expressed by the interaction term of the proportion of transferred area of family-contracted farmland and the dummy variable of the time of the response to the ALL policy in each province. Given that there are significant time differences in the degree of response to the policy in each region, this paper takes 2010 as the base year for the implementation of the policy and the year in which the provincial ALL rate exceeds the national average transfer rate as the point in time when the region responded to this policy.
Control variables: (1) size of land (SL)—characterized by the per capita sown area of the agricultural labor force [47]; (2) financial support to agriculture (FA)—characterized by the per capita financial expenditure on agriculture of the agricultural labor force [48]; (3) degree of mechanization (DM)—characterized by the total power of agricultural machinery per unit of sown area [49]; (4) structure of the agricultural industry (SA)—characterized by agricultural output as a share of agricultural, forestry, livestock and fisheries output [50]; (5) human capital in agriculture (HA)—characterized by the average number of years of education of the rural population [51]; and (6) rural population structure (RS)—characterized by the share of the rural labor force in the total rural population [52].
Mechanism variables: agricultural employment status (AE)—characterized by the share of agricultural employees in the rural labor force.
Other variables: agricultural carbon intensity (ACI)—characterized by agricultural carbon emissions per unit of cultivated area.

3.3. Data Source and Description

This paper uses panel data from 30 provincial-level administrative regions in China, excluding Tibet, Hong Kong, Macau, and Taiwan, from 2005 to 2020. The ALL data in this paper are acquired from the National Statistics on Rural Economic Situation and the Annual Report of China’s Rural Management Statistics, while the rest of the data comes from the China Rural Statistical Yearbook, the China Statistical Yearbook, and the China Population and Employment Statistical Yearbook of previous years. Missing individual data were supplemented using the moving average method, and all data, with the exception of the ALL policy, have been logarithmically transformed. Descriptive statistical analyses of the variables are presented in Table 2.

4. Results

4.1. Benchmark Regression Results

Based on 30 provincial panel data in China from 2005 to 2020, this paper selects the difference-in-differences model with double fixed effects of province and time to test whether the ALL policy effectively promotes ACER. The empirical regression results are shown in Table 3.
From columns (1) and (2) of Table 3, it is evident that the ALL policy is significantly negative at the 5% significant level despite adding or excluding control variables. The results of the benchmark regression preliminarily indicate that the ALL policy reduces ACE, preliminarily verifying H1.

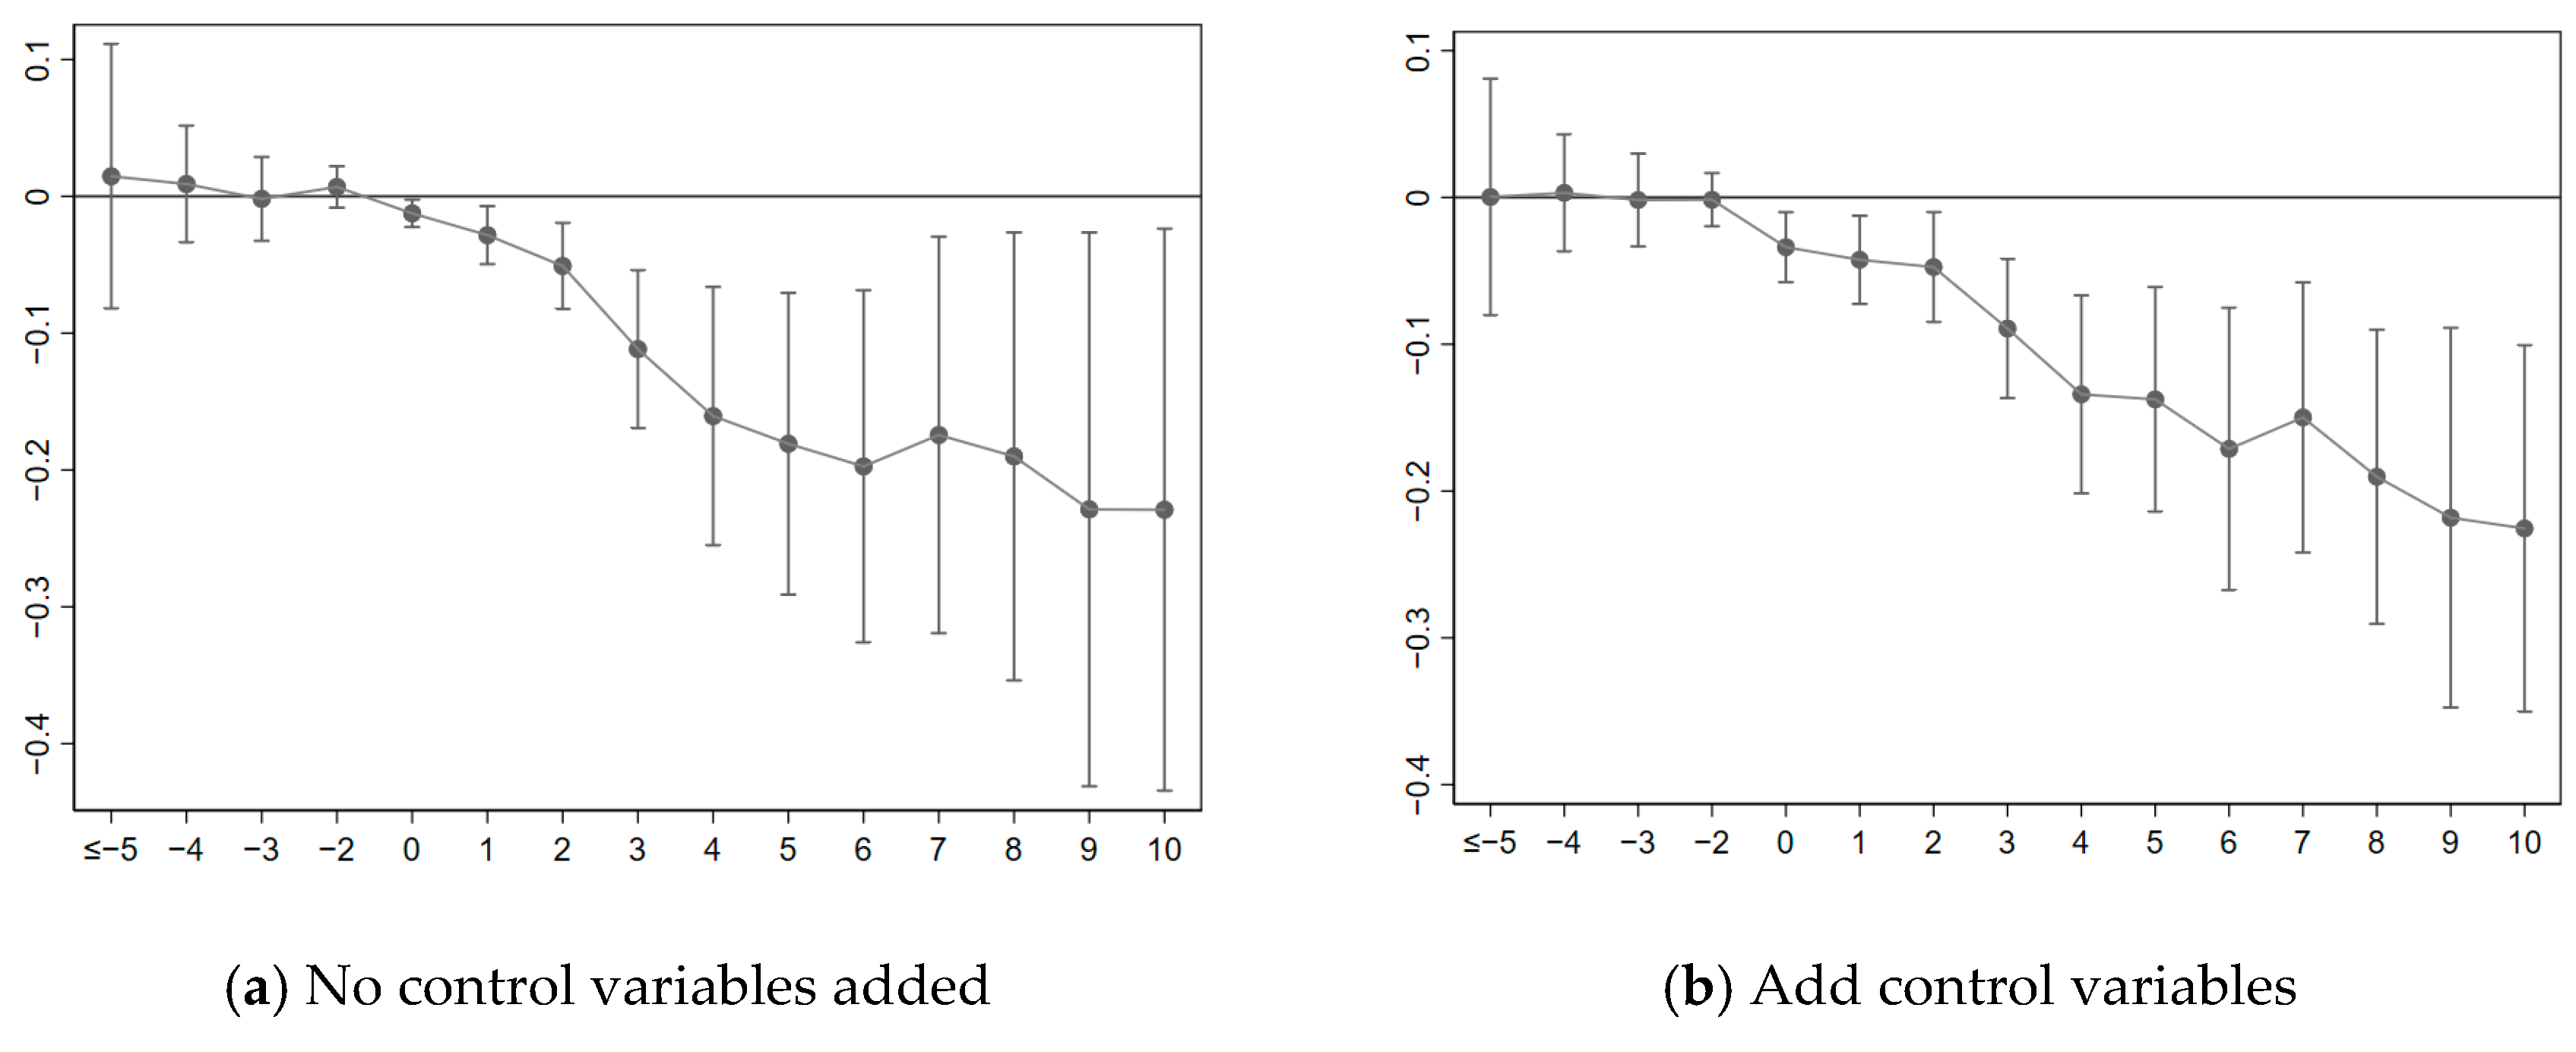
4.2. Parallel Trend and Dynamic Test
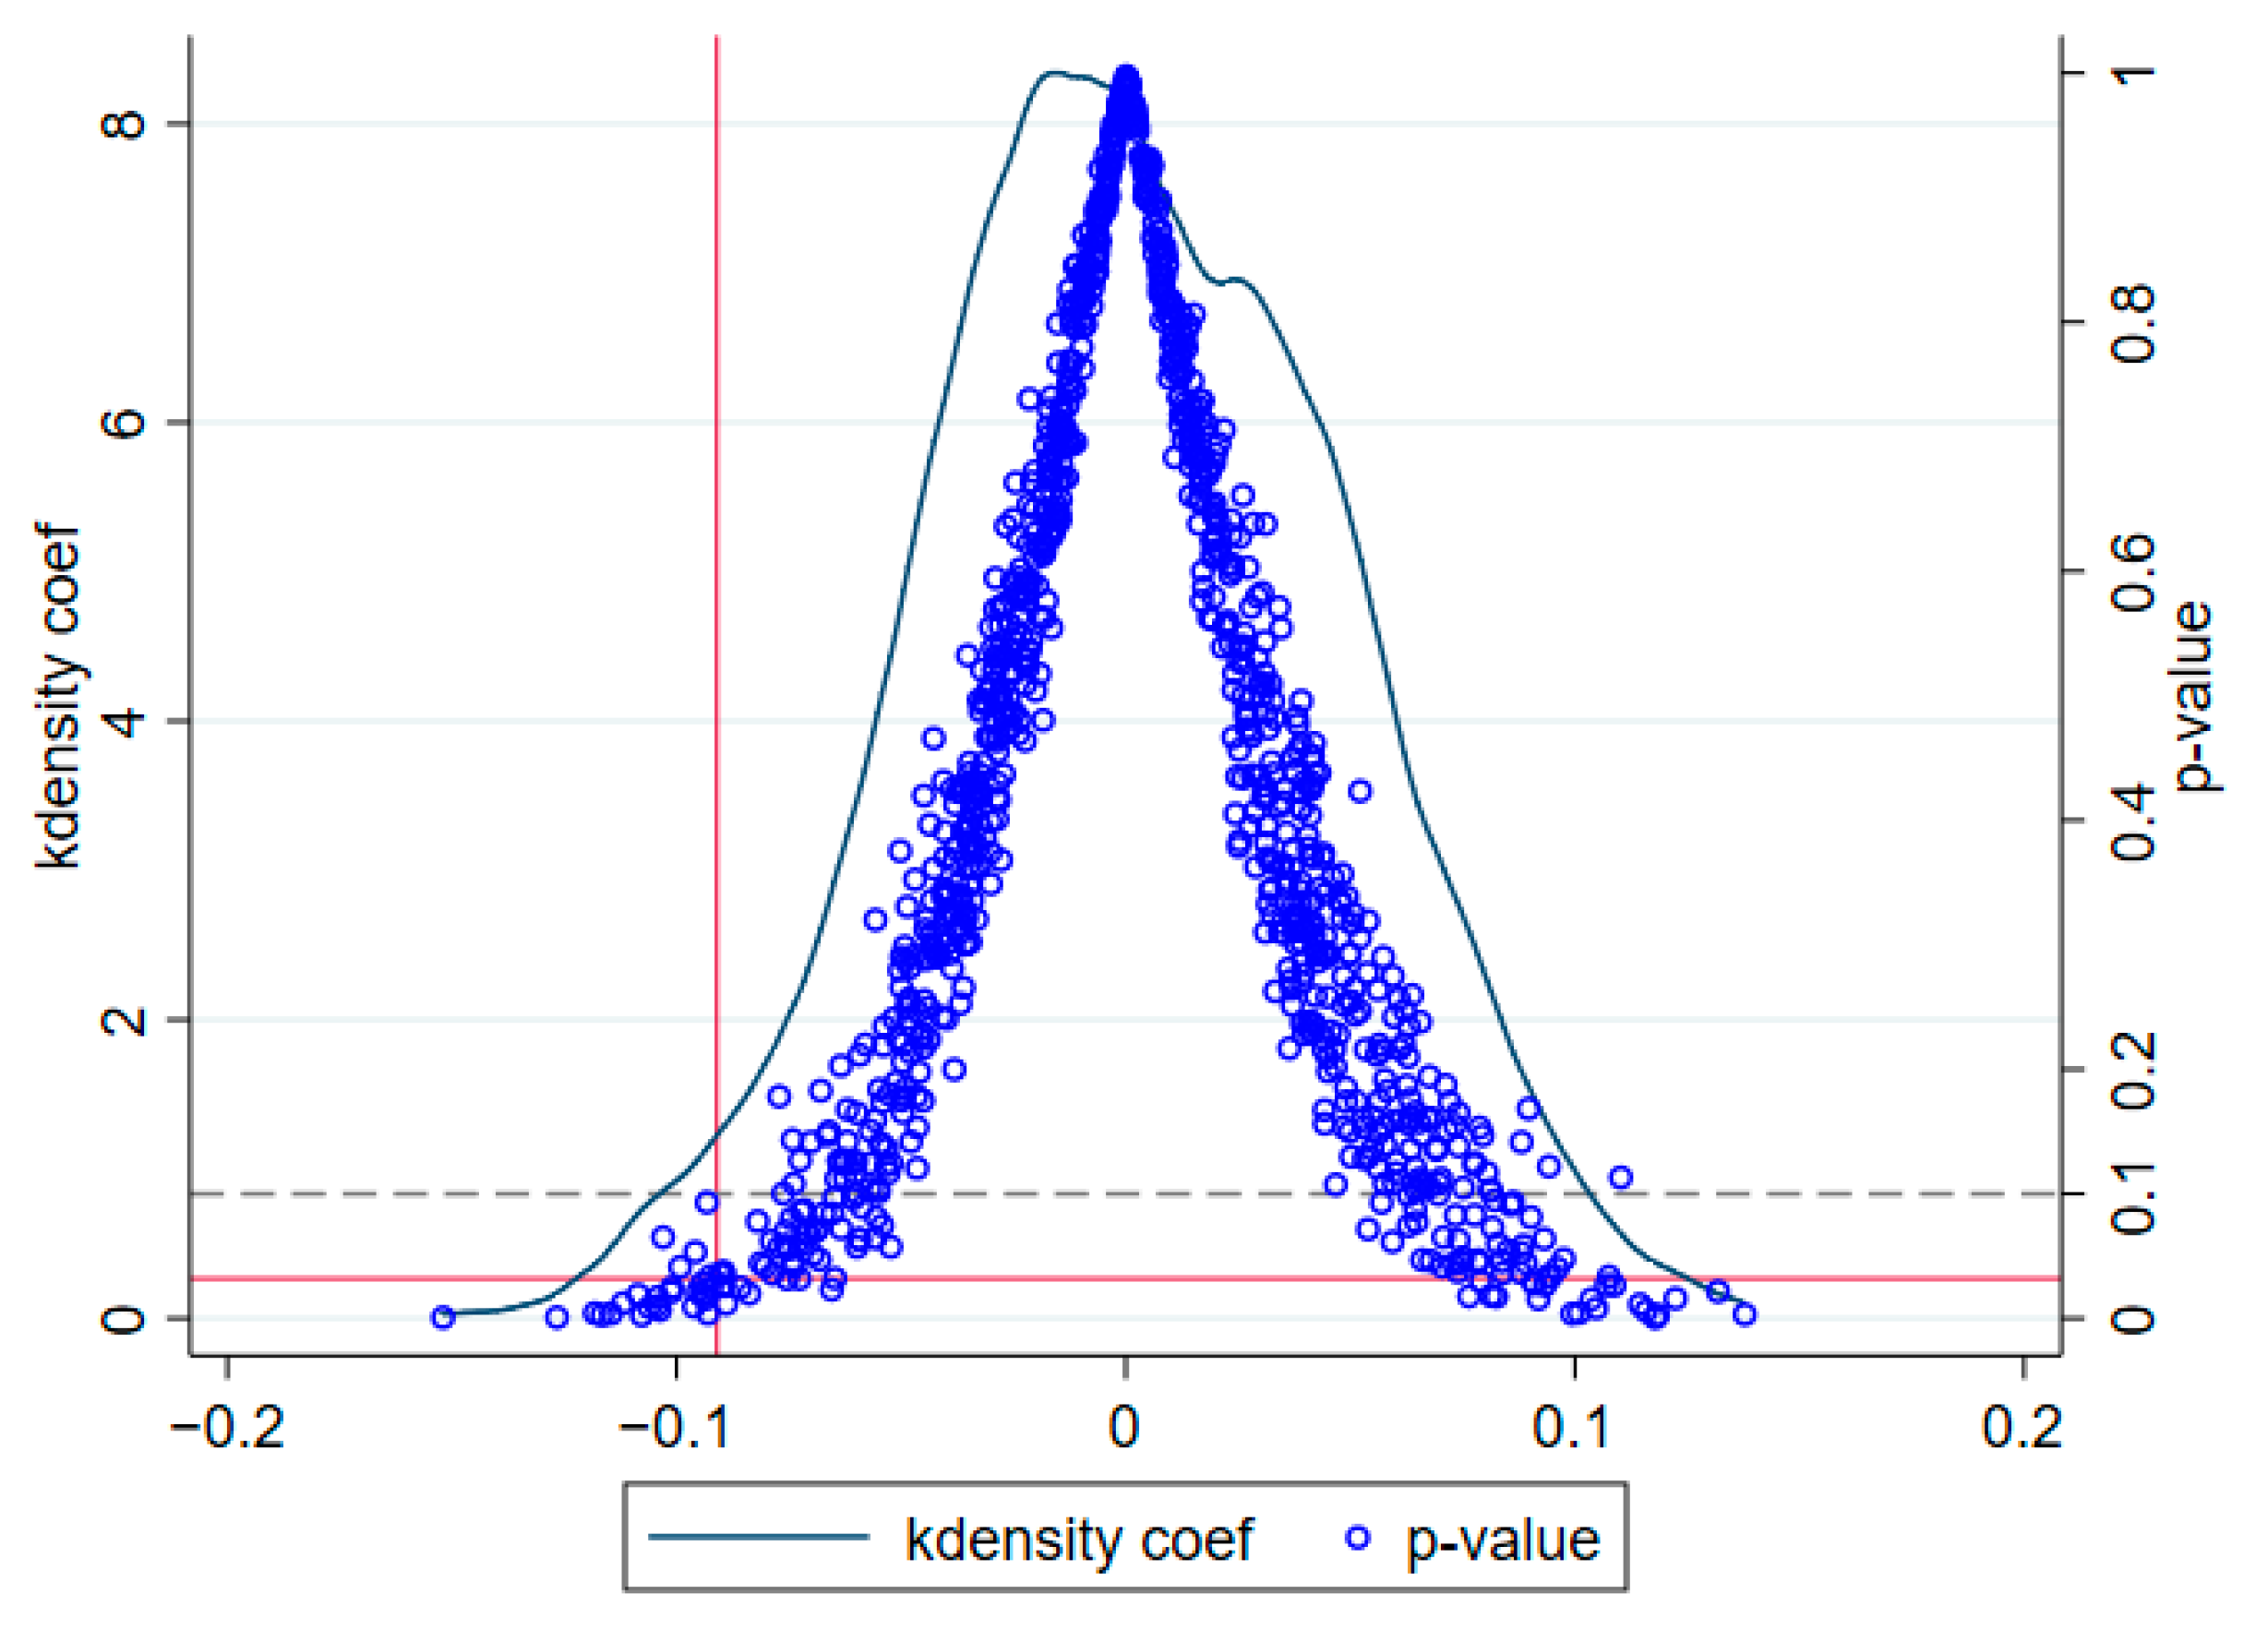
In employing the difference-in-differences model to assess policy outcomes, it is crucial for the control and experimental groups to demonstrate parallel trends prior to policy implementation. If the same trend is absent, the policy effects identified by the model may be inaccurately determined. This paper utilizes Nunn’s method [53] to develop a novel testing model:
l n C O 2 i t = α 2 + i = 5 10 ζ t D i t + γ 2 X i t + η i + μ t + ε i t
where D i t is a dummy variable indicating whether the province i is affected by the ALL policy in the year t . If the policy is implemented in the year t , it is designated as 1 and inversely as 0. The rest of the variables have the same connotations as in Equation (8).
This paper consolidates the data to the period −5, as fewer provinces were impacted by the policy prior to five years ago. Figure 2 shows that the coefficients are insignificant in all periods before the policy. Subsequent to the policy’s implementation, ACE in the impacted regions was markedly lower than in other areas, with a discernible trend of gradual escalation in this effect. Figure 3 shows that the ALL policy passes the parallel trend test whether or not control variables are added.

4.3. Placebo Test

To prevent the regression results from being influenced by unobservable factors that may induce significance, this paper employs a Monte Carlo simulation, conducted 1000 times, to randomly generate the provinces and years impacted by the ALL policy shocks, following the methodology of Wang [54]. In this paper, 14 provinces and policy response years were randomly selected each time. The p-statistic distribution of the 1000 simulated regression coefficients β is shown in Figure 4. The findings indicate that the p-statistic from the simulation closely aligns with a normal distribution, exhibiting a mean value of 0, and most results are greater than 0.1, that is, most of the simulations do not pass the 10% significance level. This outcome suggests that the significance represents a low-probability event in the placebo test, and the baseline regression results are not attributable to unobservable factors. Accordingly, the ALL policy contributes significantly to the reduction in ACE.

4.4. Sensitivity Test

Sensitivity tests: On the basis of the uncontrolled variables in regression (1) in Table 3, the regression (1) to regression (6) in Table 4 includes SL, FA, DM, SA, HA, and RS, respectively [55]. Compared with regressions (1) and (2) in Table 2, there was no significant change in the coefficient and significance of ALL.
In the controlled variables, only SL, DM, and RS are significant, this result is not surprising. First, previous research indicates that expanding SL leads to a shift in agricultural production from labor-intensive to capital-intensive production, accompanied by increased inputs such as fertilizers and pesticides, which in turn lead to an increase in ACE [30,31]. As the controlled variables increase, the impact of SL on ACE gradually rises, and its significance also increases accordingly. Second, an increase in DM often coincides with higher consumption of fossil fuels, which directly contributes to ACE through the consumption of diesel or gasoline [49]. Lastly, with the improvement in RS, the rural population structure is optimized, meaning that the proportion of young and middle-aged laborers in rural areas increases [52]. These individuals typically have higher labor productivity and the ability to adopt new agricultural technologies. As the proportion of young and middle-aged populations increases, agricultural production efficiency may improve, contributing to achieving ACE.
This paper also found that the effects of FA, SA, and HA on ACE are complex, and these effects are not always significant. The following is a detailed analysis of the impact of these control variables:
Impact of FA: FA has boosted ACE to some extent, but its impact has not been significant. This may be because FA has a twofold effect: on the one hand, FA promotes the advancement of agricultural technology and contributes to the achievement of ACER. On the other hand, FA may lead to factor price distortions, increase the input of machinery and equipment and chemicals in agricultural production, and thus increase ACE. These two opposing effects may cancel each other out, resulting in an insignificant overall effect of FA on ACE.
Impact of SA: The increase in SA may mean an increase in the position of agriculture in the agriculture, forestry, animal husbandry, and fishery industries, which may lead to a greater concentration of resources in the agricultural sector, thereby increasing the ACE. However, if this structural adjustment is accompanied by an increase in agricultural production efficiency, it may partially offset the increase in ACE, resulting in insignificant results. This shows that the impact of agricultural restructuring on ACE is multifaceted and needs to be further studied.
Impact of HA: The improvement in HA has increased farmers’ acceptance of new technologies and the efficiency of their application, which may help improve agricultural production efficiency and achieve ACER. However, at the same time, the increase in HA may also lead to the shift of farmers’ production focus, causing more farmers to engage in non-agricultural activities, reducing agricultural production efficiency that is not conducive to ACER, resulting in insignificant results. However, after the addition of RS, the coefficient of HA turned negative, suggesting that the effect of HA on improving agricultural productivity was more significant after stripping out the impact of young labor, which contributed to the achievement of ACER.
The analysis of control variables reveals the complex impact of different factors on ACE and provides a new perspective for understanding the driving factors of ACE. These findings highlight the multifaceted factors that need to be considered when formulating agricultural policies and the combined impact these factors can have on ACE.

4.5. Robustness Test

The benchmark analysis demonstrates that the ALL policy is instrumental in promoting ACER, but a series of robustness tests are still needed to exclude the interference of confounding factors. This paper employs sample data screening, substitution of explanatory variables, and endogeneity methods to enhance the credibility of the research findings.
Sample data screening: In this paper, the explanatory variables are truncated by 5% to avoid the impact of sample extremes on the benchmark regression; Equation (6) is subjected to regression analysis. After truncation, the regression results in column (1) of Table 5 show that the positive impact of ALL policy on ACER passes the significance test at the 10% level, which is similar to the results of the benchmark regression.
Substitution of explanatory variables: Given that ACE faces not only the issue of total quantity but also the issue of intensity, this paper substitutes the explanatory variables with carbon emissions per unit of sown area and regresses Equation (8). The results in column (2) of Table 5 show that the negative effect of the ALL policy on carbon intensity passes the significance test at the 1% level, indicating that this policy also reduces carbon emissions per unit of cultivated area. This again demonstrates the robustness of the previous results.
Consideration of endogeneity: Considering the possible endogeneity problem of the model, we utilized a combination of adding the lagged explanatory variables and propensity score matching (PSM). In Table 5, columns (3) lists the regression results for the addition of lagged explanatory variables. The results showed that the ALL policy still significantly promotes ACER, and the significance level is higher (from 5% to 1% of the basic regression). Column (4) shows the regression results of the PSM-DID method, which indicates that the ALL policy still significantly reduces ACE after changing the regression method. The above test shows the robustness of the previous results.
Exclude other policy implications: In 2015, China introduced a plan to keep increasing the input of pesticides and fertilizers, which may have an impact on ACE [3]. In order to exclude the impact of this program, D2015 was added. Column (5) of Table 5 shows that after considering the impact of this program, the ALL policy still significantly boosted ACER. The above test shows the robustness of the previous results.

5. Discussion

5.1. Mechanism Test

From the previous theoretical analyses, it is clear that the ALL policy may cause low-productivity farmers to exit agricultural production through the crowding-out effect. Since this paper uses macro data for analysis, the most intuitive representation is that the policy achieves its impact on ACE by reducing the number of local agricultural employees. To prevent scale interference with the results, this indicator is denoted as AE.
To identify this mechanism, referring to Jiang [56], this paper constructs the following model:
M i t = α 3 + β 2 ( t r e a t i t × p o s t i t ) + γ 3 X i t + η i + μ t + ε i t
l n C O 2 i t = α 4 + β 3 M i t + γ 4 X i t + η i + μ t + ε i t
where M i t is the mechanism variable, denoting AE. The rest of the variables have the same connotations as in Equation (8).
As evidenced in column (1) of Table 6, the coefficient estimate of the ALL policy is −0.088, which passes the 10% significance level. This suggests that the ALL policy increases the critical value of productivity for farm households exiting the business by reducing transaction costs, which in turn leads to a reduction in AE. Column (2) of Table 6 demonstrates that an increase in AE is associated with a concomitant rise in ACE. This relationship is statistically significant at the 1% level. According to the prior theoretical analysis, a higher AE signifies a lower exit threshold, recognizing the variation in farm household productivity. This results in diminished average efficiency of local agricultural production, subsequently causing a less effective utilization of agricultural input factors and an escalation in ACE. In conjunction with the findings in column (1), it becomes evident that the ALL policy effectively eliminates low-productivity farmers, thereby enhancing the local average agricultural productivity and ultimately facilitating the realization of ACER.

5.2. Heterogeneity Test

The impact of ALL policy may be affected by regional heterogeneity. In this paper, (1) the dividing line between the north and south of China divides the sample into the northern region and the southern region; (2) the average per capita GNP of each province during the sample period was used as the dividing line between high-income and low-income regions; (3) the mean value of fertilizer application intensity in each province was used as the dividing line between high-intensity and low-intensity regions; and (4) the mean value of agricultural GDP in each province was used as a dividing line between agriculturally advantaged and agriculturally disadvantaged regions.
Columns (1) and (2) of Table 7 show the estimated impact of ALL policy on ACE in the north and south, respectively. Regression analysis showed that ALL policy had a significant negative impact on ACE in both the north and the south, and there was almost no significant difference in geography. This finding suggests that although rice is mainly cultivated in southern China, while wheat and corn are mainly cultivated in the north, the impact of ALL policy on ACE is not affected by these geographical and planting structure differences, which may be related to the general applicability and effectiveness of the policies.
Columns (3) and (4) of Table 7 reveal the impact of ALL policy in regions with different levels of economic development. In high-income areas, the impact of ALL policy on ACE was −0.277, and this passed the significance test of 5%. In low-income areas, this effect did not pass the 10% significance test. This result indicates that the impact of ALL policy on ACE is significantly affected by the level of economic development. Sun [57] pointed out that the level of economic development is closely related to the spirit of contract, and the non-market rules are more obvious in economically underdeveloped regions. In regions with better economic development and more active markets, ALL policy can more effectively reduce ACE by reducing transaction costs and raising the threshold for farmers’ exit. However, in areas with poor economic performance, the mechanism of ALL policy may be hindered due to weak contract spirit and higher market uncertainty, so the impact on ACE is not significant.
Columns (5) and (6) of Table 7 provide further analysis of the impact of ALL policy in regions with different fertilizer input intensities. In areas with high fertilizer input, the impact of ALL policy on ACE was −0.351, and this passed the significance test of 5%. However, in areas with low intensity of chemical fertilizer input, this effect did not pass the 10% significance test. This result may be related to the distortion of the input structure of agricultural factors and the low level of green production efficiency in high-intensity regions [58]. In areas with low intensity of chemical fertilizer use, the average efficiency of farmers is higher, the structure of agricultural factors is more reasonable, and the role of ALL policy in improving efficiency is limited, so the ability to achieve ACER is weakened.
Columns (7) and (8) of Table 7 explore the impact of ALL policy in areas with weak and advantageous agricultural areas. In the disadvantaged agricultural areas, the impact of ALL policy on agricultural carbon emissions was −0.155, and this passed the significance test of 5%. However, in the agricultural advantageous areas, this effect did not pass the 10% significance test. Agricultural production facilities in the agricultural advantage areas are more complete, the factor utilization degree is higher, the agricultural green production status is better, and the ACE is lower [59,60], so the ALL policy has a limited effect. Conversely, resources are underutilized in agrarianly disadvantaged areas [61,62]; the ALL policy expands the scope of land management of advantageous agricultural operators through the transformation of operators, improves the level of land management, and finally realizes ACER.
The impact of ALL policy on ACE shows obvious heterogeneity in different regions, which is affected by the level of economic development, fertilizer input intensity, and agricultural development. These findings provide important insights into the mechanism of ALL policy in different contexts and provide targeted implementation suggestions for policymakers.

5.3. Discussion with Relevant Research

Scholars have performed a series of analyses on land tenure, ACE, and environmental policy. On this basis, this paper takes the reduction in transaction costs brought about by the ALL policy as the research object and conducts a theoretical and empirical analysis.
ALL policy relationship with ACE. Scholars have extensively studied the impact of ALL on ACE, but they often look at the perspective of farmer behavior and ignore the impact at the policy level. This paper emphasizes that the core of ALL policy is to improve the normative and legal guarantee of ALL activities, which directly promotes the reduction in transaction costs. Although the role of ALL policy in agricultural finance [36] and farmland abandonment [37] has been noted in previous studies, there is a lack of research on the ACER effect of ALL policy in the context of global warming. The existing literature shows that in the industrial and urban sectors, the reduction in transaction costs can effectively promote carbon emission reduction [39]. This study not only expands the research perspective of ALL and ACE but also expands the study of the effect of transaction cost reduction on ACER from the industrial sector to the agricultural sector.
Application of the Melitz [40] model was performed in the field of agriculture. Based on the heterogeneous efficiency model proposed by Melitz [40] in 2001, most scholars have analyzed the entry and exit decisions of enterprises and the improvement in industry efficiency and have achieved fruitful results. In this study, farmers are regarded as the smallest agricultural enterprises, which breaks through the limitation of only analyzing joint-stock enterprises in the past. Based on the research of Song [32], Yu [33], Yasmeen [34], and Chari [35], this study combines Melitz [40]’s heterogeneous efficiency model and the impact of agricultural profits on farmers’ entry (exit) decisions with ACE for the first time, extends Melitz [40] model to the field of farmers and agricultural production, and links the impact of heterogeneous efficiency with ACE, providing a strong theoretical analysis framework for related research.
Impact of non-agricultural environmental policies on ACER. Some studies have focused on the impact of agricultural environmental policies on ACER, but some scholars have found that other agricultural policies can also lead to ACER. For example, the policy of establishing major grain-producing areas [3] and the policy of building high-standard fields [13] have contributed to the achievement of ACER. This paper not only broadens the scope of ALL policy research but also enriches the research on the positive impact of non-agricultural environmental policies on ACER.

6. Conclusions

Starting from the perspective of heterogeneous production efficiency, this paper first conducts a theoretical analysis of the impact of ALL policy and then establishes an asymptotic DID model to estimate the effect of ALL policy on the impact of ACE by using the provincial panel data of China from 2005 to 2020.
The main findings of this paper are as follows: First, the benchmark regression results show that the ALL policy significantly contributes to ACER. Following a series of robustness analyses, the fundamental conclusion that the ALL policy attains ACER remains valid. Conversely, in areas where agriculture is impeded, the complete utilization of agricultural resources is unfeasible [61,62]. Second, the mechanism analysis shows that the ALL policy achieves ACER by increasing the critical value of the minimum efficiency of farmers’ exit from land operation and reducing the proportion of agricultural employees. Third, ALL contributes significantly to the achievement of ACER in both the North and the South of China. In regions with advanced economic development, high intensity of fertilizer application, and agricultural underdevelopment, the ALL policy has more effectively promoted ACER.
The following policy implications are obtained from this study: with the implementation of policies such as “separation of powers”, farmers’ land rights and interests are more stable. To further enhance the vitality of the ALL market, it is more necessary to start by improving the degree of standardization of the ALL market and strengthening the legal guarantee for ALL. Establish an ALL information platform, strengthen the supervision of ALL, optimize the resolution mechanism of ALL disputes, and establish a white list system to reduce the risk of ALL and effectively enhance the market’s confidence and expectation of long-term and stable ALL.
This study was validated at the provincial level, but there were some limitations. The heterogeneity analysis indicated that the variability of the natural environment minimally affected the ACER effect of ALL, whereas the technical disparities in agricultural production significantly influenced this effect. There were significant differences in agricultural scale, skill level, financial status, digitalization, and mechanization of individual farmers that led to a heterogeneous production efficiency, which was difficult to observe at the macro level. Second, farmers’ productivity may change as a result of leased land. For example, the increase in scale may bring economies of scale, increase productivity, or exceed the farmer’s capacity and lead to a decrease in efficiency, which is also difficult to observe at the macro level. While aggregating the data can reflect the overall trends, it may mask important changes at the individual farmer level. In terms of mechanism, although the research of Wang [41] and Yang [42] provides a correlation between the reduction in personnel in the agricultural industry and the change in microefficiency, it is still difficult for provincial data to measure the changes in real efficiency. Therefore, future research can use microfarmer surveys to focus on the specific changes in farmers’ business behavior after leasing land, so as to verify and deepen the conclusions of this study.

Author Contributions

Conceptualization, design, data collection, and writing—original draft, S.W.; methodology and software, S.W. and Y.F.; writing—review and editing, Y.F., B.Z. and S.W.; supervision, S.W. and F.C. All authors have read and agreed to the published version of the manuscript.

Funding

This research received no external funding.

Data Availability Statement

Dataset available on request from the authors.

Conflicts of Interest

The authors declare no conflicts of interest.

References

  1. Chaudhari, U.; Bhadoriya, A.; Jani, M.Y.; Sarkar, B. A generalized payment policy for deteriorating items when demand depends on price, stock, and advertisement under carbon tax regulations. Math. Comput. Simul. 2023, 207, 556–574. [Google Scholar] [CrossRef]
  2. Bhadoriya, A.; Jani, M.Y.; Chaudhari, U. Combined Effect of Carbon Emission, Exchange Scheme, Trade Credit, and Advertisement Efforts in a Buyer’s Inventory Decision. Process Integr. Optim. Sustain. 2022, 6, 1043–1061. [Google Scholar] [CrossRef]
  3. Wang, S.; Jin, M.; Liu, L.; Cao, F. Impacts of China’s Main Grain-Producing Areas on Agricultural Carbon Emissions: A Sustainable Development Perspective. Sustainability 2024, 16, 4607. [Google Scholar] [CrossRef]
  4. Li, L.; Khan, U.S.; Guo, C.; Huang, Y.; Xia, X. Non-agricultural labor transfer, factor allocation and farmland yield: Evidence from the part-time peasants in Loess Plateau region of Northwest China. Land Use Policy 2022, 120, 106289. [Google Scholar] [CrossRef]
  5. Du, Y.; Liu, H.; Huang, H.; Li, X. The carbon emission reduction effect of agricultural policy-Evidence from China. J. Clean. Prod. 2023, 406, 137005. [Google Scholar] [CrossRef]
  6. Jin, M.; Feng, Y.; Wang, S.; Chen, N.; Cao, F. Can the development of the rural digital economy reduce agricultural carbon emissions? A spatiotemporal empirical study based on China’s provinces. Sci. Total Environ. 2024, 939, 173437. [Google Scholar] [CrossRef]
  7. Yang, H.; Wang, X.; Bin, P. Agriculture carbon-emission reduction and changing factors behind agricultural eco-efficiency growth in China. J. Clean. Prod. 2022, 334, 130193. [Google Scholar] [CrossRef]
  8. Cui, X.; Cai, T.; Deng, W.; Zheng, R.; Jiang, Y.; Bao, H. Indicators for evaluating high-quality agricultural development: Empirical study from Yangtze River Economic Belt, China. Soc. Indic. Res. 2022, 164, 1101–1127. [Google Scholar] [CrossRef]
  9. Xiong, L.; Shah, F.; Wu, W. Environmental and socio-economic performance of intensive farming systems with varying agricultural resource for maize production. Sci. Total Environ. 2022, 850, 158030. [Google Scholar] [CrossRef]
  10. Ma, W.; Zhou, X.; Boansi, D.; Seyram, G.; Horlu, A.; Owusu, V. Adoption and intensity of agricultural mechanization and their impact on non-farm employment of rural women. World Dev. 2024, 173, 106434. [Google Scholar] [CrossRef]
  11. Lu, H.; Chen, Y.; Luo, J. Development of green and low-carbon agriculture through grain production agglomeration and agricultural environmental efficiency improvement in China. J. Clean. Prod. 2024, 442, 141128. [Google Scholar] [CrossRef]
  12. Hu, Y.; Li, B.; Zhang, Z.; Wang, J. Farm size and agricultural technology progress: Evidence from China. J. Rural Stud. 2022, 93, 417–429. [Google Scholar] [CrossRef]
  13. Deng, O.; Ran, J.; Huang, S.; Duan, J.; Reis, S.; Zhang, J.; Zhu, Y.; Xu, L.; Gu, B. Managing fragmented croplands for environmental and economic benefits in China. Nat. Food 2024, 5, 230–240. [Google Scholar] [CrossRef] [PubMed]
  14. Li, X.; Qiao, S.; Jiang, Y. The causal mechanism of farmers’ chemical fertilizer reduction: An empirical perspective from farmland transfer-in and digital extension. Front. Sustain. Food Syst. 2023, 7, 1231574. [Google Scholar] [CrossRef]
  15. Fu, J.; Ding, R.; Zhu, Y.; Du, L.; Shen, S.; Peng, L.; Zou, J.; Hong, Y.; Liang, J.; Wang, K.; et al. Analysis of the spatial-temporal evolution of Green and low carbon utilization efficiency of agricultural land in China and its influencing factors under the goal of carbon neutralization. Environ. Res. 2023, 237, 116881. [Google Scholar] [CrossRef]
  16. Zou, J.; Shen, L.; Wang, F.; Tang, H.; Zhou, Z. Dual carbon goal and agriculture in China: Exploring key factors influencing farmers’ behavior in adopting low carbon technologies. J. Integr. Agric. 2024, 23, 3215–3233. [Google Scholar] [CrossRef]
  17. Wu, J.; Wen, X.; Qi, X.; Fang, S.; Xu, C. More Land, Less Pollution? How Land Transfer Affects Fertilizer Application. Int. J. Environ. 2021, 18, 11268. [Google Scholar] [CrossRef]
  18. Li, B.; Zeng, Q. The effect of land right stability on the application of fertilizer reduction technologies-evidence from large-scale farmers in China. Sustainability 2022, 14, 8059. [Google Scholar] [CrossRef]
  19. Gao, L.; Sun, D.; Huang, J. Impact of land tenure policy on agricultural investments in China: Evidence from a panel data study. China Econ. Rev. 2017, 45, 244–252. [Google Scholar] [CrossRef]
  20. Ntakirutimana, L.; Li, F.; Huang, X.; Wang, S.; Yin, C. Green Manure Planting Incentive Measures of Local Authorities and Farmers’ Perceptions of the Utilization of Rotation Fallow for Sustainable Agriculture in Guangxi, China. Sustainability 2019, 11, 2723. [Google Scholar] [CrossRef]
  21. Lu, H.; Zhang, P.; Hu, H.; Xie, H.; Yu, Z.; Chen, S. Effect of the grain-growing purpose and farm size on the ability of stable land property rights to encourage farmers to apply organic fertilizers. J. Environ. Manag. 2019, 251, 109621. [Google Scholar] [CrossRef] [PubMed]
  22. Li, F.; Ren, J.; Wimmer, S.; Yin, C.; Li, Z.; Xu, C. Incentive mechanism for promoting farmers to plant green manure in China. J. Clean. Prod. 2020, 267, 122197. [Google Scholar] [CrossRef]
  23. Jia, R.; Lu, Q. Land transfer, collective action and the adoption of soil and water conservation measures in the Loess Plateau of China. Nat. Hazards 2020, 102, 1279–1304. [Google Scholar] [CrossRef]
  24. Zhou, L.; Lu, H.; Wu, B. Identifying the effects of the stability of farmland transfer management rights on the use of organic fertilizer with different farmland scales and crop types. Front. Environ. Sci. 2020, 10, 1006405. [Google Scholar] [CrossRef]
  25. Zhang, Q.; Tian, J.; Zheng, J.; Abdullahi, N.M.; Huo, X. How Does Land Tenure Security Affect Farm Succession? Evidence from Apple Growers in China. Land 2022, 11, 1036. [Google Scholar] [CrossRef]
  26. Tang, M.; Hu, F. How Does Land Urbanization Promote CO2 Emissions Reduction? Evidence From Chinese Prefectural-Level Cities. Front. Environ. Sci. 2021, 9, 766839. [Google Scholar] [CrossRef]
  27. Adamopoulos, T.; Brandt, L.; Leight, J.; Restuccia, D. Misallocation, selection, and productivity: A quantitative eanalysis with panel data from China. Econometrica 2022, 90, 1261–1282. [Google Scholar] [CrossRef]
  28. Cheng, C.; Zhang, F.; Shi, J.; Kung, H. What is the relationship between land use and surface water quality? A review and prospects from remote sensing perspective. Environ. Sci. Pollut. 2022, 29, 56887–56907. [Google Scholar] [CrossRef]
  29. Guo, L.; Song, Y.; Tang, M.; Tang, J.; Dogbe, B.; Su, M.; Li, H. Assessing the Relationship among Land Transfer, Fertilizer Usage, and PM2.5 Pollution: Evidence from Rural China. Int. J. Environ. 2022, 19, 8387. [Google Scholar] [CrossRef]
  30. Qi, Y.; Chen, X.; Zhang, J.; Li, Y.; Zhu, D. How Do Rising Farmland Costs Affect Fertilizer Use Efficiency? Evidence from Gansu and Jiangsu, China. Land 2022, 11, 1730. [Google Scholar] [CrossRef]
  31. Tesfaye, K.; Takele, R.; Sapkota, T.B.; Chhetric, A.K.; Solomon, D.; Stirling, C.; Albanito, F. Model comparison and quantification of nitrous oxide emission and mitigation potential from maize and wheat fields at a global scale. Sci. Total Environ. 2021, 782, 146696. [Google Scholar] [CrossRef] [PubMed]
  32. Song, M.; Wu, Q.; Zhu, H. Could the Aging of the Rural Population Boost Green Agricultural Total Factor Productivity? Evidence from China. Sustainability 2024, 16, 6117. [Google Scholar] [CrossRef]
  33. Yu, Y.; Hu, Y.; Gu, B.; Reis, S.; Yang, L. Reforming smallholder farms to mitigate agricultural pollution. Environ. Sci. Pollut. Res. 2022, 29, 13869–13880. [Google Scholar] [CrossRef] [PubMed]
  34. Yasmeen, R.; Tao, R.; Shah, W.U.H. The nexuses between carbon emissions, agriculture production efficiency, research and development, and government effectiveness: Evidence from major agriculture-producing countries. Environ. Sci. Pollut. Res. 2022, 29, 52133–52146. [Google Scholar] [CrossRef]
  35. Chari, A.; Liu, M.E.; Wang, S.; Wang, Y. Property rights, land misallocation, and agricultural efficiency in China. Rev. Econ. Stud. 2021, 88, 1831–1862. [Google Scholar] [CrossRef]
  36. Jiang, M.; Paudel, K.P.; Mi, Y.; Li, J. Farmland transfer and rural financial structure: Evidence from China. Int. Rev. Financ. Anal. 2023, 90, 102897. [Google Scholar] [CrossRef]
  37. Song, H.; Li, X.; Xin, L.; Wang, X. Do farmland transfers mitigate farmland abandonment? —A case study of China’s mountainous areas. Habitat Int. 2024, 146, 103023. [Google Scholar] [CrossRef]
  38. Huo, C.; Chen, L. The impact of land transfer policy on sustainable agricultural development in China. Sci. Rep. 2024, 14, 7064. [Google Scholar] [CrossRef]
  39. Hu, Y.; Ren, S.; Wang, Y.; Chen, X. Can carbon emission trading scheme achieve energy conservation and emission reduction? Evidence from the industrial sector in China. Energy Econ. 2020, 85, 104590. [Google Scholar] [CrossRef]
  40. Melitz, M.J. The Impact of Trade on Intra-Industry Reallocations and Aggregate Industry Productivity. Econometrica 2003, 6, 1695–1725. [Google Scholar] [CrossRef]
  41. Wang, J.; Cramer, G.L.; Wailes, E.J. Production efficiency of Chinese agriculture: Evidence from rural household survey data. Agric. Econ. 1996, 15, 17–28. [Google Scholar]
  42. Yang, J.; Wang, H.; Jin, S.; Chen, K.; Riedinger, J.; Peng, C. Migration, local off-farm employment, and agricultural production efficiency: Evidence from China. J. Prod. Anal. 2016, 45, 247–259. [Google Scholar] [CrossRef]
  43. Lewis, W.A. Economic Development with unlimited supply of labor. Manch. Sch. 1954, 22, 139–191. [Google Scholar] [CrossRef]
  44. Fortson, J.G. HIV/AIDS and fertility. Am. Econ. J. Appl. Econ. 2009, 1, 170–194. [Google Scholar] [CrossRef]
  45. Lal, R. Carbon emission from farm operations. Environ. Int. 2004, 30, 981–990. [Google Scholar] [CrossRef]
  46. Tian, Y.; Lautz, S.; Wallis, A.O.; Lambiotte, R. Extracting complements and substitutes from sales data: A network perspective. EPJ Data Sci. 2021, 10, 45. [Google Scholar] [CrossRef]
  47. Liu, Y.; Zou, L.; Wang, Y. Spatial-temporal characteristics and influencing factors of agricultural eco-efficiency in China in recent 40 years. Land Use Policy 2020, 97, 10479. [Google Scholar] [CrossRef]
  48. Farooq, U.; Gang, F.; Guan, Z.; Rauf, A.; Chandio, A.A.; Ahsan, F. Exploring the long-run relationship between financial inclusion and agricultural growth: Evidence from Pakistan. Int. J. Emerg. Mark. 2023, 18, 1677–1696. [Google Scholar] [CrossRef]
  49. Lu, F.; Meng, J.; Cheng, B. How does improving agricultural mechanization affect the green development of agriculture? Evidence from China. J. Clean. Prod. 2024, 472, 143298. [Google Scholar] [CrossRef]
  50. Liu, Y.; Sun, D.; Wang, H.; Wang, X.; Yu, G.; Zhao, X. An evaluation of China’s agricultural green production: 1978–2017. J. Clean. Prod. 2020, 243, 118483. [Google Scholar] [CrossRef]
  51. Yang, G.; Li, S.; Wang, H.; Wang, L. Study on agricultural cultivation development layout based on the matching characteristic of water and land resources in North China Plain. Agric. Water Manag. 2022, 259, 107272. [Google Scholar] [CrossRef]
  52. Chao, P.; Ma, B.; Zhang, C. Poverty alleviation through e-commerce: Village involvement and demonstration policies in rural China. J. Integr. Agric. 2021, 20, 998–1011. [Google Scholar]
  53. Nunn, N.; Qian, N. The potato’s contribution to population and urbanization: Evidence from a historical experiment. Q. J. Econ. 2011, 126, 593–650. [Google Scholar] [CrossRef]
  54. Wang, F.; Ge, X. Can low-carbon transition impact employment empirical evidence from low-carbon city pilot policy. China Ind. Econ. 2022, 5, 81–99. (In Chinese) [Google Scholar]
  55. Jani, M.Y.; Chaudhari, U.; Sarkar, B. How does an industry control a decision support system for a long time? RAIRO-Oper. Res. 2021, 55, 3141–3152. [Google Scholar] [CrossRef]
  56. Jiang, T. Mediating effects and moderating effeets in causal inference. China Ind. Econ. 2022, 5, 100–120. (In Chinese) [Google Scholar]
  57. Sun, J.; Zhai, N.; Miao, J.; Mu, H.; Li, W. How do heterogeneous environmental regulations affect the sustainable development of marine green economy? Empirical evidence from China’s coastal areas. Ocean Coast. Manag. 2023, 232, 106448. [Google Scholar] [CrossRef]
  58. Mohammadi, A.; Rafiee, S.; Jafari, A.; Keyhani, A.; Mousavi-Avval, S.H.; Nonhebel, S. Energy use efficiency and greenhouse gas emissions of farming systems in north Iran. Renew. Sustain. Energy Rev. 2014, 30, 724–773. [Google Scholar] [CrossRef]
  59. Wang, Y.; Zhu, Y.; Zhang, S.; Wang, Y. What could promote farmers to replace chemical fertilizers with organic fertilizers? J. Clean. Prod. 2018, 199, 882–890. [Google Scholar] [CrossRef]
  60. He, P.; Zhang, J.; Li, W. The role of agricultural green production technologies in improving low-carbon efficiency in China: Necessary but not effective. J. Environ. Manag. 2021, 293, 112837. [Google Scholar] [CrossRef]
  61. Xie, H.; Zhang, Y.; Choi, Y. Measuring the Cultivated Land Use Efficiency of the Main Grain-Producing Areas in China under the Constraints of Carbon Emissions and Agricultural Nonpoint Source Pollution. Sustainability 2018, 10, 1932. [Google Scholar] [CrossRef]
  62. Ertunç, E. The Effect of Land Consolidation Projects on Carbon Footprint. Land 2023, 12, 507. [Google Scholar] [CrossRef]
Figure 1. Equilibrium of ALL and the impact of ALL policy.
Land 13 02192 g001
Figure 2. Framework showing how ALL policy implementation promotes ACER.
Land 13 02192 g002
Figure 3. Parallel trend tests and trends in the impact of policy dynamics. Note: (i) Vertical lines indicate 90% confidence intervals for the parameters. (ii) A period before 2010, the year of policy implementation, is used as the base group, so there is no −1 period (i.e., 2009) on the horizontal axis.
Land 13 02192 g003
Figure 4. Distribution of p-statistic values for 1000 random simulations. Note: (i) The right vertical axis represents the value of the simulated p-statistic, calculated once per point of the simulation. (ii) The horizontal line represents the p-value of the benchmark result at 0.043, and the vertical line represents the benchmark result at −0.091.
Land 13 02192 g004
Table 1. Studies on the effect of ALL on ACE.
ALL Reduce the ACE
Wu [17] and Li [18]ALL reduces the use of chemical fertilizers.
Gao [19], Ntakirutimana [20], Lu [21], Li [22], and Jia [23]ALL increases the use of organic fertilizers.
Zhou [24]After ALL, the scale of land increases, and new agricultural technologies have been adopted at a higher level.
Zhang [25]ALL has improved the efficiency of agricultural mechanization.
Tang [26] and Adamopoulos [27]ALL enabled farmers to better match their field management level with the actual cultivated area.
ALL Increase the ACE
Cheng [28] and Guo [29]For the sake of profit, farmers after ALL apply more fertilizer to increase agricultural yields.
Li [13] and Qi [30]After ALL, intensive farming accelerates soil depletion, forcing landowners to use more fertilizers.
Tesfaye [31]After ALL, to prevent pests and diseases, landowners use more pesticides.
Table 2. Descriptive statistics of the variables.
Variable NameObservationsMeanSDMinMax
ACE48014.9471.02311.89916.404
ALL policy4800.2420.42801
SL4804.1110.4283.0405.625
FA4802.2960.3700.7583.015
DM4800.6000.2530.2111.416
SA4800.5230.0860.3420.746
HA4802.0190.0921.6372.276
RS4800.4310.0960.2070.748
AE4800.5820.1590.1350.988
ACI480−0.1470.265−0.6780.564
Table 3. Benchmark regression results.
Variable NameACE
(1)(2)
ALL policy−0.103 **
(0.050)
−0.091 **
(0.040)
Cons_14.972 ***
(0.012)
14.14 ***
(1.089)
Control variableNOYES
Province fixedYESYES
Time fixedYESYES
Observations480480
R 2 0.9910.993
Note: (i) ***, **, and * denote 1%, 5%, and 10% significance levels, respectively. (ii) Robust standard errors in parentheses. The same description holds for the following tables.
Table 4. Sensitivity test results.
Variable NameACE
(1)(2)(3)(4)(5)(6)
ALL policy−0.095 **
(0.044)
−0.094 **
(0.044)
−0.090 **
(0.041)
−0.089 **
(0.042)
−0.090 **
(0.042)
−0.091 **
(0.040)
SL0.326 **
(0.136)
0.337 **
(0.134)
0.374 ***
(0.135)
0.372 ***
(0.133)
0.372 ***
(0.133)
0.391 ***
(0.130)
FA--0.098
(0.092)
0.102
(0.089)
0.103
(0.089)
0.103
(0.085)
0.086
(0.085)
DM----0.238 *
(0.115)
0.236 *
(0.116)
0.237 *
(0.118)
0.245 **
(0.114)
SA------0.107
(0.355)
0.107
(0.353)
0.036
(0.334)
HA--------0.022
(0.406)
−0.452
(0.401)
RS----------−0.539 **
(0.243)
Cons_13.630 ***
(0.557)
13.360 ***
(0.585)
13.050 ***
(0.578)
13.010 ***
(0.602)
12.960 ***
(1.022)
14.14 ***
(1.089)
Control variableYESYESYESYESYESYES
Province fixedYESYESYESYESYESYES
Time fixedYESYESYESYESYESYES
Observations480480480480480480
R 2 0.9920.9920.9930.9930.9930.993
Table 5. Robustness test results.
Variable NameTruncated 5%Replacing Explanatory VariableAdd L.ACEPSM-DIDExclude Other Policy
(1)(2)(3)(4)(5)
ALL policy−0.0756 *
(0.038)
−0.101 ***
(0.051)
−0.061 ***
(0.005)
−0.188 *
(0.921)
−0.065 **
(0.035)
L.ACE----0.918 ***
(0.016)
----
D2015--------−0.059 *
(0.033)
Cons_15.364 ***
(0.948)
0.908 *
(0.502)
1.093 ***
(0.266)
14.389 ***
(1.049)
14.192 ***
(1.089)
Control variableYESYESYESYESYES
Province fixedYESYESYESYESYES
Time fixedYESYESYESYESYES
Observations432480450426480
R 2 0.9930.9710.9990.9950.994
Table 6. Mechanism test results.
Variable NameAEACE
(1)(2)
ALL policy−0.088 *
(0.051)
--
AE--1.327 ***
(0.159)
Cons_1.055 **
(0.498)
12.720 ***
(0.723)
Control variableYESYES
Province fixedYESYES
Time fixedYESYES
Observations480480
R 2 0.9220.997
Table 7. Results of heterogeneity test.
Variable NameNorth RegionsSouth RegionsLow-Income
Regions
High-Income RegionsLow Intensity of FertilizerHigh Intensity of FertilizerAgriculturally Advantaged RegionsAgriculturally Disadvantaged Regions
(1)(2)(3)(4)(5)(6)(7)(8)
ALL policy−0.288 **
(0.130)
−0.240 ***
(0.076)
−0.009
(0.089)
−0.277 **
(0.104)
0.062
(0.072)
−0.351 **
(0.130)
0.030
(0.029)
−0.155 **
(0.067)
Cons_13.680 **
(1.636)
13.680 ***
(0.664)
15.620 **
(1.076)
14.220 ***
(0.732)
13.850 ***
(0.745)
15.510 ***
(1.545)
16.050 ***
(1.063)
13.210 ***
(1.274)
Control variableYESYESYESYESYESYESYESYES
Province fixedYESYESYESYESYESYESYESYES
Time fixedYESYESYESYESYESYESYESYES
Observations240240352144208272208272
R 2 0.9950.9970.9940.9980.9970.9940.9900.992
Disclaimer/Publisher’s Note: The statements, opinions and data contained in all publications are solely those of the individual author(s) and contributor(s) and not of MDPI and/or the editor(s). MDPI and/or the editor(s) disclaim responsibility for any injury to people or property resulting from any ideas, methods, instructions or products referred to in the content.

