
Waterbirds of Sardinia (Italy): How Space and Time Shape a Threatened Metacommunity During the Critical Summer Period

Abstract
1. Introduction
2. Materials and Methods
2.1. Study Area and Bird Surveys
2.2. Analytical Framework
2.2.1. Metacommunity
2.2.2. Communities
2.2.3. Guilds
2.2.4. Species
3. Results
3.1. Metacommunity
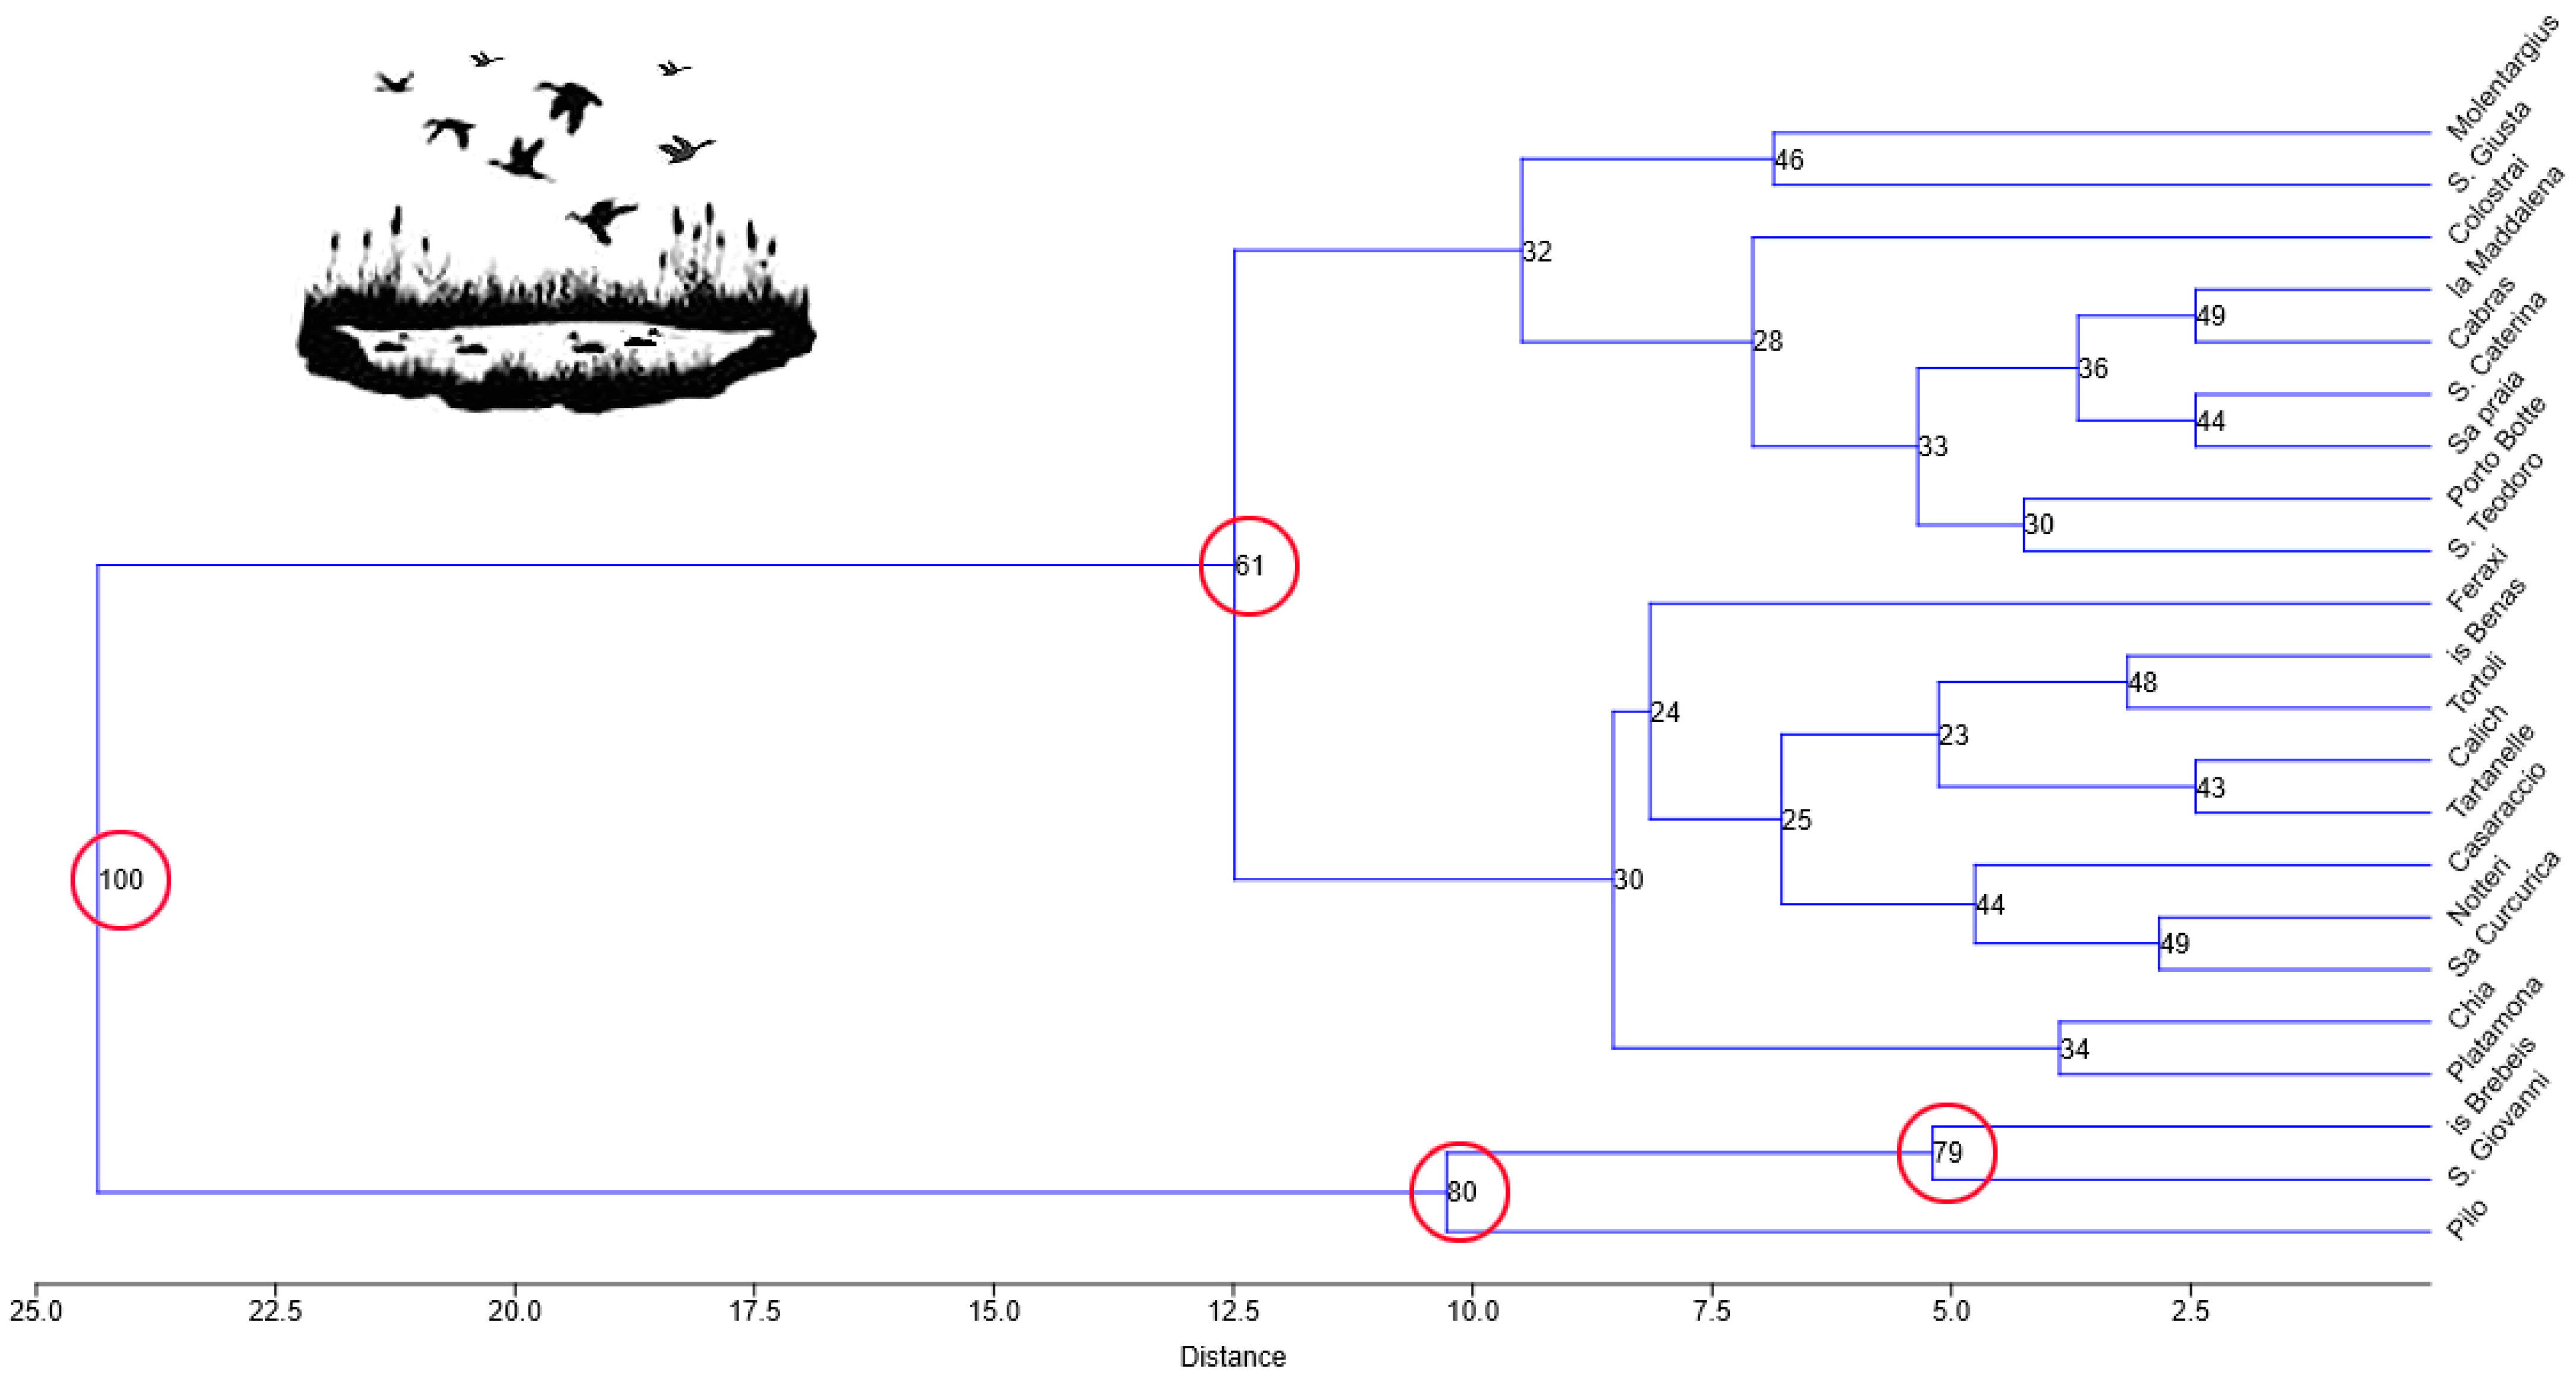
3.2. Communities
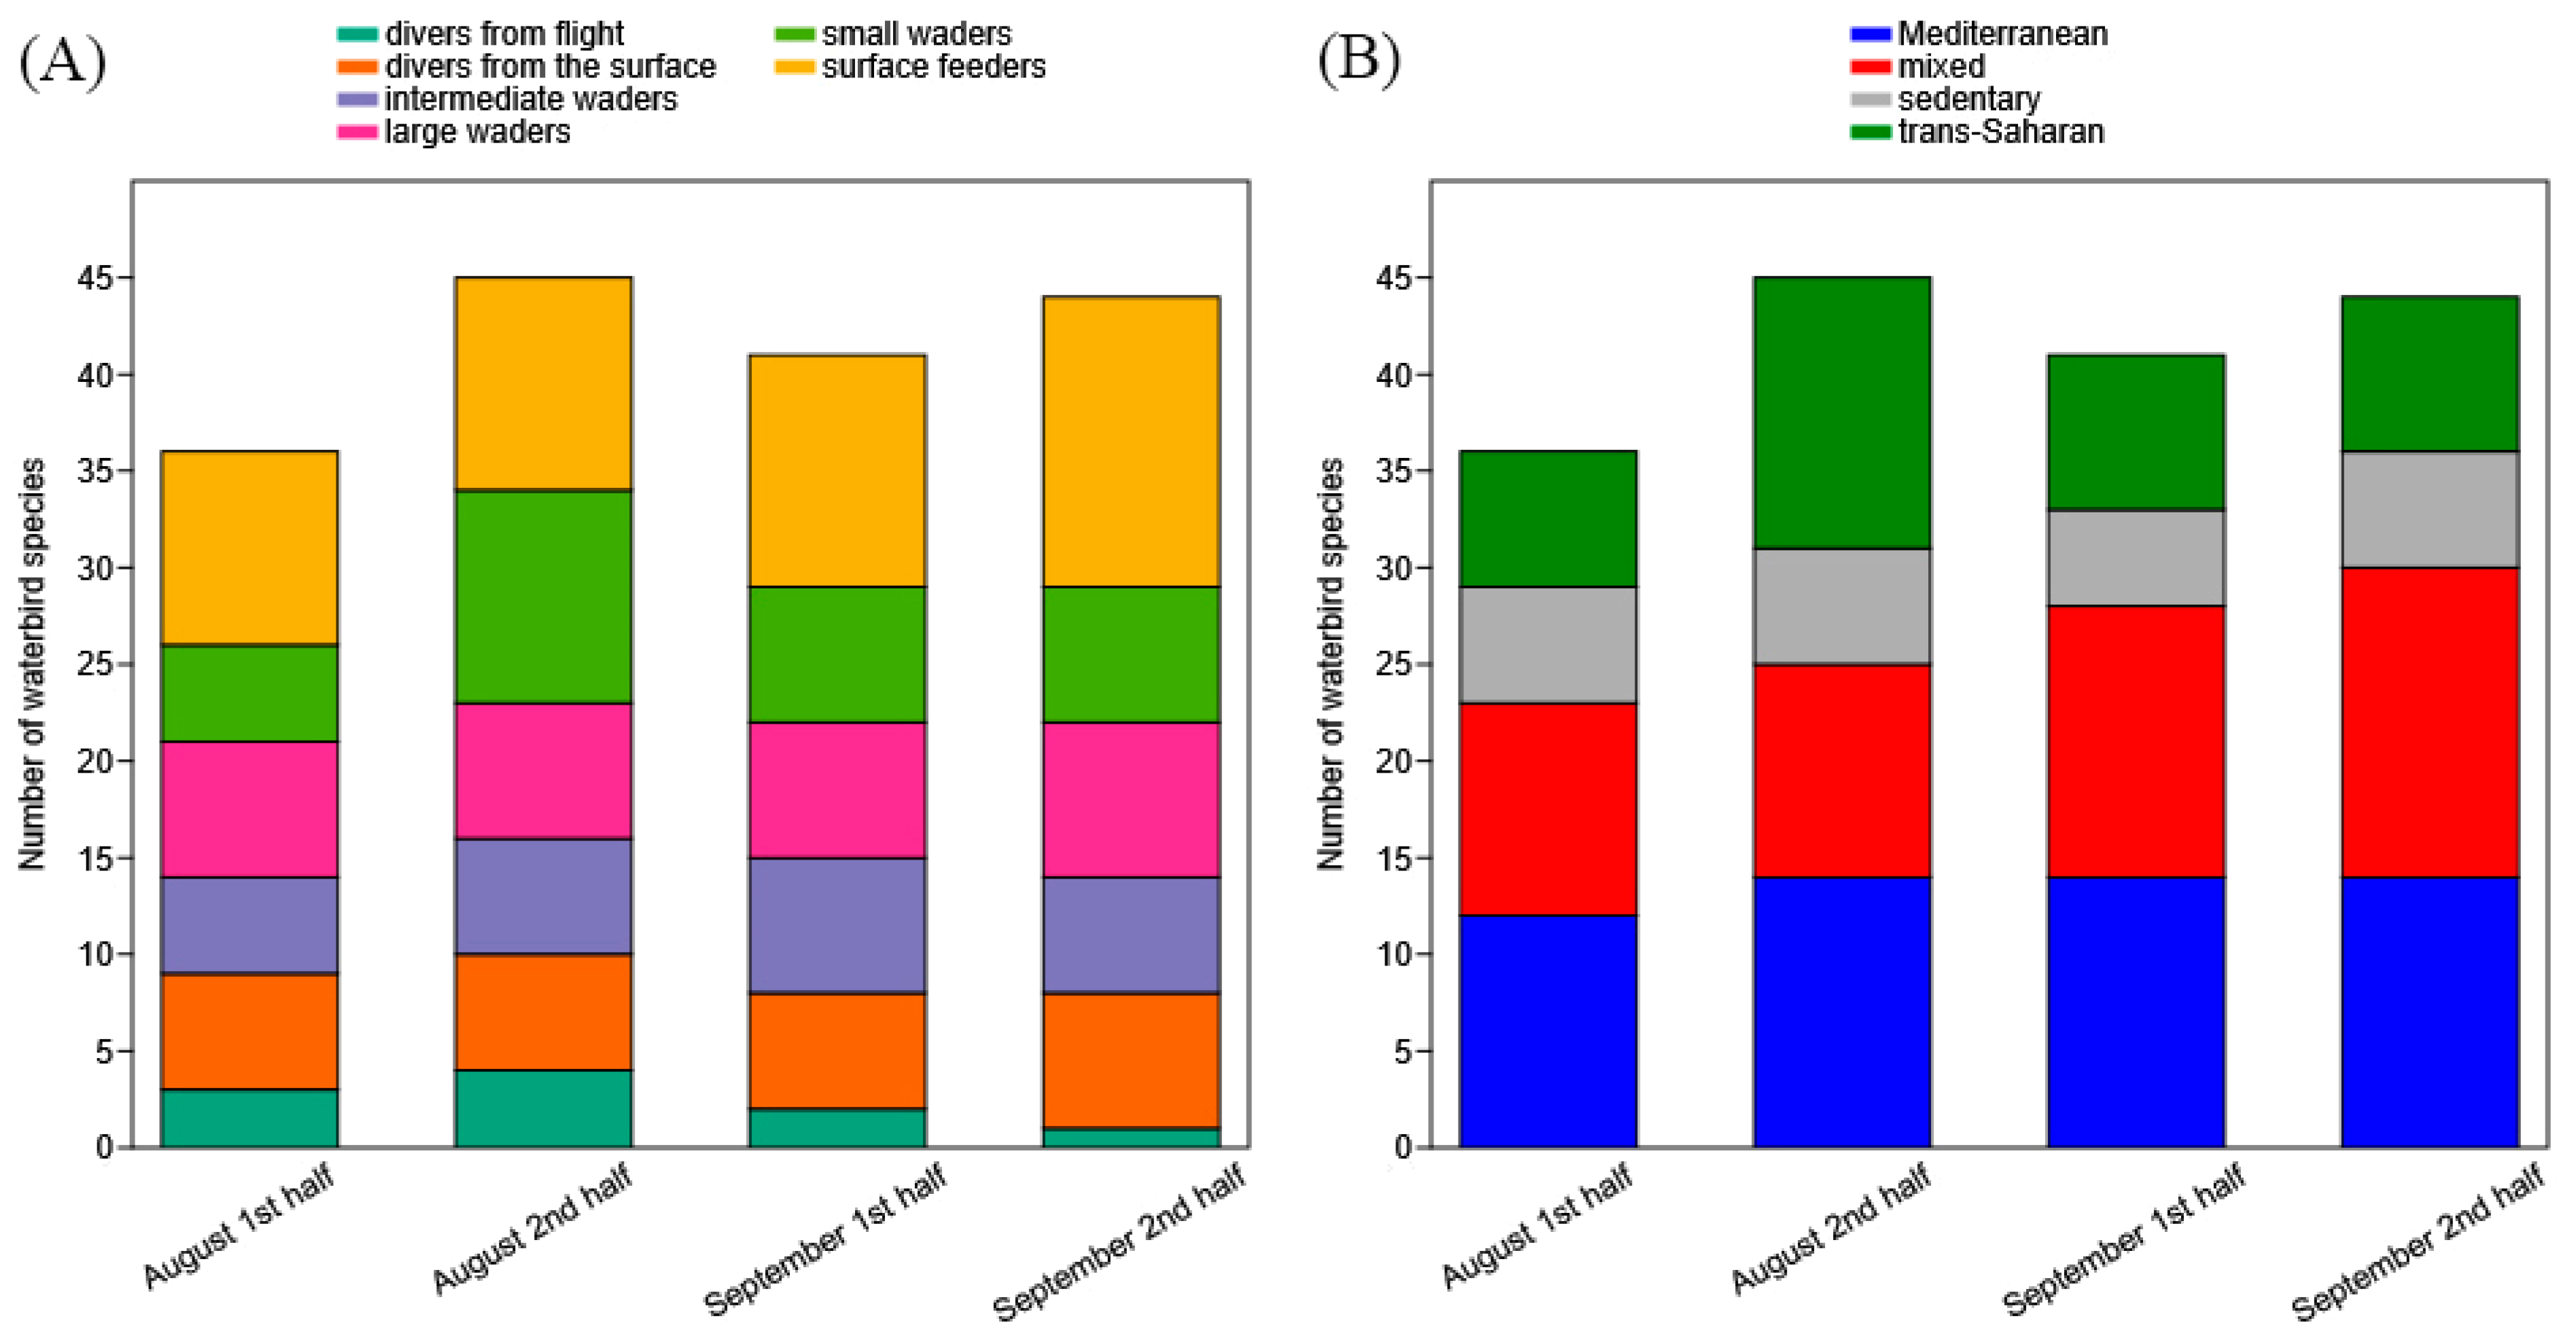
3.3. Guilds
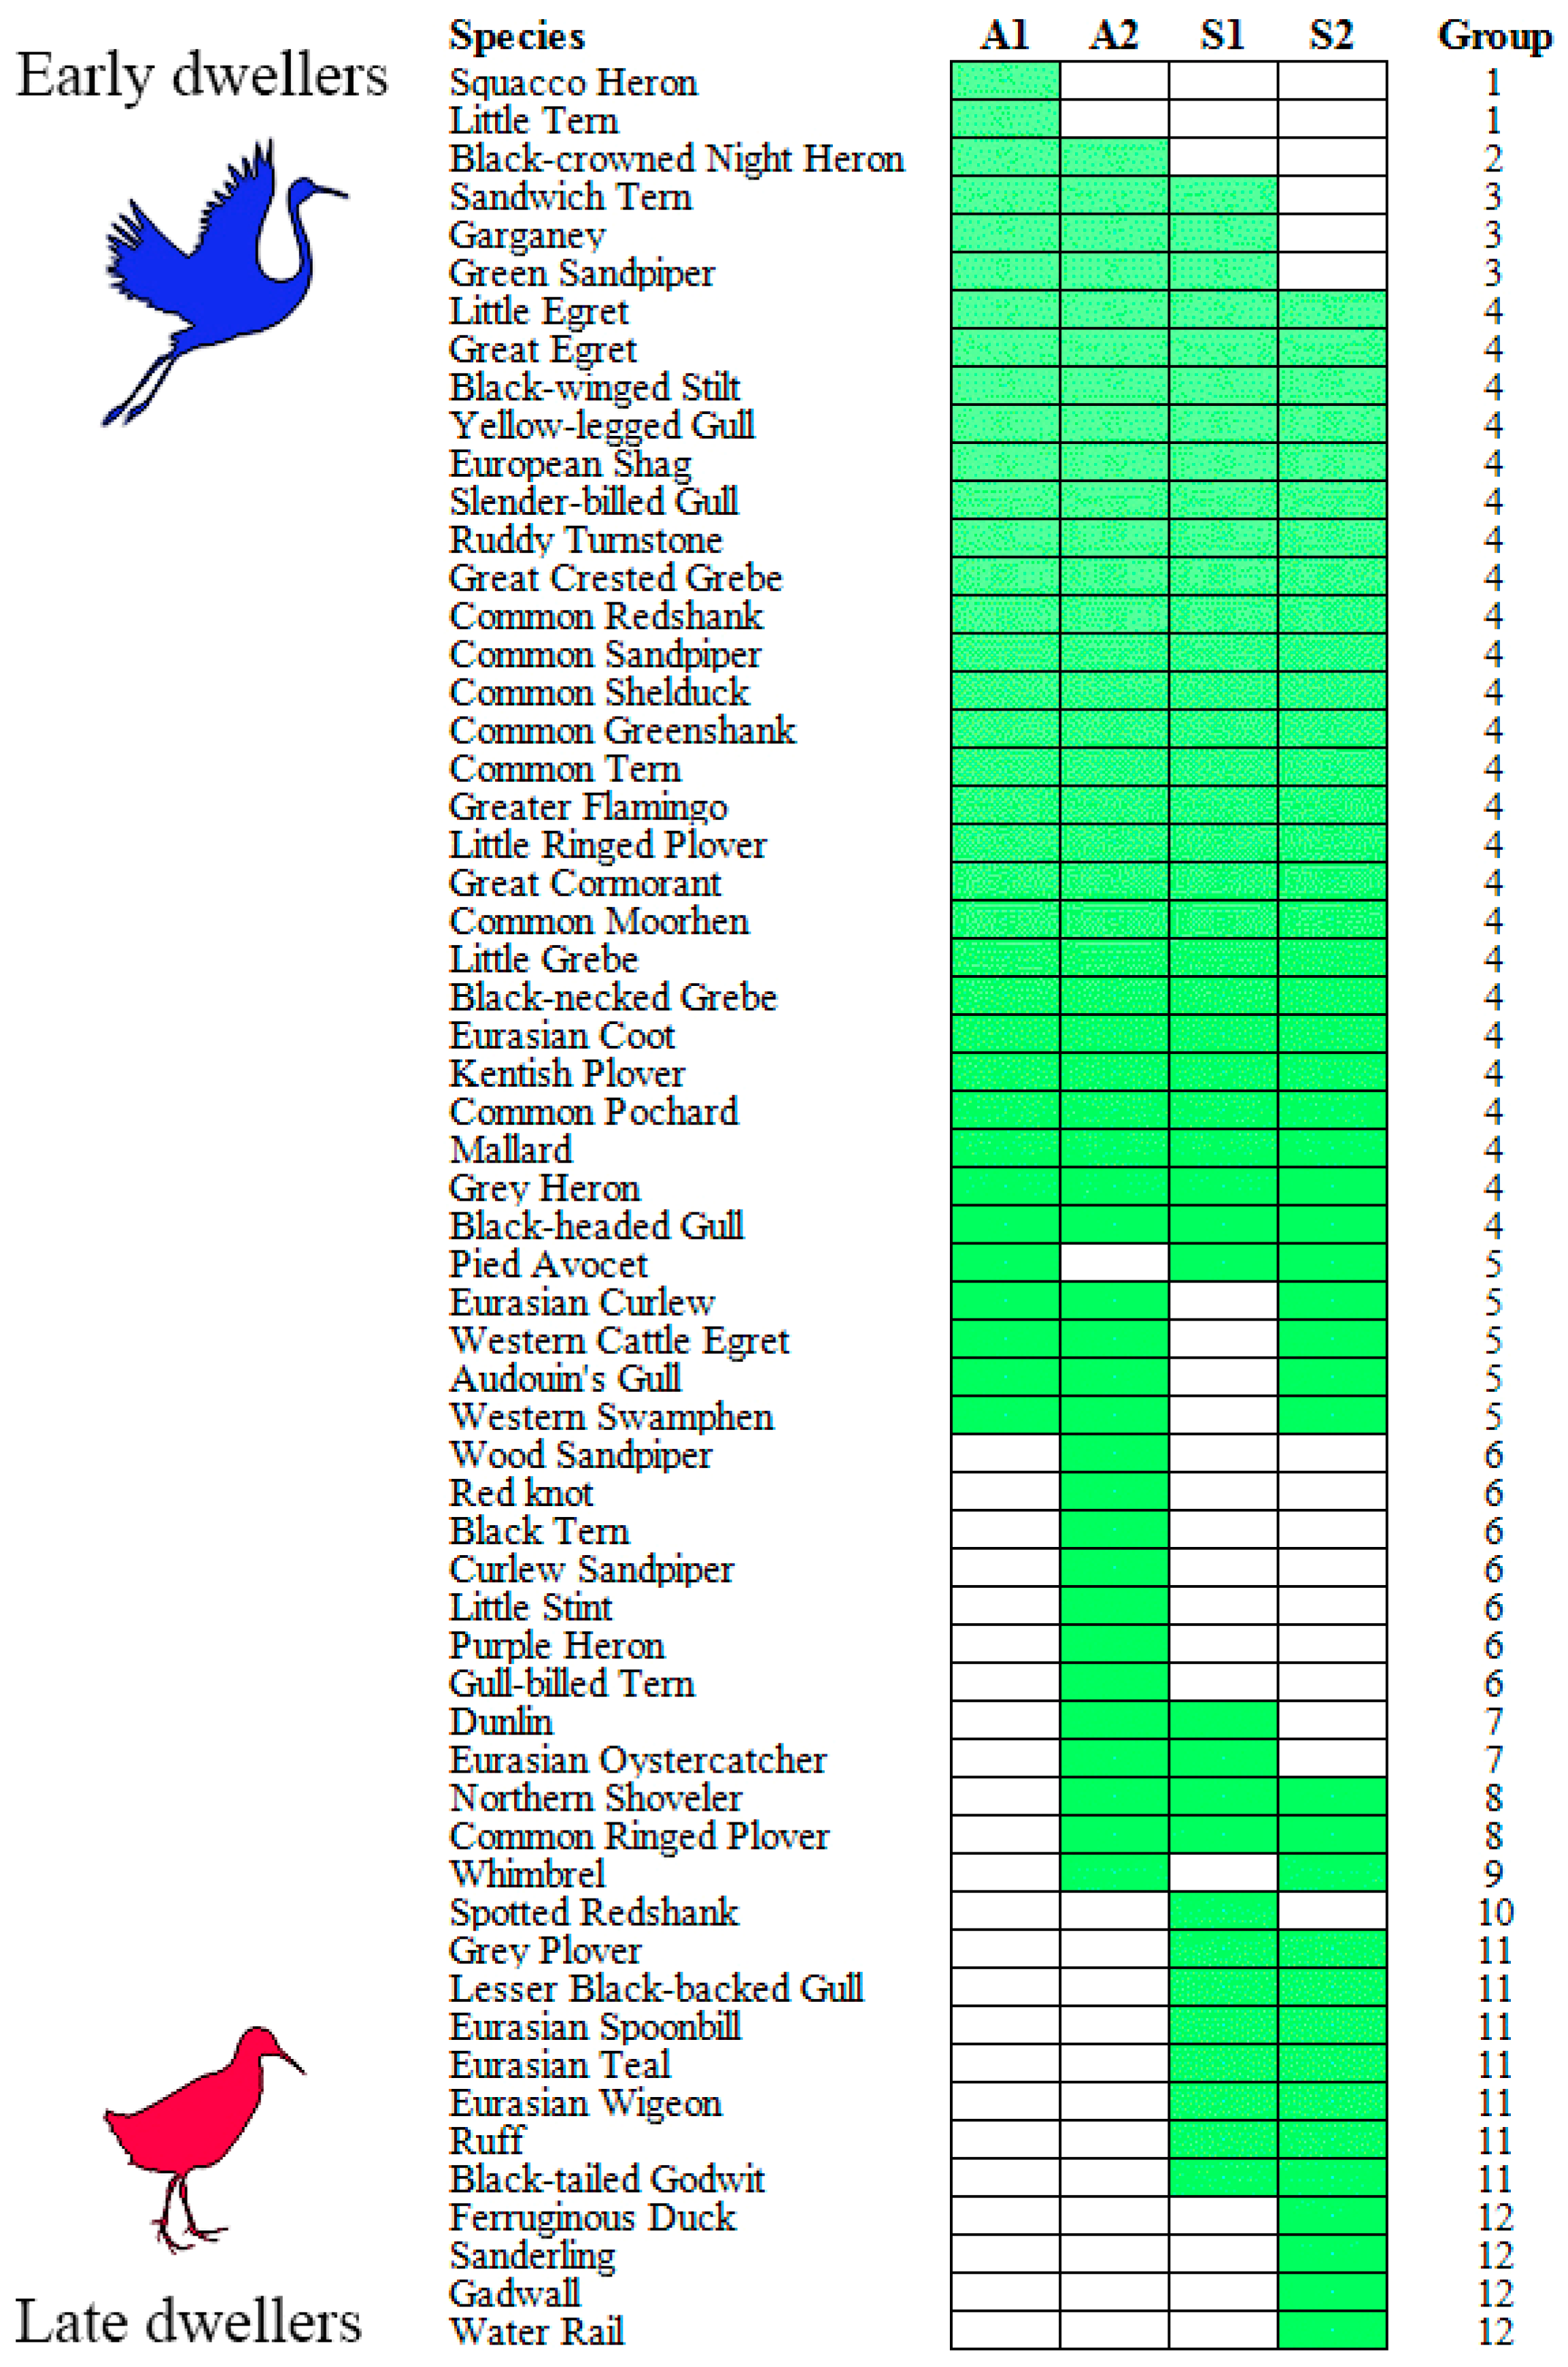
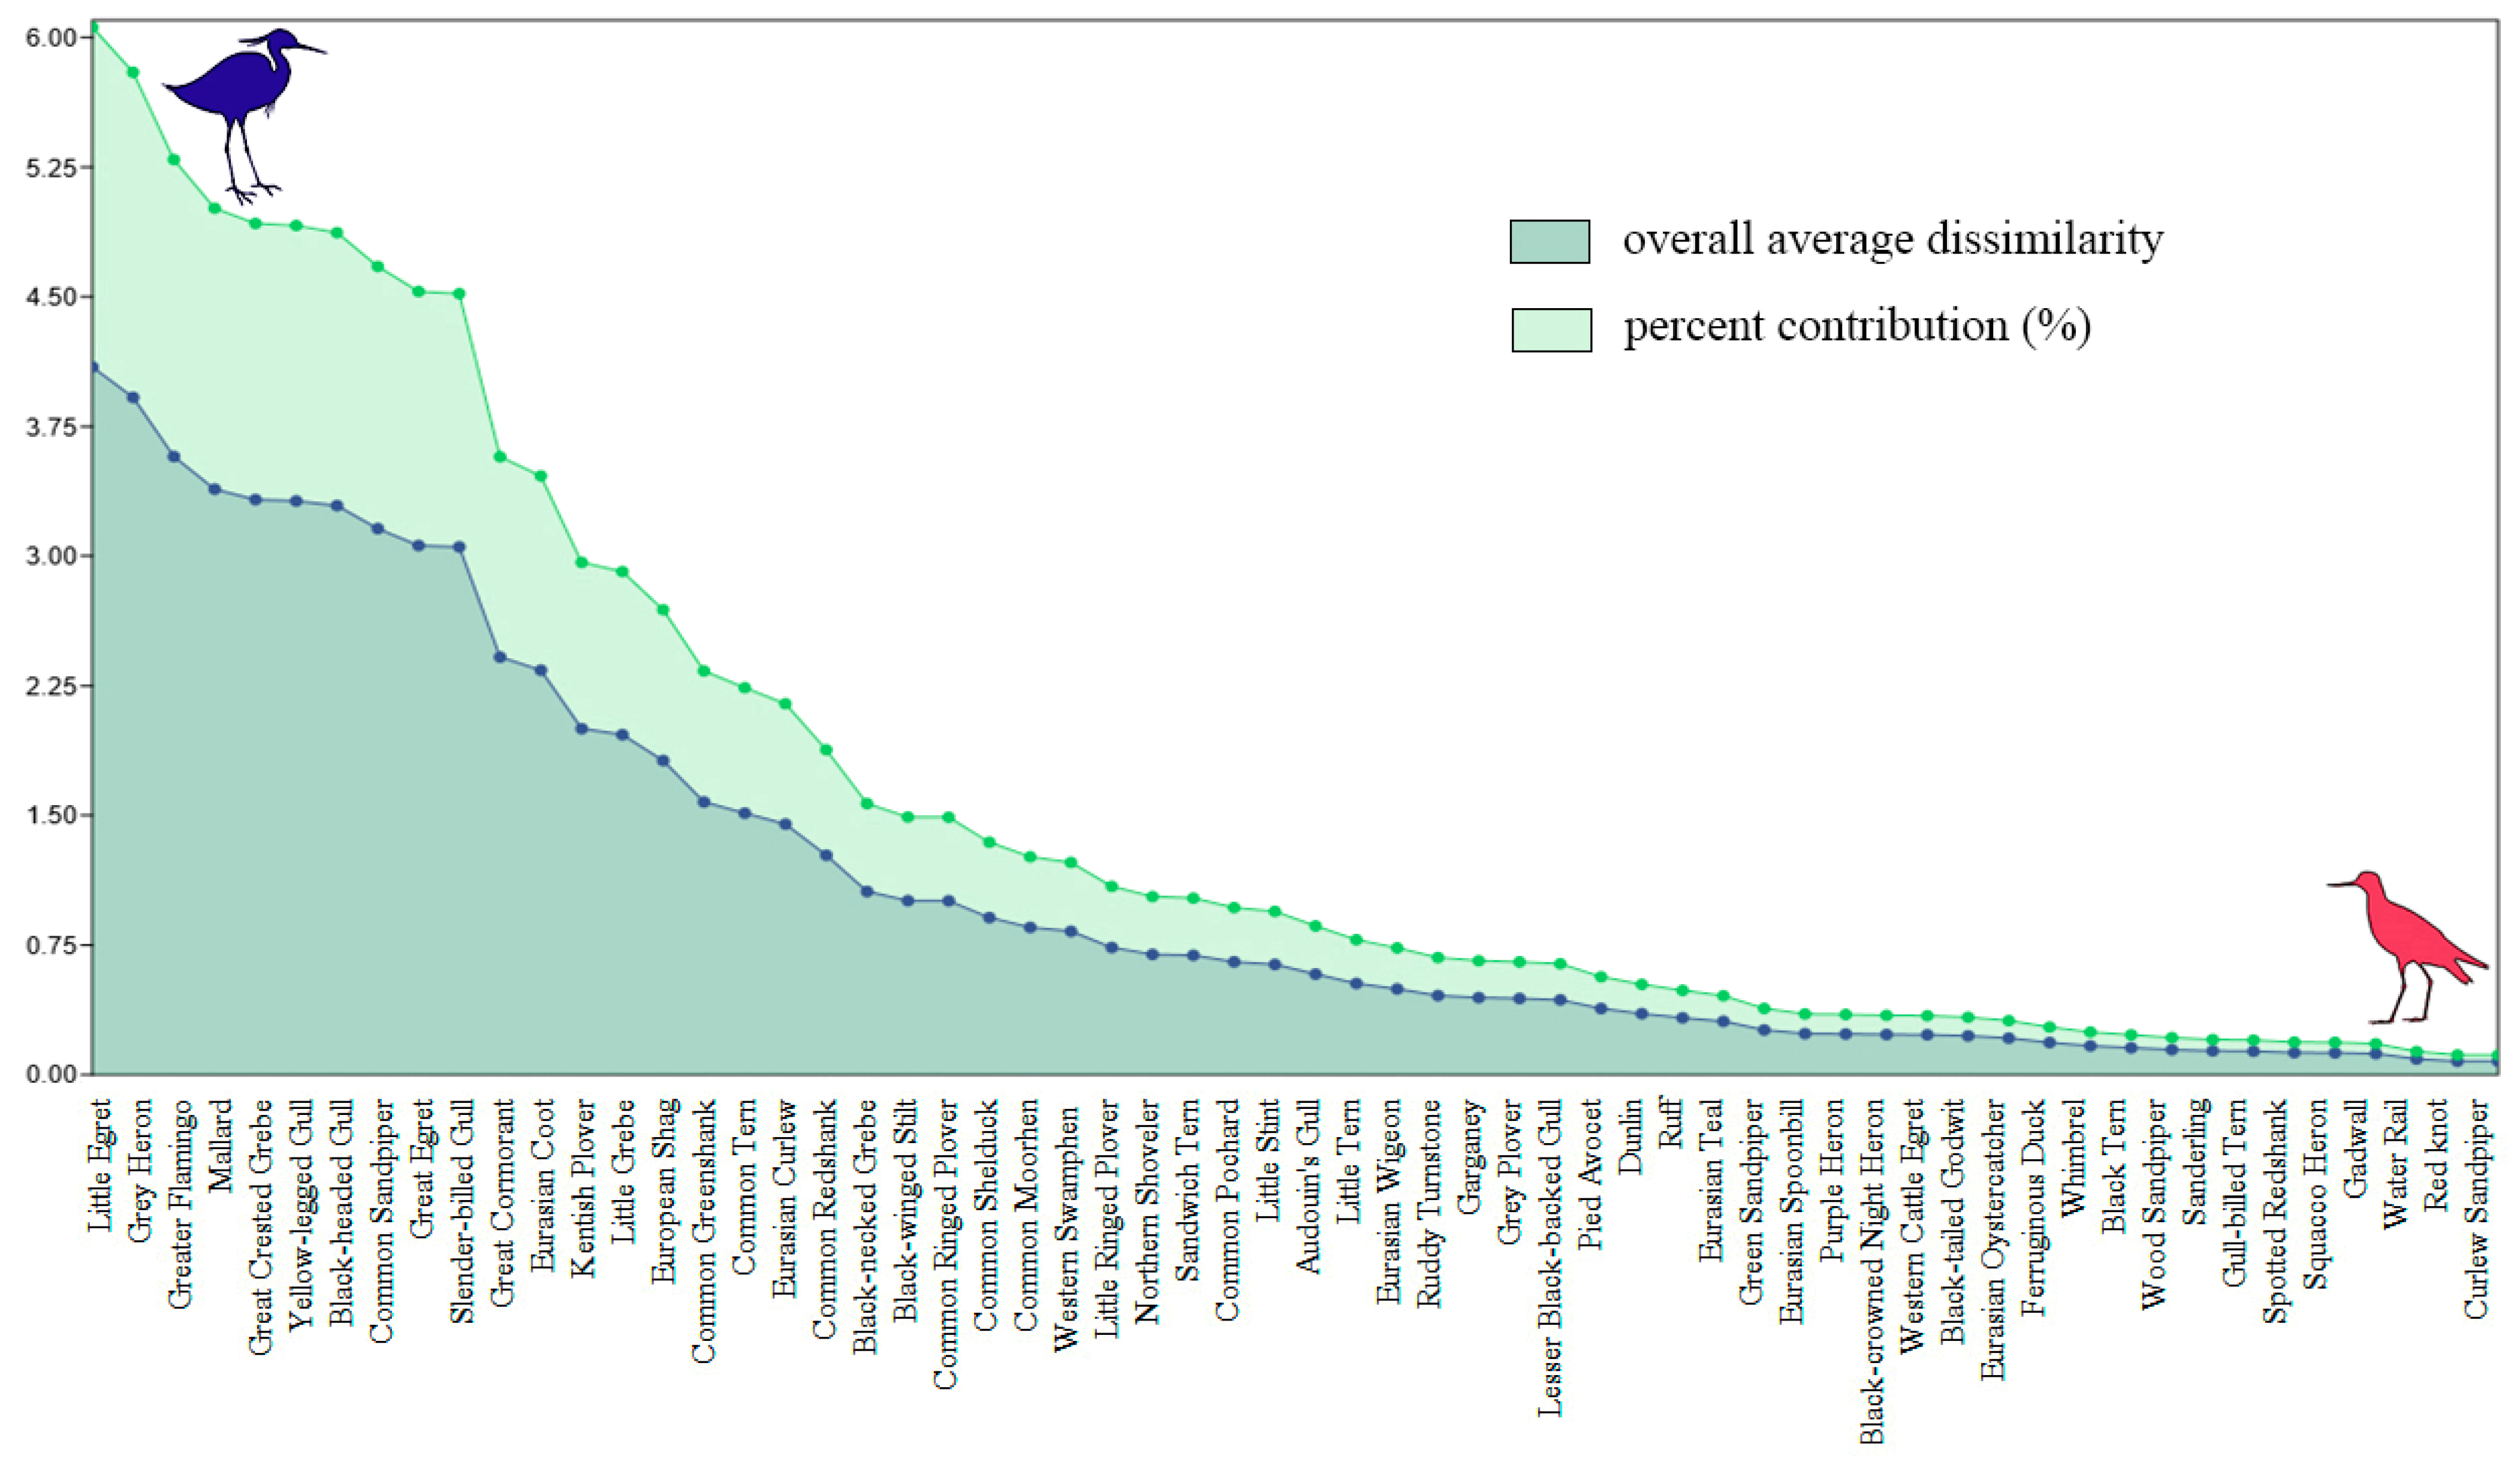
3.4. Species
4. Discussion
Entailments for the Preservation of the Avian Species
5. Conclusions
Supplementary Materials
Author Contributions
Funding
Data Availability Statement
Acknowledgments
Conflicts of Interest
Appendix A
References
- European Commission. The Natura 2000 Biogeographical Regions. 2016. Available online: http://ec.europa.eu/environment/nature/natura2000/biogeog_regions/ (accessed on 29 August 2024).
- ISPRA. Introduction to the Italian Bird Migration Atlas; ISPRA Editore: Rome, Italy, 2008. [Google Scholar]
- Berthold, P. Bird Migration: A General Survey; Oxford University Press: New York, NY, USA, 2001. [Google Scholar]
- Fois, M.; Fenu, G.; Bacchetta, G. Estimating land market values from real estate offers: A replicable method in support of biodiversity conservation strategies. Ambio 2019, 48, 312–323. [Google Scholar] [CrossRef]
- Ferrarini, A.; Gustin, M.; Celada, C. Twenty-three years of land-use changes induced considerable threats to the main wetlands of Sardinia and Sicily (Italy) along the Mediterranean bird flyways. Diversity 2021, 13, 240. [Google Scholar] [CrossRef]
- Ferrarini, A.; Celada, C.; Gustin, M. Preserving the Mediterranean bird flyways: Assessment and prioritization of 38 main wetlands under human and climate threats in Sardinia and Sicily (Italy). Sci. Total Environ. 2020, 751, 141556. [Google Scholar] [CrossRef] [PubMed]
- Salafsky, N.; Margoluis, R. Threat reduction assessment: A practical and cost-effective approach to evaluating conservation and development projects. Conserv. Biol. 1999, 13, 830–841. [Google Scholar] [CrossRef]
- Ferrarini, A.; Gustin, M.; Celada, C. Wetland attributes significantly affect patterns of bird species distribution in the Sardinian wetlands (Italy): An uncertain future for waterbird conservation. J. Appl. Ecol. 2023, 60, 650–660. [Google Scholar] [CrossRef]
- Ferrarini, A.; Gustin, M.; Celada, C. Simulation modeling unveils the unalike effects of alternative strategies for waterbird conservation in the coastal wetlands of Sardinia (Italy). Biology 2023, 12, 1440. [Google Scholar] [CrossRef] [PubMed]
- Patterson, B.D.; Atmar, W. Nested subsets and the structure of insular mammalian faunas and archipelagos. Biol. J. Linn. Soc. Lond. 1986, 28, 65–82. [Google Scholar] [CrossRef]
- Bascompte, J.; Jordano, P.; Melian, C.J.; Olesen, J.M. The nested assembly of plant–animal mutualistic networks. Proc. Natl. Acad. Sci. USA 2003, 100, 9383–9387. [Google Scholar] [CrossRef]
- Legendre, P.; Galzin, R.; Harmelin-Vivien, M.L. Relating behavior to habitat: Solutions to the fourth-corner problem. Ecology 1997, 78, 547–562. [Google Scholar] [CrossRef]
- Evans, D. Building the European Union’s Natura 2000 network. Nat. Conserv. 2012, 1, 11–26. [Google Scholar] [CrossRef]
- Griffith, D.A. Spatial Autocorrelation: A Primer; Association of American Geographers: Washington, DC, USA, 1987. [Google Scholar]
- Hutto, R.L.; Pletschet, S.M.; Hendricks, P.A. fixed-radius point count method for nonbreeding and breeding season use. Auk 1986, 103, 593–602. [Google Scholar] [CrossRef]
- Cramp, S.E.; Simmons, K.E.L.; Brooks, D.J.; Perrins, C.M. Handbook of the Birds of Europe, the Middle East and North Africa: The Birds of the Western Palearctic (Vol. 1–9); 1977–1994; Oxford University Press: Oxford, UK, 1994. [Google Scholar]
- Burfield, I.J.; Rutherford, C.A.; Fernando, E.; Grice, H.; Piggott, A.; Martin, R.W.; Balman, M.; Evans, M.I.; Staneva, A. Birds in Europe 4: The fourth assessment of Species of European Conservation Concern. Bird Conserv. Int. 2023, 33, e66. [Google Scholar] [CrossRef]
- Routledge, R.D. On Whittaker’s components of diversity. Ecology 1977, 38, 1120–1127. [Google Scholar] [CrossRef]
- Kendall, M.G. Rank Correlation Methods, 4th ed.; Charles Griffin: London, UK, 1975. [Google Scholar]
- Mann, H.B. Non-parametric tests against trend. Econometrica 1945, 13, 245–259. [Google Scholar] [CrossRef]
- Anderson, M.J.; Ellingsen, K.E.; McArdle, B.H. Multivariate dispersion as a measure of beta diversity. Ecol. Lett. 2006, 9, 683–693. [Google Scholar] [CrossRef] [PubMed]
- Michener, C.D.; Sokal, R.R. A quantitative approach to a problem of classification. Evolution 1957, 11, 490–499. [Google Scholar] [CrossRef]
- Sokal, R.R.; Sneath, P.H.A. Principles of Numerical Taxonomy; W. H. Freeman: San Francisco, CA, USA, 1963. [Google Scholar]
- Anderson, M.J. A new method for non-parametric multivariate analysis of variance. Austral Ecol. 2001, 26, 32–46. [Google Scholar]
- Clarke, K.R. Non-parametric multivariate analyses of changes in community structure. Aust. J. Ecol. 1993, 18, 117–143. [Google Scholar] [CrossRef]
- Liu, S.; Chen, Y.; Yang, R.; Li, D.; Qiu, Y.; Lu, K.; Cao, X.; Chen, Q. Spatiotemporal Dynamics of Constructed Wetland Landscape Patterns during Rapid Urbanization in Chengdu, China. Land 2024, 13, 806. [Google Scholar] [CrossRef]
- Cao, Y.; Wang, S.; Tian, G.; Dong, N.; Lei, Y. Coupling Biodiversity and Human Pressures to Indicate Conservation Priorities for Threatened Waterfowl Species: A Case in the Henan Yellow River Wetland National Nature Reserve. Land 2023, 12, 1250. [Google Scholar] [CrossRef]
- Hammana, C.; Pereña-Ortiz, J.F.; Meddad-Hamza, A.; Hamel, T.; Salvo-Tierra, Á.E. The Wetlands of Northeastern Algeria (Guelma and Souk Ahras): Stakes for the Conservation of Regional Biodiversity. Land 2024, 13, 210. [Google Scholar] [CrossRef]
- Zhang, J.; Qin, Y.; Zhang, Y.; Lu, X.; Cao, J. Comparative Assessment of the Spatiotemporal Dynamics and Driving Forces of Natural and Constructed Wetlands in Arid and Semiarid Areas of Northern China. Land 2023, 12, 1980. [Google Scholar] [CrossRef]
- Giovacchini, P.; Battisti, C.; Marsili, L. Evaluating the Effectiveness of a Conservation Project on Two Threatened Birds: Applying Expert-Based Threat Analysis and Threat Reduction Assessment in a Mediterranean Wetland. Diversity 2022, 14, 94. [Google Scholar] [CrossRef]
- Xu, Q.; Zhou, L.; Xia, S.; Zhou, J. Impact of Urbanisation Intensity on Bird Diversity in River Wetlands around Chaohu Lake, China. Animals 2022, 12, 473. [Google Scholar] [CrossRef] [PubMed]
- Ross, P.M.; Adam, P. Climate Change and Intertidal Wetlands. Biology 2013, 2, 445–480. [Google Scholar] [CrossRef]
- Battisti, C.; Perchinelli, M.; Vanadia, S.; Giovacchini, P.; Marsili, L. Monitoring Effectiveness of an Operational Project on Two Threatened Landbirds: Applying a Before–After Threat Analysis and Threat Reduction Assessment. Land 2023, 12, 464. [Google Scholar] [CrossRef]
- Blake-Bradshaw, A.G.; Lancaster, J.D.; O’Connell, J.R.; Matthews, J.W.; Eichholz, M.W.; Hagy, H.M. Suitability of Wetlands for Migrating and Breeding Waterbirds in Illinois. Wetlands 2020, 40, 1993–2010. [Google Scholar] [CrossRef]
- Wang, C.; Liu, H.Y.; Li, Y.F.; Dong, B.; Qiu, C.Q.; Yang, J.L.; Zong, Y.; Chen, H.; Zhao, Y.Q.; Zhang, Y.A. Study on habitat suitability and environmental variable thresholds of rare waterbirds. Sci. Total Environ. 2021, 785, 147316. [Google Scholar] [CrossRef]
- Rosenberg, K.V.; Dokter, A.M.; Blancher, P.J.; Sauer, J.R.; Smith, A.C.; Smith, P.A.; Stanton, J.C.; Panjabi, A.; Helft, L.; Parr, M.; et al. Decline of the North American avifauna. Science 2019, 366, 120–124. [Google Scholar] [CrossRef]
- Lai, S.; Leone, F.; Zoppi, C. Land cover changes and environmental protection: A study based on transition matrices concerning Sardinia (Italy). Land Use Policy 2017, 67, 126–150. [Google Scholar] [CrossRef]
- Ferrarini, A.; Celada, C.; Gustin, M. Anthropogenic Pressure and Climate Change Could Severely Hamper the Avian Metacommunity of the Sicilian Wetlands. Diversity 2022, 14, 696. [Google Scholar] [CrossRef]
- Ferrarini, A.; Celada, C.; Gustin, M. Spatiotemporal Dynamics in Bird Species Assembly in the Coastal Wetlands of Sicily (Italy): A Multilevel Analytical Approach to Promote More Satisfactory Conservation Planning. Land 2024, 13, 1333. [Google Scholar] [CrossRef]
- Ferrarini, A.; Celada, C.; Gustin, M. Waterbird Species are Highly Sensitive to Wetland Traits: Simulation-Based Conservation Strategies for the Birds of the Sicilian Wetlands (Italy). Biology 2024, 13, 242. [Google Scholar] [CrossRef]
- Rubega, M.A.; Robinson, J.A. Water salinization and shorebirds: Emerging issues. Intern. Wader Stud. 1997, 9, 45–54. [Google Scholar]
- Dezvareh, G.A.; Nabavi, E.; Shamskilani, M.; Darban, A.K. Water salinity reduction using the phytoremediation method by three plant species and analyzing their behavior. Water Air Soil Pollut. 2023, 234, 90. [Google Scholar] [CrossRef]


| Date of Sampling | α Diversity | β Diversity | γ Diversity | Matrix Fill |
|---|---|---|---|---|
| August (1st half) | 7.77 | 0.40 | 36 | 12.74 |
| August (2nd half) | 8.18 | 0.46 | 45 | 13.41 |
| September (1st half) | 7.86 | 0.44 | 41 | 12.89 |
| September (2nd half) | 8.77 | 0.42 | 44 | 14.38 |
| S: | 4 | 0 | 2 | 4 |
| p (no trend): | 0.167 | 0.625 | 0.375 | 0.167 |
| Statistically significant? | no | no | no | no |
| Sum of Squares | d.f. | Mean Square | F | p (Same) | Permutations | |
|---|---|---|---|---|---|---|
| Between groups | 0.03294 | 3 | 0.01098 | 0.734 | 0.5384 | 9999 |
| Within groups | 1.25667 | 84 | 0.01496 | |||
| Total | 1.28962 | 87 |
| Total Sum of Squares | Within-Group Sum of Squares | Error Sum of Squares | F | p (Same) | Permutations |
|---|---|---|---|---|---|
| 21.6 | 20.84 | 7.624 | 2.088 | 0.004 | 9999 |
Disclaimer/Publisher’s Note: The statements, opinions and data contained in all publications are solely those of the individual author(s) and contributor(s) and not of MDPI and/or the editor(s). MDPI and/or the editor(s) disclaim responsibility for any injury to people or property resulting from any ideas, methods, instructions or products referred to in the content. |
© 2024 by the authors. Licensee MDPI, Basel, Switzerland. This article is an open access article distributed under the terms and conditions of the Creative Commons Attribution (CC BY) license (https://creativecommons.org/licenses/by/4.0/).
Share and Cite
Ferrarini, A.; Gustin, M.; Celada, C. Waterbirds of Sardinia (Italy): How Space and Time Shape a Threatened Metacommunity During the Critical Summer Period. Land 2024, 13, 2193. https://doi.org/10.3390/land13122193
Ferrarini A, Gustin M, Celada C. Waterbirds of Sardinia (Italy): How Space and Time Shape a Threatened Metacommunity During the Critical Summer Period. Land. 2024; 13(12):2193. https://doi.org/10.3390/land13122193
Chicago/Turabian StyleFerrarini, Alessandro, Marco Gustin, and Claudio Celada. 2024. "Waterbirds of Sardinia (Italy): How Space and Time Shape a Threatened Metacommunity During the Critical Summer Period" Land 13, no. 12: 2193. https://doi.org/10.3390/land13122193
APA StyleFerrarini, A., Gustin, M., & Celada, C. (2024). Waterbirds of Sardinia (Italy): How Space and Time Shape a Threatened Metacommunity During the Critical Summer Period. Land, 13(12), 2193. https://doi.org/10.3390/land13122193