Abstract
Land ecological security (LES) is a crucial issue pertaining to the sustainability of landscapes or land systems. Nevertheless, previous studies largely neglected the impacts of landscape structure on LES. This study, taking the Yellow River Delta (YRD) as the case area, analyzed the spatiotemporal differentiation patterns of regional LES in 19 counties (cities and districts) from 2000 to 2020 through the application of landscape metrics and employed GeoSOS-FLUS to forecast the landscape structure and corresponding land ecological security in 2030 under four different scenarios to advance sustainability. The results show that, first, landscape fragmentation and irregularity are decreasing, while aggregation and connectivity are increasing. The primary landscape change involves the transition from farmland to developed areas. Second, the LES index is rising. In 2020, about 73.68% of the research units reached level IV, while most were at level III. Third, it is projected that by 2030, the LES index will rise under all scenarios, exhibiting an eastward-declining gradient in its geographic distribution, with higher values prevailing in the eastern regions and gradually tapering off towards the west. It is expected that in the business-as-usual scenario, the proportion of LES reaching level V will be the highest. This study not only reveals the impact mechanism of the landscape structure on land ecological security but also provides an important basis for formulating scientific and rational land use planning and management strategies from the perspectives of sustainable land governance and sustainable land use.
1. Introduction
Land is a crucial medium for regional sustainable development, and land ecological security is indispensable for achieving enduring economic growth and societal progress, and additionally, it serves as a fundamental requirement for ensuring food safety and social stability [1]. With the continuous advancement of urbanization, human endeavors continue to interfere with the stability of agricultural ecosystems, and the contradiction between the economy, resources, and the environment has become increasingly prominent, destroying land ecosystems [2]. Significant portions of the global population face land ecological insecurity, environmental threats, and developmental shortcomings in low-income countries that rely on agriculture. These issues stem from failed agricultural development driven by factors such as a dearth of innovative practices, over-reliance on traditional methods, insufficient planned management, a lack of local community involvement, few economically viable alternatives, food shortages, unemployment, and low living standards, compounded by a lack of awareness [3]. At the same time, drought as well as the release of greenhouse gases, particularly carbon dioxide, into the atmosphere are also significant factors impacting land ecological security [4].
The ecosystem is built upon a specific landscape structure, and this landscape exerts a substantial effect on the comprehensive environmental safeguards for the land. Therefore, the land ecosystem and the landscape structure blend, thus showing characteristics of complexity [5]. A changing landscape structure is a critical aspect of landscape ecology research, as it affects landscape heterogeneity [6] and ecosystem stability [7]. As the landscape structure evolves, the patterns of material cycling and energy flow undergo corresponding changes, which may result in the degradation of regional ecosystem services [8]. This degradation not only threatens land ecological security but also poses severe challenges to sustainable land governance and land use through pathways such as environmental damage and decreased agricultural productivity. Understanding landscape structure change is vital for reaching landscape ecological balance and sustainable development [9].
The Yellow River Delta (YRD), the most recent and expansive wetland in China, is crucial for sustaining the ecological equilibrium of the area and moderating the local climate [10]. However, because of the inherent limitations and anthropogenic activities within the delta, the region’s landscape structure and function have been compromised, resulting in inefficient land use, severe soil salinization, and wetland degradation, which demand urgent attention. The swift enlargement of construction land has further exacerbated these problems. In the context of landscape ecology, changes in the landscape pattern of the YRD not only impact the equilibrium and biodiversity of ecosystems but also have a direct bearing on the ecological safety of the region. With advancing urbanization along the Yellow River basin, the swift enlargement of construction land has exacerbated the already sensitive and fragile ecological environment issues. Consequently, investigations into the ecological safety of land are highly significant for optimizing the regional eco-security pattern and achieving sustainable progress in the Yellow River Delta.
Land ecological stability occupies a central position in landscape ecology and sustainable land utilization, as it not only concerns the environmental security of specific regions but also serves as the cornerstone for national security and socially sustainable development. In 1941, Aldo Leopold introduced the notion of “land health” [11]. Barthouse integrated the concept of safety into ecological and environmental conservation, conducting research on ecological systems [12]. The Food and Agriculture Organization of the United Nations (FAO) delineated the definition and essence of land assessment in 1976. It created the natural and social–economic evaluation indexes of land utilization in 1993 [13], which laid a robust theoretical basis for evaluating land eco-security. Regarding land eco-security, early research focused on land quality evaluation, land ecological security connotation, and qualitative regulation [14]. Given the growing tension and conflicts arising from the interactions between people’s activities and land resources, ecosystems and the environmental circumstances are deteriorating. As a result, there is a growing body of research on terrestrial ecosystem protection. Research mainly focuses on the configurations of land ecological integrity [15,16], the evolution over space and time, factors affecting land ecosystem resilience [17,18], and the forecast of sustainable land ecosystem conditions [19,20]. The investigative techniques are varied yet predominantly focused on utilizing the Pressure–State–Response (PSR) framework, Driving–Pressure–State–Impact-Response (DPSIR) approach, the Economic–Environment–Social (EES) model, and the Natural–Economic–Social (NES) framework [21,22] to construct the indicator system and use principal component analysis, the ecological footprint method, landscape structure analysis, the TOPSIS method, and the matter component model [23,24,25] to evaluate land ecological security.
Landscape structure research includes special terrain areas, nature reserves, watersheds, provinces, cities, and other scales [8,26]. Initial investigations concentrated on the arrangement and pattern of landscape elements [27,28,29]. At the same time, recent research has expanded to landscape fragmentation, heterogeneity characteristics, land use, land evolution [30], landscape configuration, driving factor analysis, and landscape configuration simulation and optimization [31]. Research methods include a land use transfer matrix, a dynamic model [32], and a landscape pattern index [9]. A significant research domain that integrates terrestrial ecosystem patterns with sustainable land ecology centers on comprehending the impact of shifts in ecosystem patterns on the health of the area’s ecological systems.
The interaction between landscape structure change and the ecological sustainability of land is subject to a trifecta of ecological protection, economic drive, and social development, which is the result of many factors [33], as shown in Figure 1. On the one hand, the landscape structure and function have experienced significant changes due to internal and external factors. These changes have led to other transformations in the arrangement of landscape elements and the range of landscape configuration, causing the landscape structure to deviate in its order and stability. At this state, the change in the landscape structure has a coercive effect on the safety of the “natural–social–economic system” and direct or indirect consequences on LES [34]. On the other hand, the landscape structure can resist external damage. Its changes in health can enhance the system’s stability to a certain extent. This can then contribute positively to the safety of the “natural–social–economic system”, thereby improving the degree of terrestrial ecosystem safety [35].

Figure 1.
The mechanisms of interaction between the landscape structure change and LES.
This research direction explores the ecological impact of changes in landscape configuration, including the assessment of ecological security under different landscape models, the assessment of landscape ecological risks, and the assessment of the configuration vulnerability of the landscape. The ecological security assessment under differing landscape configurations encompasses a range of metrics, including, but not restricted to, the patch size, the number of fragments, a landscape diversity metric, an index of landscape dominance, a measure of landscape evenness, and a fragmentation assessment of the landscape. These indexes serve as quantitative tools for examining the evolving landscape alterations and elucidating the ecological security status within various landscape configurations [31]. To evaluate ecological hazard in the landscape, a model of ecological risk and security assessment is devised, incorporating indices of landscape disruption and vulnerability inherent in the landscape structure. Moreover, it explores how the landscape structure impacts ecological systems in wetlands, watersheds, and other research areas [36]. Constructing a landscape ecological vulnerability assessment model utilizing landscape sensitivity and the landscape fitness index allows for evaluating the vulnerability of landscape patterns. Similarly, spatial analysis and statistical methods examine geographical and temporal variations characterizing the region [37]. Scenario simulation and the prediction of the future ecological safety of land at the regional level will provide references for local managers and policymakers in territorial spatial planning. Currently, some more advanced models for land use research have gradually replaced traditional ones [38,39]. For example, the Verburg team used the CLUE-S model to transform changes in population, economy, and policies in Europe into changes in land use patterns through scenario simulations, thereby defining the trajectory of land use change in Europe [40]; the Yang Zitao team utilized the PLUS model to conduct three future scenario simulations for land use in the province by 2030 and evaluated the results of the development scenario [41]. The GeoSoS-FLUS model, formulated by the Li Xia team [42], is an effective model for geographic spatial modeling and spatial optimization, and aiding decision-making. This model can consider the transformation rules of land use types, spatial proximity effects, the impact of driving factors, and land use constraints [43], generating high-precision simulation results of land use changes [44].
These research findings provide valuable theoretical foundations and empirical cases of landscape ecological security patterns, sustainable land use resources, and sustainable land governance, yet vast research space remains to be explored. Firstly, despite the YRD boasting the largest land resources and most abundant wetlands in China, research has scarcely examined the spatiotemporal variations in land ecological security while adopting a landscape structural lens. Secondly, the landscape structure can indicate the condition of the ecosystem. Similarly, the value of ecosystem services directly reflects the condition of ecological security. By incorporating the two aspects within the measurement framework, a more impartial and comprehensive assessment of LES can be accomplished. However, most current evaluation studies overlook the influence of the two dimensions on the assessment outcomes. Thirdly, current studies aimed at forecasting the ecological stability of land primarily rely on time series analysis, and research on the trend of spatial evolution needs to be expanded. In contrast, research on multi-scenario prediction of land ecological security is rare.
This study explored the association between landscape structure and ecological land security in the YRD, China. A “natural–economic–social coupling system” (NES) model was developed to integrate the value of ecosystem functions into the framework for assessing land ecological security. Multiple scenarios were established, encompassing spontaneous growth, cultivated land conservation, economic growth, and ecological conservation. The GeoSOS-FLUS model was employed to forecast the landscape structure of the YRD in 2030, and the geospatial and temporal change trajectory of ecological land security was explored to evaluate the transformations of landscape structure in different situations and propose control measures.
2. Materials and Methods
The area included in this research is the Yellow River Delta region, characterized by fragile ecological foundations and landscapes exhibiting varying degrees of fragmentation. To foster national efforts in ecological preservation and sustainable development within the Yellow River basin, this research utilizes five phases of Normalized Difference Vegetation Index (NDVI) data (with a resolution of 1 km) and remote sensing land use monitoring data (also with a granularity of 1 km) spanning from 2000 to 2020, sourced from the Resource and Environment Science Data Center of the Chinese Academy of Sciences. Additionally, Digital Elevation Model (DEM) spatial distribution data (with a granularity of 90 m) from the National Geospatial Data Cloud, as well as socio-economic and lifestyle statistics from municipal and county-level statistical yearbooks (2000–2020) and the “National Economic and Social Development Statistics Bulletin” (2000–2020), are employed. By adopting the landscape pattern index method, utilizing the landscape change trajectory model, CRITIC–entropy weight combination weighting model, and GeoSOS-FLUS model, this research establishes a framework for assessing land ecological security to investigate the connection between changes in landscape structure and the ecological security of land in the Yellow River Delta area. Utilizing four scenario plans—natural development, farmland protection, economic development, and ecological conservation—this research simulates the spatiotemporal evolution trends of landscape structure and land ecological security under multiple scenarios to contribute to the environmentally sound development of this region.
The ecological integrity and safety of the YRD are discussed with regard to landscape composition, and research is conducted according to the subsequent steps. First, data are required to study the landscape framework change of the YRD utilizing landscape pattern metrics and the landscape change trajectory model. Secondly, the framework of land ecological security assessment is established, and the temporal and geographic distribution patterns of ecological stability within the YRD are examined by utilizing a combined CRITIC–entropy weighting model and a holistic appraisal technique. Subsequently, the GM (1,1) model and the GeoSOS-FLUS model are utilized to recreate multiple scenarios of LES in the YRD, describing the spatiotemporal attributes of LES across diverse scenarios. Finally, drawing on the aforementioned findings, the corresponding conclusions are drawn, and tangible recommendations are proposed to enhance ecological conservation and sustainable growth in the YRD (Figure 2).
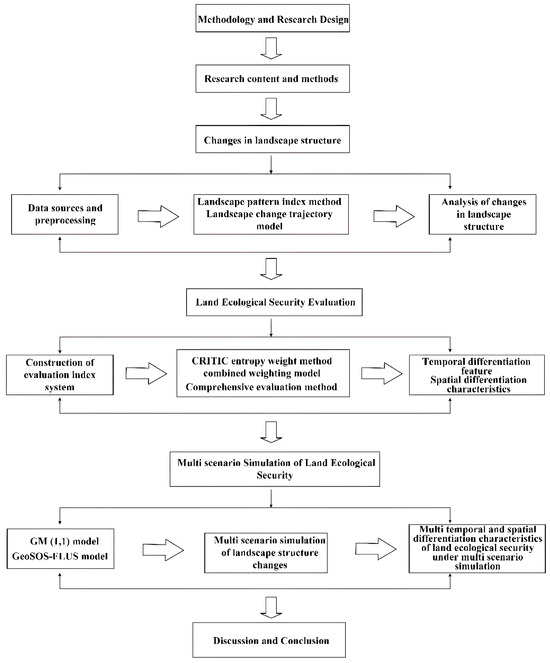
Figure 2.
The research framework.
2.1. Study Area
The Yellow River Delta, designated as the YRD, is one of the largest river deltas with the greatest development potential in China (Figure 3). It is positioned at the juncture where the Yellow River meets the ocean, between 116°54′ E–120°18′ E and 36°25′ N–38°16′ N, and includes 19 counties (cities and districts) of Dongying, Binzhou, Weifang, Dezhou, Zibo and Yantai. The entire area under consideration spans approximately 2.65 × 10⁴ km2. Since introducing the Yellow River Delta Efficient Ecological Economic Zone Development Plan, the construction of the regional ecological civilization has achieved remarkable results. However, due to the fragile ecological foundation of the region and the increasing severity of climate change and anthropogenic impacts, the landscape exhibits varying degrees of fragmentation, which affects the stability and integrity of the landscape structure. Many problems with ecological and water resources such as soil salinization, untimely treatment of pollution sources and severe situations with water security need to be solved urgently, which limits the safety of the land ecosystem. Selecting this area for study holds significant practical value for advancing the national initiative on ecological preservation and sustainable, high-caliber growth in the Yellow River Basin.

Figure 3.
The location of the YRD.
2.2. Data Sources and Preprocessing
Within this research, the land use classifications within the designated region were delineated as categories of landscape. In accordance with the Land Use Status Classification (2010–2017) and the landscape features of the research region, landscape types have been categorized into six distinct classifications: cultivated land, forest land, grassland, wetland, construction land, and unused land. Normalized Difference Vegetation Index (NDVI) values and land utilization satellite imagery, both featuring a 1 km spatial accuracy, were obtained from the Resource and Environmental Science Data Center of the Chinese Academy of Sciences (http://www.resdc.cn, accessed on 6 November 2024) for 2000–2020. Digital Elevation Model (DEM) spatial distribution data (90 m resolution) originate from the National Geospatial Data Cloud, and elevation, gradient, and other data were derived based on DEM data. Socio-economic and living statistics are sourced from the statistical yearbooks of cities, counties, and districts (2000–2020) and from the Statistical Bulletin of National Economic and Social Development (2000–2020).
2.3. Methods
2.3.1. Landscape Pattern Index
In this research, fluctuations in landscape configuration in the YRD were studied, focusing on two key aspects: landscape composition and landscape pattern. This study utilized Fragstats4.2 software and a landscape metrics approach. The number of patches (NP), mean patch area (MPS), and patch cohesion index (COHESION) were chosen to characterize changes in landscape composition in the YRD [45]. The average fractal dimension of the patch (FRAC-MN), patch density (PD), maximum patch index (LPI), landscape shape index (LSI), Shannon diversity index (SHDI), contagion index (CONTAG), and aggregation index (AI) [20] were chosen to examine the transformation of the regional landscape pattern.
2.3.2. Landscape Change Trajectory Model
Combining the change trajectory model with the landscape configuration can more clearly show the characteristics of the landscape’s composition change [46]. To reveal the features of evolving landscape structural dynamics, the present research employs a pathway analysis model to examine the evolution of six terrain categories within the YRD region and identifies the spatial transformation features among these varieties [47]. The mathematical expression is delineated below:
where T is the newly generated landscape change trajectory code; A, B, …, E is the landscape grid trajectory coding of each year, which can be used to characterize the change in landscape types; and n is the number of time nodes.
2.3.3. CRITIC–Entropy Weight Method Combination Weighting Model
The CRITIC weighting approach determines the objective weight by estimating the contrast and conflict between the indices [48], which may reduce the impact of the correlation indices on weight distribution but cannot measure the degree of dispersion between indices. To compensate for the deficiency of this point and based on standardization, this study comprehensively uses the CRITIC–entropy weight method combination weighting model to ascertain the weight for each indicator to determine the weight more objectively. The calculation formula is described in detail in [49].
2.3.4. Comprehensive Evaluation Method
Using spatial analysis and grid calculation, the standardized index data are superimposed with weights. The land ecological security (LES) index is obtained through a comprehensive assessment method as follows:
where denotes the normalized value for every indicator, represents the -th index’s weighting coefficient, and the LES range is [0, 1]. To more intuitively understand the present state of ecological land security within the research zone, this study refers to [9] and divides the LES index into five levels founded on the actual traits of the region (Table 1).

Table 1.
The evaluation criteria used to determine the level of LES.
2.3.5. GM (1,1) Model
The GM (1,1) model is suitable for predicting small sample data and can establish differential equations to predict future trends through the degree of dissimilarity between factors [50,51]. This study utilizes the GM (1,1) forecasting model to compute the forecasted figures for metrics within the ecosystem security assessment index system for the year 2030.
- The modeling process
Let the primitive number be listed as with the aim of accumulating a new series , where .
The gray differential equation is satisfied between the accumulated generated sequence and the original sequence as follows:
α denotes the growth gray number, μ represents the internal control gray number, and .
Using the least square method for estimating the parameters, we can obtain the following:
where , .
The generating sequence satisfies the derivative formula of the common GM (1,1) model and is presented below:
The forecasted value from the GM (1,1) model’s derivation proceeds as outlined below:
- 2.
- Verification of simulation accuracy
In this study, the precision of the simulation was assessed using the posteriori error test, which tested the statistical characteristics of the residual distribution. The formula is as follows:
where is the posterior difference ratio, represents the standard deviation of the initial data sequence, and is the residual standard deviation. A lower value of C corresponds to a higher simulation accuracy. When < 0.35, the model accuracy is high; when < 0.5, the model is moderately accurate; when < 0.65, the simulation effect is fair; when > 0.65, the simulation effect is poor. The test results show that = 0.329, so the test simulation accuracy is high.
2.3.6. GeoSOS-FLUS Model
The GeoSOS-FLUS model is an upgraded model that draws its foundation from the principle of traditional cellular automation [52], which has high simulation accuracy and closely mirrors the actual patterns of land use. Utilizing the GeoSOS-FLUS model as a foundation, this study conducted a comprehensive multi-scenario simulation to analyze potential modifications to the landscape structure of the delta of the YRD by 2030, further delving into the implications of these alterations on land ecological security across various scenarios. It projected a geographical distribution of land ecological security across four different scenarios.
- Selection of driving factors of landscape structure change
This study selected 12 driving factors as independent variables of landscape structure change, including annual average precipitation, annual mean precipitation, slope, elevation, public financial expenditures, average investments in fixed assets, population density, GDP per capita, aggregate power of farm machinery, distance from residential areas, distance from coastlines, and distance from roads [53]. Then, the standardized driving factor data were resampled to a 1 km resolution.
- 2.
- Accuracy verification analysis
To confirm the precision of the simulated results, utilizing the landscape structure data from the YRD for the year 2015, changes in landscape structure in 2020 were simulated, and the modeling outcomes were contrasted with the real values in 2020. The results showed that the kappa value reached 0.834, demonstrating the model’s high precision.
- 3.
- Multi-scenario setting
Since 2009, the YRD has been acknowledged as part of the country’s strategic growth initiatives, leading to a rise in regional economic development. With it being an important grain-producing area, its agricultural development has attracted much significance. Upon the implementation of sustainable protection and progressive development strategies within the Yellow River Basin, undeniable importance is placed on ecological protection and wetland protection in the region. To investigate how alterations in landscape structure affect the progression of land ecological security across various scenarios, this research incorporated the distinctive characteristics of the study area and refers to pertinent scholarly works to forecast the anticipated shifts in the landscape structure of the YRD by the year 2030 [9,54] (Table 2).
Table 2.
Multi-scenario simulation mode and setting principle of the landscape structure change mode.
2.4. Land Ecological Security Evaluation Index System
Compared to traditional research models, the NES model more accurately captures the level of harmony among the land ecosystem and natural, economic, and social systems. The foundation of the land ecological security assessment index framework for the area is based on the features of the landscape composition and the actual state of socio-economic progress in the YRD (Table 3).
Table 3.
The assessment criteria used to determine land ecological security in the YRD. “+” signifies a positive correlation, “−“ signifies a negative correlation.
The natural dimension reflects the impact of the landscape structure and environmental conditions on the LES. The landscape matrix stability index, structure stability index, and Shannon diversity index mirror the influence of landscape structure stability and diversity on land ecological security. Landscape fragmentation serves as an indicator of the adverse effects caused by the division and disruption of natural areas. Saline–alkali land and wetlands are typical for the YRD. The proportions of saline–alkali land and wetland areas are selected to better reflect the research area characteristics. The average cultivated land area per person shows the pressure of the regional population on cultivated land. Meanwhile, the value of an ecosystem service represents the benefits and well-being provided by the land ecosystem. The NDVI indicates that the greater the vegetation coverage, the more favorable the terrestrial ecosystem, and the average annual precipitation and slope reflect the impact of natural conditions on the safety of the land ecosystem [24,55].
The economic dimension reflects the influence that economic growth has on the LES. The greater the GDP per capita, the greater the beneficial influence on the standard of LES. The percentage of the tertiary sector in GDP indicates the level of regional economic modernization, and the greater the proportion, the more it can alleviate the strain that primary and secondary industries exert on the land ecosystem. The average GDP per rural resident can reflect the income of farmers’ cultivated land production. The greater the index value, the more robust the region’s capacity for cultivated land production. Fiscal expenditure on environmental protection reflects the level of regional environmental management and contributes positively to enhancing land ecological security [37,56].
The social dimension reflects the role of social development in land ecological security. The rate of the natural rise in the population and the population density shows the burden of the population on the land ecosystem. The concentration of the road network and the level of urbanization indicate the effect of urban development on the terrestrial ecosystem. The level of agricultural machinery demonstrates the influence of agricultural modernization on the land ecosystem [57].
3. Results
3.1. Analysis of the Landscape Structure Change in the YRD
3.1.1. Overall Change Characteristics
The overall attributes of the landscape structural alterations within the YRD between 2000 and 2020 are illustrated in Table 4 and Figure 4. The change in landscape structure in the YRD between 2000 and 2020 was primarily characterized by cultivated land, comprising over 60% of the entire surface. Construction land had an area ratio of 15% to 20%, followed by grassland and unused land. The expanse of cultivated land grew from 16,039 km2 to 16,536 km2 between 2000 and 2005, but decreased slightly after 2005 due to urban development and policies such as returning cultivated land to forests. Construction land increased by 24.5% between 2000 and 2015, but decreased to 4079 km2 in 2020. Its change trend is primarily due to the continuous replenishment of water supplies in the YRD wetland in recent years. This effectively promotes the natural restoration of the ecosystem in the lower Yellow River area, the YRD wetland, and the nearby sea area. Forest land saw a slow decline, with grassland and unused land decreasing. The wetland developed rapidly in 2015, forming the main natural corridor of the YRD.
Table 4.
The extent of various landscape categories in the YRD from 2000 to 2020.
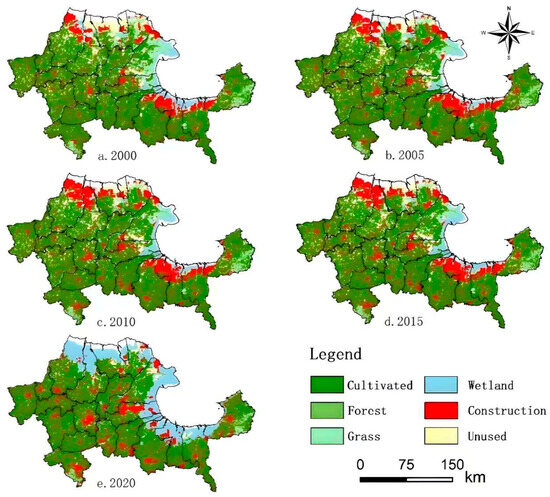
Figure 4.
Alterations in landscape structure within the YRD between 2000 and 2020.
3.1.2. Variation Characteristics of Landscape Composition
According to Table 5, the NP of the YRD displayed a tendency of ups and downs between 2000 and 2020. MPS experienced the process of decreasing first and then increasing over the period under investigation. It is evident that from 2000 to 2015, the level of landscape fragmentation in the YRD escalated, indicating that human activities and urbanization progress had an important influence on the landscape structure of the YRD, leading to ongoing fragmentation of landscape patches and a steady rise in patch count. After 2015, land and resource conservation garnered increased attention. As a result, the changes in NP and MPS in the YRD exhibited a pattern of decrease and increase, respectively. And the level of landscape fragmentation was reduced. The COHESION value can indicate the extent of landscape aggregation and dispersion. During the research period, COHESION was greater than 98%.
Table 5.
Characteristic index of landscape composition change.
3.1.3. Characteristics of the Landscape Pattern Change
Table 6 shows that the PD in the YRD was stable at 0.1 per km2 from 2000 to 2015, and then it decreased from 2015 to 2020, which meant that the degree of landscape fragmentation also diminished. The LPI initially rose and subsequently fell, reaching the highest value of 59.57% in 2005. It continued to decline from 2005 to 2020, indicating that human activity’s impact on the landscape was intensifying, and the significance of dominant landscape types began to weaken after 2005. LSI exhibited a fluctuating decline from 28.74% to 24.12%, indicating that the plaque irregularity decreased gradually. The SHDI stabilized at around 1.15 between 2000 and 2015, and experienced a decline from 2015 to 2020, suggesting a reduction in the diversity of landscape types, and various types of patches are prone to uneven distribution in the landscape. CONTAG and AI can indicate the degree of interconnectivity and aggregation of landscapes, both of which have displayed a rise–fall–rise pattern, suggesting that the degree of agglomeration for various patch types has decreased from 2005 to 2015, while the distribution of patch types showed a trend towards increased concentration from 2015 to 2020. During the study period, FRAC-MN was stable at 1.02, and the trend of change was not obvious, indicating that the change in the general intricacy of the YRD landscape is not significant. Overall, throughout the research timeframe, the landscape fragmentation of the YRD decreased, connectivity and agglomeration gradually increased, and the landscape ecosystem was generally stable.
Table 6.
Characteristic index of landscape pattern change.
This study analyzed 199 change trajectory codes within the YRD, focusing on the primary types of changes (Table 7). Urbanization has shifted from cultivated land to construction land, affecting 2561.73 km2. Cultivated land has been transformed into wetlands and grasslands, threatening food security. In 2015, the central policy document emphasized the conservation of cultivated land, leading to the conversion of 430 km2 of wetland, 77 km2 of forest land, 1740 km2 of construction land, and 680 km2 of grassland to cultivated land. In addition to cultivated land, the main direction of grassland landscape changes includes forest land, wetland, construction land, and unused land, which comprise 7.16% of the total expanse. The transformation of wetlands and construction land is the predominant feature of changing landscape patterns throughout the study duration, and the standard codes are 44445, 44554, 45554, and 55554. Most of the unused land was used for wetland protection and complemented the shortage of cultivated land, of which 696 km2 was converted to wetland, 659 km2 to cultivated land, and 143 km2 to construction land.
Table 7.
The landscape change trajectory in the YRD between 2000 and 2020.
3.2. Spatiotemporal Fluctuations in Land Ecological Security Within the YRD
3.2.1. Temporal Characteristics of Land Ecological Security
The global LES index of the YRD improved significantly between 2000 and 2020, with a continued upward trend (Table 8). This improvement is primarily due to the stabilization of the landscape structure and the expansion of wetland areas, ensuring stable ecological services. Technological advancements and increased awareness of ecological land protection also improved LES levels. From 2000 to 2015, LES levels in administrative units were mostly level III, with some level II due to human activities and environmental destruction. In 2020, most counties and districts were level IV, accounting for 73.68% of administrative units. Due to the great improvement in the level of agricultural implements, the NDVI, and the utility of ecosystem services in Kenli and Changyi, the level of LES reached level V.
Table 8.
The land ecological security index of the YRD between 2000 and 2020.
3.2.2. Spatial Attributes of Land Ecological Security
Software was employed to depict the geographical distribution of ecological land security across the YRD from 2000 to 2020 (Figure 5). The geographical distribution changed from “low in the north and high in the south” to “high in the east and low in the west” in 2000. Level I areas were distributed in Hekou due to the large saline–alkali area, low ecosystem services, and forest cover. Level II regions were dispersed in the northern section, while level III areas were clustered in the southern segment. Level IV areas were scattered throughout the counties. Regions like Zhanhua, Lijin, and Kenli transitioned from level II to level III in 2005, leading to an increase in level III area by 4364.79 km2. The area of level IV also expanded and accounted for 13.52%. In 2010, the level of LES of all administrative units improved, and the areas at level III and level IV continued to expand, accounting for 71.86% and 21.49% of the entire research area, respectively. In 2015, the geographical pattern of LES in the YRD was differentiated and roughly characterized by a spatial distribution of “high in the east and low in the west”. The level IV area changed greatly and was mainly distributed in Dongying, Guangrao, Boxing, and Changyi in the east. The proportion of level II areas increased and was predominantly located in Hekou due to the limited expanse of wetland and grassland and a comparatively low level of agricultural machinery. In 2020, the level of LES in the western area saw a significant improvement. Except for the southern part of Zouping, which is in level II, most of the area was converted to level IV, suggesting that against the backdrop of ecological civilization development, the land ecosystem of the YRD tends to be stable, with an ongoing enhancement in the condition of land ecological security. The level V region mainly occurs in the eastern Bohai Sea area due to the large number of wetlands and grasslands with more important ecological functions.

Figure 5.
The geographical pattern of the land ecological security status in the YRD from 2000 to 2020.
3.3. Multi-Scenario Simulation of Land Ecological Security in the YRD
3.3.1. Multi-Scenario Simulation of Landscape Structure Change
The results of the simulation of different types of landscapes according to different scenarios are presented in Table 9. In 2030, the business-as-usual scenario shows the trend of expansion of cultivated land and wetland to construction land, grassland, and other landscapes, reflecting the necessary trajectory influenced by ecological conservation and the pursuit of high-quality development within the Yellow River Basin. The cultivated land protection scenario shows an increasing trend in cultivated land and unused land. In contrast, the economic growth scenario diminishes the likelihood of land use change, resulting in the continued occupation of cultivated land and grassland. The ecological conservation scenario enhances the landscape configuration, leading to a greater share of wetland, forest land, and grassland.
Table 9.
The projected outcomes of diverse landscape types across various future scenarios by 2030.
3.3.2. Spatial–Temporal Characteristics of Land Ecological Security Under Multi-Scenario Simulation
Drawing from the outcomes of the simulation of multi-scenario landscape structures in 2030, the LES of the YRD in multiple scenarios was evaluated (Figure 6). The LES indices under the four scenarios of spontaneous progression, preservation of cultivated land, growth of the economy, and conservation of the ecosystem are 0.5841, 0.6224, 0.6123, and 0.6341, respectively, which are between level IV and level V. The results showed significant differences in the LES index based on different scenarios, with the LES index showing increasing trends due to ongoing economic and societal advancement and the reinforcement of environmental conservation measures. The geographical distribution of LES in four scenarios was “eastern elevation and western depression”. The ecological protection scenario saw a significant increase in level V areas, primarily enhancing the safeguarding of forest land, grassland, and wetland and promoting ecosystem services, landscape fragmentation, and landscape stability. In scenarios prioritizing the preservation of cultivated land and economic expansion, the level V area experiences further enlargement in contrast to the standard operating scenario, accounting for 74.64% and 70.68%, respectively. The level V area was focused on the northeast region of the YRD. The area of level IV and level III was reduced. The level of the LES of these five counties has not yet changed to level V. In line with the ecological conservation scenario, the area of level III is only 1 km2, and the level IV area accounted for 11.45%. The level V area increased significantly, accounting for 88.54%, an increase of 19,109.04 km2 compared to 2020, showing a spatially concentrated distribution. This is chiefly the result of the enhanced protection of forest land, grassland, and wetland under this scenario, which increases ecosystem service values, reduces landscape fragmentation, improves the stability of the landscape structure, and continuously expands the high-value area of LES within the research area.

Figure 6.
The multi-scenario simulation of land ecological security in the YRD in 2030.
4. Discussion
4.1. Contribution
This study examined the ecological land security of 19 counties in the YRD from 2000 to 2020, focusing on alterations in landscape structure. This study expanded the research horizons concerning the Yellow River Basin, offering a new viewpoint on ecological conservation and sustainable development in the region. The investigation integrated measures of landscape configuration and the value of ecosystem services into the assessment framework, yielding a more holistic view of how the land ownership system influences the security of ecological land. In contrast to existing studies on land ecological security [58,59], this study not only relied on the preliminary assessment predicated on stress, condition, and reaction but also evaluated the alterations in terrestrial ecological integrity over the study’s timeframe, while accounting for shifts in landscape configuration. This method provides in-depth insight into how the land system intrinsically affects land ecological security and allows for a multi-dimensional assessment of LES. The GeoSOS-FLUS model was employed to simulate the landscape structure, and the GM (1,1) model was applied to simulate several ecological land security scenarios. The CA-Markov model frequently serves as a tool in current studies for multi-scenario simulation of LES [60,61]. These types of research only perform a numerical prediction of the time series within a single scenario. This research, however, employed the GeoSOS-FLUS model to simulate the landscape structure. Using these simulation outcomes, the GM (1,1) model was utilized to simulate the multiple scenarios of land ecological security, which better reflected the influence of the landscape structure on land ecological security. This research also produced a geographical and chronological evolution of ecological land security trends in the YRD, thereby expanding the research scope of multi-scenario simulation. The study proposes optimization and control countermeasures derived from the current state of the YRD and simulation results, offering guidance for the sustainable development and stimulating inquiry into excellence in additional domains.
This study displayed that the configuration of the landscape exerts varying levels of influence on the landscape of each county, with some counties experiencing greater fragmentation and lower stability due to human activities and urbanization. The research results are roughly the same as those of previous studies [62]. However, as ecological protection efforts intensify, the landscape structure stabilizes, characterized by an annual growth in the wetland area. This trend ensured a relatively consistent provision of various ecological service functions and contributed to the overall increase in the LES index of the YRD.
This research considered the impact of the landscape configuration on ecological land security in multiple scenarios, offering a foundation for land utilization strategy and the safeguarding of ecological integrity within the research region. The no-intervention business-as-usual scenario is expected to encroach on cultivated land, grassland, and forest land, resulting in the lowest LES index. The preservation scenario for cultivated land favors the enlargement of cultivated land and grassland, but the wetland area is expected to decrease, leading to a growth in unused land and construction land. The economic development scenario favors urbanization around existing infrastructure, increasing construction land and negatively affecting cultivated land, forest land, wetland, and the overall LES index. The scenario that focuses on ecological protection considers an increase in forest land, grassland, and wetland. Compared to other scenarios, there is no clear evidence of the increased cultivated and construction land. In this scenario, the YRD obtains the largest safety level and the highest LES index. This study recommends prioritizing cultivated land protection and ecological safeguards to achieve a balanced progression in economic growth, environmental conservation, and food security.
4.2. Limitations
This research had limitations: First, constructing a land ecological safety evaluation index framework and selecting indicators are key to assessment research. Due to insufficient data and the availability of some data, some important indicators were not selected, such as the severity of soil erosion, which might exert a certain influence on the evaluation outcomes. Second, the GeoSOS-FLUS model that was utilized to forecast the trend in the evolution of the landscape structure and land ecological security expected to occur in 2030 lacked a long-term sequence simulation analysis. In addition, in the current process of scenario simulation research, the assumption that policy regulation methods remain unchanged may lead to biases in the comprehensiveness and timeliness of the research results. In subsequent studies, basic data, control standards, policy regulations, and other elements will be further incorporated into the model operations.
4.3. Policy Implications
Research on ecological land security regulation and condition assessment is crucial for consolidating ecological barriers in the YRD, ensuring the protection of ecology and culture alongside high-quality development. This study offers a range of recommendations to foster the integrated advancement of landscape structure and ecological land security, thereby fulfilling the nation’s ecological conservation and sustainable goals:
- (1)
- Adhere to the boundary of permanently protected essential cultivated land, optimize the landscape structure, strengthen the conservation and restoration of cultivated land, strengthen the rise in agricultural land, promote the continuous development of cultivated land, and build a “trinity” pattern of cultivated land protection.
- (2)
- Stop the increase in construction land and strengthen the management of forest land, grassland, and wetlands. The wetland area has experienced different degrees of degradation. In the future, it will be crucial to strictly abide by the ecological red line, improve wetland restoration, monitor, and assess systems, implement wetland classification management, and increase the value of its ecosystem services.
- (3)
- Actively develop unused land and establish a three-dimensional and long-term monitoring platform for to stock unused land resources. For areas with more unused land resources, we should clarify their area and layout, undertake reasonable planning, determine the use of unused land, and determine unreasonable land use changes promptly during the development process.
- (4)
- Adhere to the ecological priority, strengthen the public awareness of environmental protection, increase investment in land ecological environment infrastructure, continue to explore new technologies for alkaline land management in the YRD, and strictly prohibit the blind and uncontrolled development of natural resources, so as to improve the ecological environment protection system and develop efficient ecological agriculture.
- (5)
- Optimize the industrial structure of the region and continue to advance the new industrialization strategy, centered around a green circular economy, to reduce the environmental impact caused by industrial activities. This measure aims to foster the balanced growth of local economic prosperity and terrestrial ecological safety, to promote the formation of the YRD. The endogenous driving force with innovation as the core realizes the new development pattern of internal and external linkage.
- (6)
- Establish a regional integration model by leveraging the influence of the central city, which has abundant resources and a comparatively high level of ecological land security. Neighboring regions should focus on improving their environmental development, leveraging their geographic advantages, and fostering cooperation and interconnectivity between development industries. The government should prioritize development issues, provide specific financial support, improve transportation networks, foster cooperation, and establish integrated development models in the YRD.
5. Conclusions
Currently, numerous studies on land ecological security focus on spatial patterns, driving factors, regulatory responses, or numerical predictions across time series under a single scenario, with limited integration of landscape patterns into multi-scenario simulations of land ecological security. In response, incorporating the landscape structure into land ecological security evaluation indicators and conducting simulations and predictions for different scenarios can provide more intuitive and comprehensive advice for local land policy formulation. This study examined the change in landscape structure and ecological land security in 19 counties (cities and districts) in the YRD. The landscape configuration metric approach, the NES model, and the GeoSOS-FLUS model were utilized to investigate spatiotemporal changes. Furthermore, four scenarios—business-as-usual, cultivated land protection, economic expansion, and ecological protection—were established to project future trends. This study found that cultivated land was the dominant landscape type between 2000 and 2020. The regions of cultivated land, forest, and construction land demonstrated an upward surge at first, with a subsequent fall. The landscape structure shifted from fragmentation to patchy irregularities, with trajectories of landscape change mainly moving from cultivated to construction land. The LES index exhibited an upward trend within the study duration and the spatial variance features of land ecological security evolved from “northernly depressed and southernly elevated” to “eastern elevation and western depression”. However, its differences were narrowed. In 2030, significant differences were shown in the LES in different scenarios, and an upward trend was observed compared to that in 2020. This prediction underscores the importance of formulating scientific and reasonable land management strategies to ensure the sustainable exploitation of land resources and the protection of the ecological environment. In summary, this study not only reveals the intrinsic link between landscape structural changes and ecological land security but also integrates the concepts of sustainable land use and governance, providing an important basis for formulating scientific and reasonable strategies for sustainable land use and governance.
Author Contributions
L.H.: Conceptualization, methodology, software, validation, formal analysis, resources, data curation, writing—original draft, writing—review and editing, funding acquisition; Y.Q.: conceptualization, methodology, software, validation, formal analysis, supervision, advice; S.L.: conceptualization, formal analysis, data curation, writing—review and editing; L.S.: methodology, conceptualization, formal analysis, data curation, writing—review and editing, supervision; M.Z.: methodology, formal analysis, data curation, writing—review and editing; H.J.: methodology, conceptualization, resources, validation. All authors have read and agreed to the published version of the manuscript.
Funding
This research was funded by the general project of the National Natural Science Foundation of China: Grant No. 42077434 and National Natural Science Foundation of China: Grant No. 42471295.
Data Availability Statement
All relevant data sets in this study are described in the manuscript.
Conflicts of Interest
The authors declare no competing interests.
References
- Zhang, Y.; Hu, Z.; Zhou, H.; Cui, G.; Li, J. Spatial and Temporal Distribution Characteristics on Land Ecological Security Along Main Stream of Yellow River in Shaanxi Province. Bull. Soil Water Conserv. 2022, 42, 258–267. [Google Scholar] [CrossRef]
- Liu, Y.; Jing, Y.; Han, S. Ecological function zoning of Nansi Lake Basin in China based on ecosystem service bundles. Environ. Sci. Pollut. Res. 2023, 30, 77343–77357. [Google Scholar] [CrossRef]
- Xiong, J. Review, Difficulties and Thinking of Land Ecological Security Evaluation. Geog-Raphy Geo-Inf. Sci. 2018, 34, 71–76. [Google Scholar] [CrossRef]
- Hu, X.; Dong, C.; Zhang, Y. Impacts of Cropland Utilization Patterns on the Sustainable Use Efficiency of Cropland Based on the Human–Land Perspective. Land 2024, 13, 863. [Google Scholar] [CrossRef]
- Lv, Y.; Chen, L.; Fu, B. Analysis of the Integrating Approach on Landscape Pattern and Ecological Processes. Prog. Geogr. 2007, 26, 1–10. [Google Scholar] [CrossRef]
- Su, H.; Wu, C. Land use eco-risk assessment and its spatio-temporal variation of agroforestry ecotone based on landscape structure. Econ. Geogr. 2017, 37, 158–165. [Google Scholar] [CrossRef]
- Wang, B.; Pan, K. Analysis of the landscape pattern and ecological security of Yinchuan City from 1980 to 2018. J. Lanzhou Univ. 2022, 58, 27–38. [Google Scholar] [CrossRef]
- Xu, Q.; Wang, P.; Wang, S.; Ding, M.; Zhang, H. Influence of landscape structures on river water quality at multiple spatial scales: A case study of the Yuan river watershed. China Ecol. Indic. 2021, 121, 107226. [Google Scholar] [CrossRef]
- Li, Y.; Geng, H. Evolution of Land Use Landscape Patterns in Karst Watersheds of Guizhou Plateau and Its Ecological Security Evaluation. Land 2022, 11, 2225. [Google Scholar] [CrossRef]
- Zhang, Z.; Han, J.; Zhang, Y.; Sun, Y.; Sun, Z. Connotation, status, and governance of land ecological security in China’s new urbanization: Recent advances and future prospects. Environ. Sci. Pollut. Res. Int. 2023, 30, 119654–119670. [Google Scholar] [CrossRef]
- Yao, L.; Halike, A.; Yao, K.; Wei, Q.; Tang, H.; Tuheti, B.; Luo, J.; Duan, Y. Dynamic simulation of landscape ecological security and analysis of coupling coordination degree: A case study of Bole. PLoS ONE 2024, 55, 1932–6203. [Google Scholar] [CrossRef] [PubMed]
- Wu, Y.; Qiu, L. Evaluation of Land Ecological Security in the Guanzhong Plain Urban Agglomeration. Soil Water Conserv. China 2024, 2, 52–56. [Google Scholar] [CrossRef]
- Han, L.; Song, Z.; Zhang, M.; Ding, L. Visual Analysis of China’s Land Ecological Security Based on CiteSpace. J. Yunnan Agric. Univ. 2022, 16, 141–149. [Google Scholar] [CrossRef]
- Fu, B.J.; Liu, S.H.; Lu, Y.H. Comparing the soil quality changes of different land uses determined by two quantitative methods. Res. Environ. Sci. 2003, 15, 167–172. [Google Scholar] [CrossRef]
- He, N.; Zhou, Y.; Wang, L.; Li, Q.; Liu, J.Y.; Li, M.Y. Spatiotemporal evaluation and analysis of cultivated land ecological security based on the DPSIR model in Enshi autonomous prefecture, China. Ecol. Indic. 2022, 145, 109619. [Google Scholar] [CrossRef]
- Xu, S.; Yang, G.; Zhang, C.; Sun, D.; Sun, X. Study on evaluation of urban land ecological environment security based on PSR model: A case study of Qingdao city. Ecol. Eng. 2019, 37, 199–204. [Google Scholar] [CrossRef]
- Wang, H.; Qin, F.; Zhang, X. A spatial exploring model for urban land ecological security based on a modified artificial bee colony algorithm. Ecol. Inform. 2019, 50, 51–61. [Google Scholar] [CrossRef]
- Yu, W.; Cai, H.; Zhang, Y.; Lyu, B. The Early-warning and Regulation of Land Ecological Security: A Case Study of Hubei Province. Environ. Sci. Technol. 2018, 41, 189–196. [Google Scholar] [CrossRef]
- Zhang, N.; Shi, S.; Li, B.; Li, H.; Li, S. Evaluation and Prediction of Land Ecological Security Based on PSR Model—Take Shenyang as an Example. Chin. J. Soil Sci. 2022, 53, 28–35. [Google Scholar] [CrossRef]
- Huang, L.J.; Yang, P. Identification and Optimization of Land Ecological Security Pattern in Wuhan Metropolitan Area Based on Machine Learning. J. Ecol. Rural. Environ. 2020, 36, 862–869. [Google Scholar] [CrossRef]
- Ye, H.; Bai, D.; Tan, S.; Shao, D.; Wang, J. Evaluating the ecological security of land resources based on multi-source data in the Altay Region of China. J. Resour. Ecol. 2021, 12, 757–765. [Google Scholar] [CrossRef]
- Ye, H.; Ma, Y.; Dong, L. Land ecological security assessment for Bai autonomous prefecture of Dali based using PSR model–with data in 2009 as case. Energy Procedia 2011, 5, 2172–2177. [Google Scholar] [CrossRef]
- Cheng, H.; Zhu, L.; Meng, J. Fuzzy evaluation of the ecological security of land resources in mainland China based on the Pressure-State-Response framework. Sci. Total Environ. 2022, 804, 150053. [Google Scholar] [CrossRef] [PubMed]
- Liu, S.; Xu, L.; Zhang, J. Spatiotemporal change of land ecological security in Xinjiang. Acta Ecol. Sin. 2019, 39, 3871–3884. [Google Scholar]
- Feng, Y.; Liu, Y.; Liu, Y. Spatially explicit assessment of land ecological security with spatial variables and logistic regression modeling in Shanghai, China. Stoch. Environ. Res. Risk Assess. 2017, 31, 2235–2249. [Google Scholar] [CrossRef]
- Tran, D.; Pearson, D.; Palmer, A.; Lowry, J.; Gray, D.; Dominati, E. Quantifying spatial non-stationarity in the relationship between landscape structure and the provision of ecosystem services: An example in the New Zealand hill country. Sci. Total Environ. 2022, 808, 152126. [Google Scholar] [CrossRef]
- Xiao, D.; Zhao, Y.; Sun, Z.; Zhang, G. Study on the variation of landscape pattern in the west suburbs of Shenyang. Chin. Appl. Ecol. 1990, 1, 75–84. [Google Scholar]
- Hagen-Zanker, A. A computational framework for generalized moving windows and its application to landscape pattern analysis. Int. J. Appl. Earth Obs. Geoinf. 2016, 44, 205–216. [Google Scholar] [CrossRef]
- Xu, J.; Yue, W.; Tan, W. A Statistical Study on Spatial Scaling Effects of Urban Landscape Pattern: A Case Study of the Central Area of the External Circle Highway in Shanghai. Acta Ecol. Sin. 2004, 6, 1058–1067. [Google Scholar] [CrossRef]
- Fu, F.; Liu, W.; Wu, D.; Deng, S.; Bai, Z. Research on the spatiotemporal evolution of land use landscape pattern in a county area based on CA-Markov model. Sustain. Cities Soc. 2022, 80, 103760. [Google Scholar] [CrossRef]
- Gao, Y.; Wu, Z.; Lou, Q.; Huang, H.; Cheng, J.; Chen, Z. Landscape ecological security assessment based on projection pursuit in Pearl River Delta. Environ. Monit. Assess 2012, 184, 13. [Google Scholar] [CrossRef] [PubMed]
- Jiao, G.Y.; Yang, X.Z.; Huang, Z.Q.; Zhang, X.; Lu, L. Evolution characteristics and possible impact factors for the changing pattern and function of “Production-Living-Ecological” space in Wuyuan county. J. Nat. Resour. 2021, 36, 1252–1267. [Google Scholar] [CrossRef]
- Fujihara, M.; Kikuchi, T. Changes in the landscape structure of the Nagara River Basin, central Japan. Landsc. Urban Plan. 2005, 70, 271–281. [Google Scholar] [CrossRef]
- Zhang, W.; Yi, S.; Fan, X.; Zhang, X.; Liu, X.; Fang, Y.; Ma, H.; Liu, F.; Liang, Y. Relationship between ecosystem multifunctionality and plant diversity in different dimensions in the Yellow River Delta. Wetl. Sci. 2023, 21, 1–8. [Google Scholar] [CrossRef]
- Ouyang, Z.; Zhu, C.; Yang, G.; Xu, W.; Zheng, H.; Zhang, Y.; Xiao, Y. Gross ecosystem product: Concept, accounting framework and case study. Acta Ecol. Sin. 2013, 33, 6747–6761. [Google Scholar] [CrossRef]
- Xun, L.; Wang, Z. Landscape ecological risk assessment and its driving factors of multi-mountainous city. Ecol. Indic. 2023, 146, 146. [Google Scholar] [CrossRef]
- Zhang, R.; Lu, J. Simulation of Land Use Pattern Evolution from a Multi-Scenario Perspective: A Case Study of Suzhou City in Anhui Province, China. Int. J. Environ. Res. Public Health 2021, 18, 921. [Google Scholar] [CrossRef]
- Talukdar, S.; Singha, P.; Mahato, S.; Pal, S.; Liou, Y.A.; Rahman, A. Land-use land-cover classification by machine learning classifiers for satellite observations—A review. Remote Sens. 2020, 12, 1135. [Google Scholar] [CrossRef]
- Wang, X.; Bao, Y. Research methods on the dynamic change of land use. Prog. Geogr. Sci. 1999, 1, 83–89. [Google Scholar]
- Verburg, P.H.; Van Berkel, D.B.; Van Doorn, A.; van Eupen, M.; van den Heiligenberg, H.A. Trajectories of land use change in Europe: A model-based exploration of rural futures. Landsc. Ecol. 2010, 25, 217–232. [Google Scholar] [CrossRef]
- Hu, F.; Zhang, Y.; Guo, Y.; Zhang, P.; Lyu, S.; Zhang, C. Spatial and temporal changes in land use and habitat quality in the Weihe River Basin based on the PLUS and InVEST models and predictions. Arid. Land Geogr. 2022, 45, 1125–1136. [Google Scholar] [CrossRef]
- Liu, X.; Liang, X.; Li, X.; Xu, X.; Ou, J.; Chen, Y.; Pei, F. A future land use simulation model (FLUS) for simulating multiple land use scenarios by coupling human and natural effects. Landsc. Urban Planning 2017, 168, 94–116. [Google Scholar] [CrossRef]
- Ji, Z.; Wei, H.; Xue, D.; Liu, M.; Cai, E.; Chen, W.; Feng, X.; Li, J.; Lu, J.; Guo, Y. Trade-off and projecting effects of land use change on ecosystem services under different policies scenarios: A case study in central China. Int. J. Environ. Res. Public Health 2021, 18, 3552. [Google Scholar] [CrossRef]
- Yang, Z.; Yu, W.; He, P. Ecological Security Assessment of Jingzhou City Based on GeoSOS-FLUS Model. Tianjin Agric. Sci. 2024, 30, 47–54. [Google Scholar] [CrossRef]
- Yang, Q.; Pu, L.; Huang, S. Review of Urbanization-Associated Farmland Research in China: A Sustainability Perspective. Land 2024, 13, 534. [Google Scholar] [CrossRef]
- Liu, C.; Wu, X.; Wang, L. Analysis on land ecological security change and affect factors using RS and GWR in the Danjiangkou Reservoir area, China. Appl. Geogr. 2019, 105, 1–14. [Google Scholar] [CrossRef]
- Liu, J.; Wang, D.; Sun, R.; Wang, F.; Hu, B.; Cheng, J.; Sun, Z. Study on spatial relevance of ecological-land loss based on change trajectory analysis method. Geogr. Res. 2020, 39, 103–114. [Google Scholar] [CrossRef]
- Simic, V.; Gokasar, I.; Deveci, M.; Karakurt, A. An integrated CRITIC and MABAC based type-2 neutrosophic model for public transportation pricing system selection. Socio-Econ. Plan Sci. 2022, 80, 101157. [Google Scholar] [CrossRef]
- Fu, W.Z.; Chu, L.P. Research on the evaluation of high-quality development of manufacturing industry from the perspective of integration of the Yangtze River Delta—TOPSIS evaluation model based on improved CRITICAL-Entropy weight method. J. Ind. Tech. Ecol. 2020, 39, 145–152. [Google Scholar] [CrossRef]
- Alipbeki, O.; Alipbekova, C.; Sterenharz, A.; Toleubekova, Z.; Makenova, S.; Aliyev, M.; Mineyev, N. Analysis of Land-Use Change in Shortandy District in Terms of Sustainable Development. Land 2020, 9, 147. [Google Scholar] [CrossRef]
- Kong, F.Z.; Cui, W.L.; Xi, H.H. Spatial–temporal variation, decoupling effects and prediction of marine fishery based on modified ecological footprint model: Case study of 11 coastal provinces in China. Ecol. Indic. 2021, 132, 108271. [Google Scholar] [CrossRef]
- Pan, Z.; He, J.; Liu, D.; Wang, J. Predicting the joint effects of future climate and land use change on ecosystem health in the Middle Reaches of the Yangtze River Economic Belt, China. Appl. Geogr. 2020, 124, 102293. [Google Scholar] [CrossRef]
- Wang, H.; Zhang, C.; Yao, X.; Yun, W.; Ma, J.; Gao, L.; Li, P. Scenario simulation of the tradeoff between ecological land and farmland in black soil region of Northeast China. Land Use Policy 2022, 114, 105991. [Google Scholar] [CrossRef]
- Zhang, M.; Bao, Y.; Xu, J.; Han, A.; Liu, X.; Zhang, J.; Tong, Z. Ecological security evaluation and ecological regulation approach of East-Liao River basin based on ecological function area. Ecol. Indic. 2021, 132, 108255. [Google Scholar] [CrossRef]
- Gao, X.; Wang, G.; Innes, J.L.; Zhao, Y.; Zhang, X.C.; Zhang, D.H.; Mi, F. Forest ecological security in China: A quantitive analysis of twenty-five years. Glob. Ecol. Conserv. 2021, 32, e01821. [Google Scholar] [CrossRef]
- Su, Y.; Liu, G.; Zhao, J.; Guo, L.; Lin, F.; Niu, J. Land Ecological Security Early Warning Measure and Spatial-Temporal Pattern Evolution in Fenhe River Basin During 2006–2018. J. Soil Water Conserv. 2021, 41, 144–151. [Google Scholar] [CrossRef]
- Wu, Y.; Jiang, M.; Yang, S. Security Measurement and Early Warning of Regional Innovation Ecosystem in Shaanxi Province from Ecological Niche Perspective. Bull. Soil Water Conserv. 2024, 44, 86–96. [Google Scholar] [CrossRef]
- Wang, N.; Zhu, P.; Zhou, G.; Xing, X.; Zhang, Y. Multi-Scenario Simulation of Land Use and Landscape Ecological Risk Response Based on Planning Control. Int. J. Environ. Res. Public Health 2022, 19, 14289. [Google Scholar] [CrossRef]
- Yu, Z.; Li, M.; Qian, Y.; Peng, R.; Yang, G. Land Use Change and Its Ecological Effects in Three Gorges Reservoir Area Basedon CA_Markov Model with Multiple Scenarios Simulation. Res. Soil Water Conserv. 2024, 31, 363–372. [Google Scholar] [CrossRef]
- Zhao, L.; Liu, G.; Xian, C.; Nie, J.; Xiao, Y. Simulation of Land Use Pattern Based on Land Ecological Security: A Case Study of Guangzhou, China. Int. J. Environ. Res. Public Health 2022, 19, 9281. [Google Scholar] [CrossRef]
- Zhang, H.; Yan, Q.; Xie, F.; Ma, S. Evaluation and Prediction of Landscape Ecological Security Based on a CA-Markov Model in Overlapped Area of Crop and Coal Production. Land 2023, 12, 207. [Google Scholar] [CrossRef]
- Han, L.; Song, Z.Y. Dynamic Evaluation and Obstacle Factor Diagnosis of Cultivated Land Ecological Security-A Case Study at Counties Along Lower Yellow River. Bull. Soil Water Conserv. 2021, 41, 148–156+164. [Google Scholar] [CrossRef]
Disclaimer/Publisher’s Note: The statements, opinions and data contained in all publications are solely those of the individual author(s) and contributor(s) and not of MDPI and/or the editor(s). MDPI and/or the editor(s) disclaim responsibility for any injury to people or property resulting from any ideas, methods, instructions or products referred to in the content. |
© 2024 by the authors. Licensee MDPI, Basel, Switzerland. This article is an open access article distributed under the terms and conditions of the Creative Commons Attribution (CC BY) license (https://creativecommons.org/licenses/by/4.0/).