Article

Spatiotemporal Evolution and Drivers of Ecological Quality in the Tengger Desert (2001–2021)

1
Desert Management College, Inner Mongolia Agricultural University, Hohhot 010018, China
2
Key Laboratory of State Forest Administration for Desert Ecosystem Protection and Restoration, Hohhot 010018, China
3
Inner Mongolia Academy of Forestry Sciences, Hohhot 010010, China
*
Author to whom correspondence should be addressed.
Land 2024, 13(11), 1838; https://doi.org/10.3390/land13111838
Submission received: 1 October 2024 / Revised: 30 October 2024 / Accepted: 4 November 2024 / Published: 5 November 2024

Abstract

:
Desert ecosystems, particularly in arid regions like the Tengger Desert, are highly sensitive to both anthropogenic activities and climate change, making the monitoring and evaluation of ecological quality critical for sustainable management and restoration efforts. This study analyses the spatiotemporal evolution of ecological quality in the Tengger Desert from 2001 to 2021 using the Remote Sensing Ecological Index (RSEI), incorporating meteorological factors (temperature, precipitation, wind speed), topographical factors (elevation, slope, relief) and anthropogenic indices (land use and land cover). The mean RSEI fluctuated between 0.1542 and 0.2906, indicating poor ecological quality, with a peak in 2008 attributed to national ecological projects. Despite initial improvements, overall ecological quality declined at a rate of 0.0008 a−1 from 2008 to 2021. Spatially, degradation was most pronounced in the central and southern areas. Due to sand-binding engineering in the Tengger Desert in 2008 and the mountain climate suitable for vegetation growth, improvements occurred in the northeast and southwest. Moran’s I and Hurst index analyses revealed significant spatial clustering of ecological quality and persistence of degradation trends, with over 49.53% of the area projected to experience further deterioration. Geodetector analysis identified land use and land use cover as the most influential factors on RSEI, especially in combination with wind speed, temperature, and precipitation, underscoring the role of both human activities and climate. The study highlights the need for sustained ecological management, particularly in areas showing continuous degradation, to prevent further ecological deterioration.

Graphical Abstract

1. Introduction

The socio-economic-ecological integrated system reflects the interaction between human activities and the natural environment, influencing the sustainable development of a region [1,2]. The Tengger Desert, as a fragile ecosystem, is vulnerable to habitat changes driven by both human activities and climate change [3]. Studying the evolution of ecological quality and driving mechanisms in the fragile ecosystem can provide insights into better environmental protection practices and policies.
Ecological quality refers to the suitability, harmonization and sustainability of a whole system or subsystem of components for human survival and overall development under specific time and regional conditions [1]. Ecological Quality Assessment is an essential tool for understanding and managing the natural environment. Current methods for monitoring and evaluating ecological quality include the hierarchical analysis method [4,5], the ecological footprint method [6,7], and the comprehensive ecological index method [8]. However, these methods face challenges in long-term ecological monitoring and evaluation of large regions, particularly in assigning and determining index weights for comprehensive indicators [9,10]. In comparison, satellite remote sensing technology offers convenient data acquisition with wide coverage and high spatial resolution. It integrates multidisciplinary knowledge, making it indispensable for environmental monitoring, ecological assessment, resource evaluation, etc., [11,12,13,14]. Scholars have extensively studied the feasibility of remote sensing indices for monitoring and evaluating environmental quality, including using the Normalized Difference Vegetation Index (NDVI) and Enhanced Vegetation Index (EVI) to monitor vegetation growth and cover [15,16,17], using standardised precipitation evapotranspiration index for assessing drought [18,19], applying a surface temperature index for evaluating urban heat island effects [20,21], etc. However, single indicator-based approaches typically focus on one specific aspect of the ecosystem. Given the complexity of natural systems, it is questionable whether regional ecological quality can be comprehensively evaluated using just one indicator.
With the in-depth exploration and utilization of remote sensing technology and mathematical models, ecological quality evaluation methods have been substantially expanded and improved. The Remote Sensing Ecological Index (RSEI) integrates four key indicators: greenness, humidity, dryness, and heat [22,23]. This approach avoids errors in the definition of weights caused by individual characteristics and provides an objective and reliable technique to more accurately visualize the spatial and temporal changes in regional ecological quality. The RSEI model provides a valuable tool for ecological environment assessment in different regions. However, these indicators mainly apply to areas where the natural environment supports human activities, such as cities, suburbs, managed forests, riparian, etc. [24,25,26]. They are less suitable for regions with extreme environmental conditions, e.g., desert ecosystems. To address the limitations of the RSEI in practical applications, scholars have continuously refined and enhanced it from various perspectives [27]. Firozjaei et al. (2021) [28] incorporated the Soil Index (NDSI) into the original framework, creating a remote sensing ecological index for arid regions. This index was used to evaluate and analyse the ecological conditions of several European cities. Chen et al. (2024) [29] introduced the Desertification Index (DI), and Ju et al. (2023) [30] introduced the Desiccation Index (SI), to study the ecological status of dryland desert oasis areas. Xu et al. (2021) [31] introduced the Land Cover Type Abundance (AI) and developed a regional scale remotely-sensed ecological index model. This model was found to be highly consistent with the environmental indices provided by the Ministry of Ecology and Environment (MOE) at the national scale in China. Therefore, it is feasible to monitor and evaluate the ecological environment using the RSEI, and the improved versions of this index can more accurately reflect the ecological quality of different regions.
The Tengger Desert faces enormous ecological challenges due to its arid climate, sparse population, and backward socio-economic conditions, resulting in a lack of human and financial resources to maintain and protect the ecological environment of the Tengger Desert [32]. Several restoration projects carried out by governments, local residents or non-profit environmental conservation organizations provide a unique opportunity to assess the ecological quality of the desert. Despite some relevant research, studies specifically addressing the ecological quality of the Tengger Desert remain limited. For example, Wang et al. [33] explored the interaction between vegetation coverage and climate factors, identifying precipitation as the primary driver of vegetation growth. However, focusing solely on a single index, like vegetation coverage, is insufficient to fully capture ecological quality. Moreover, their study, limited to four sites, does not adequately represent the broader ecological dynamics of the Tengger Desert. Ecological processes are inherently dynamic, open, and cyclical, shaped by global climate change and regional activities, resulting in temporal fluctuations [34]. Thus, research on ecological quality must extend beyond climate change and address deeper, intrinsic drivers of human activity. This paper adopts a more comprehensive approach to understanding the intricate interactions between human activities and the ecological environment in the Tengger Desert.
To address these challenges, this study analyses the spatial and temporal patterns and trends of ecological quality in the Tengger Desert from 2001 to 2021 using RSEI. Specifically, the research aims to (1) assess the spatiotemporal patterns and trends of RSEI through Theil–Sen slope estimation and the Mann-Kendall test; (2) explore the spatial correlation of RSEI using Moran’s I; (3) predict future trends with the Hurst index; and (4) examine the driving effects of natural and anthropogenic factors on RSEI using Geodetector. By adopting this comprehensive approach, the study seeks to lay a foundation for monitoring of regional ecological changes, assessing spatial ecological patterns, and supporting effective ecological management and protection efforts.

2. Materials and Methods
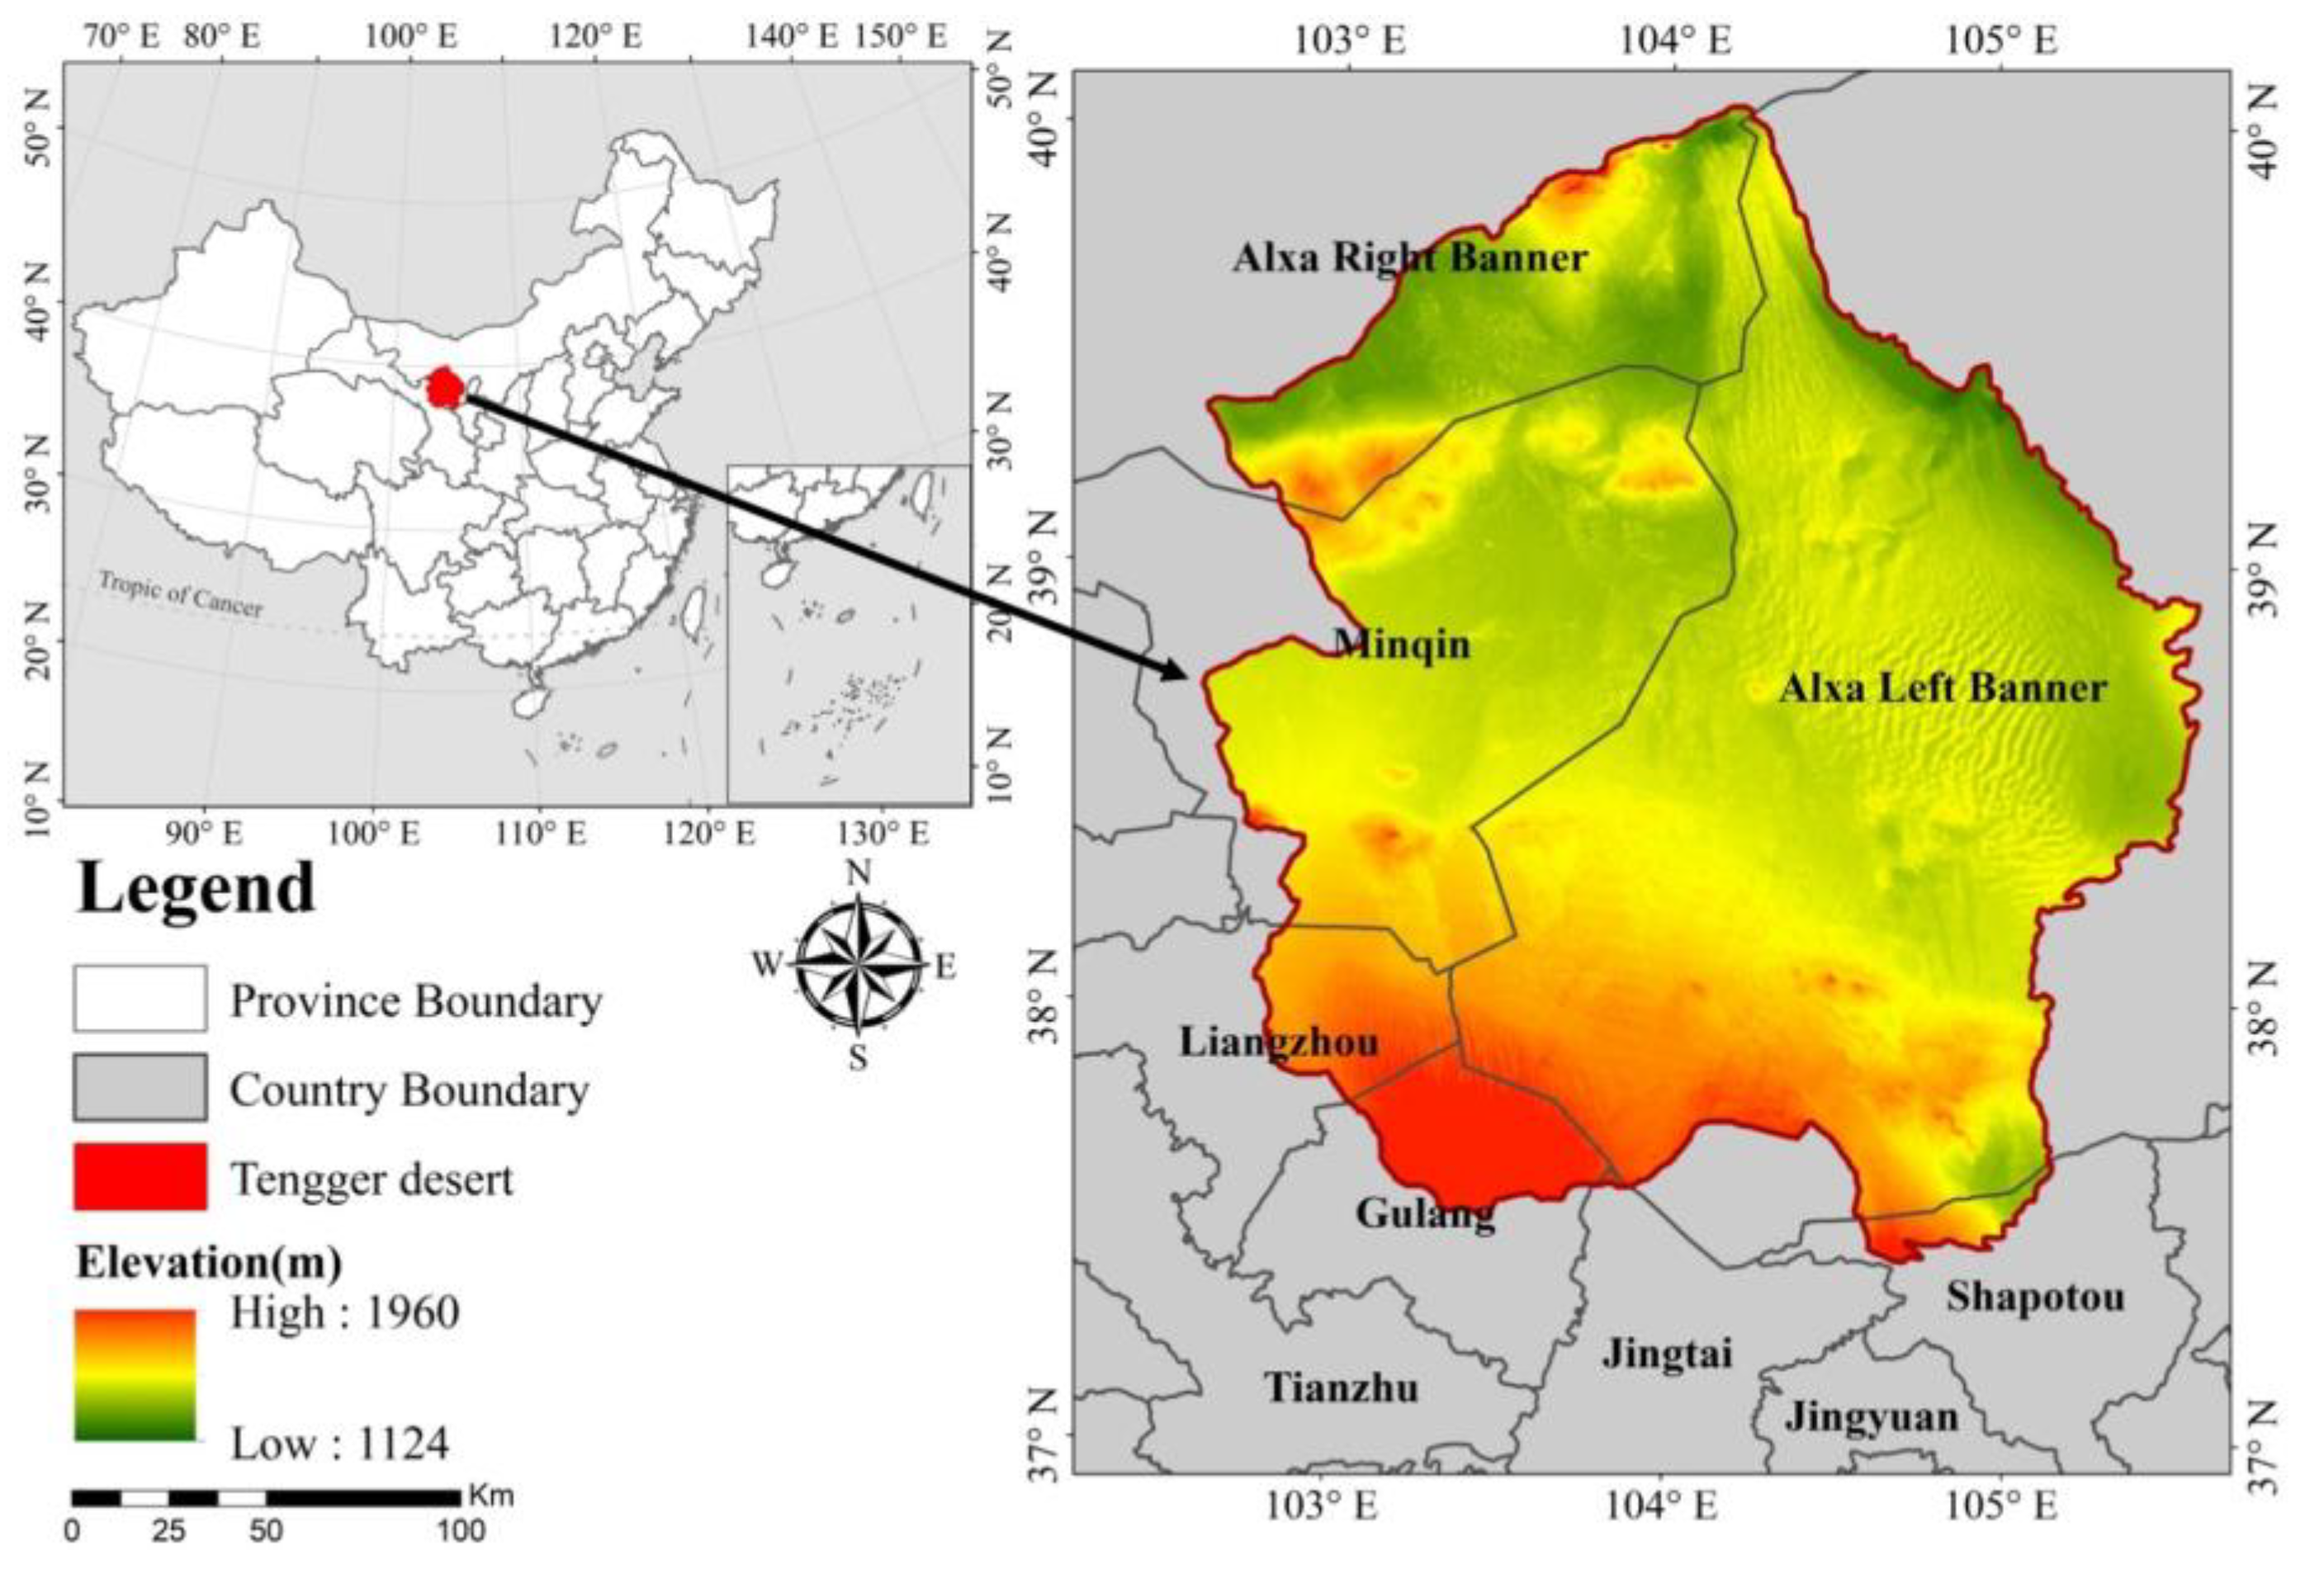
2.1. Study Area

The Tengger Desert is in the southeastern part of Alxa League (37°32′–40°00′ N, 102°15′–105°41′ E), situated in the north of China. It borders the Badain Jaran Desert to the northwest and the Ulanbuh Desert to the northeast, with its southern and southwestern sections extending into Ningxia and Gansu provinces (Figure 1). Covering a total area of 49,700 km2, the terrain gradually slopes from west to east, with elevations ranging from 1124 to 1960 m above sea level. The Tengger Desert exhibits distinct continental climate characteristics, with an annual average temperature of 7.0–9.7 °C [35] and annual precipitation ranging from 186 mm [36]. The growing season (May–September) experiences a potential evapotranspiration of 2300 to 2500 mm, indicative of its temperate continental arid climate [37,38]. The desert’s major landforms include sand dunes, lake basins, mountains, residual hills, and flatlands, with sand dunes occupying approximately 71% of the area. These dunes are primarily composed of lattice dunes and crescent-shaped dune chains.

2.2. Data Collection

2.2.1. Ecological Quality Data

The ecological quality data for this study were sourced from the China High-Resolution Ecological and Environmental Quality Dataset (CHEQ) via the National Earth System Science Data Center (http://www.geodata.cn, accessed on 4 June 2024). This dataset, developed by Xu Dong et al. [31], using principal component analysis on five indices—humidity (WET), greenness (NDVI), Land Surface Temperature (LST), Normalized Difference Bare Soil Index (NDBSI), and Abundance Index for land cover type (AI)—was processed using the Google Earth Engine platform and stored as raster data. It provides annual RSEI data at a 500 m resolution for China from 2001 to 2021, based on MOD09A1, MOD11A2, and MCD12Q1 datasets. Validation has shown high consistency with the Environmental Index (EI) from the Ministry of Ecology and Environment of China, demonstrating excellent temporal stability and continuity [39]. Therefore, this study uses the RSEI from the CHEQ dataset as the standard for ecological quality evaluation. To further understand the spatial and temporal changes of ecological quality in the Tengger Desert, the natural breakpoint method is used to divide the RSEI value into five levels [40]: poor (0–0.2), fair (0.2–0.4), moderate (0.4–0.6), good (0.6–0.8) and excellent (0.8–1). The years 2001, 2006, 2011, 2016 and 2021 were selected as representative years to analyse the ecological quality of the Tengger Desert.

2.2.2. Climate Data

This study’s temperature and precipitation data were sourced from the China 1 km resolution monthly precipitation and mean temperature datasets provided by the National Tibetan Plateau Science Data Center (http://data.tpdc.ac.cn, accessed on 5 June 2024). These datasets, created by Peng Shouzhang, are downscaled for China using the Delta spatial downscaling method based on the global 0.5° climate dataset from the Climatic Research Unit (CRU) and the high-resolution climate dataset from WorldClim. Validation was conducted using data from 496 independent climate observation stations, confirming the reliability of the results [41,42,43]. The wind speed data used in this study were sourced from China’s 1 km resolution monthly average wind speed dataset, provided by the National Earth System Science Data Sharing Service platform (http://www.geodata.cn, accessed on 5 June 2024). This dataset was generated by spatial downscaling of reanalysed climate data [44].

2.2.3. Human, Topographic and Vector Data

Land use and land cover (LULC) data were sourced from Yang and Huang (2021) [45] with a spatial resolution of 30 m. These data include Cropland; Forest; Grassland; Water; Snow/Ice; Barren; Impervious; Wetland; Shrub Prairie (9 LULC); the study area covers only the first six categories. Topographic data, represented by slope, undulation, and elevation, were obtained from the GDEMV2 dataset of the Geospatial Data Cloud (https://www.gscloud.cn/, accessed on 3 June 2024), also with a spatial resolution of 30 m. Additional topographic metrics (slope, relief) were calculated using ArcGIS. The vector boundary data for the study area were acquired from Li et al. [46] and processed into shapefile (shp) format using ArcGIS. All data used in this study were reprojected to the WGS 1984 UTM Zone 48N (EPSG:32648) coordinate system, and the spatial scale was standardized to 30 m for consistency in subsequent analyses.

2.3. Data Analysis

2.3.1. Theil–Sen Slope Estimation

The Theil–Sen slope estimation method is a robust, nonparametric analysis technique that does not rely on distributional assumptions, making it practical for handling missing data in time series and mitigating the influence of data distribution on results. Its strong resistance to data errors makes it applicable to various datasets, ensuring more scientifically credible outcomes [47]. Therefore, this study applies the Theil–Sen median slope estimate to analyse the time-varying trends of the RSEI in the Tengger Desert from 2001 to 2021. The slope is calculated with Formula (1):
β = m e d i a n R S E I j R S E I i j i ( 2001 i < j 2021 )
where R S E I j   a n d   R S E I i denote the RSEI values in year i and year j, respectively, and Median is the median function. When β > 0, it indicates that RSEI is improving and, vice versa, is degrading.

2.3.2. Mann–Kendall Trend Analysis

The Mann–Kendall test is a non-parametric statistical method [48,49] used to assess the significance of a trend over time. It does not require the data to follow a specific distribution and is resilient to the presence of outliers. The test is widely used for detecting trends in time series data.
Z = ( S 1 ) / V a r ( S )   , S > 0 0 S = 0     ( S 1 ) / V a r ( S )   , S < 0
S = i = 1 n 1 j = i + 1 n s g n ( R E S I j R E S I i )
s g n ( R E S I j R E S I i ) = 1 ( R E S I j R E S I i > 0 ) 0 ( R E S I j R E S I i = 0 ) 1 ( R E S I j R E S I i < 0 )
V a r ( S ) = n ( n 1 , 2 n + 5 ) / 18
where n denotes the length of the time series; sgn is the sign function; S is the statistic to be constructed for the Mann–Kendall test; Var(S) is the variance of S; Z is the standard normal variable, which is tested for significance using a significance level of ɑ = 0.05; when |Z| ≥ 1.96, it indicates that there is a significant change in RSEI, and this step is done through Matlab R2023a.

2.3.3. Spatial Autocorrelation Analysis

Spatial correlation analysis of ecological quality helps describe the spatial heterogeneity within the study area, determining whether ecological quality exhibits spatial clustering based on the overall degree of dispersion. This analysis reveals whether the attribute values of spatial units are correlated with those of neighbouring units [50]. The global Moran’s index (Moran’s I) measures the overall spatial correlation of attribute values across the entire study area [51]. The significance of Moran’s I is assessed using the Z-score and p-value. The formula for Moran’s I is Formula (6).
I = m × i = 1 m j = 1 m W i j ( A i A ¯ ) ( A j A ¯ ) i = 1 m j = 1 m W i j ( A i A ¯ ) 2
where I is the Moran’s I, m is the total number of elements, A i is the attribute value of the ith element, A ¯ is the average attribute value of all elements in the study area, and W i j is the spatial weight. The value domain of Moran’s I is located in [−1,1], which when greater than 0 indicates that the spatial unit attribute has a positive correlation, in which the closer the Moran’s I is to 1 the more significant is the aggregation effect of the attribute; less than 0 suggests that the spatial unit attribute has a negative correlation, in which the closer the Moran’s I is to −1 the more significant is the convergence effect of the attribute; if the value of the Moran’s I tends to be close to 0, the attribute is considered to exhibit a randomly distributed property in the space [52].

2.3.4. The Hurst Index

The Hurst method quantitatively measures the information dependence and continuity of long-time series data, indicating the extent to which past information influences future trends. It is a valuable tool for predicting the future trend of data based on the Hurst exponent [53]. The specific formula is as follows:
R S = ( c m ) H
where R is the extreme deviation, S is the standard deviation, c is a constant, and the observations are divided into n sub-sequences R E S I i , where i = 1, 2, …, n; m is any positive integer and 0 < m < n, H is the Hurst exponent, and the formula for the extreme deviation R is as follows:
R = m a x X ( t , m ) m i n X ( t , m )
where X(t) is the cumulative deviation, calculated as follows:
X ( t ) = i = 1 m ( R E S I i 1 m i = 1 m R E S I i )
where 1 < t < m; standard deviation S is calculated as follows:
S = 1 m i = 1 m ( R E S I i 1 m i = 1 m R E S I i ) 2
The Hurst index (H) ranges from 0 to 1 and reflects the persistence or anti-persistence of the RSEI trends. When 0 < H < 0.5, it indicates anti-persistence, meaning the future trend will likely be opposite to the past; the closer H is to 0, the stronger the anti-persistence. When H = 0.5, the data exhibit randomness with no clear trend. When 0.5 < H < 1, the data are persistent, meaning future trends will align with past trends; the closer H is to 1, the stronger the persistence [54]. For analysis, H was classified into four categories: strong inverse persistence (<0.35), weak inverse persistence (0.35–0.5), weak persistence (0.5–0.65), and strong persistence (>0.65). Overlaying Hurst and change trends through the MATLAB R3023a software can derive future directions for RSEI; see Section 3.3 for the specific scope.

2.3.5. Geodetector

Considering the study area’s conditions and data availability, key factors closely related to the RSEI but not directly used to produce RSEI—land use and land use cover (LULC), precipitation (PRE), temperature (TMP), wind speed (SWS), elevation (DEM), slope (SLOP), and relief (REL)—were selected to explore the driving factors of RSEI spatiotemporal evolution.
Geodetectors reveal the factors behind the phenomenon, describing the explanatory power of the independent variable over the dependent variable [55]. To explore the dominant factors affecting the spatial variation of RSEI, a one-factor detector was used to reveal the spatial heterogeneity of each influencing factor. The formula is as follows:
q = 1 h = 1 L N h σ 2 h N σ 2
where q is the degree of explanation of RSEI, h = 1, 2, …, L is the stratification of variables, and N h and N are the class h and the sample size of the whole region, respectively. σ 2 and σ 2 h represent the RSEI variance of the whole region and layer h. The value of q is in the range of [0, 1], corresponding to the spatial differentiation degree of the dependent variable. The larger the value, the stronger the explanatory power for the ecological quality of the study area [56].
Interaction detection can assess the interaction relationship between different factors and evaluate whether there is a change in the influence of varying factor combinations on ecological quality in the Tengger Desert. The specific classification is detailed in Table 1. In this study, firstly, the effect of a single factor on the dependent variable was calculated. Then, the q-value was calculated after the interaction of the two factors to determine the impact on the dependent variable.
The natural breakpoint method was applied to reclassify the independent variables to meet the requirements of the Geodetector tool. A 1000 × 1000 m grid was constructed using ArcGIS 10.7, and the values of the variables at the centre of each grid cell were extracted for analysis.

3. Results

3.1. Dynamic Change of RSEI

The mean RSEI in the Tengger Desert fluctuated between 0.1542 and 0.2906 from 2001 to 2021, indicating poor ecological quality (Figure 2). The RSEI peaked in 2008, likely reflecting the impact of major national ecological projects such as the conversion of farmland to forest and grassland, and efforts to control sandstorms in Beijing and Tianjin. Though there was a slight, insignificant improvement from 2001 to 2008 (0.0148 a−1), the overall trend showed a gradual decline, with an annual decrease of 0.0008 a−1 (p > 0.05) from 2008 to 2021.

3.2. Spatiotemporal Characteristics of Ecological Quality

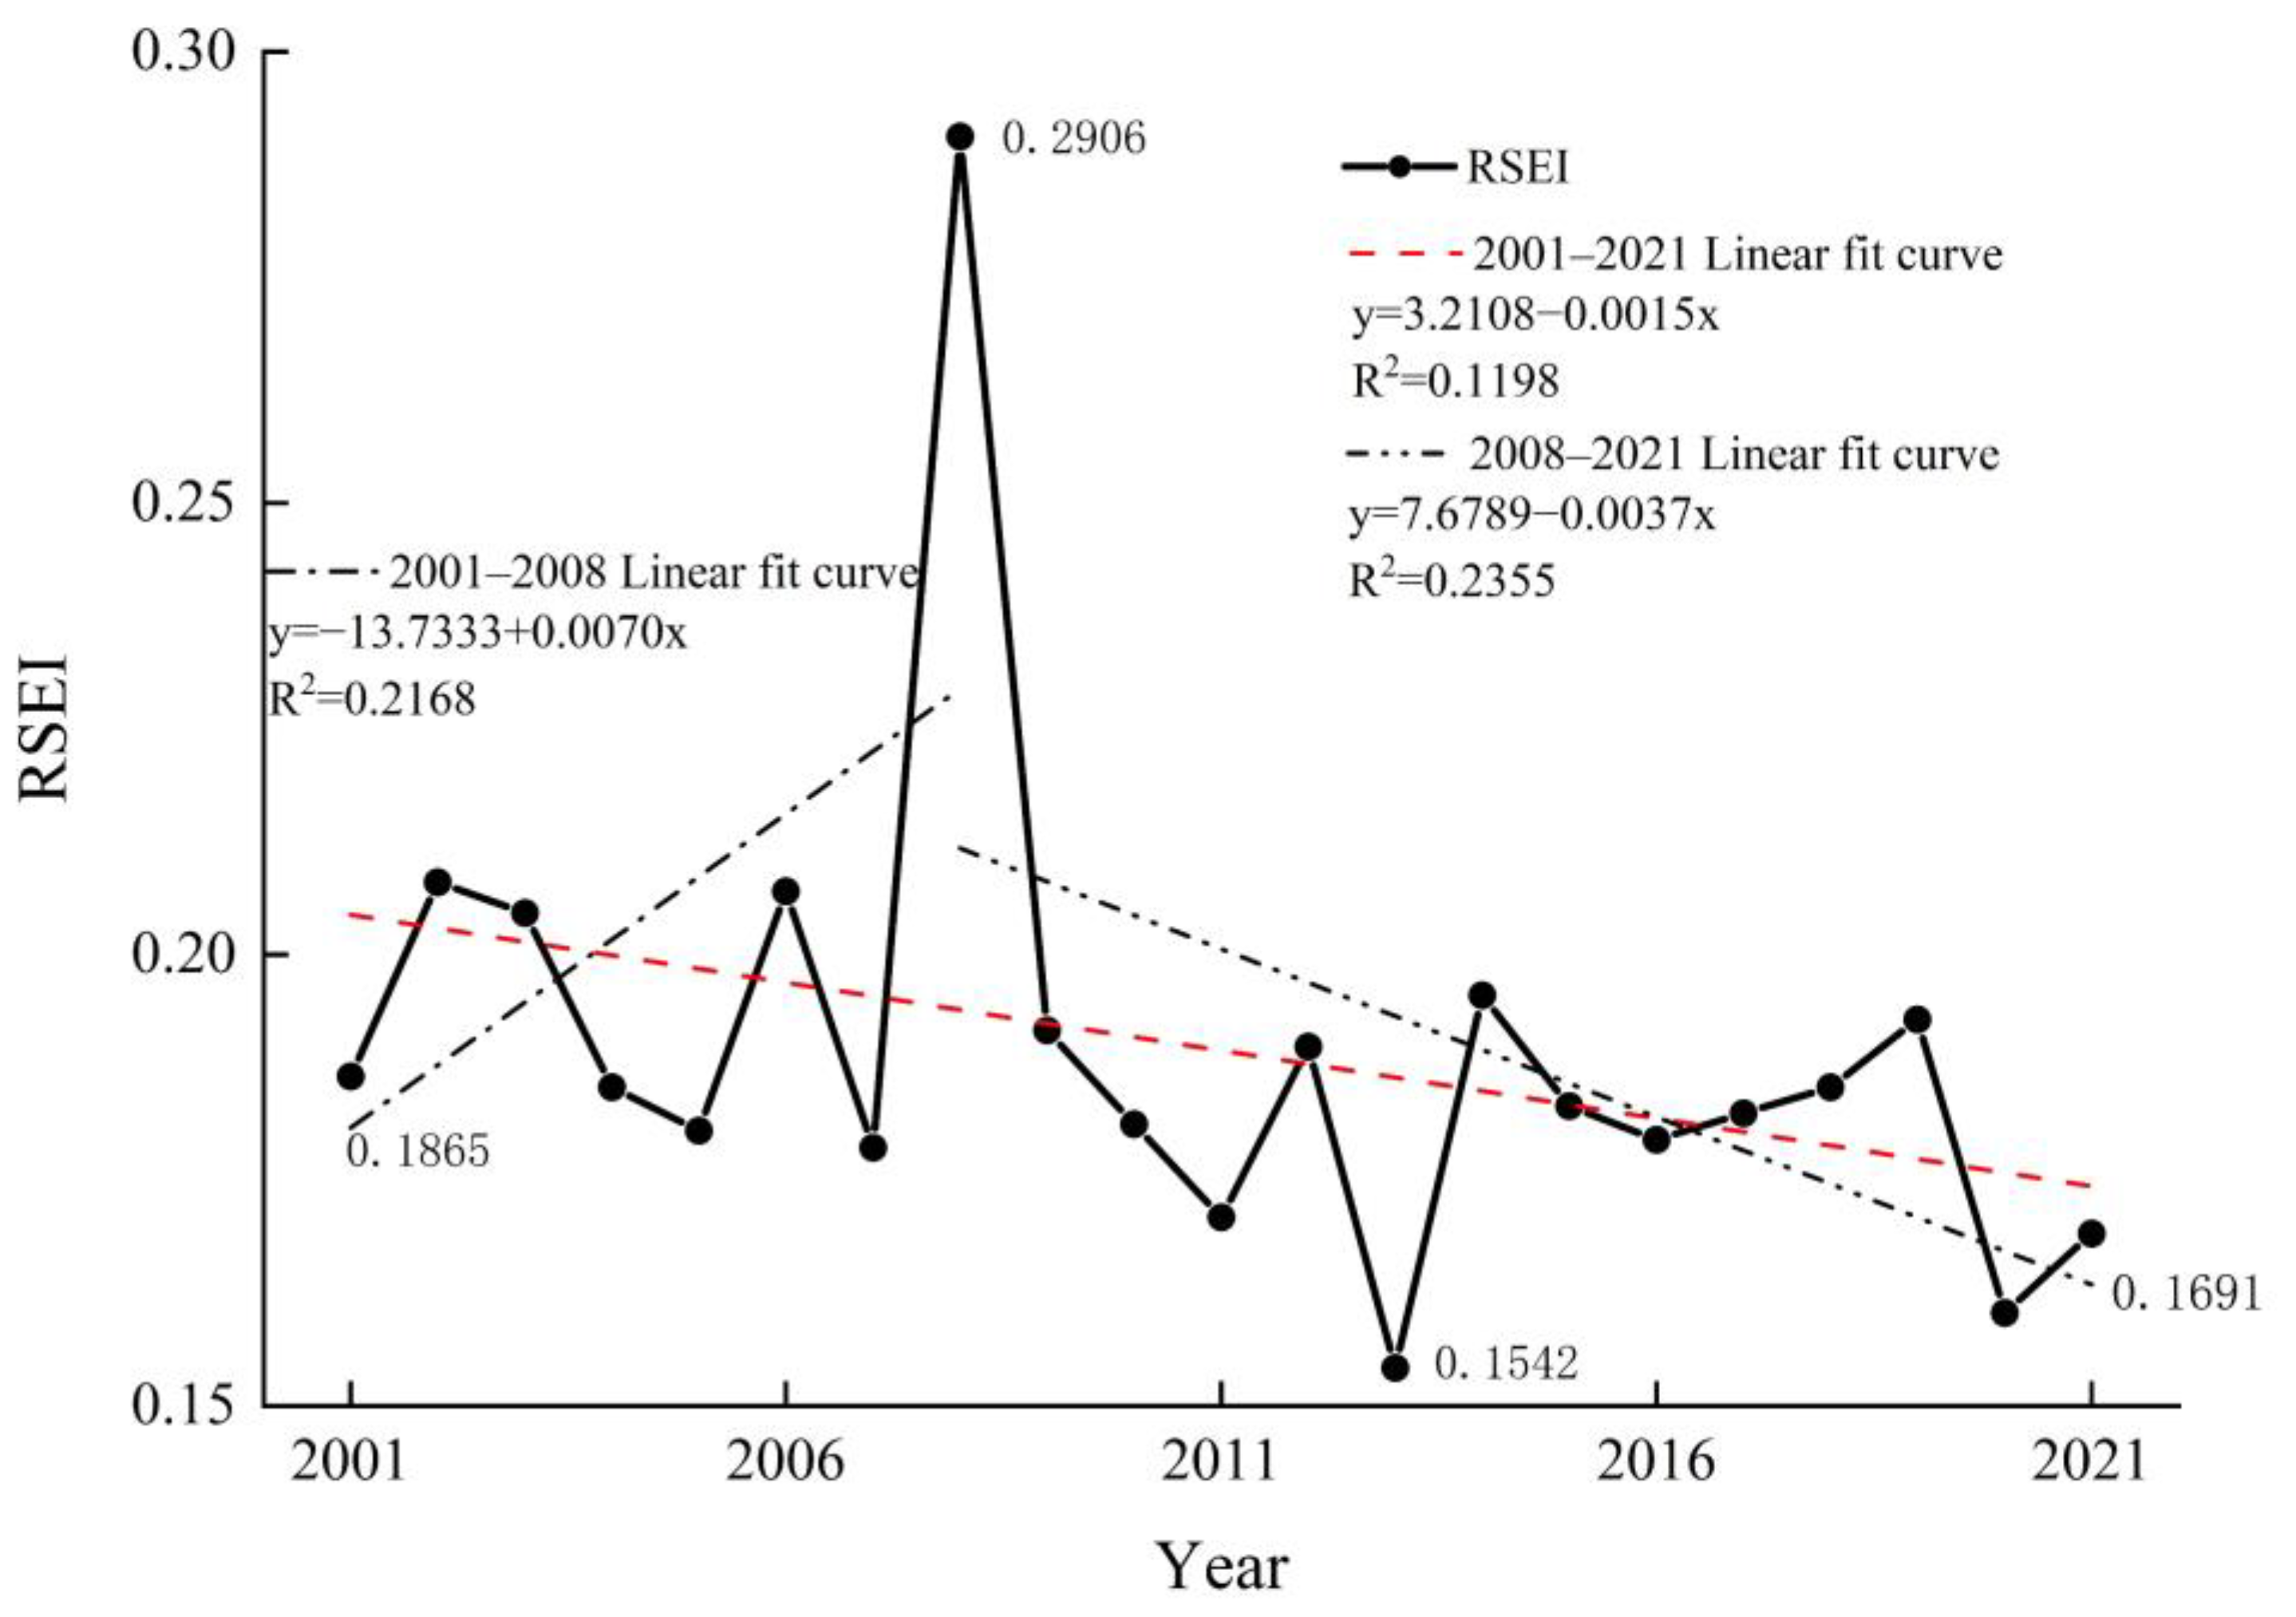
3.2.1. Temporal Characteristics

Ecological quality analysis (Figure 3) shows improvement from 2001 to 2006, followed by deterioration from 2006 to 2011, mainly due to shifts between poor and fair classes. Deterioration outweighed improvements, with few sharp changes. From 2001 to 2021, only about 15% of the area had above-moderate ecological quality, while 70% had poor quality, initially decreasing but later increasing. Ecological quality improved between 2011 and 2016 but deteriorated again from 2016 to 2021. By 2021, areas with moderate or better quality had decreased compared to 2001, with more pronounced deterioration than in 2006.
Table 2 shows a slight decline in average ecological quality in the study area from 2001 to 2021, with a two-way shift toward lower levels, suggesting that areas of lower ecological quality may have shifted locations. The total reduction in the area above the middle ecological grade amounted to 3.5739 km2. The increase in area due to ecological deterioration exceeded the decrease from improvement, indicating an overall decline in the ecological quality of the Tengger Desert.

3.2.2. Spatial Characteristics

Figure 4 illustrates the temporal and spatial changes in ecological quality across the Tengger Desert region for the years 2001, 2006, 2011, 2016, 2021, and the period from 2001 to 2021 (Figure 4f), based on the Remote Sensing Ecological Index (RSEI). Spatially, areas with poor ecological quality are mainly concentrated in the central parts of the study area. In contrast, areas with better ecological quality are primarily located along the margins and some central regions, particularly around the periphery of the Qinghai–Tibet Plateau and in the areas surrounding the Qilian and Helan Mountains. Overall, the ecological quality of the study area fluctuated between 2001 and 2021, with significant degradation in certain areas that require restoration measures.
Figure 5 shows the spatial distribution of RSEI variations from 2001 to 2021. Most areas saw slight or insignificant improvements, especially in the northeast and southwest, with a few areas experiencing significant increases from 2001–2006 (Figure 5a). Improvement trends continued, but slight degradation appeared in some southern and central regions from 2006–2011 (Figure 5b). Ecological stability was observed from 2011 to 2016 (Figure 5c), with improvements in the northeast, while slight declines occurred in the southern and central areas. Degradation intensified in the south and centre from 2016–2021 (Figure 5d), although some slight improvements persisted in the northeast. Over the two decades (Figure 5e), significant improvements ( Z 1.96 ) occurred in the northeast and southwest, while widespread degradation dominated the central and southern regions. Overall, recent years indicate a notable ecological decline, especially in central and south areas, underscoring the need for restoration.
Significant decreases ( Z 1.96 ) in ecological quality were most notable during the 2001–2021 period, affecting 10.33% of the area (Table 3). Slight and insignificant decreases dominated all periods, especially from 2006–2011 and 2016–2021, where over 60% of the area experienced some decline. No significant increases ( Z 1.645 ) peaked between 2011–2016, covering 56.05% of the area. The proportion of areas with significant increases remained relatively small but stable throughout the years, reaching 2.97% over the entire 20-year span. These data highlight a general trend of ecological decline, with only small areas experiencing significant improvement.

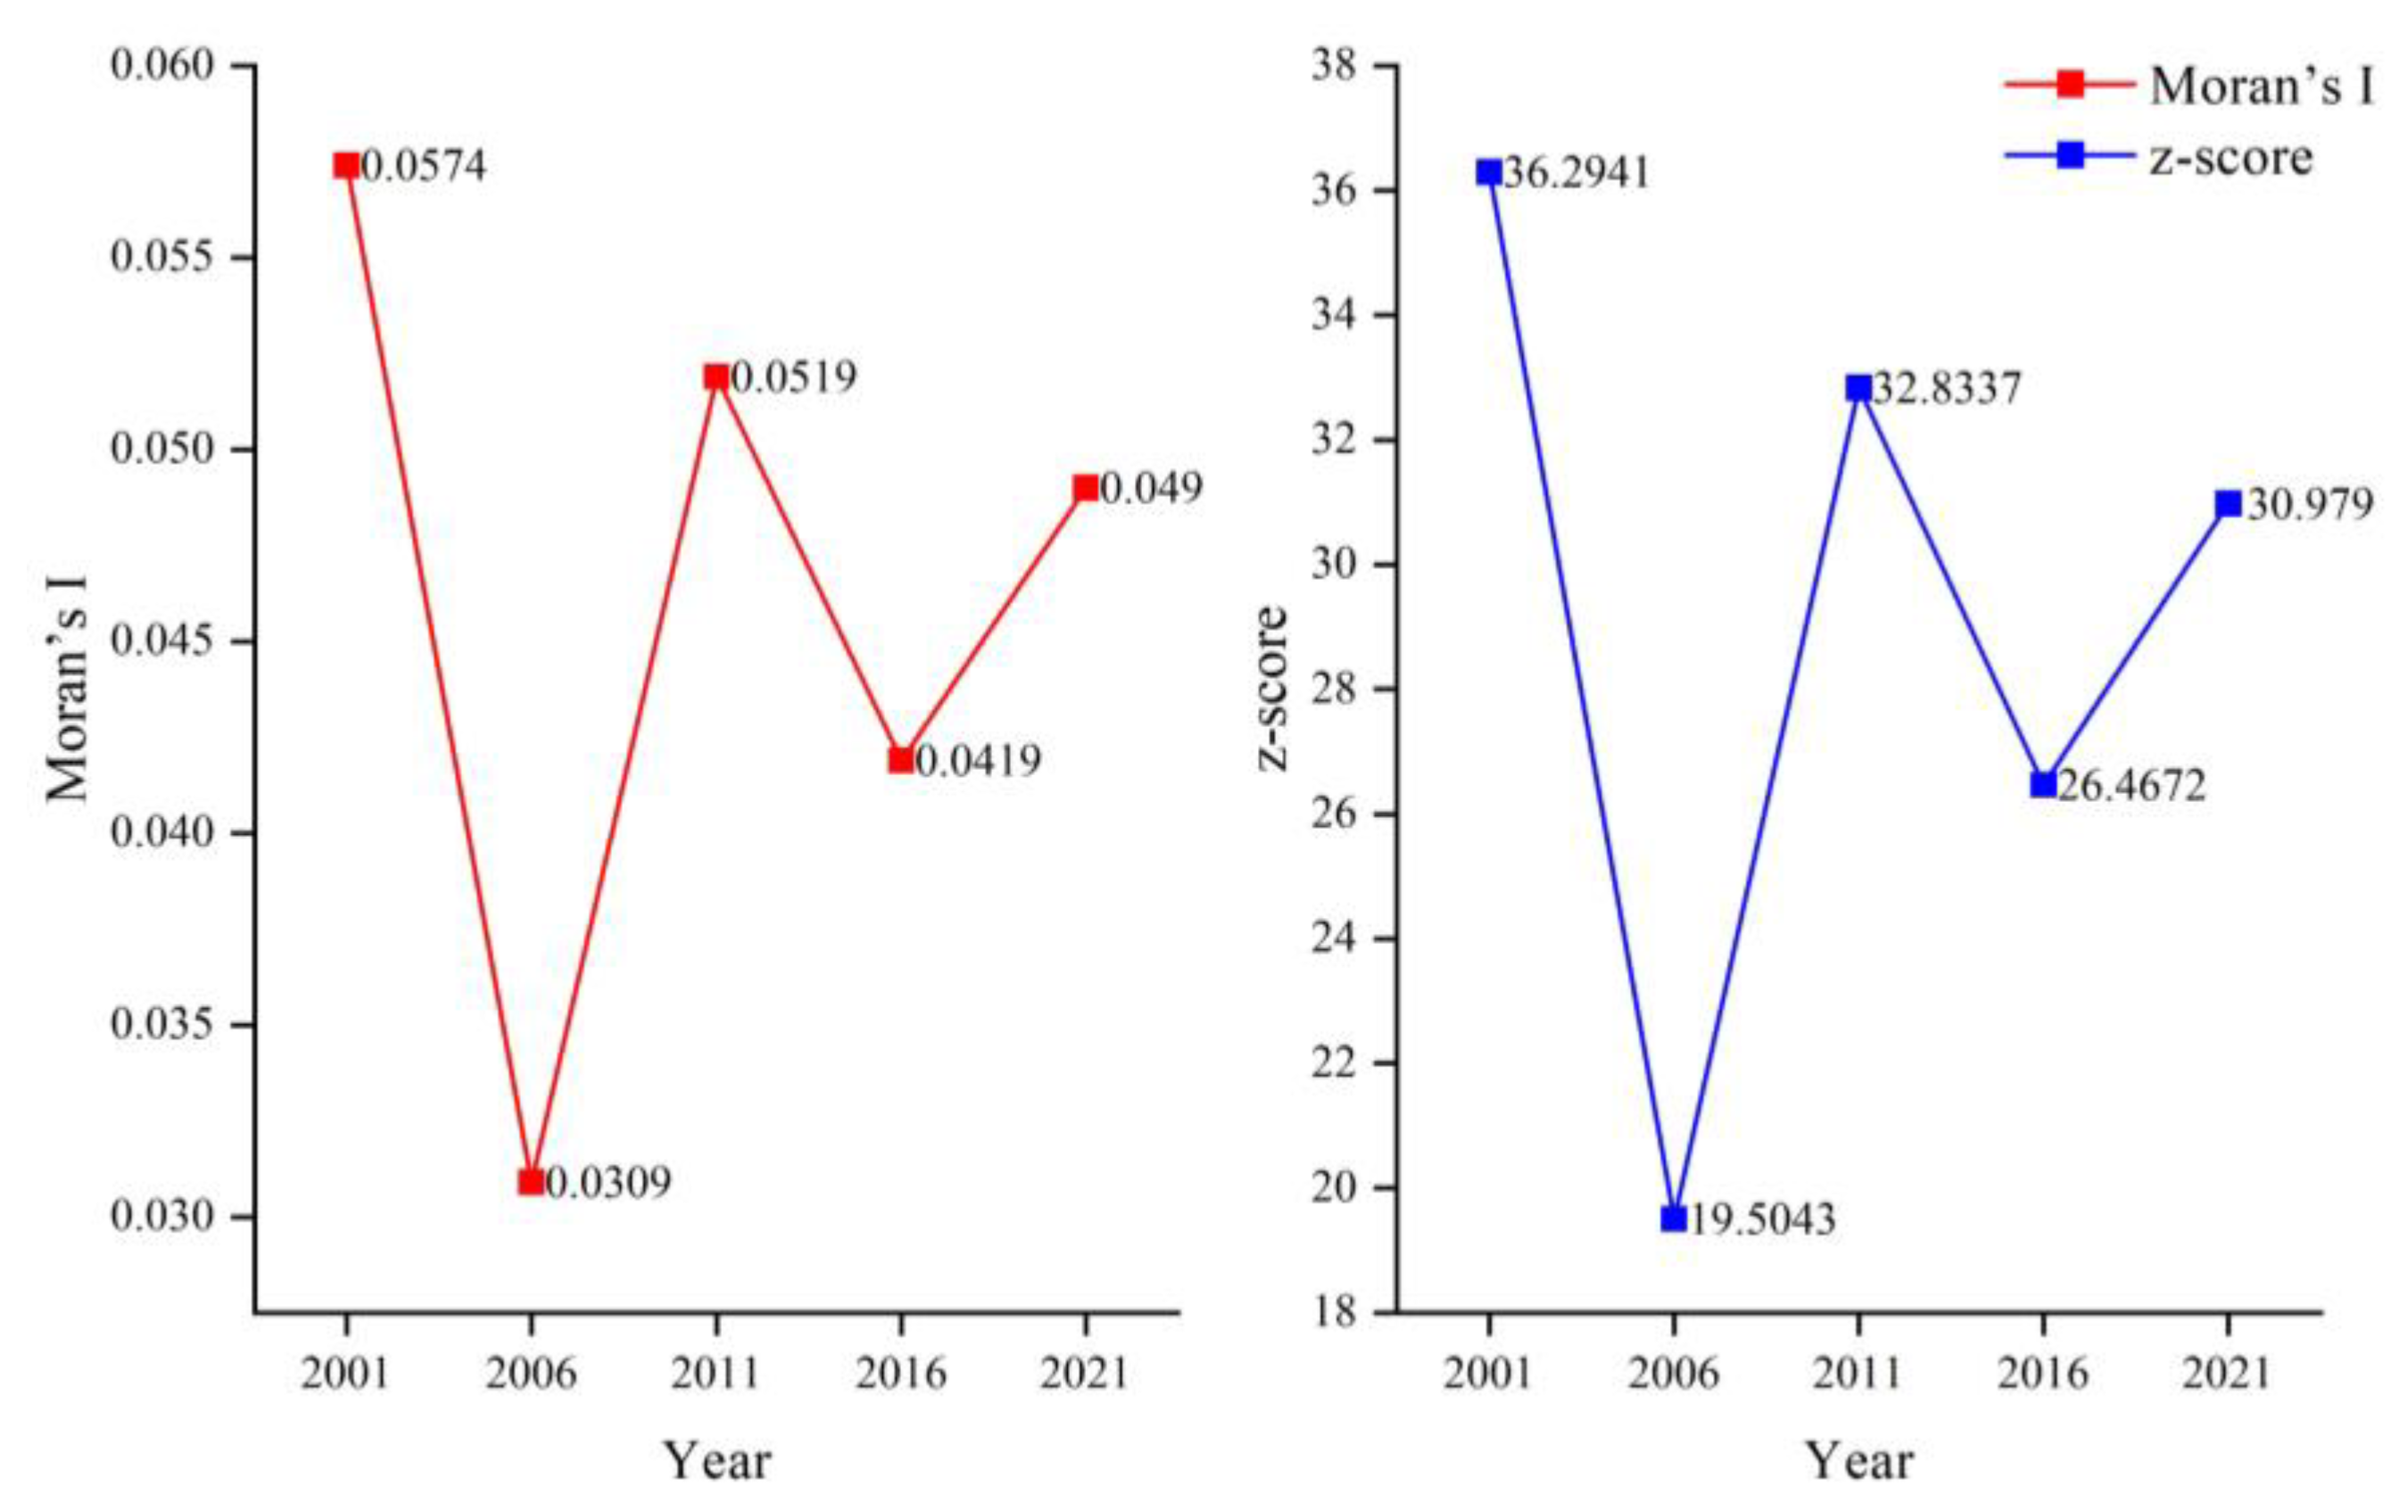
3.2.3. RSEI Spatial Autocorrelation Analysis

The values of Moran’s I range from approximately 0.0309 (in 2011) to 0.0612 (in 2001) (Figure 6). The highest Moran’s I, valued in 2001, suggests a more substantial positive spatial autocorrelation of ecological quality, meaning similar ecological conditions were more clustered in that year. After 2001, Moran’s I values fluctuated, with lower values in 2011 and 2016, indicating reduced clustering and more spatial randomness. A slight increase was observed again in 2021. Z-scores reflect the statistical significance of the spatial autocorrelation. Higher z-scores in 2001 (36.2941) indicate a more significant clustering of similar ecological quality levels in that year. The z-scores drop significantly in 2011 (19.5043), suggesting weaker spatial autocorrelation, before rising again in 2016 (26.4672) and 2021 (30.979), indicating moderate to strong spatial autocorrelation during those years. Overall, these results suggest that the spatial clustering of ecological quality was most pronounced in 2001, with a notable decline in 2011, followed by a moderate recovery in subsequent years.

3.3. RSEI Trend Persistence Analysis

The Hurst index was calculated through pixel-by-pixel analysis of RSEI results from 2001 to 2021 in the Tengger Desert, yielding an average value of 0.5567 (Table 4). This indicates a strong positive correlation in the RSEI changes across the study area. Areas with a Hurst index less than 0.5, accounting for 31.44% of the total area, exhibit weak continuity, suggesting unstable ecological quality changes. In contrast, 63.50% of the area has a Hurst index greater than 0.5, indicating more persistent RSEI changes and relatively stable ecological quality in these regions.
To further investigate the variation patterns of ecological quality in the study area, the Hurst Index and Sen Index for the Tengger Desert were combined to project the future trend of the RSEI (Figure 7). The results indicate that the ecological quality in the Tengger Desert is expected to mostly deteriorate, with 40.40% of the area showing continuous deterioration and 9.13% transitioning from improvement to deterioration.
The areas likely to experience the most significant ecological deterioration are located along the edges of towns and in the eastern part of the study area. These regions will require sustained ecological management efforts over the long term. Additionally, approximately 12% of the study area has a Hurst Index close to 0.5, making it difficult to predict future changes in ecological quality. However, areas with deteriorating ecological quality account for more than 49.53% of the total area, surpassing those with improving ecological quality (38.1%) and areas with no change (12.37%). Future studies should closely monitor these regions, particularly those undergoing significant ecological changes.

3.4. Factors Driving RSEI

3.4.1. Single-Factor Detection

The results in Figure 8 show that all driving factors, except slope, significantly impact RSEI, passing the 0.05 significance test. LULC consistently had the highest explanatory power, especially in 2021, with a q-value of 0.4968, passing the 1% significance test. This suggests that human activities have strongly influenced ecological changes in the Tengger Desert over the past 21 years. Besides LULC, temperature (TMP) and precipitation (PRE) also had high explanatory power in 2001 and 2021, while wind speed (SWS) and TMP were significant in 2006, 2011, and 2016. In contrast, slope (SLOP), relief (REL), and elevation (DEM) had the least influence. The ranking of PRE varied over time, indicating that land use changes affected local microclimate conditions. Reduced rainfall and expanding desertification negatively impacted local habitats, highlighting the need for stronger ecological protection in the Tengger Desert to prevent further degradation.

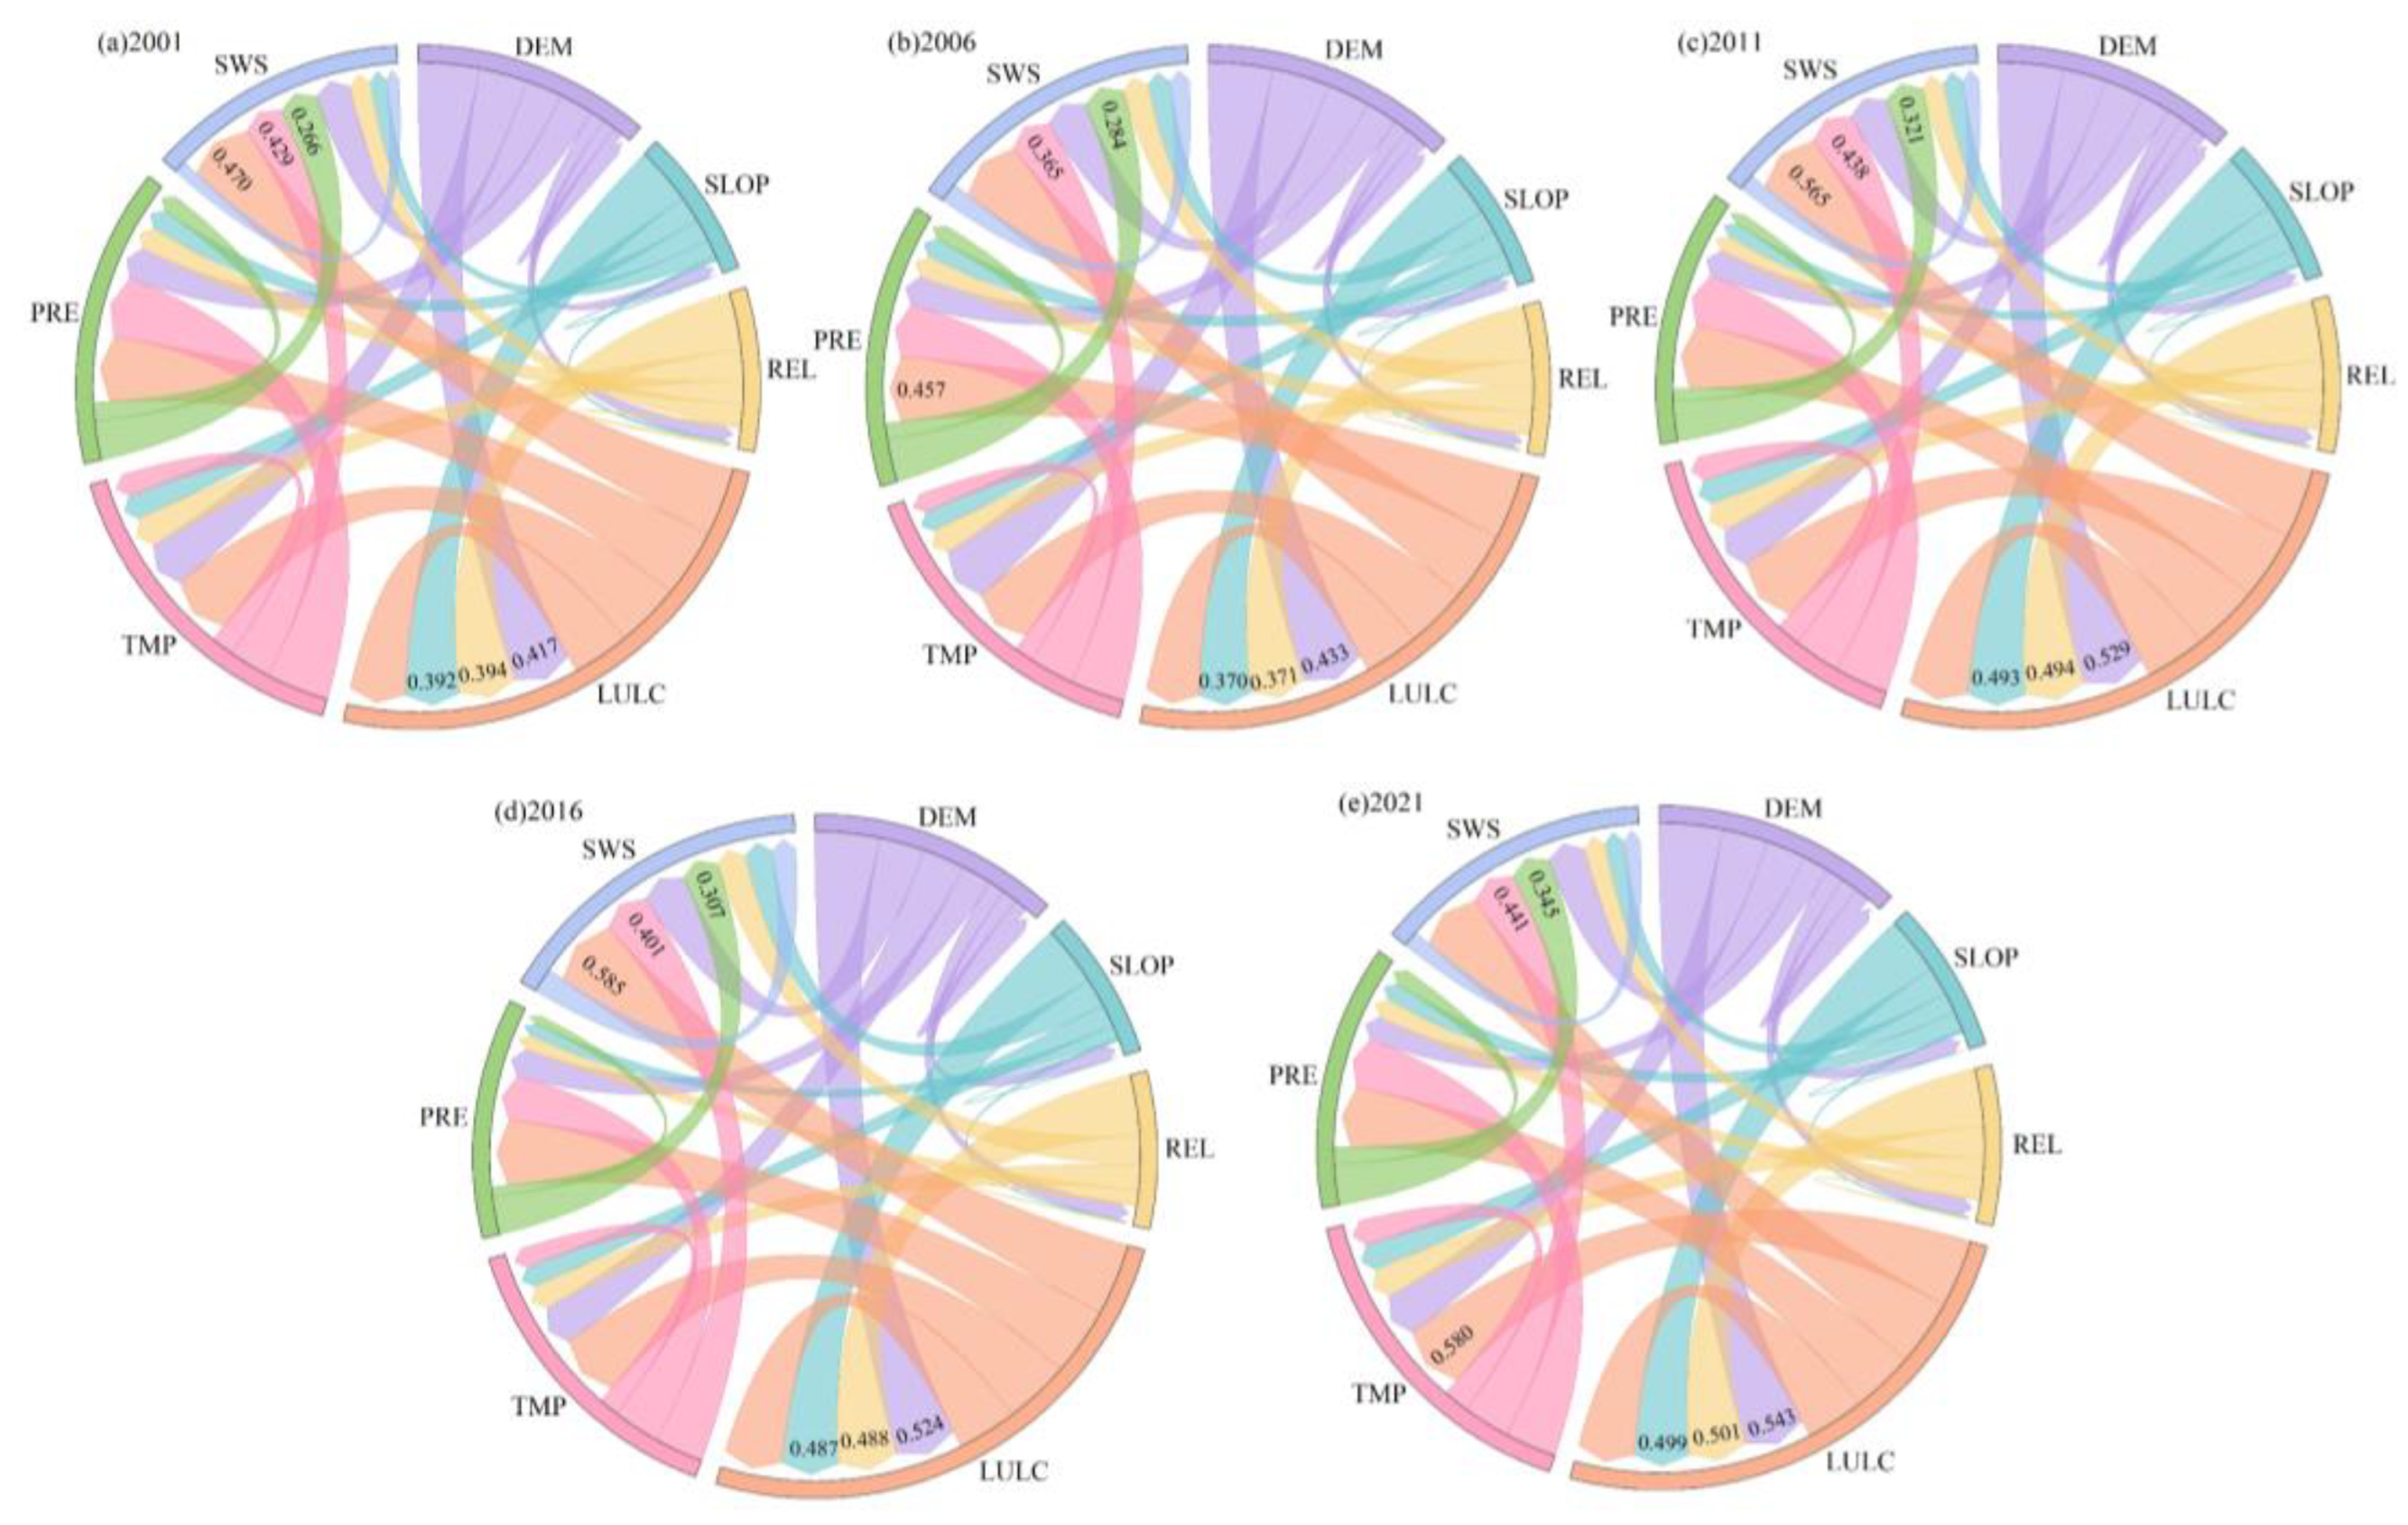
3.4.2. Factor Interaction Detection

The interaction detection results, shown in Figure 9, reveal that the explanatory power of factors on RSEI is significantly enhanced when combined, with no cases of mutual independence or weakening. This indicates that the impact of interacting factors on ecological quality changes in the Tengger Desert is greater than that of individual factors alone. Among all combinations, LULC and TMP—both strong single-factor influencers—showed high explanatory power when interacting with other factors. The combination of wind speed (SWS) and LULC had the strongest explanatory power in 2001, 2011, and 2016, reaching a maximum q-value of 0.5847. This suggests that wind speed, interacting with land-use practices, significantly influences RSEI, likely due to wind erosion in desertified areas with low vegetation cover. Overall, the ecological quality of the Tengger Desert is shaped by anthropogenic activities and the synergistic effects of multiple factors. Studying these interactions provides a more comprehensive understanding of their impact on the region’s ecological changes.

4. Discussion

4.1. RSEI Spatial and Temporal Characteristics

This study used CHEQ datasets (NDVI, WET, NDBSI, LST, AI) to evaluate the ecological quality of the Tengger Desert. This approach mitigates the limitations of using single or partial indicators and reduces the subjectivity of human factors. It also simplifies data collection, enabling quantitative analysis and visualisation of ecological quality over a long time series. The RSEI remains a comprehensive and reliable method for assessing environmental quality when constructing ecological indicators.
This study analysed the spatiotemporal evolution of RSEI in the Tengger Desert over 21 years and developed a future change model. From 2001 to 2021, RSEI showed an overall declining trend (Figure 2), with a significant peak in 2008. According to Liu et al. [57], this peak aligns with the launch of the edge-locking project at the desert’s periphery, which temporarily improved ecological quality. However, the ecosystem was in the early recovery phase, and human-induced damage such as farmland reclamation, industrial and mining construction, irrational land use, and overgrazing outweighed the benefits of restoration [58], leading to a noticeable decline in RSEI between 2008 and 2009. Despite initial restoration efforts, the region’s ecological quality continued to degrade, highlighting the need for us to strengthen ecosystem protection and pre-assessment of environmental monitoring after the project is implemented.
The increasing trend of average temperature and decreasing rainfall (Figure 10) has caused an imbalance between evaporation and water recharge, worsening drought conditions and contributing to fluctuations in RSEI in certain years. These findings suggest a strong correlation between mean temperature, precipitation, and RSEI dynamics, as noted by Yang et al. [59]. Rising temperatures have made the mountain climate more favourable for plant growth, resulting in higher NDVI values in areas near towns and mountains (Figure 11). Since NDVI carries significant weight in RSEI calculation [60,61], the RSEI in these marginal mountain areas is high. However, unused land still accounts for 88.51% of the study area, keeping the overall RSEI value low. Additionally, 49.53% of the Tengger Desert is projected to deteriorate in the future, indicating increasing fragility in the natural environment due to changes in human activities [54,62,63,64]. Some areas showing signs of reversing ecological improvement trends require ongoing monitoring and field research [61].

4.2. Factors Driving RSEI

The results of the Geodetector analysis indicate that LULC is a key factor directly influencing changes in RSEI, likely due to the inclusion of AI in the CHEQ dataset’s principal component analysis and LULC’s reflection of human activities. This makes the CHEQ dataset more effective in capturing the relationship between ecological quality changes and LULC [31]. Previous research [65,66,67] supports the conclusion that human factors are the primary drivers of desert changes, aligning with the findings of this study. From 2001 to 2021, land use in the study area shifted primarily from unused land to cultivated land. Liu et al. noted that newly cultivated land tends to have low agricultural stability, which helps explain the overall decline in RSEI during this period [68].
The interaction between factors had a stronger influence on RSEI spatial differentiation than single factors. In 2021, the interaction between LULC and TMP had the largest effect on RSEI, while the interaction between LULC and SWS was most significant in 2001, 2011, and 2016. This suggests that both anthropogenic and climatic factors drive RSEI dynamics [69,70]. Although topographic factors, as noted by Yang et al. [25], can influence RSEI, their explanatory power in this study was lower, likely due to their longer evolutionary period and lower sensitivity on the 21-year timescale [71]. This aligns with findings from other arid desert regions [29].
The findings of this study offer valuable guidance for improving and protecting the ecological quality of the Tengger Desert. Short-term efforts should focus on optimising land use and protecting key ecological areas, while medium- and long-term strategies should consider regional natural conditions to balance ecological protection with sustainable tourism and economic development.

4.3. Limitations and Future Perspectives

Based on the CHEQ dataset, the RSEI index incorporating AI was used to quantitatively analyse the evolution and driving factors of the Tengger Desert’s ecological quality from 2001 to 2021. The RSEI index, enhanced by AI, performed well at the regional spatial scale and showed a high correlation with EI data [31,39]. However, water bodies were masked in the RSEI calculation to prevent interference, meaning the index cannot assess water quality, a key ecosystem component [30,58]. Given the importance of water and atmospheric environments, future studies should consider integrating related indicators to develop a more comprehensive evaluation system for watershed ecological quality [72,73,74].
This study ended in 2021 due to data limitations, and the data’s spatial resolution was standardised to 30 m, which may have caused information loss from lower-resolution datasets. Zhuo Lu also concluded, by comparing the effects of 10 m and 30 m resolution, that higher-resolution data would give better results in assessing habitat quality, that are not captured by analyses at low resolution [75]. Additionally, the explanatory power of impact factors varies across spatial scales, and the results are influenced by data discretisation methods [76,77]. While this study experimented with different discretisation techniques, it could not guarantee that the same indicators passed the 0.01 significance test in all years. These subtle differences may affect the findings. Future research should focus on building higher-resolution, more timely datasets and refining data discretisation methods to improve detection results across different scales and partitions, ensuring more accurate outcomes.

5. Conclusions

In this study, the Tengger Desert was used as the research area, and the RSEI index was used as the evaluation index of ecological quality. The spatial and temporal dynamics of ecological quality from 2001 to 2021 were analysed, and the dominant factors of ecological quality change in the study area were revealed by Geodetector. The results show that:
(1)
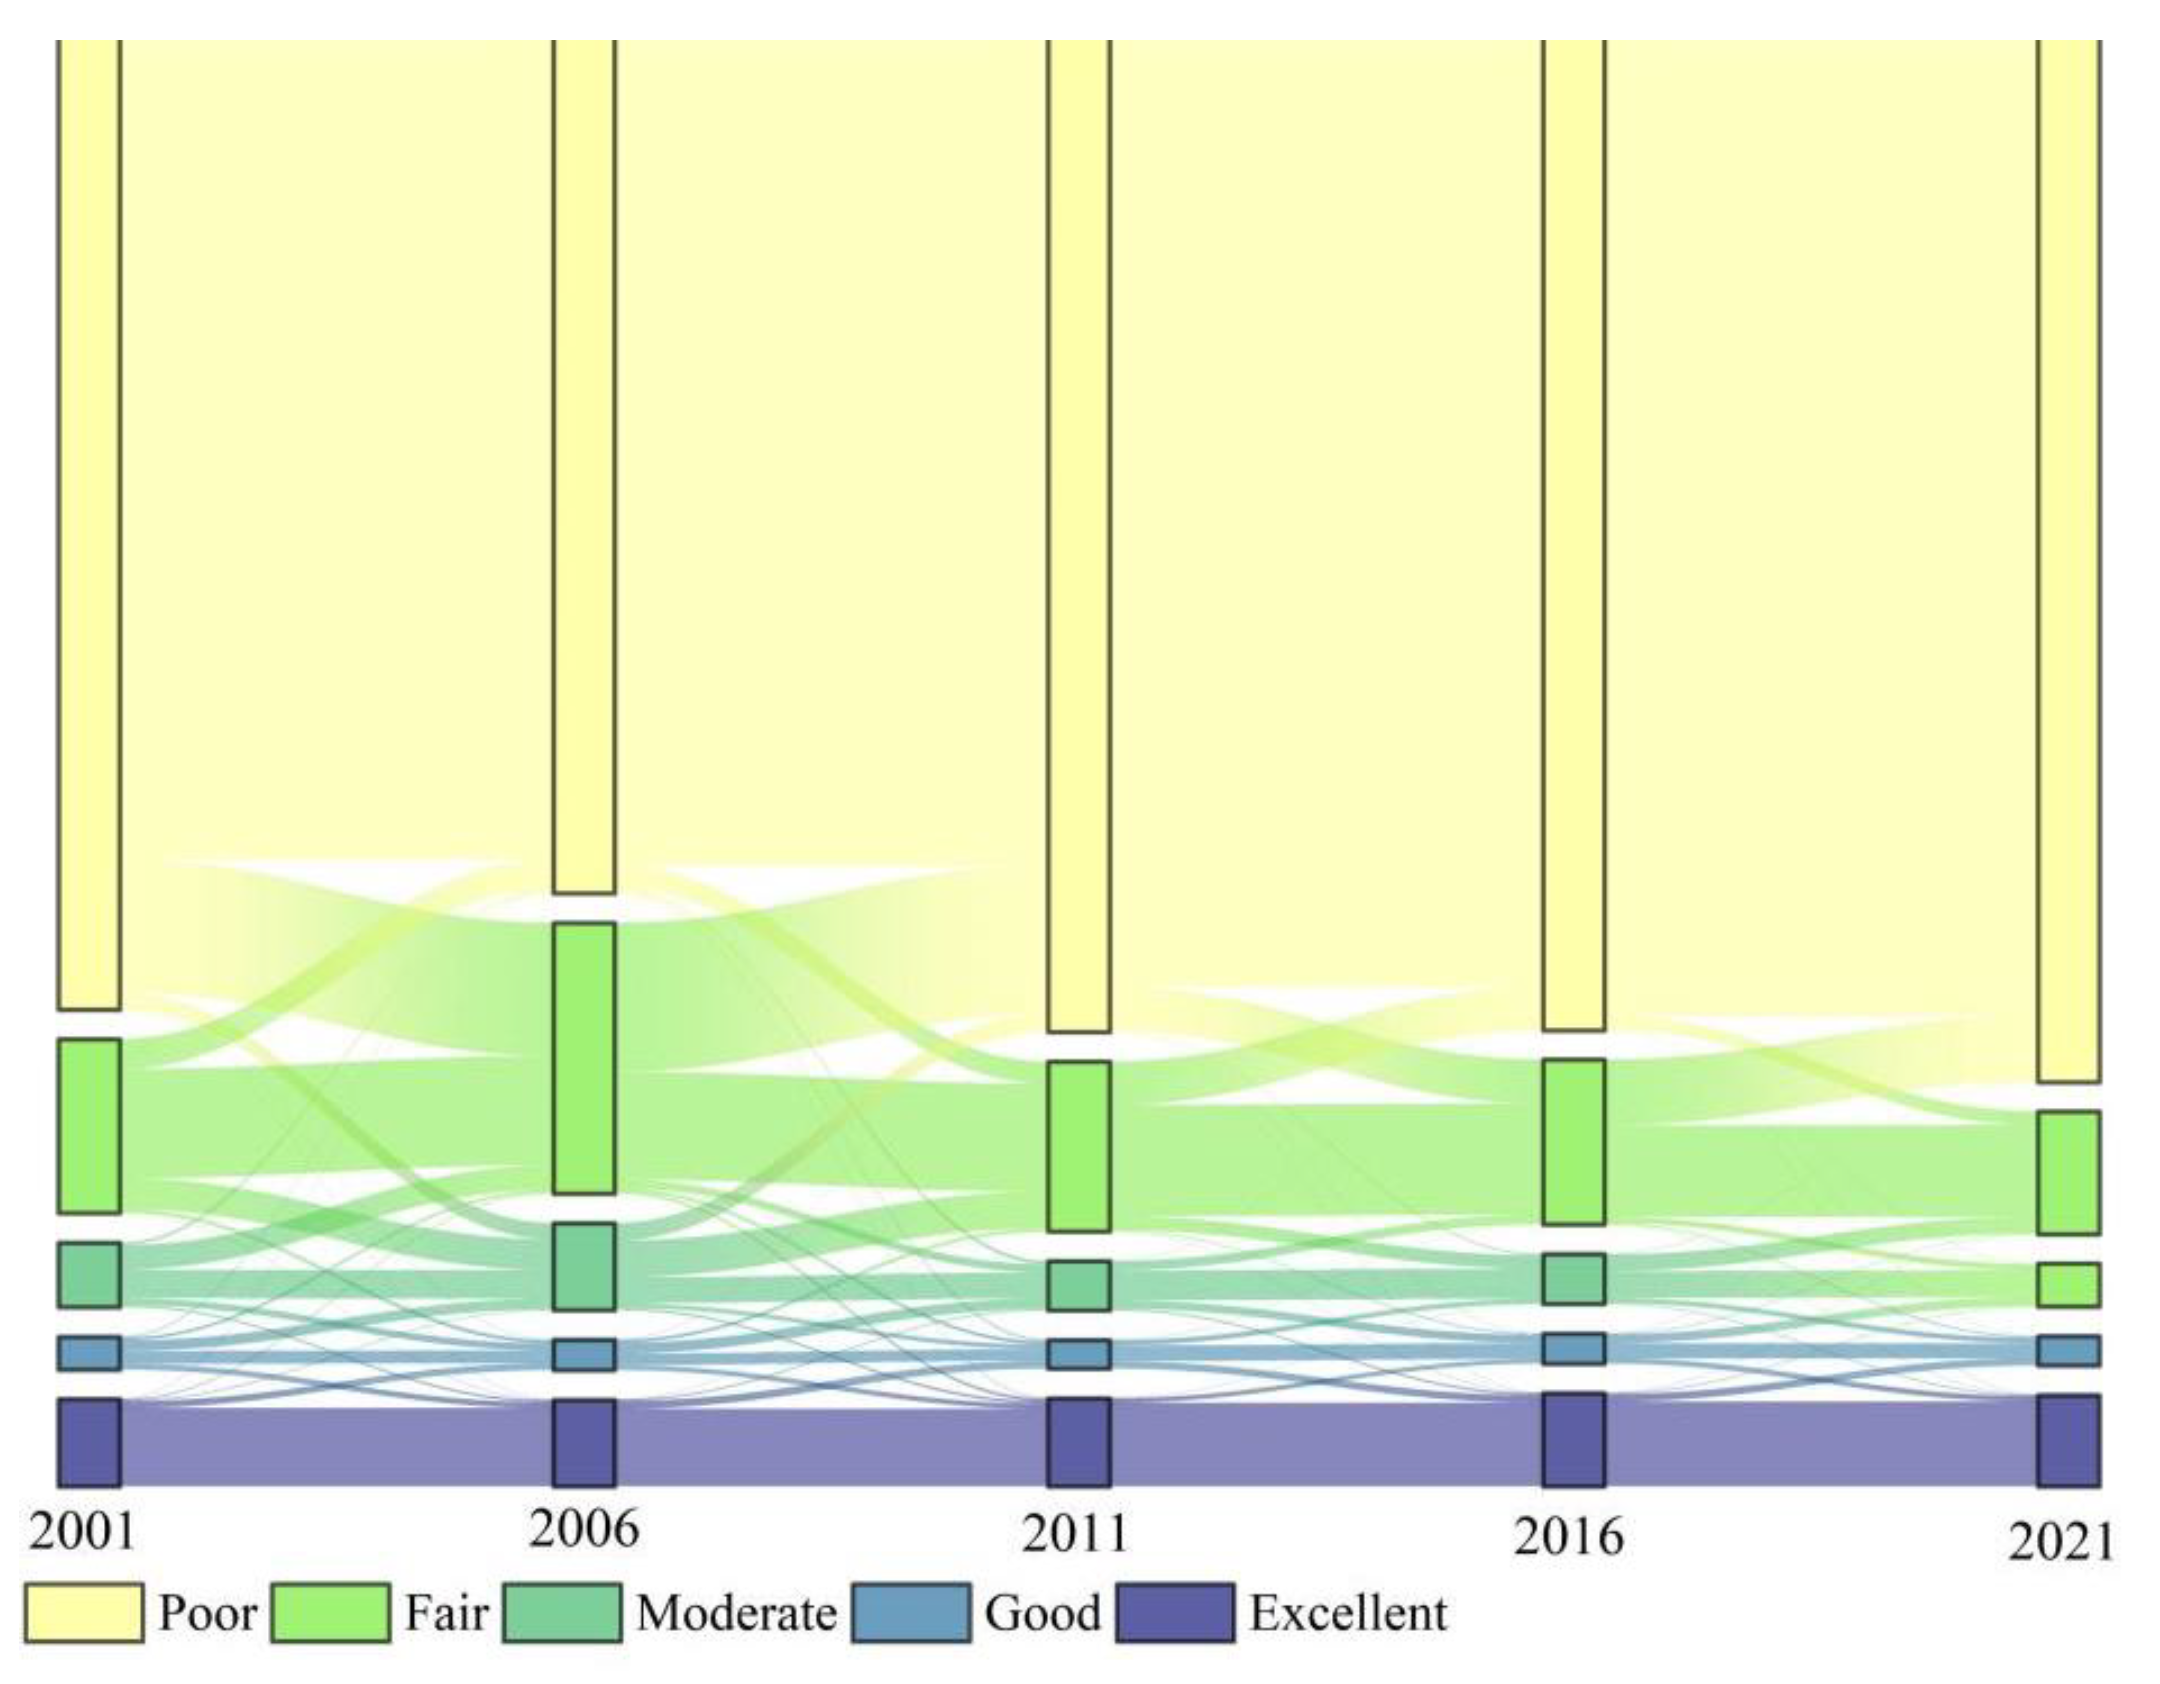
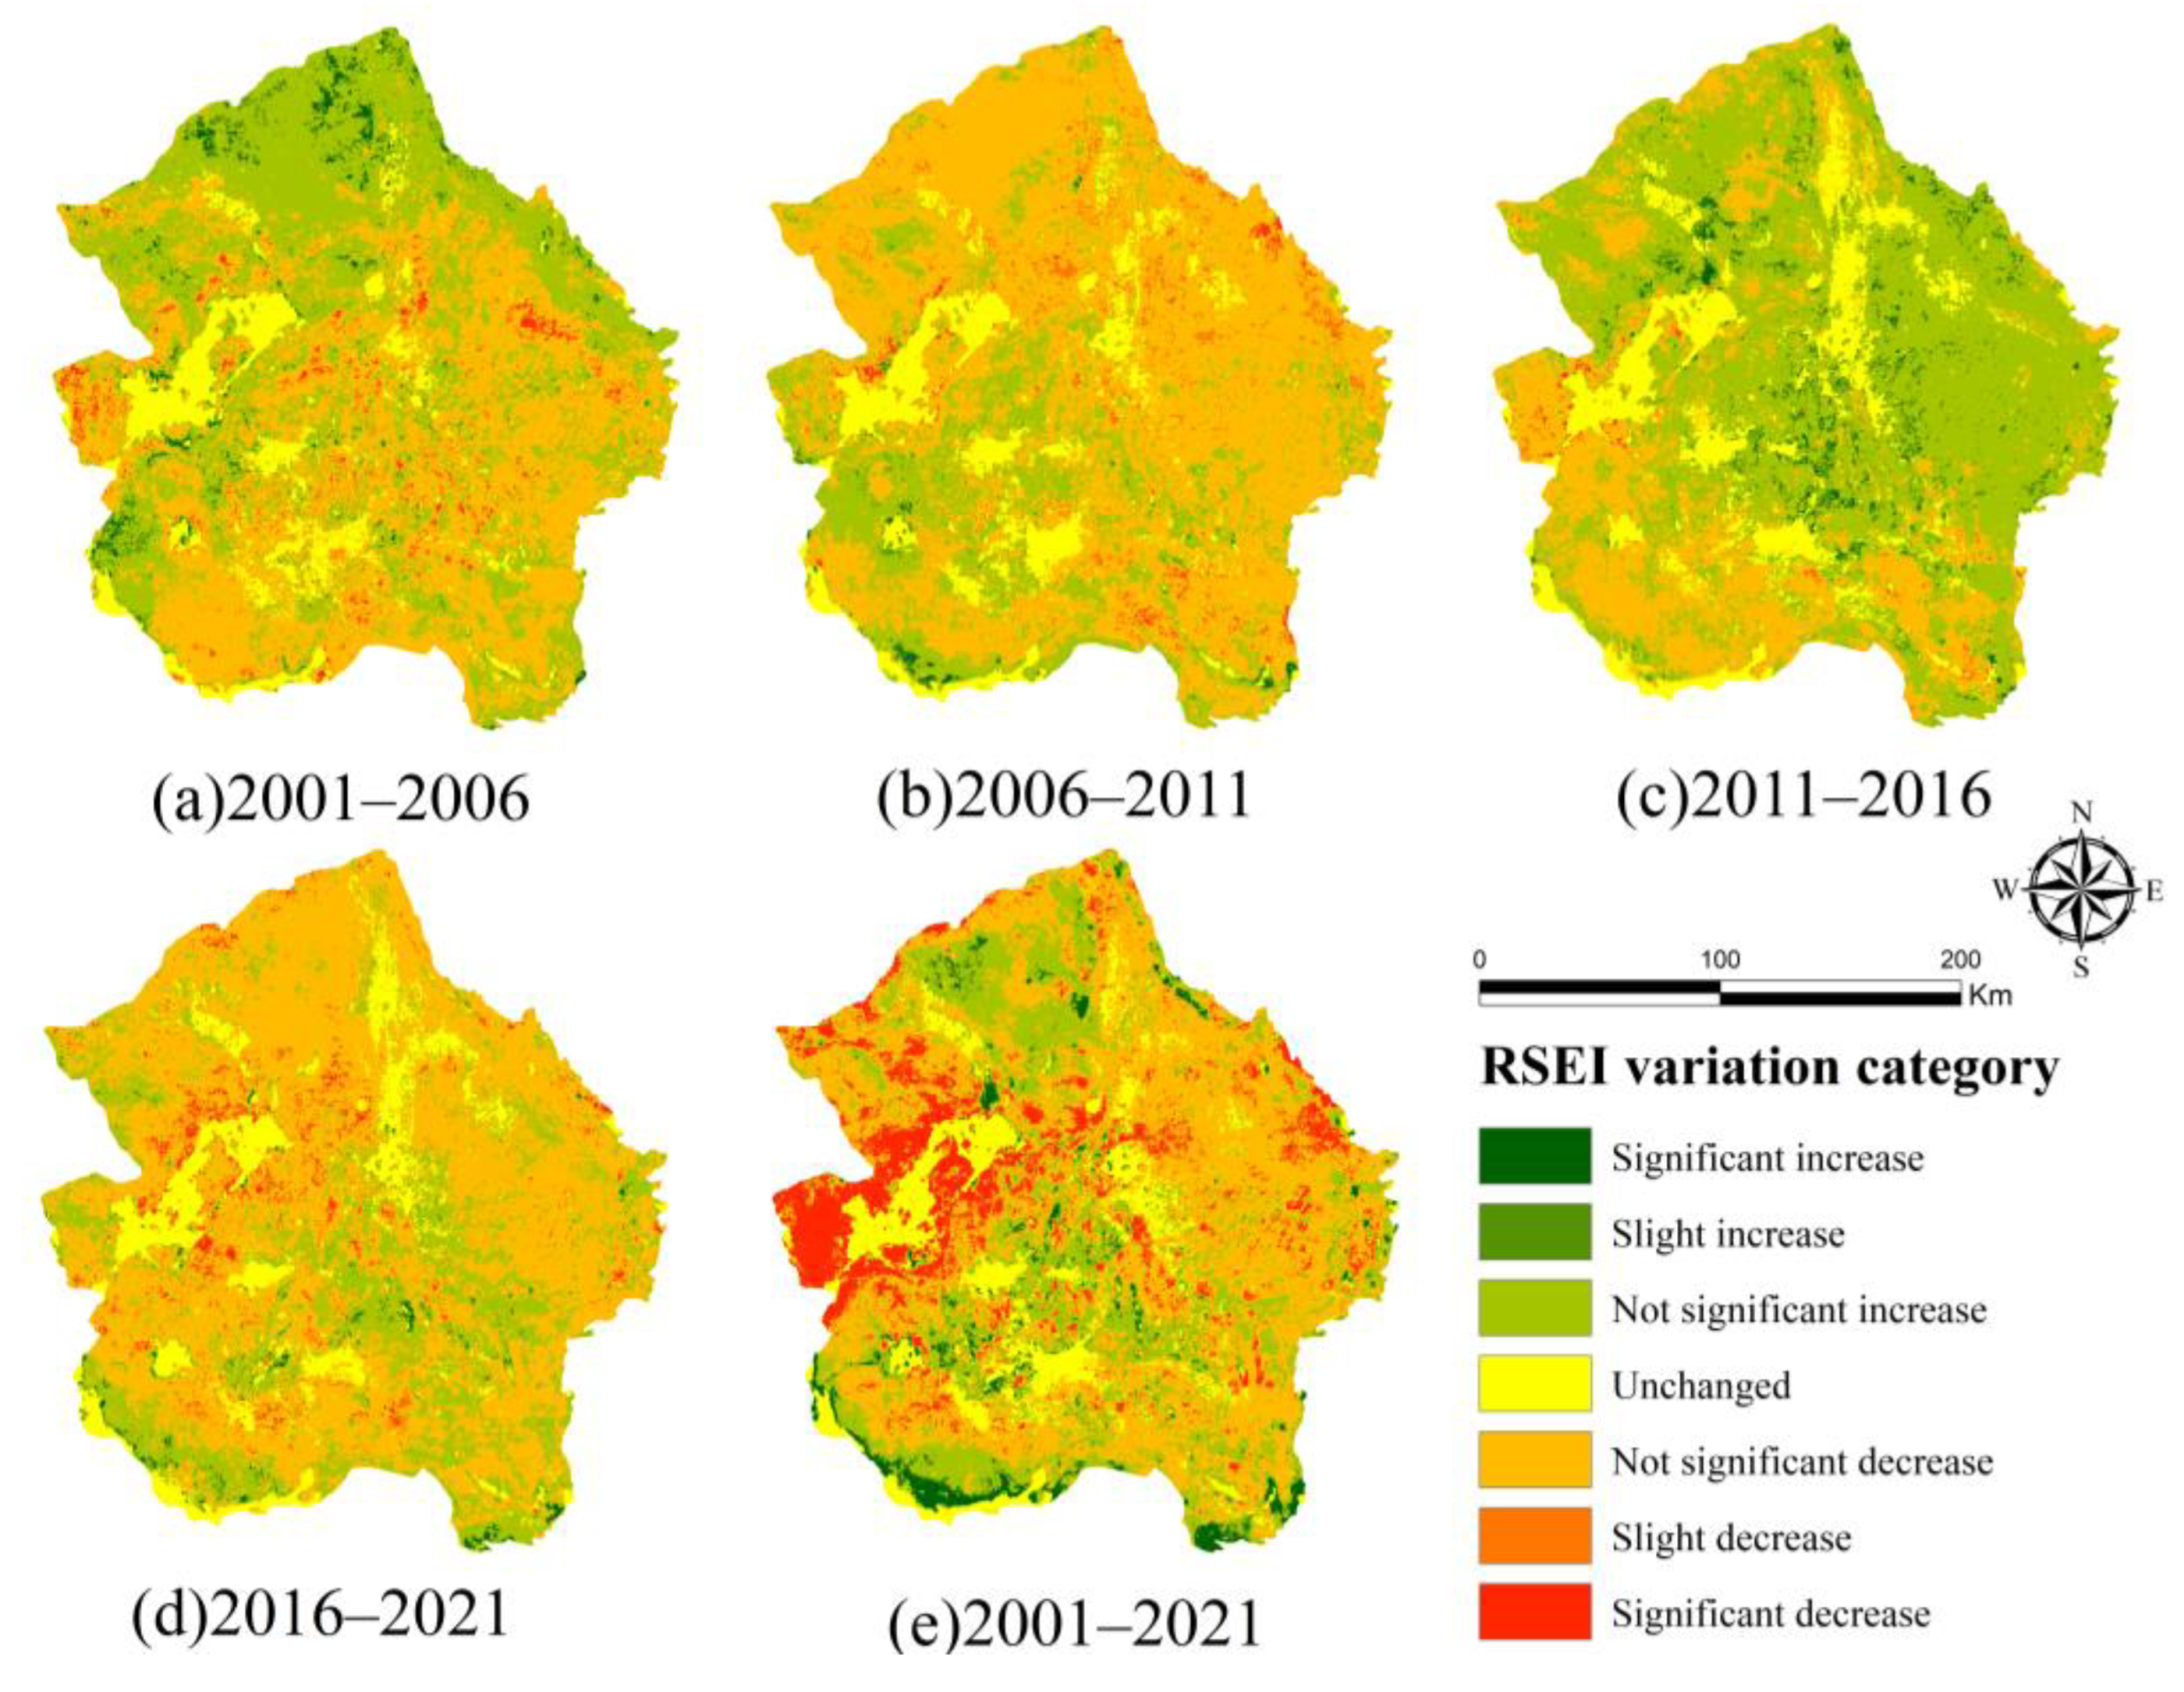
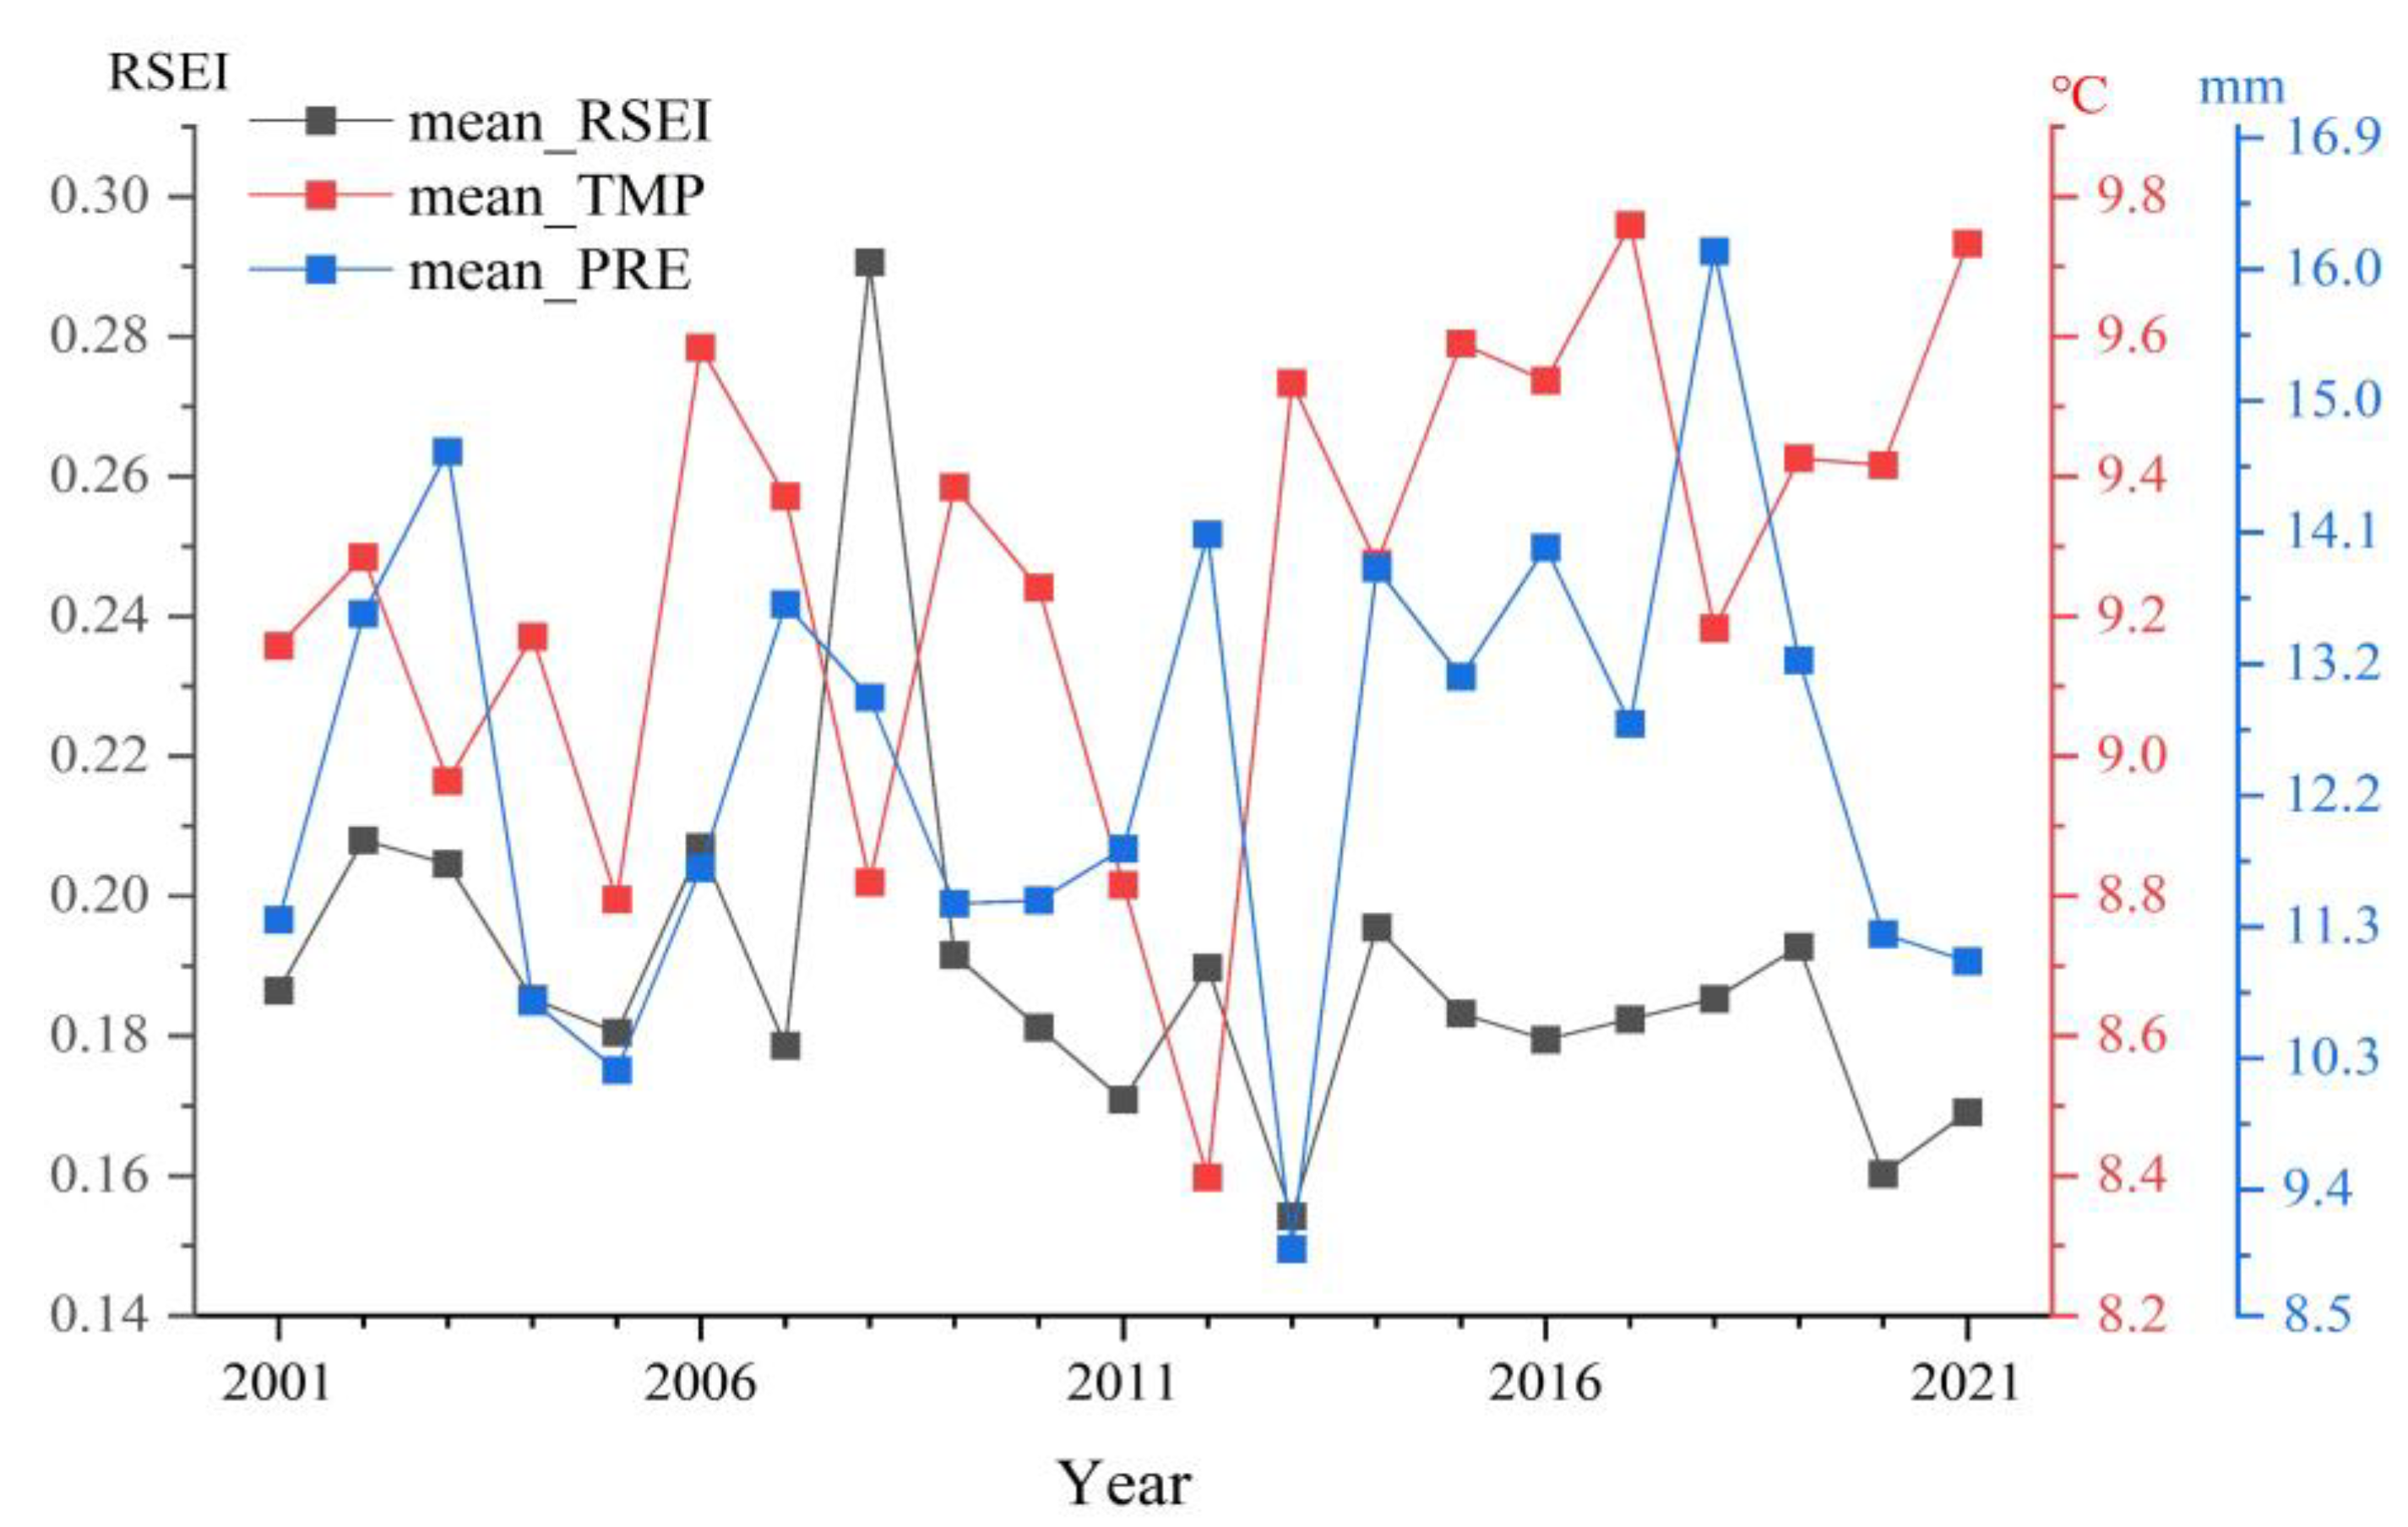
From 2001 to 2021, the average RSEI value in the Tengger Desert decreased by 9.33%, reflecting an overall decline in ecological quality. There are periodic changes in the ecological quality in the study area: 2001–2006 is the improvement stage, 2006–2011 is the accelerated deterioration stage, 2011–2016 is the improvement stage, and 2016–2021 is the deterioration stage. Through the analysis of a spatial transfer matrix, it is concluded that the ecological positions of different levels have migrated, mainly between two adjacent levels.
(2)
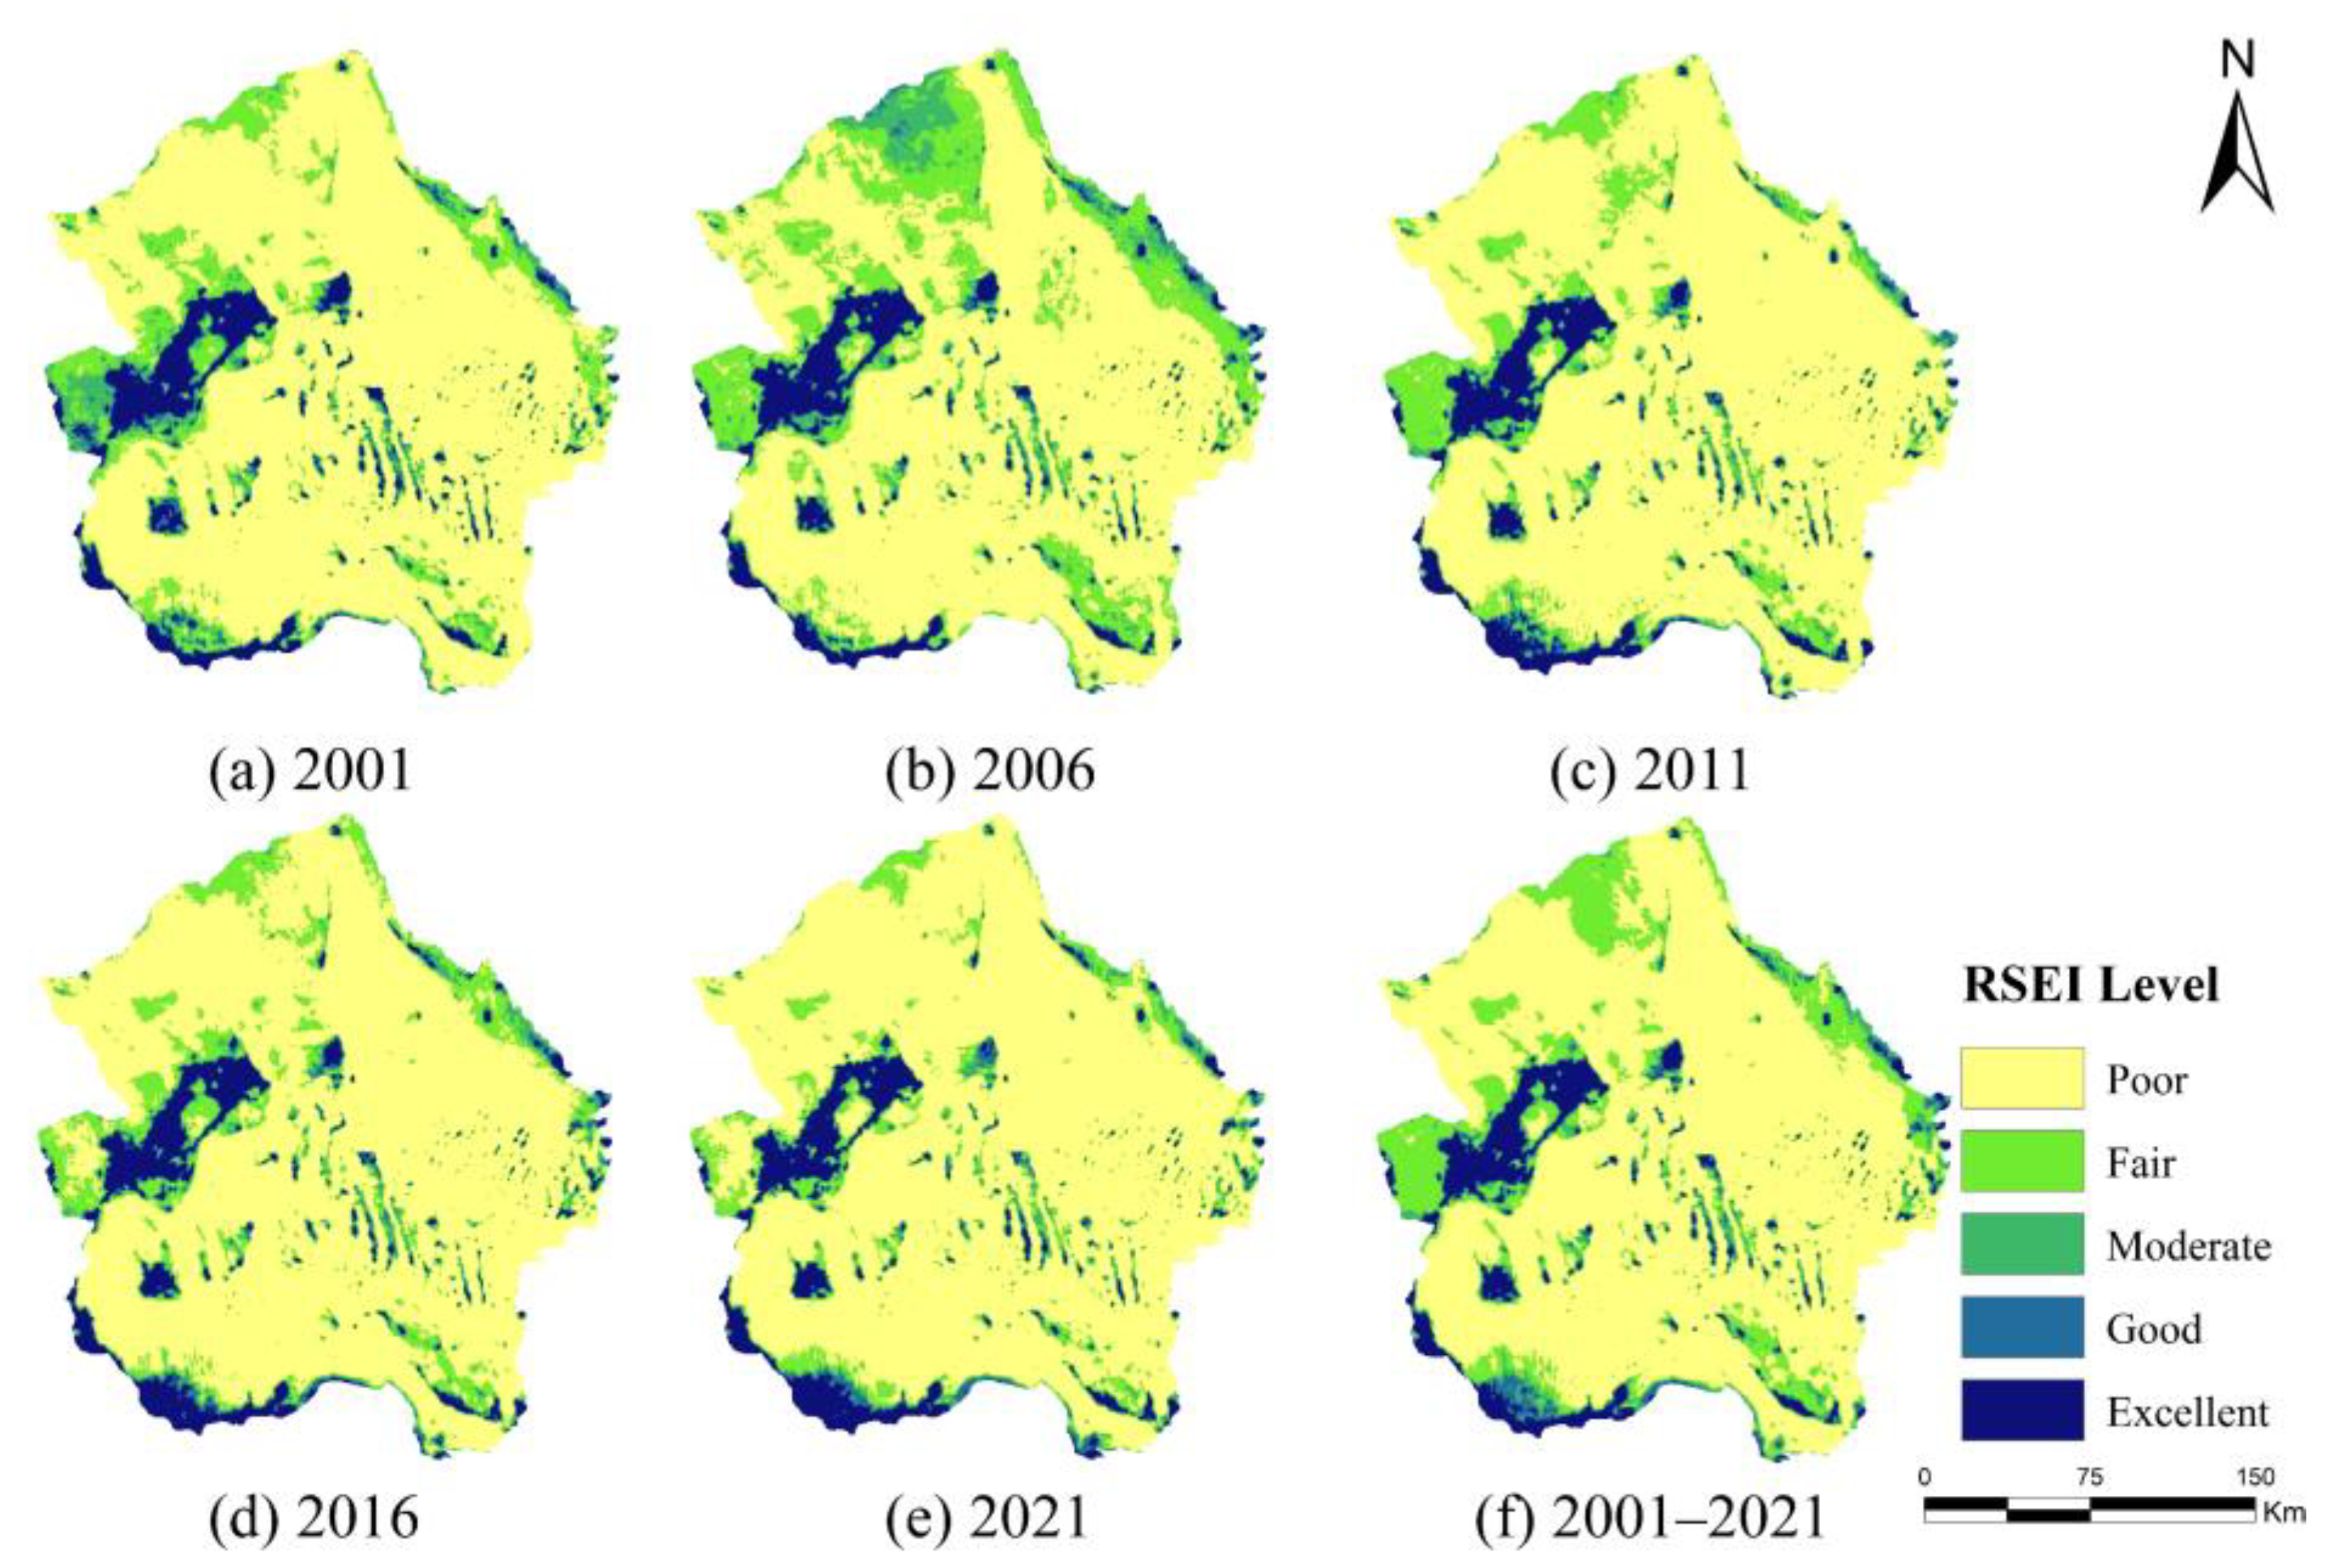
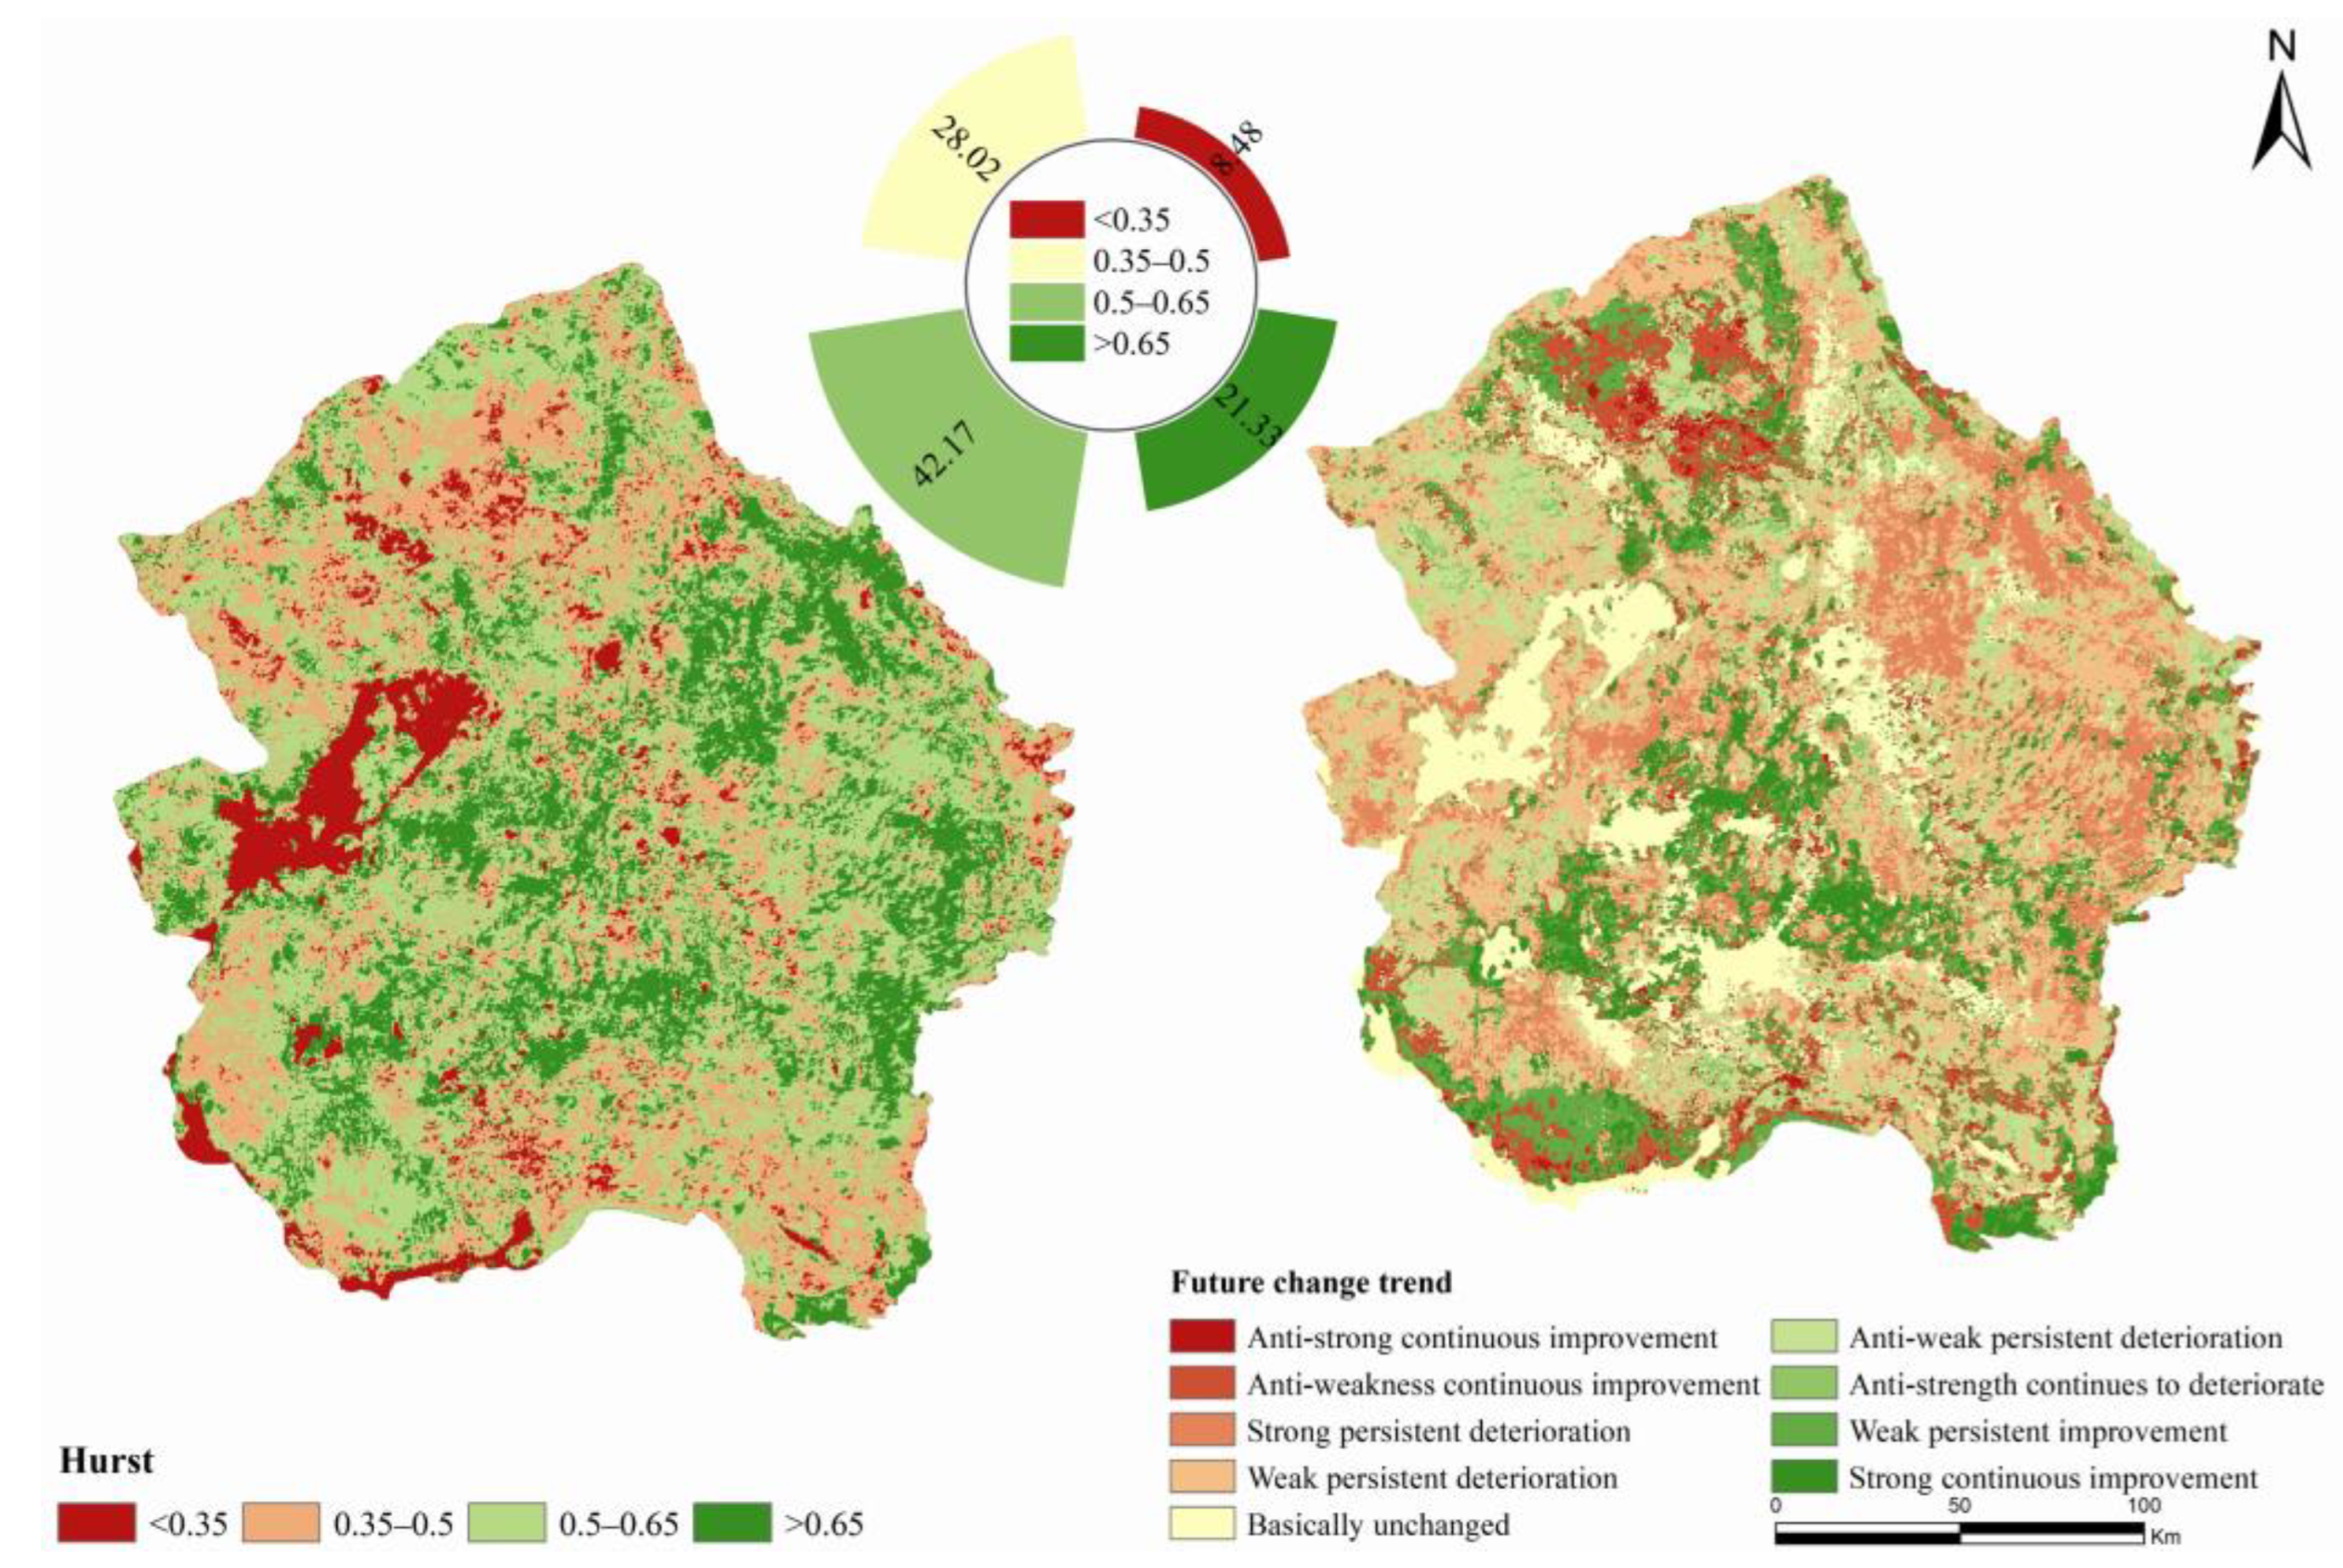
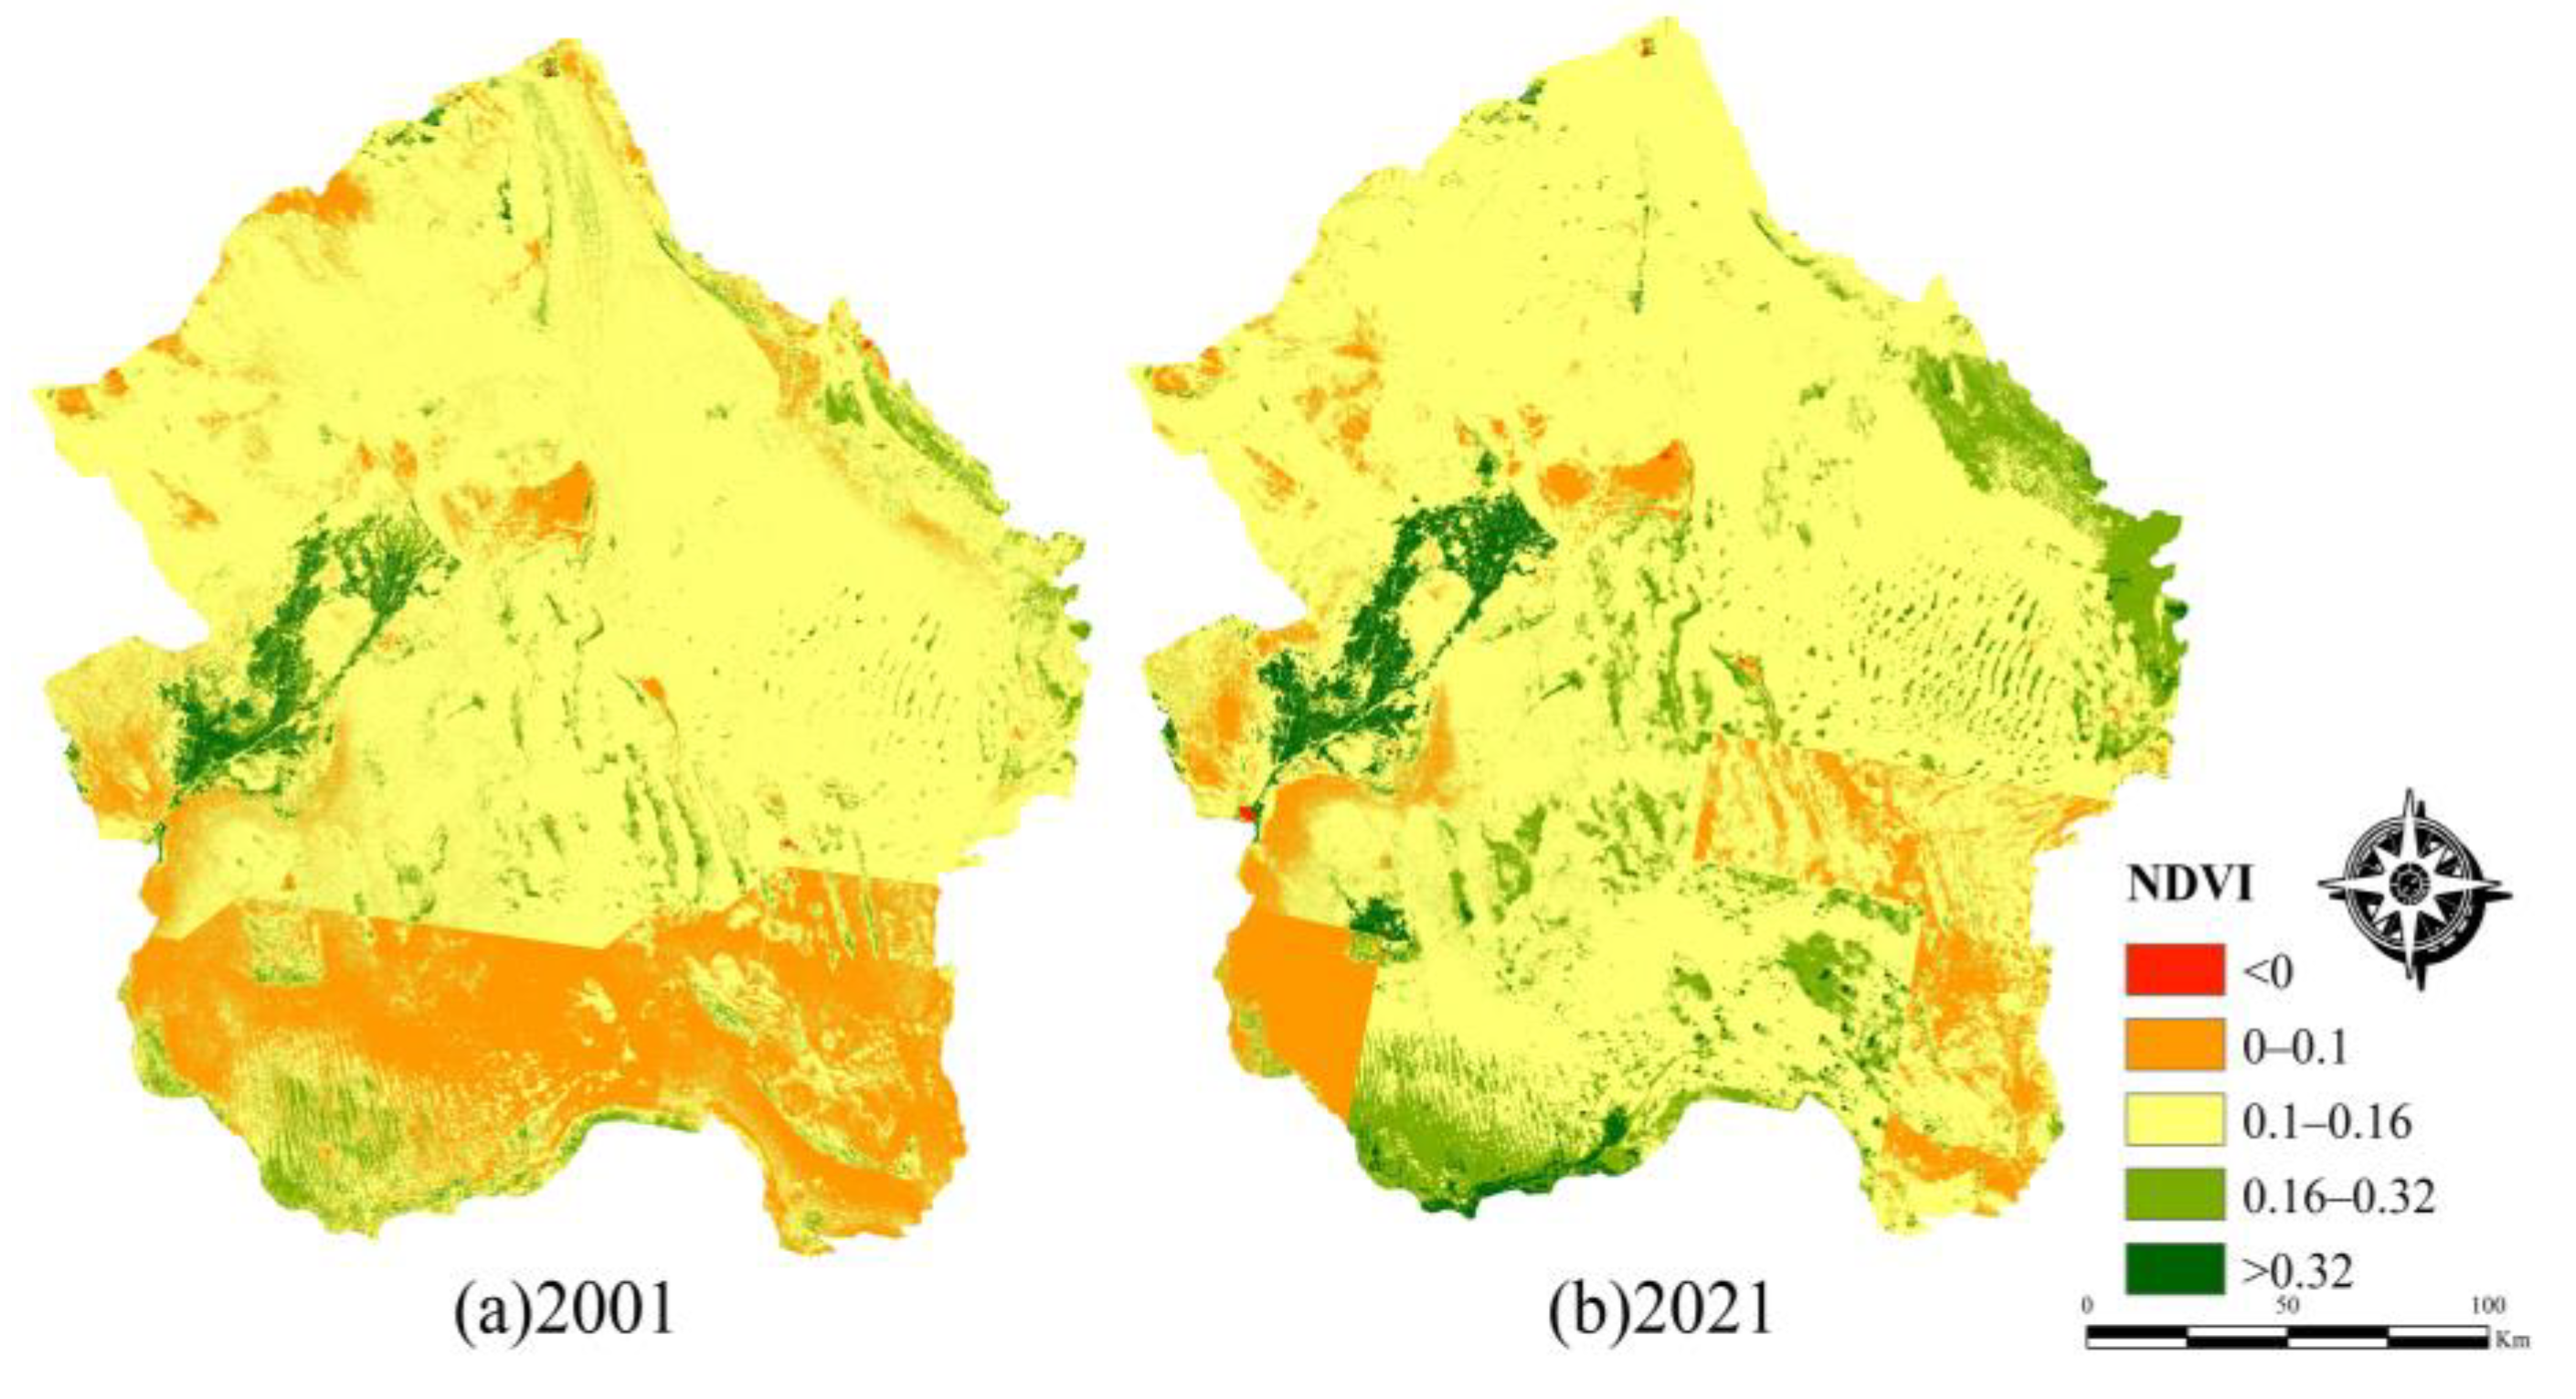
From 2001 to 2021, the ecological quality of the Tengger Desert was in a deteriorating state, mainly distributed in a large area, with the largest area of mild deterioration. The improvement area accounted for 28.21%, mainly distributed in the edge and centre of the study area. In addition, 49.53% of the study area may be at risk of ecological environment deterioration in the future. It is necessary to pay attention to the ecological situation in the eastern part of the study area and the edges of the towns and take ecological restoration measures to curb the ecological deterioration trend of the Tengger Desert.
(3)
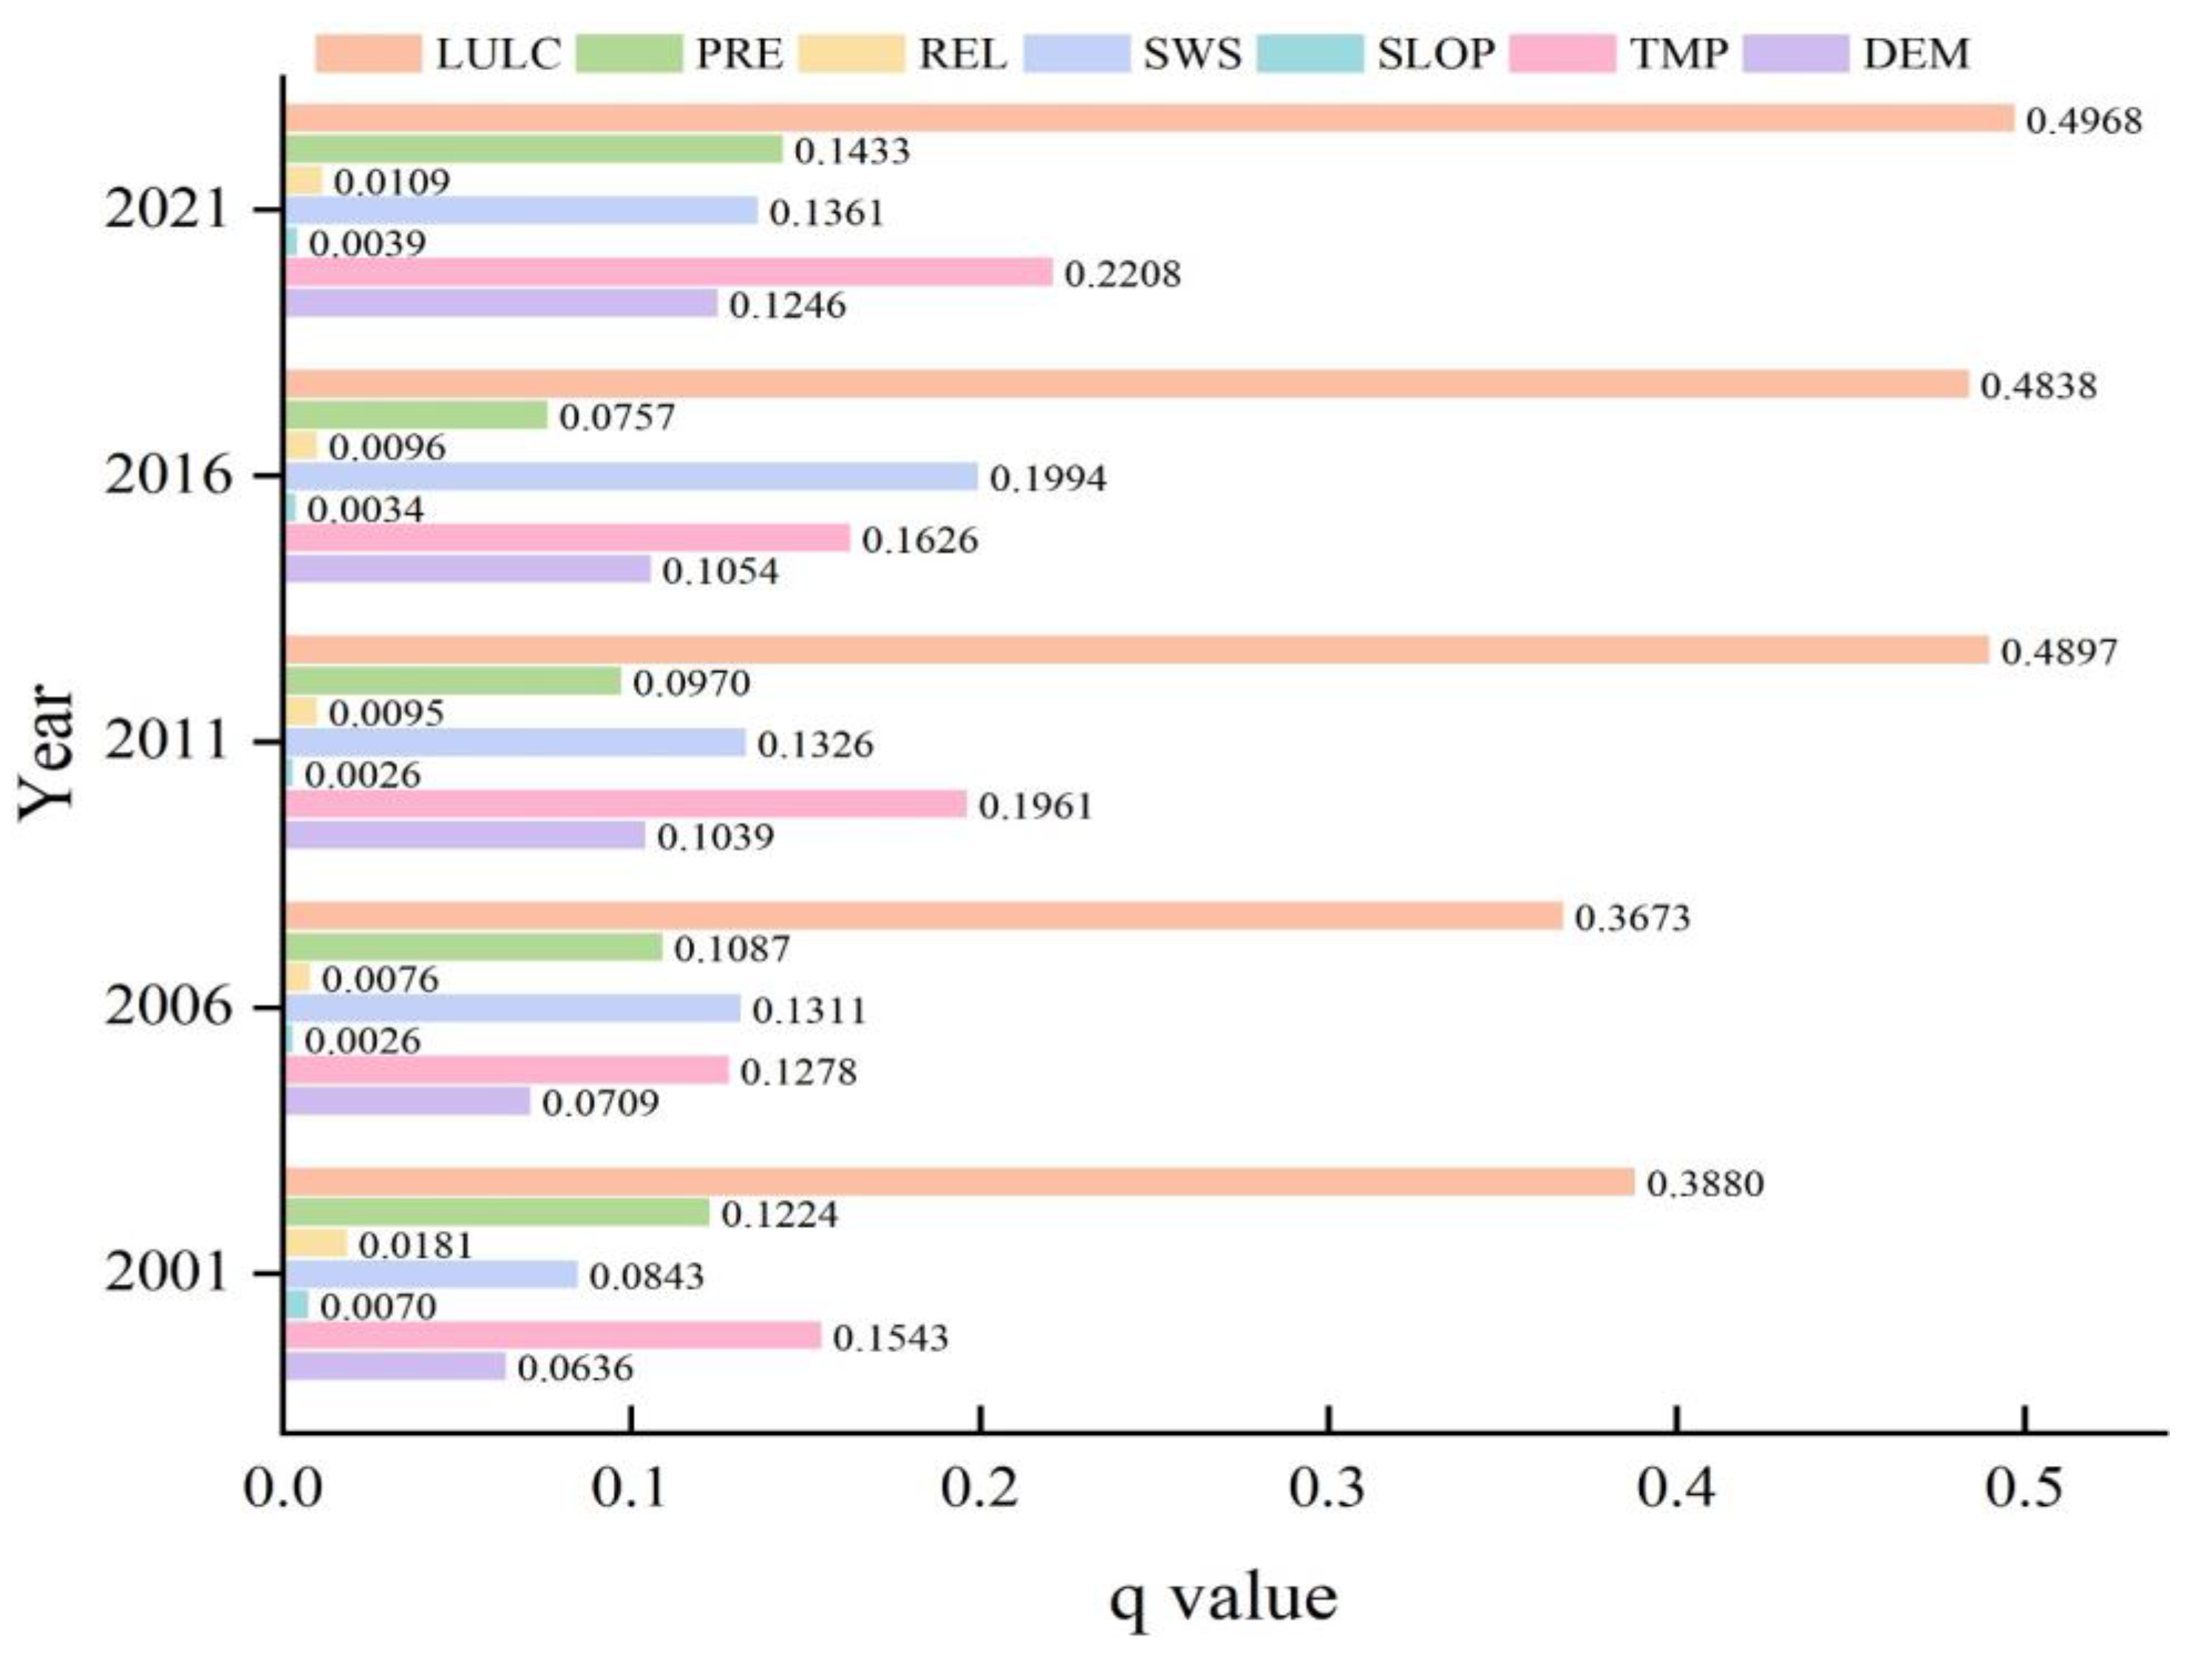
Land use and land use cover emerged as the most significant factors influencing RSEI. The interaction of land use with wind speed had the strongest explanatory power, highlighting the role of anthropogenic factors and natural forces in shaping ecological conditions. Other climate variables, such as temperature and precipitation, also played important roles, though their influence was less pronounced than that of land use.
Overall, this study highlights the spatial and temporal changes in ecological quality in the Tengger Desert, with a general trend of deterioration from 2001 to 2021. Future efforts should focus on sustainable land use practices to mitigate further degradation and protect the region’s fragile environment.

Author Contributions

Conceptualization, F.D.; methodology, F.D.; software, F.D.; validation, L.Z.; data curation, F.D. and L.Z.; writing—original draft preparation, F.D.; writing—review and editing, F.Q., X.D., Y.W. and K.Z.; supervision, X.D.; funding acquisition, F.Q. All authors have read and agreed to the published version of the manuscript.

Funding

This research was supported by the Inner Mongolia Autonomous Region Science and Technology Innovation Major Demonstration Project (2024JBGS0021-4-2) and the Inner Mongolia Autonomous Region Natural Science Foundation Project (2024QN03062).

Data Availability Statement

Data are contained within the article.

Acknowledgments

We would like to thank all anonymous reviewers for their constructive comments on the earlier version of the manuscript, which helps to improve the quality of the manuscript. We are grateful to all organizations that share data.

Conflicts of Interest

The authors declare no conflicts of interest.

References

  1. Ji, J.; Wang, S.; Zhou, Y.; Liu, W.; Wang, L. Spatiotemporal change and landscape pattern variation of eco-environmental quality in Jing-Jin-Ji urban agglomeration from 2001 to 2015. IEEE Access 2020, 8, 125534–125548. [Google Scholar] [CrossRef]
  2. Lin, X.; Lu, C.; Song, K.; Su, Y.; Lei, Y.; Zhong, L.; Gao, Y. Analysis of Coupling Coordination Variance between Urbanization Quality and Eco-Environment Pressure: A Case Study of the West Taiwan Strait Urban Agglomeration, China. Sustainability 2020, 12, 2643. [Google Scholar] [CrossRef]
  3. Feng, S.; Zhao, W.; Yan, J.; Xia, F.; Pereira, P. Land degradation neutrality assessment and factors influencing it in China’s arid and semiarid regions. Sci. Total Environ. 2024, 925, 171735. [Google Scholar] [CrossRef] [PubMed]
  4. Wang, G.; Qin, Y.; Xie, Y.W.; Shen, J.; Zhao, L.; Huang, B.; Zhao, W.Q. Coalbed methane system potential evaluation and favourable area prediction of Gujiao blocks, Xishan coalfield, based on multi-level fuzzy mathematical analysis. J. Pet. Sci. Eng. 2018, 160, 136–151. [Google Scholar] [CrossRef]
  5. Li, Y.; Wu, L.; Han, Q.; Wang, X.; Zou, T.; Fan, C. Estimation of remote sensing based ecological index along the Grand Canal based on PCA-AHP-TOPSIS methodology. Ecol. Indic. 2021, 122, 107214. [Google Scholar] [CrossRef]
  6. Gössling, S.; Hansson, C.; Hörstmeier, O.; Saggel, S. Ecological footprint analysis as a tool to assess tourism sustainability. Ecol. Econ. 2002, 43, 199–211. [Google Scholar] [CrossRef]
  7. Wen, l.; Bai, H.; Jing, Q.; Liu, T.; He, X. Urbanization-induced ecological degradation in Midwestern China: An analysis based on an improved ecological footprint model. Resour. Conserv. Recycl. 2018, 137, 113–125. [Google Scholar] [CrossRef]
  8. Li, C.; Wu, J.; Li, D.; Yan, J.; Wu, Y. Study on the Correlation between Life Expectancy and the Ecological Environment around the Cities along the Belt and Road. Int. J. Environ. Res. Public Health 2023, 20, 2147. [Google Scholar] [CrossRef]
  9. Liu, Y.; Dang, C.; Yue, H.; Lv, C.; Qian, J.; Zhu, R. Comparison between modified remote sensing ecological index and RSEI. Natl. Remote Sens. Bull. 2022, 26, 683–697. [Google Scholar] [CrossRef]
  10. Xu, H.; Wang, Y.; Guan, H.; Shi, T.; Hu, X. Detecting ecological changes with a remote sensing based ecological index (RSEI) produced time series and change vector analysis. Remote Sens. 2019, 11, 2345. [Google Scholar] [CrossRef]
  11. Zhang, C.; Li, F.; Li, J.; Zhang, K.; Ran, W.; Du, M.; Guo, J.; Hou, G. Assessing the effect, attribution, and potential of vegetation restoration in open-pit coal mines’ dumping sites during 2003–2020 utilizing remote sensing. Ecol. Indic. 2023, 155, 111003. [Google Scholar] [CrossRef]
  12. Baird, J.; Plummer, R.; Jollineau, M.; Dale, G. Evaluating ecological outcomes from environmental stewardship initiatives: A comparative analysis of approaches. J. Environ. Manag. 2021, 297, 113266. [Google Scholar] [CrossRef] [PubMed]
  13. Corbane, C.; Lang, S.; Pipkins, K.; Alleaume, S.; Deshayes, M.; Milián, V.; Strasser, T.; Vanden Borre, J.; Spanhove, T.; Foerster, M. Remote sensing for mapping natural habitats and their conservation status—New opportunities and challenges. Int. J. Appl. Earth Obs. Geoinf. 2015, 37, 7–16. [Google Scholar] [CrossRef]
  14. Willis, K. Remote sensing change detection for ecological monitoring in United States protected areas. Biol. Conserv. 2015, 182, 233–242. [Google Scholar] [CrossRef]
  15. Li, P.; Wang, J.; Liu, M.; Xue, Z.; Bagherzadeh, A.; Liu, M. Spatiotemporal variation characteristics of NDVI and its response to climate on the Loess Plateau from 1985 to 2015. Catena 2021, 203, 105331. [Google Scholar] [CrossRef]
  16. Gao, W.; Zheng, C.; Liu, X.; Lu, Y.; Chen, Y.; Wei, Y.; Ma, Y. NDVI-based vegetation dynamics and their responses to climate change and human activities from 1982 to 2020: A case study in the Mu Us Sandy Land, China. Ecol. Indic. 2022, 137, 108745. [Google Scholar] [CrossRef]
  17. Zhang, J.; Xiao, J.; Tong, X.; Zhang, J.; Meng, P.; Li, J.; Liu, P.; Yu, P. NIRv and SIF better estimate phenology than NDVI and EVI: Effects of spring and autumn phenology on ecosystem production of planted forests. Agric. For. Meteorol. 2022, 315, 108819. [Google Scholar] [CrossRef]
  18. Wang, Q.; Zeng, J.; Qi, J.; Zhang, X.; Zeng, Y.; Shui, W.; Xu, Z.; Zhang, R.; Wu, X.; Cong, J. A multi-scale daily SPEI dataset for drought characterization at observation stations over China’s mainland from 1961 to 2018. Earth Syst. Sci. Data 2021, 13, 331–341. [Google Scholar] [CrossRef]
  19. Liu, C.; Yang, C.; Yang, Q.; Wang, J. Spatiotemporal drought analysis by the standardized precipitation index (SPI) and standardized precipitation evapotranspiration index (SPEI) in Sichuan Province, China. Sci. Rep. 2021, 11, 1280. [Google Scholar] [CrossRef]
  20. Arshad, S.; Ahmad, S.; Abbas, S.; Asharf, A.; Siddiqui, N.; ul Islam, Z. Quantifying the contribution of diminishing green spaces and urban sprawl to urban heat island effect in a rapidly urbanizing metropolitan city of Pakistan. Land Use Policy 2022, 113, 105874. [Google Scholar] [CrossRef]
  21. Singh, P.; Kikon, N.; Verma, P. Impact of land use change and urbanization on urban heat island in Lucknow city, Central India. A remote sensing based estimate. Sustain. Cities Soc. 2017, 32, 100–114. [Google Scholar] [CrossRef]
  22. Lin, T.; Ge, R.; Huang, J.; Zhao, Q.; Lin, J.; Huang, N.; Zhang, G.; Li, X.; Ye, H.; Yin, K. A quantitative method to assess the ecological indicator system’s effectiveness: A case study of the Ecological Province Construction Indicators of China. Ecol. Indic. 2016, 62, 95–100. [Google Scholar] [CrossRef]
  23. Qureshi, S.; Alavipanah, S.; Konyushkova, M.; Mijani, N.; Fathololomi, S.; Firozjaei, M.; Homaee, M.; Hamzeh, S.; Kakroodi, A. A Remotely Sensed Assessment of Surface Ecological Change over the Gomishan Wetland, Iran. Remote Sens. 2020, 12, 2989. [Google Scholar] [CrossRef]
  24. Shi, F.; Yang, B.; Li, M. An improved framework for assessing the impact of different urban development strategies on land cover and ecological quality changes-A case study from Nanjing Jiangbei New Area, China. Ecol. Indic. 2023, 147, 109998. [Google Scholar] [CrossRef]
  25. Yang, X.; Meng, F.; Fu, P.; Zhang, Y.; Liu, Y. Spatiotemporal change and driving factors of the Eco-Environment quality in the Yangtze River Basin from 2001 to 2019. Ecol. Indic. 2021, 137, 108214. [Google Scholar] [CrossRef]
  26. Boori, M.; Choudhary, K.; Paringer, R.; Kupriyanov, A. Spatiotemporal ecological vulnerability analysis with statistical correlation based on satellite remote sensing in Samara, Russia. J. Environ. Manag. 2021, 285, 112138. [Google Scholar] [CrossRef]
  27. Zheng, Z.; Wu, Z.; Chen, Y.; Guo, C.; Marinello, F. Instability of remote sensing based ecological index (RSEI) and its improvement for time series analysis. Sci. Total Environ. 2022, 814, 152595. [Google Scholar] [CrossRef]
  28. Firozjaei, M.; Kiavarz, M.; Homaee, M.; Arsanjani, J.; Alavipanah, S. A novel method to quantify urban surface ecological poorness zone: A case study of several European cities. Sci. Total Environ. 2021, 757, 143755. [Google Scholar] [CrossRef]
  29. Chen, W.; Zhao, R.; Lu, H. Response of ecological environment quality to land use transition based on dryland oasis ecological index (DOEI) in dryland: A case study of oasis concentration area in Middle Heihe River, China. Ecol. Indic. 2024, 165, 112214. [Google Scholar] [CrossRef]
  30. Ju, X.; He, J.; Qi, Z.; Saitiniyazi, A. Evolution pattern and driving mechanism of eco-environmental quality in arid oasis belt—A case study of oasis core area in Kashgar Delta. Ecol. Indic. 2023, 154, 110866. [Google Scholar] [CrossRef]
  31. Xu, D.; Yang, F.; Yu, Y.; Zhou, Y.; Li, H.; Ma, J.; Huang, J.; Wei, J.; Xu, Y.; Zhang, C.; et al. Quantization of the coupling mechanism between eco-environmental quality and urbanization from multisource remote sensing data. J. Clean. Prod. 2021, 321, 128948. [Google Scholar] [CrossRef]
  32. Zhao, D.; Wang, Z.; Wu, X.; Qiu, T. Response of vegetation dynamics in environmentally sensitive and fragile areas to natural and anthropogenic factors: A case study in Inner Mongolia Autonomous Region, China. Anthropocene 2023, 44, 100414. [Google Scholar] [CrossRef]
  33. Wang, L.; Qiu, Y.; Han, Z.; Xu, C.; Wu, S.; Wang, Y.; Holmgren, M.; Xu, Z. Climate, topography and anthropogenic effects on desert greening: A 40-year satellite monitoring in the Tengger desert, northern China. Catena 2022, 209, 105851. [Google Scholar] [CrossRef]
  34. Han, T.; Ren, H.; Hui, D.; Zhu, Y.; Lu, H.; Guo, Q.; Wang, J. Dominant ecological processes and plant functional strategies change during the succession of a subtropical forest. Ecol. Indic. 2023, 146, 109885. [Google Scholar] [CrossRef]
  35. Xu, M.; Li, Z. Accumulated temperature changes in desert region and surrounding area during 1960–2013: A case study in the Alxa Plateau. Northwest China. Environ. Earth Sci. 2016, 75, 1276. [Google Scholar] [CrossRef]
  36. Qi, J.; Li, X.; Jia, R.; Yang, H.; Shi, Y.; Sun, J.; Fu, T. Response of biocrust nitrogenase activity to the variation of rainfall regime in the Tengger Desert, northern China. Catena 2022, 212, 106093. [Google Scholar] [CrossRef]
  37. Huang, L.; Zhang, Z. Effect of rainfall pulses on plant growth and transpiration of two xerophytic shrubs in a revegetated desert area: Tengger Desert, China. Catena 2016, 137, 269–276. [Google Scholar] [CrossRef]
  38. Li, Z.; Zhu, R.; Gao, Y.; Chim, C.H.; Liao, H. Recrystallization of Holocene calcareous root tubes in the Tengger Desert, Northwest China and its effects on the reliability of paleoenvironmental reconstruction results. Quat. Int. 2020, 562, 85–93. [Google Scholar] [CrossRef]
  39. Li, J.; Peng, X.; Tang, R.; Geng, J.; Zhang, Z.; Xu, D.; Bai, T. Spatial and Temporal Variation Characteristics of Ecological Environment Quality in China from 2002 to 2019 and Influencing Factors. Land 2024, 13, 110. [Google Scholar] [CrossRef]
  40. Long, T.; Bai, Z.; Zheng, B. Spatiotemporal Dynamics and Driving Forces of Ecological Environment Quality in Coastal Cities: A Remote Sensing and Land Use Perspective in Changle District, Fuzhou. Land 2024, 13, 1393. [Google Scholar] [CrossRef]
  41. Peng, S.; Ding, Y.; Liu, W.; Li, Z. 1 km monthly temperature and precipitation dataset for China from 1901 to 2017. Earth Syst. Sci. Data 2019, 11, 1931–1946. [Google Scholar] [CrossRef]
  42. Peng, S.; Ding, Y.; Wen, Z.; Chen, Y.; Cao, Y.; Ren, J. Spatiotemporal change and trend analysis of potential evapotranspiration over the Loess Plateau of China during 2011–2100. Agric. For. Meteorol. 2017, 233, 183–194. [Google Scholar] [CrossRef]
  43. Peng, S.; Gang, C.; Cao, Y.; Chen, Y. Assessment of climate change trends over the Loess Plateau in China from 1901 to 2100. Int. J. Climatol. 2018, 38, 2250–2264. [Google Scholar] [CrossRef]
  44. Jing, W.; Yang, Y.; Yue, X.; Zhao, X. A Spatial Downscaling Algorithm for Satellite-Based Precipitation over the Tibetan Plateau Based on NDVI, DEM, and Land Surface Temperature. Remote Sens. 2016, 8, 655. [Google Scholar] [CrossRef]
  45. Yang, J.; Huang, X. The 30 m annual land cover dataset and its dynamics in China from 1990 to 2019. Earth Syst. Sci. Data 2021, 13, 3907–3925. [Google Scholar] [CrossRef]
  46. Li, Y.; Xie, T.; Yang, H.; Li, X. Revegetation enhances soil organic carbon mineralization and its temperature sensitivity in the Tengger Desert, North China. Catena 2022, 218, 106541. [Google Scholar] [CrossRef]
  47. Sen, P.K. Estimates of the regression coefficient based on Kendall’s tau. J. Am. Stat. Assoc. 1968, 63, 1379–1389. [Google Scholar] [CrossRef]
  48. Mann, H.B. Nonparametric tests against trend. Econometrica 1945, 13, 245–259. [Google Scholar] [CrossRef]
  49. Kendall, M. The treatment of ties in ranking problems. Biometrika 1945, 33, 239–251. [Google Scholar] [CrossRef]
  50. Moran, P.A. Notes on continuous stochastic phenomena. Biometrika 1950, 37, 17–23. [Google Scholar] [CrossRef]
  51. Jing, Y.; Zhang, F.; He, Y.; Kung, H.; Johnson, V.; Arikena, M. Assessment of spatial and temporal variation of ecological environment quality in Ebinur Lake Wetland National Nature Reserve, Xinjiang, China. Ecol. Indic. 2020, 110, 105874. [Google Scholar] [CrossRef]
  52. Gedamu, W.; Plank-Wiedenbeck, U.; Wodajo, B. A spatial autocorrelation analysis of road traffic crash by severity using Moran’s I spatial statistics: A comparative study of Addis Ababa and Berlin cities. Accid. Anal. Prev. 2024, 200, 107535. [Google Scholar] [CrossRef] [PubMed]
  53. Hurst, H. Long-term storage capacity of reservoirs. Trans. Am. Soc. Civ. Eng. 1951, 116, 770–799. [Google Scholar] [CrossRef]
  54. Lv, Y.; Xiu, L.; Yao, X.; Yu, Z.; Huang, X. Spatiotemporal evolution and driving factors analysis of the eco-quality in the Lanxi urban agglomeration. Ecol. Indic. 2023, 156, 111114. [Google Scholar] [CrossRef]
  55. An, M.; Xie, P.; He, W.; Wang, B.; Huang, J.; Khanal, R. Spatiotemporal change of ecologic environment quality and human interaction factors in three gorges ecologic economic corridor, based on RSEI. Ecol. Indic. 2022, 141, 109090. [Google Scholar] [CrossRef]
  56. Wu, J.; Zhang, Q.; Li, A.; Liang, C. Historical landscape dynamics of Inner Mongolia: Patterns, drivers, and impacts. Landsc. Ecol. 2015, 30, 1579–1598. [Google Scholar] [CrossRef]
  57. Liu, H.; Sun, H. “Tengger Desert Border-Locking Ecology Project” in full swing. Inner Mongolia Daily, 13 April 2008; p. 1. (In Chinese) [Google Scholar]
  58. Yang, H.; Yu, J.; Xu, W.; Wu, Y.; Lei, X.; Ye, J.; Geng, J.; Ding, Z. Long-time series ecological environment quality monitoring and cause analysis in the Dianchi Lake Basin, China. Ecol. Indic. 2023, 148, 110084. [Google Scholar] [CrossRef]
  59. Yang, L.; Shi, L.; Wei, J.; Wang, Y. Spatiotemporal evolution of ecological environment quality in arid areas based on the remote sensing ecological distance index: A case study of Yuyang district in Yulin city, China. Open Geosci. 2021, 13, 1701–1710. [Google Scholar] [CrossRef]
  60. Chen, S.; Zhang, Q.; Chen, Y.; Zhou, H.; Xiang, Y.; Liu, Z.; Hou, Y. Vegetation Change and Eco-Environmental Quality Evaluation in the Loess Plateau of China from 2000 to 2020. Remote Sens. 2023, 15, 424. [Google Scholar] [CrossRef]
  61. Li, G.; Gao, X.; Xiao, N. Spatial and Temporal Changes of Ecosystem Quality Based on Key Indicators in Yellow River Basin from 2000 to 2018. Res. Environ. Sci. 2021, 34, 2945–2953. [Google Scholar] [CrossRef]
  62. Broquet, M.; Campos, F.; Cabral, P.; David, J. Habitat quality on the edge of anthropogenic pressures: Predicting the impact of land use changes in the Brazilian Upper Paraguay river Basin. J. Clean. Prod. 2024, 459, 142546. [Google Scholar] [CrossRef]
  63. Tang, J.; Zhou, L.; Dang, X.; Hu, F.; Yuan, B.; Yuan, Z.; Wei, L. Impacts and predictions of urban expansion on habitat quality in the densely populated areas: A case study of the Yellow River Basin, China. Ecol. Indic. 2023, 151, 110320. [Google Scholar] [CrossRef]
  64. Zhao, Y.; Qu, Z.; Zhang, Y.; Ao, Y.; Han, L.; Kang, S.; Sun, Y. Effects of human activity intensity on habitat quality based on nighttime light remote sensing: A case study of Northern Shaanxi, China. Sci. Total Environ. 2022, 851, 158037. [Google Scholar] [CrossRef] [PubMed]
  65. Zhang, T.; Chen, Y.; Ali, S. Abiotic stress and human activities reduce plant diversity in desert riparian forests. Ecological Indicators 2023, 152, 110340. [Google Scholar] [CrossRef]
  66. Alharbi, O.; Rangel-Buitrago, N. Landscape degradation in the Jazan coastal desert: Understanding the impact of human activities. Mar. Pollut. Bull. 2023, 190, 14874. [Google Scholar] [CrossRef]
  67. Varghese, N.; Singh, P. Linkages between land use changes, desertification and human development in the Thar Desert Region of India. Land Use Policy 2016, 51, 18–25. [Google Scholar] [CrossRef]
  68. Liu, J.; Kuang, W.; Zhang, Z.; Xu, X.; Qin, Y.; Ning, J.; Zhou, W.; Zhang, S.; Li, R.; Yan, C.; et al. Spatiotemporal characteristics, patterns and causes of land use changes in China since the late 1980s. J. Geogr. Sci. 2014, 24, 195–210. [Google Scholar] [CrossRef]
  69. Li, Y.; Tian, H.; Zhang, J.; Lu, S.; Xie, Z.; Shen, W.; Zheng, Z.; Li, M.; Rong, P.; Qin, Y. Detection of spatiotemporal changes in ecological quality in the Chinese mainland: Trends and attributes. Sci. Total Environ. 2023, 884, 163791. [Google Scholar] [CrossRef]
  70. Chen, L.; Yang, H.; Huang, H.; Chang, M.; Wang, X.; Han, D.; Liu, S.; Xiao, Y.; Yao, D.; Xiang, X.; et al. How do natural and socio-economic factors influence the sustainable development of the ecological environment in the World Natural Heritage Sites? Evidence from the Jiuzhaigou, China. J. Clean. Prod. 2023, 458, 139238. [Google Scholar] [CrossRef]
  71. Zhao, Z.; Zhao, W.; Su, Y.; Huang, L.; Li, W.; Luo, J. Spatio-temporal Evolution Patterns and Spatial Differentiation Attribution of Ecological Quality in Guiyang from 1991 to 2020. Environ. Sci. 2024, 1–17. (In Chinese) [Google Scholar] [CrossRef]
  72. Fu, L.; Zhou, Y.; Liu, G.; Song, K.; Tao, H.; Zhao, F.; Li, S.; Shi, S.; Shang, Y. Retrieval of Chla Concentrations in Lake Xingkai Using OLCI Images. Remote Sens. 2023, 15, 3809. [Google Scholar] [CrossRef]
  73. Jayaram, C.; Patidar, G.; Swain, D.; Chowdary, V.; Bandyopadhyay, S. Total suspended matter distribution in the hooghly river estuary and the sundarbans: A remote sensing approach. IEEE J. Sel. Top. Appl. Earth Obs. Remote Sens. 2021, 14, 9064–9070. [Google Scholar] [CrossRef]
  74. Lu, S.; Deng, R.; Liang, Y.; Xiong, L.; Ai, X.; Qin, Y. Remote Sensing Retrieval of Total Phosphorus in the Pearl River Channels Based on the GF-1 Remote Sensing Data. Remote Sens. 2020, 12, 1420. [Google Scholar] [CrossRef]
  75. Lu, Z.; Hou, J.; Lu, H. Research on the Influence of Satellite Image Resolution in Urban Ecological Environment Quality Evaluation Based on Remote Sensing Ecological Index. Green Technol. 2021, 23, 173–177+181. [Google Scholar] [CrossRef]
  76. Shi, J.; Shi, P.; Li, X.; Wang, Z.; Xu, A. Spatial and temporal variability of ecosystem services in the Shiyang River Basin and its multi-scale influencing factors. Prog. Geogr. 2024, 43, 276–289. [Google Scholar] [CrossRef]
  77. Song, Y.; Wang, J.; Ge, Y.; Xu, C. An optimal parameters-based geographical detector model enhances geographic characteristics of explanatory variables for spatial heterogeneity analysis: Cases with different types of spatial data. Gisci. Remote Sens. 2020, 57, 593–610. [Google Scholar] [CrossRef]
Figure 1. The Tengger Desert geographic location.
Land 13 01838 g001
Figure 2. Interannual RSEI mean value variation chart (2001–2021).
Land 13 01838 g002
Figure 3. Sankey diagram of eco-environment quality grades transfer matrix of the Tengger Desert from 2001 to 2021.
Land 13 01838 g003
Figure 4. Distribution of RSEI ratings in the Tengger Desert from 2001 to 2021.
Land 13 01838 g004
Figure 5. The spatial distribution of changes in the eco-environment quality of the Tengger Desert from 2001 to 2021.
Land 13 01838 g005
Figure 6. Calculation results of Moran’s I.
Land 13 01838 g006
Figure 7. Hurst index of eco-environment and future trend in the Tengger Desert.
Land 13 01838 g007
Figure 8. Factor detector results.
Land 13 01838 g008
Figure 9. Factor interaction detection results.
Land 13 01838 g009
Figure 10. RSEI and mean temperature, mean precipitation time series.
Land 13 01838 g010
Figure 11. NDVI change in the Tengger Desert.
Land 13 01838 g011
Table 1. Interaction types of eco-environment quality in the Tengger desert.
Basis for JudgmentTypes of the Interaction
q ( X 1 X 2 ) < M i n q ( X 1 ) , q ( X 2 ) Nonlinear attenuation
M in q ( X 1 ) , q ( X 2 ) < q ( X 1 X 2 ) < M ax q ( X 1 ) , q ( X 2 ) Unilinear attenuation
q ( X 1 ) + q ( X 2 ) > ( X 1 X 2 ) > M a x q ( X 1 ) , q ( X 2 ) Two-factor enhancement
q ( X 1 X 2 ) = q ( X 1 ) + q ( X 2 ) Independent
q ( X 1 X 2 ) > q ( X 1 ) + q ( X 2 ) nonlinear enhancement
Table 2. Area transfer matrix of different area levels in the Tengger Desert.
RSEI Levels2021 (km2)Total (km2)
PoorFairModerateGoodExcellent
2001
(km2)
Poor2143.48751981.72521979.38791979.15841979.073610,062.8326
Fair1993.39641990.8171980.11761979.57411979.71919923.6242
Moderate1980.45611983.61061981.27881979.74691979.89999904.9923
Good1978.9721979.64971980.96641979.91971980.14579899.6535
Excellent1978.87131979.04491979.61821980.61721990.74589908.8974
Total (km2)10,075.18339914.84749901.36899899.01639909.584149,700
Table 3. Changes in the ecological grade of the Tengger Desert from 2001 to 2021.
RSEI Variation Category2001–20062006–20112011–20162016–20212001–2021
Area
(km2)
Ratio
(%)
Area
(km2)
Ratio
(%)
Area
(km2)
Ratio
(%)
Area
(km2)
Ratio
(%)
Area
(km2)
Ratio
(%)
Significant decrease511.911.03298.200.6109.340.22745.51.505134.0110.33
Slight decrease1103.342.221804.113.63278.320.561689.83.402584.45.2
No significant decrease22,176.1444.6231,435.2563.2512,812.6625.7829,750.4259.8622,449.4945.17
Unchanged4234.448.524796.059.656192.6212.465258.2610.585511.7311.09
No significant increase19,914.7940.0710,93422.0027,856.8556.0511,639.7423.4211,704.3523.55
Slight increase1192.82.4273.350.551868.723.76367.780.74839.931.69
Significant increase566.581.14159.040.32581.491.17248.50.501476.092.97
Table 4. Future change trend of eco-environment in the Tengger Desert.
β R S E I × 10 5 HurstChange DirectionsFuture Change TrendArea (km2)Ratio (%)
<−5<0.35From deterioration to improvementAnti-strength continues to deteriorate1153.042.32
0.35~0.5Anti-weak persistent deterioration8613.0117.33
0.5~0.65Continuous degradationWeak persistent deterioration13,394.1526.95
>0.65Strong persistent deterioration6684.6513.45
≥5<0.35From improvement to deteriorationAnti-strong continuous improvement521.851.05
0.35~0.5Anti-weakness continuous improvement4015.768.08
0.5~0.65Continuous improvementWeak persistent improvement5869.5711.81
>0.65Strong continuous improvement3300.086.64
−5~50~1Basically unchangedBasically unchanged6147.8912.37
Disclaimer/Publisher’s Note: The statements, opinions and data contained in all publications are solely those of the individual author(s) and contributor(s) and not of MDPI and/or the editor(s). MDPI and/or the editor(s) disclaim responsibility for any injury to people or property resulting from any ideas, methods, instructions or products referred to in the content.

