Abstract
Polder landscapes, as a representative of lowland agriculture landscapes, possess diverse natural and cultural values. However, polder landscapes are facing multiple challenges arising from economic and climate changes, including increasing flood threats and the fragmentation of landscape patterns. These issues have severely threatened the safety and regional characteristics of the polder landscape. Therefore, this study aims to preserve the regional characteristics of polder landscapes while promoting the sustainable development of lowland environments, and the objective is to provide a foundation and baseline for the management and planning of polder landscapes. In this study, the Dongting Lake Area (DLA) was selected as a representative case of polder landscapes. To identify the landscape character and delineate the landscape management zones, this study employed the Landscape Character Assessment (LCA) method in conjunction with a polder typology method at two scales. As a result, the polder landscape types were identified and visualized at two different scales. At the Lake Scale, a comprehensive identification method for polder unit types and polder landscape regions was established, achieving a stepwise transition from polder areas to polder clusters and ultimately to individual polder units. At the Local Scale, an integrative analysis of landscape character diversity (LCD) and land construction suitability (LCS) was employed to establish five landscape management zones for polder landscapes, thereby realizing a balance between the conservation of polder landscape diversity with the sustainable development of wetland environments. This study contributes a set of cross-scale ideas and methods for identifying landscape characters and delineating management zones in polder landscapes, which could be expanded to other lowland agricultural landscapes.
1. Introduction
Polder is a significant reclamation method in lowlands [1]. Through the construction of dikes and drainage facilities, water levels inside the polders are regulated, thereby transforming former wetlands into available lands for agriculture cultivation and permanent settlement [2,3]. Polders are widely distributed in coastal and alluvial lowlands globally, evolving into diverse polder landscapes due to the long-term interaction between local communities and wetland environment [1]. These polder landscapes not only possess rich and unique natural and cultural values but are also characterized by multiple functions, including water resource management, agricultural production, and settlement development [4]. In recent decades, the value of polder landscapes has gained increasing recognition, leading to the inclusion of certain polders on international heritage lists, such as the Beemster Polder in the Netherlands (https://whc.unesco.org/zh/list/899, accessed 19 October 2023) and the Lou Gang Polder in China (https://icid-ciid.org/award/his_details/53, accessed 19 October 2023). However, polder landscapes confront numerous challenges arising from climate and economic changes, such as the increasing risk of flood disasters caused by land subsidence [5] and the fragmentation of landscape patterns influenced by rapid urbanization [6]. These issues have severely threatened the safety and regional characteristics of the polder landscape. Therefore, there is a pressing demand for a systematic study on the landscape characters of polder landscapes, in order to provide a foundation for establishing landscape management zones and strategies that balance the conservation of landscape diversity with the promotion of sustainable development in lowland environments.
The landscape character can be revealed through the classification of types and spatial units [7,8], where a pragmatic step involves the selection of appropriate landscape factors or boundaries [9,10,11]. However, the polder landscape, characterized by intricate landscape factors and boundaries, poses a challenge in the identification of polder landscape types and spatial units, particularly when dealing with large-scale polder landscapes requiring cross-scale research. The landscape factors of polder landscape exhibit relative singularity at the large scale [12], while intricately interweaving at the medium and small scales [10]. Furthermore, the polder landscape is not only divided into numerous discrete polder units by water systems or dikes [13] but is also influenced by various landscape boundaries [10], including ambiguous cultural boundaries and dynamically changing natural boundaries. These issues have presented certain challenges to the identification of polder landscape characters and the delineation of management zones, requiring a careful selection of appropriate elements from complex landscape features and boundaries for classification and zoning.
The prevalent approach employed in the existing studies on polder landscape types is polder typology, which typically relies on the qualitative synthesis of individual or multiple factors for classification, or bases on different landscape boundaries for zoning. For instance, Nijhuis categorized the polder landscapes in Netherlands into four types based on underlying surface conditions [1], while Xie classified the polder landscapes in the Yangtze River Delta into five types by integrating various factors such as segmentation patterns of land–water systems and construction techniques [14]. The polder typology method effectively integrates the landscape factors and boundaries of polders. However, it heavily relies on subjective knowledge and judgment, which limits its efficiency. Additionally, due to the relatively homogeneous nature of landform, soil, and land use factors, the number of polder landscape types is relatively limited. Furthermore, it provides limited insight into specific management zones and strategies. On the contrary, the Landscape Character Assessment (LCA) method has rarely been applied to polder landscapes. However, the LCA method offers several advantages for polder landscapes: (1) This approach is compatible with both subjective and objective assessment methods [15], such as holistic and parametric methods [9]. (2) The LCA approach possesses the capability to identify a certain amount of landscape character types (LCTs), even in situations with fewer landscape factors. For instance, Li identified 35 distinct LCTs in the Wuling Mountains by clustering four types of landscape factors [16]. Furthermore, several methods employed in LCA studies were shown to effectively ensure the number of identified LCTs, such as subdividing the study scale and improving the differentiation of variables [7,17]. (4) Additionally, the LCA method can be used to inform policies for landscape conservation and management [18].
The complex landscape boundaries of polder landscapes pose challenges to the visualization of landscape types. Many studies illustrated different types of polder landscapes through partial visualization [4,14], often with limited attention to the boundaries between different types. Some studies classified and visualized polder landscapes by establishing a polder unit database [2,11]. By conducting calibration processing on pertinent maps and vectorizing the polder boundaries, the polder landscape types can be integrated and evaluated [1]. However, the polder landscape types obtained by this method usually exclude the external environment, while the establishment and evolution of the polder landscape are closely related to its external wetland environment [2]. The semi-automatic segmentation method of the LCA method enables the delineation of similar spatial units across various landscape boundaries [7]. By integrating this method with the polder boundary database, it becomes feasible to define the boundaries of the different polder landscape types with the external environment.
Most studies on polder landscape types are focused on their specific natural or cultural characters, with limited attention given to the formulation of specific strategies for conservation or development. The method of integrative analyses of multiple assessments has the capacity to delineate targeted management zones and propose corresponding landscape strategies based on different conservation or development objectives [19,20]. For example, through integrative analyses of landscape character diversity (LCD), overall landscape sensitivity, and urban influence, Wu established five distinct management zones for the Wuhan Metropolitan Area [19]. Through integrative analyses of landscape sensitivity and by developing suitability, Sun established five landscape zones for the Beijing Great Wall Cultural Belt [20].
In this study, we focused on the polder landscape in the Dongting Lake Area (DLA) of China as a case study. The polder landscape in the DLA has a long history of development and is widely distributed. As one of China’s major commodity grain production bases [21], it serves as a typical representative of polder landscapes in the middle and lower reaches of the Yangtze River. By combining the polder typology method with the LCA framework, the landscape character types (LCTs) and landscape character areas (LCAs) of the polder landscape was identified at two scales; by integrating the polder landscape database with the semi-automatic segmentation method of the LCA, a rapid and efficient method for identifying polder unit types and delineating polder landscape regions was established, and the medium-scale study scope was defined; furthermore, through the integrative analysis of LCD and the land construction suitability (LCS) assessment, comprehensive landscape management zones were delineated, and corresponding strategies were proposed based on different conservation or development purposes. This study aims to preserve the distinctive regional characteristics of polder landscapes while concurrently promoting the sustainable development of lowland environments. By identifying the landscape character and delineating landscape management zones, the objective of this study is to provide a foundation and baseline for the effective management and strategic planning of polder landscapes.
2. Materials and Methods
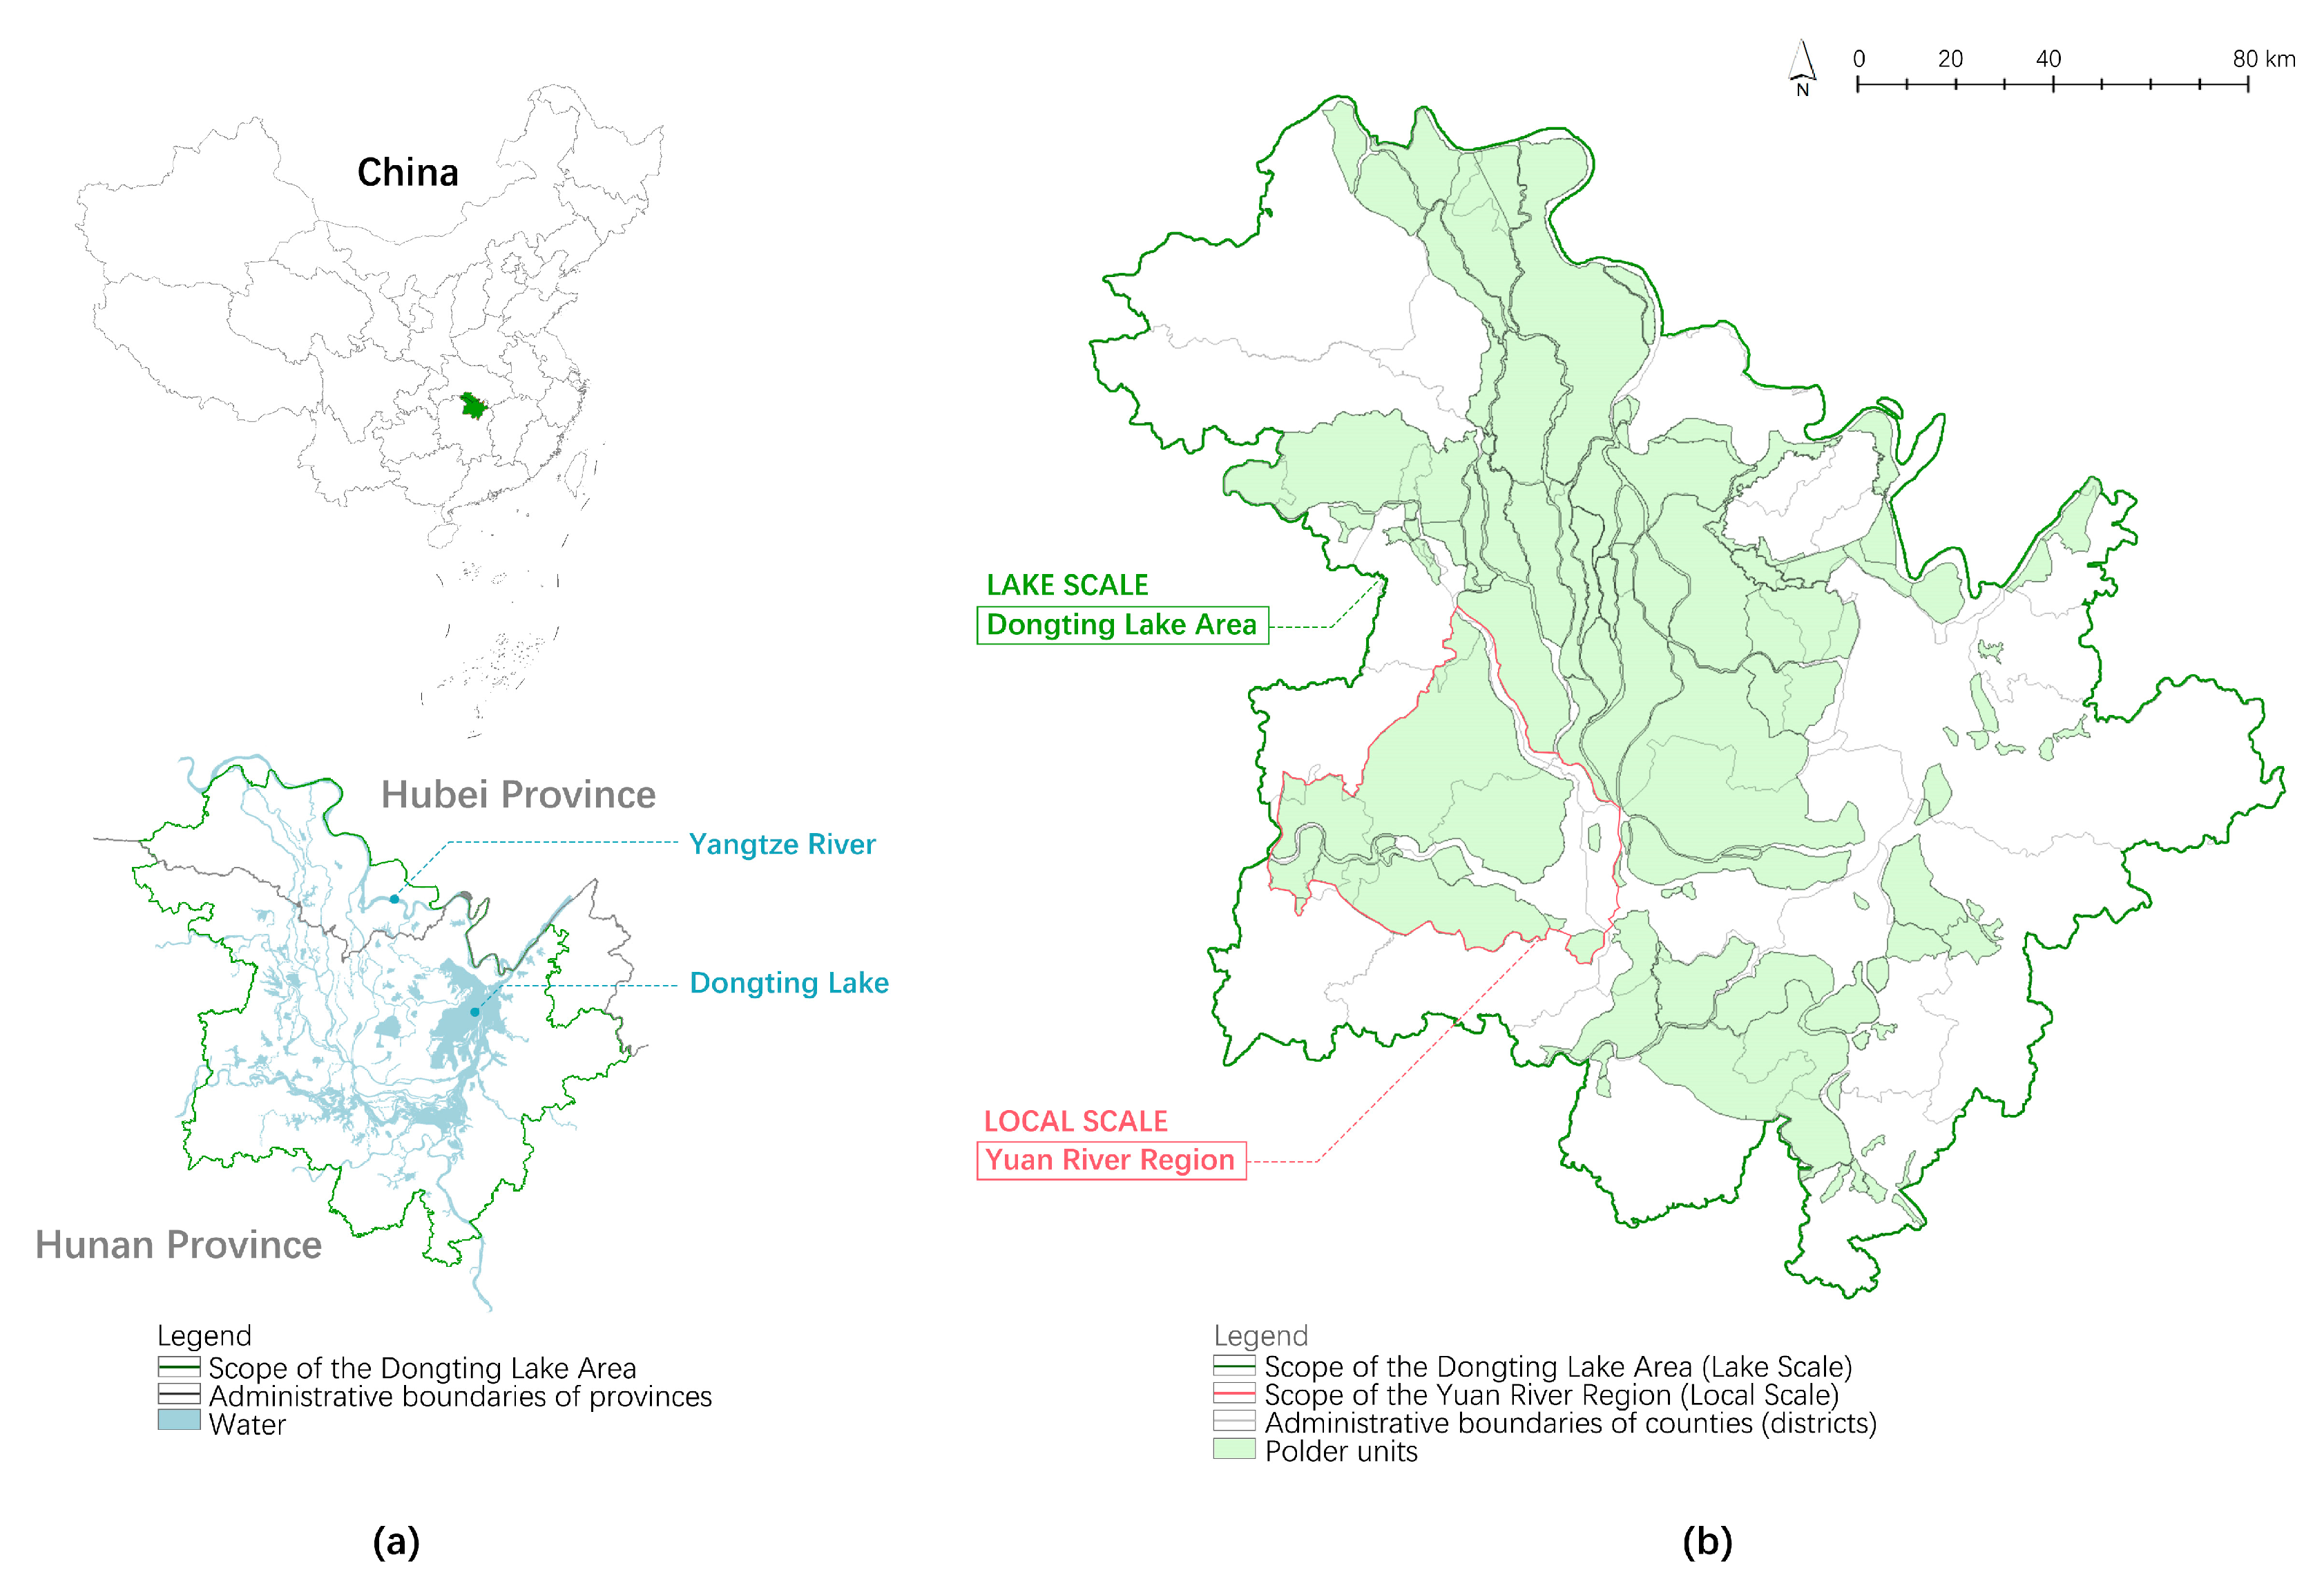
2.1. Study Area
The polder landscape in the DLA represents typical agricultural landscapes in the middle reach of the Yangtze River Plains of China (Figure 1a). These polders have a rich historical lineage, with the earliest documented records dating back to the Song Dynasty (AD 960-1279) [22]. Over centuries of continuous development, they have gradually expanded to cover almost the entire plain of the DLA [2,23].
Figure 1.
Study area and study scales: (a) location of the study area, (b) study scopes of the two study scales.
The issue in this study area lies in the fact that, unlike the well-established and relatively stable polder landscapes observed in regions such as the lower reach of the Yangtze River Plains, the polder landscape in the DLA is situated in a relatively complex and constantly changing natural environment, primarily due to its status as a spillway-type lake [11]. The dynamic nature complicates the factors and boundaries relied upon for classification and zoning purposes in the DLA, thereby posing challenges to the conservation and management of polder landscapes. Therefore, taking the polder landscape in the DLA as a typical case provides a comprehensive demonstration for polder landscapes, particularly for those that are either in the process of development or located in regions undergoing dynamic transformations.
This study was conducted at two different scales. At the Lake Scale, the study scope is the DLA, which consists of the boundaries of 22 counties (districts) as well as the boundaries of polder units primarily located in these counties (districts). This study scope encompasses a total area of approximately 30,002 km2 (Figure 1b). At the Local Scale, the Yuan River region was selected as a typical case, since it was a relatively independent natural geographic region and was one of the earliest regions engaged in polder reclamation in the DLA [2,22]. This study scope was defined by the LCAs associated with the polder units of the Yuan River region and the surrounding wetland environment that were occupied at the previous scale (Figure 1b).
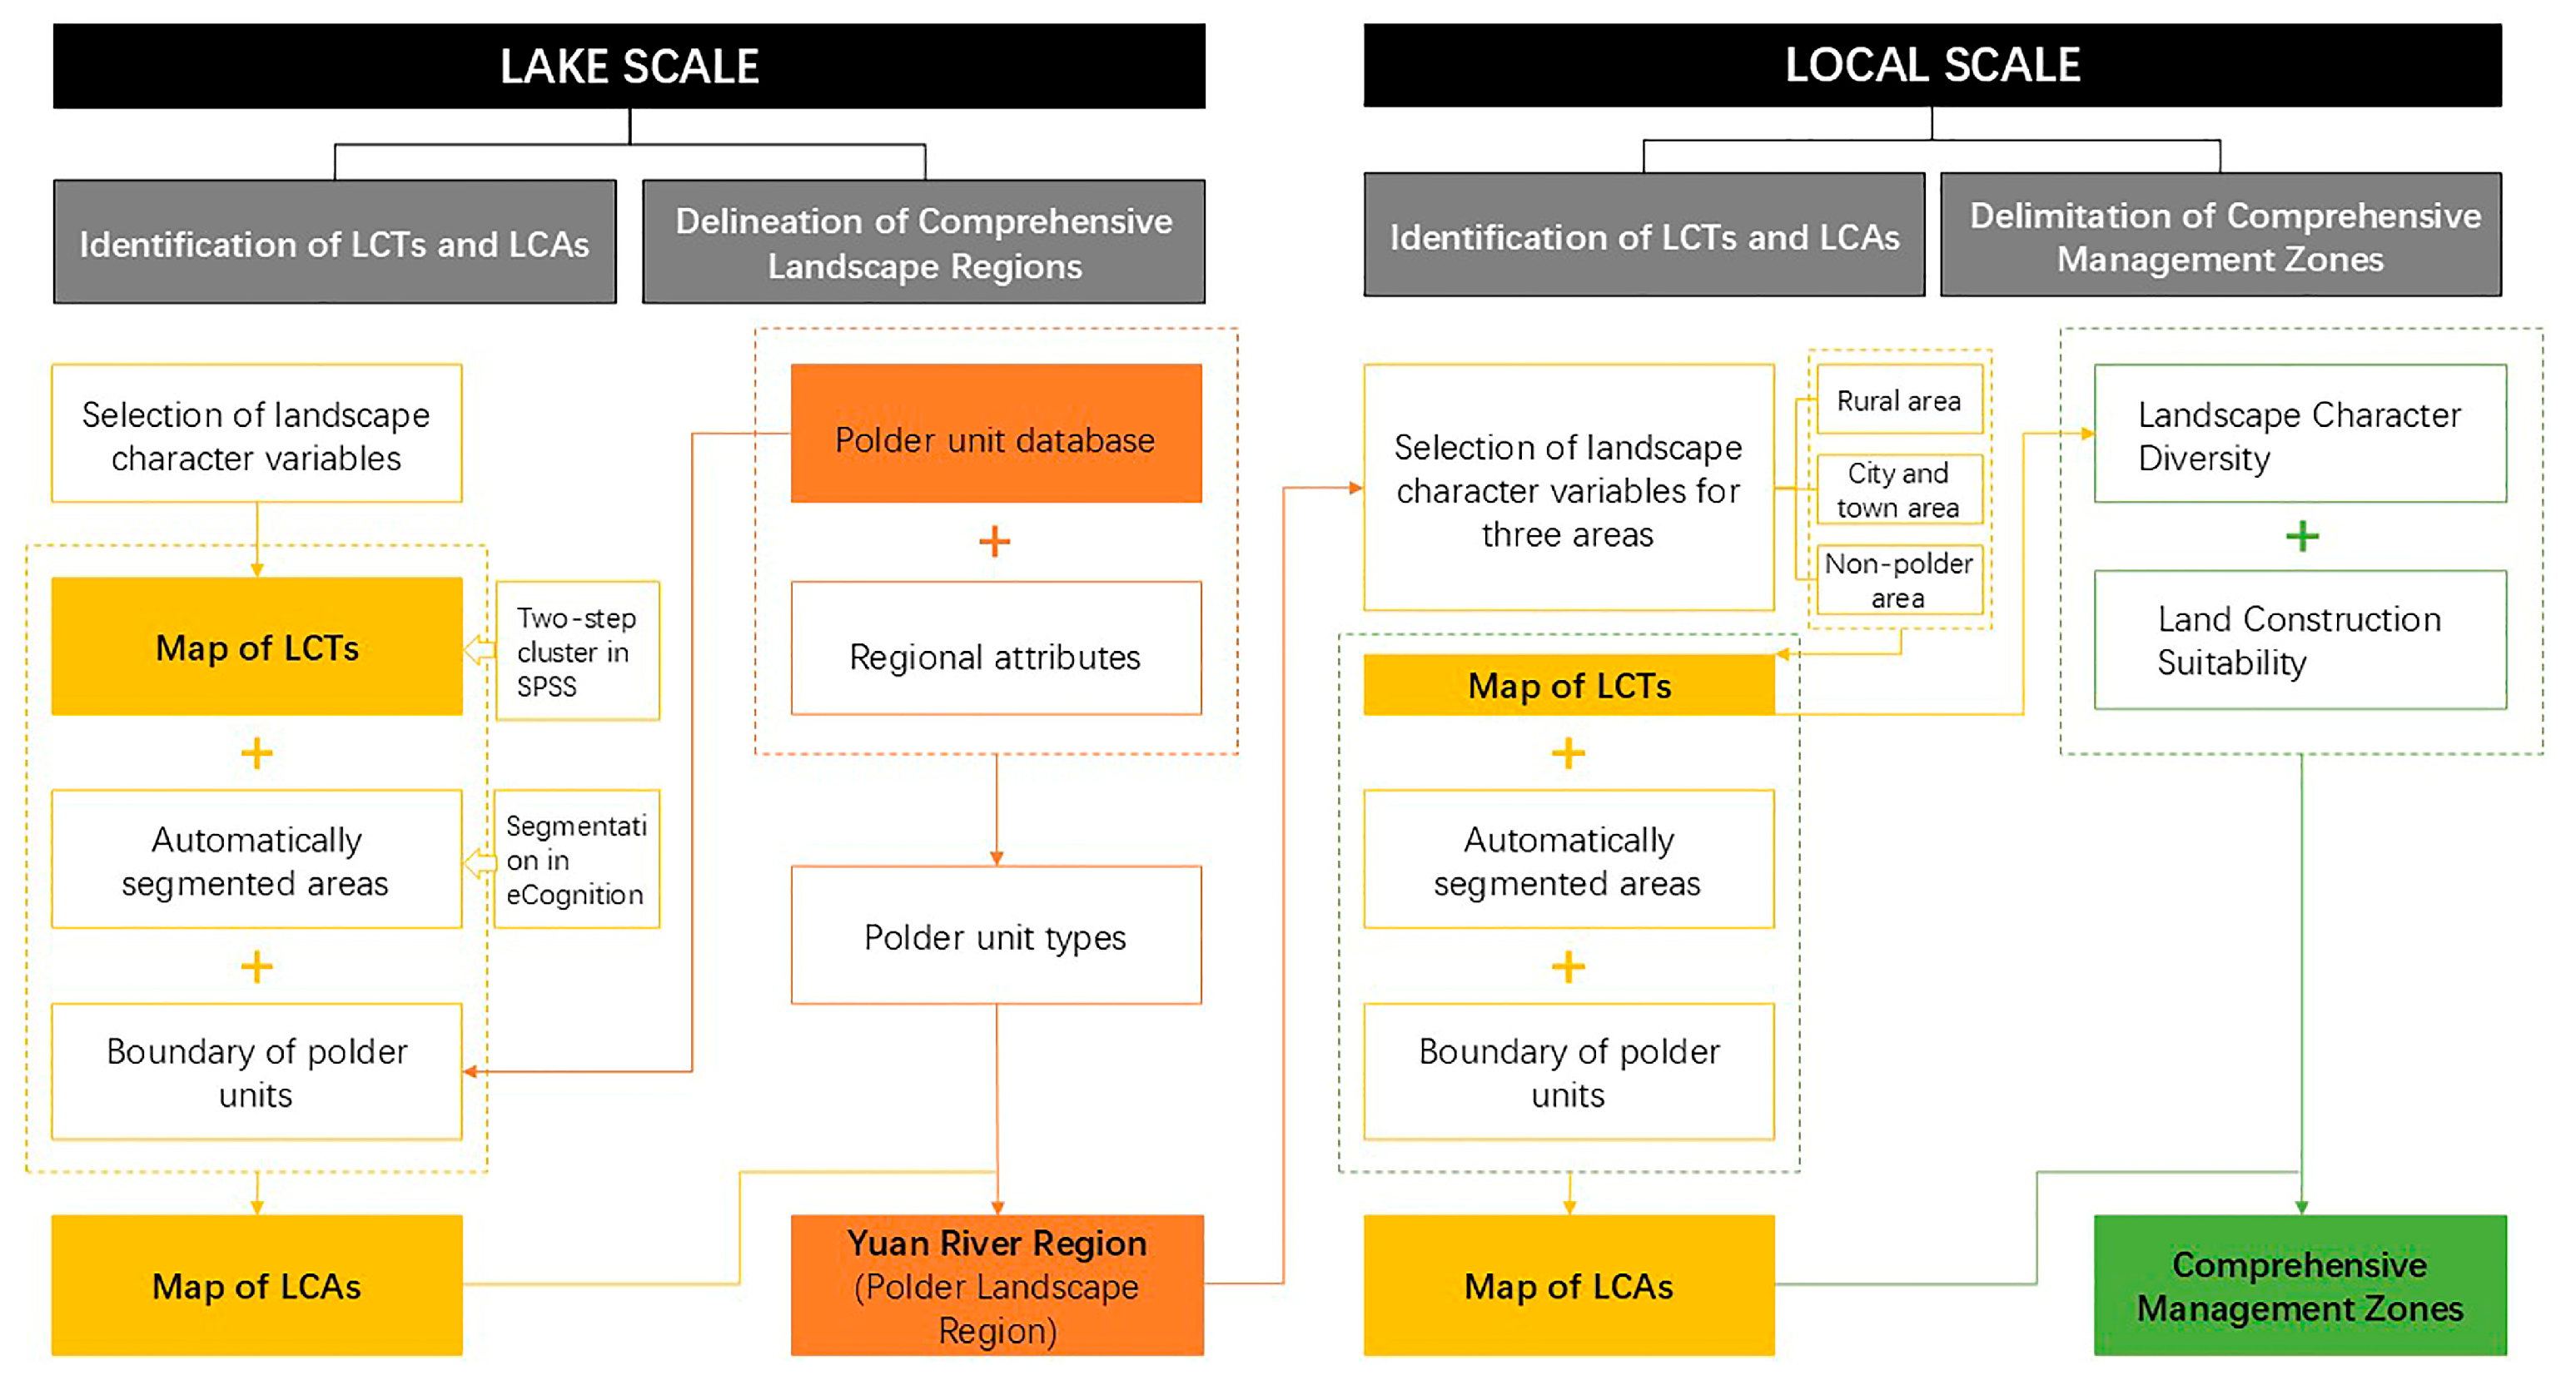
2.2. Overview of Research Methods
In this study, the LCA method combined with polder typology was employed in two distinct scales. At the Lake Scale, the LCA method was utilized to identify and delineate polder LCTs and LCAs, as well as to establish a comprehensive method for categorizing polder unit types and zoning polder landscape regions. At the Local Scale, the LCA method was integrated with analyses of LCD and LCS to delineate different management zones for polder landscapes (Figure 2).
Figure 2.
Flowchart depicting the process of identifying landscape characters and delimiting management zones for the polder landscape in the DLA.
In this study, we employed three measures to refine the selection of landscape character variables and data processing methods, aiming to increase the number of recognizable LCTs.
- 1.
- Multiscale identification [7,24]: This study was conducted at two different scales. At the Lake Scale, natural geographical variables suitable for lowlands were selected to preserve the integrity of the landscape character across different landscape boundaries. At the Local Scale, conventional classification data and methods derived from polder typology, such as land (farmland) texture obtained through visual interpretation [14], were employed to ensure the recognizability inside the polders.
- 2.
- Differentiated data [7,17]: At the Local Scale, the study scope was subdivided into distinct areas based on the distribution patterns of LCAs at the Lake Scale. The objective is to identify as many different LCTs as possible because some variables may not be suitable for classification at the entire Local Scale but remain indispensable for specific areas. For example, fraction vegetation coverage (FVC) may not significantly distinguish the agricultural areas, but it is crucial for identifying urban green spaces. Subsequently, differentiated variables were selected for each area to increase the diversity of LCTs.
- 3.
- Stratified data sources: Data sources with different classification levels, such as land use, landform, and polder unit boundary data, were utilized to ensure consistency and the hierarchy of LCTs across different scales.
2.3. Landscape Character and Landscape Region at the Lake Scale
At the Lake Scale, this study consisted of two primary components: (1) the identification of landscape character types (LCTs) and the visualization of landscape character areas (LCAs), and (2) the establishment of a polder unit database for the classification of polder unit types and the delimitation of polder landscape regions.
2.3.1. Selection and Pre-Procession of Landscape Character Variables
LCTs represent distinct landscape categories sharing a similar combination of natural or cultural factors [18]. At a large scale, LCTs are usually identified by natural variables such as landform, land cover, geology, and hydrography [9,18]. In an area with subtle relative relief, Land cover and land use are the two most commonly used variables to represent human influence on the landscape [8]. Limited by the quality and accessibility of the data source, the identification of LCTs at the Lake Scale was based on two key variables: land use and landform (Table 1).
Table 1.
Landscape character variables for LCTs at the lake scale.
Landform variables were calculated by overlaying altitude and relative relief. Referring to the classification method suitable for agricultural landform in Hunan Province [25], the landforms in the DLA were categorized into five types. The original data of land use variables included six categories at the first classification level. Considering the importance of mudflat in the polder landscape, the land use data were reclassified into seven types.
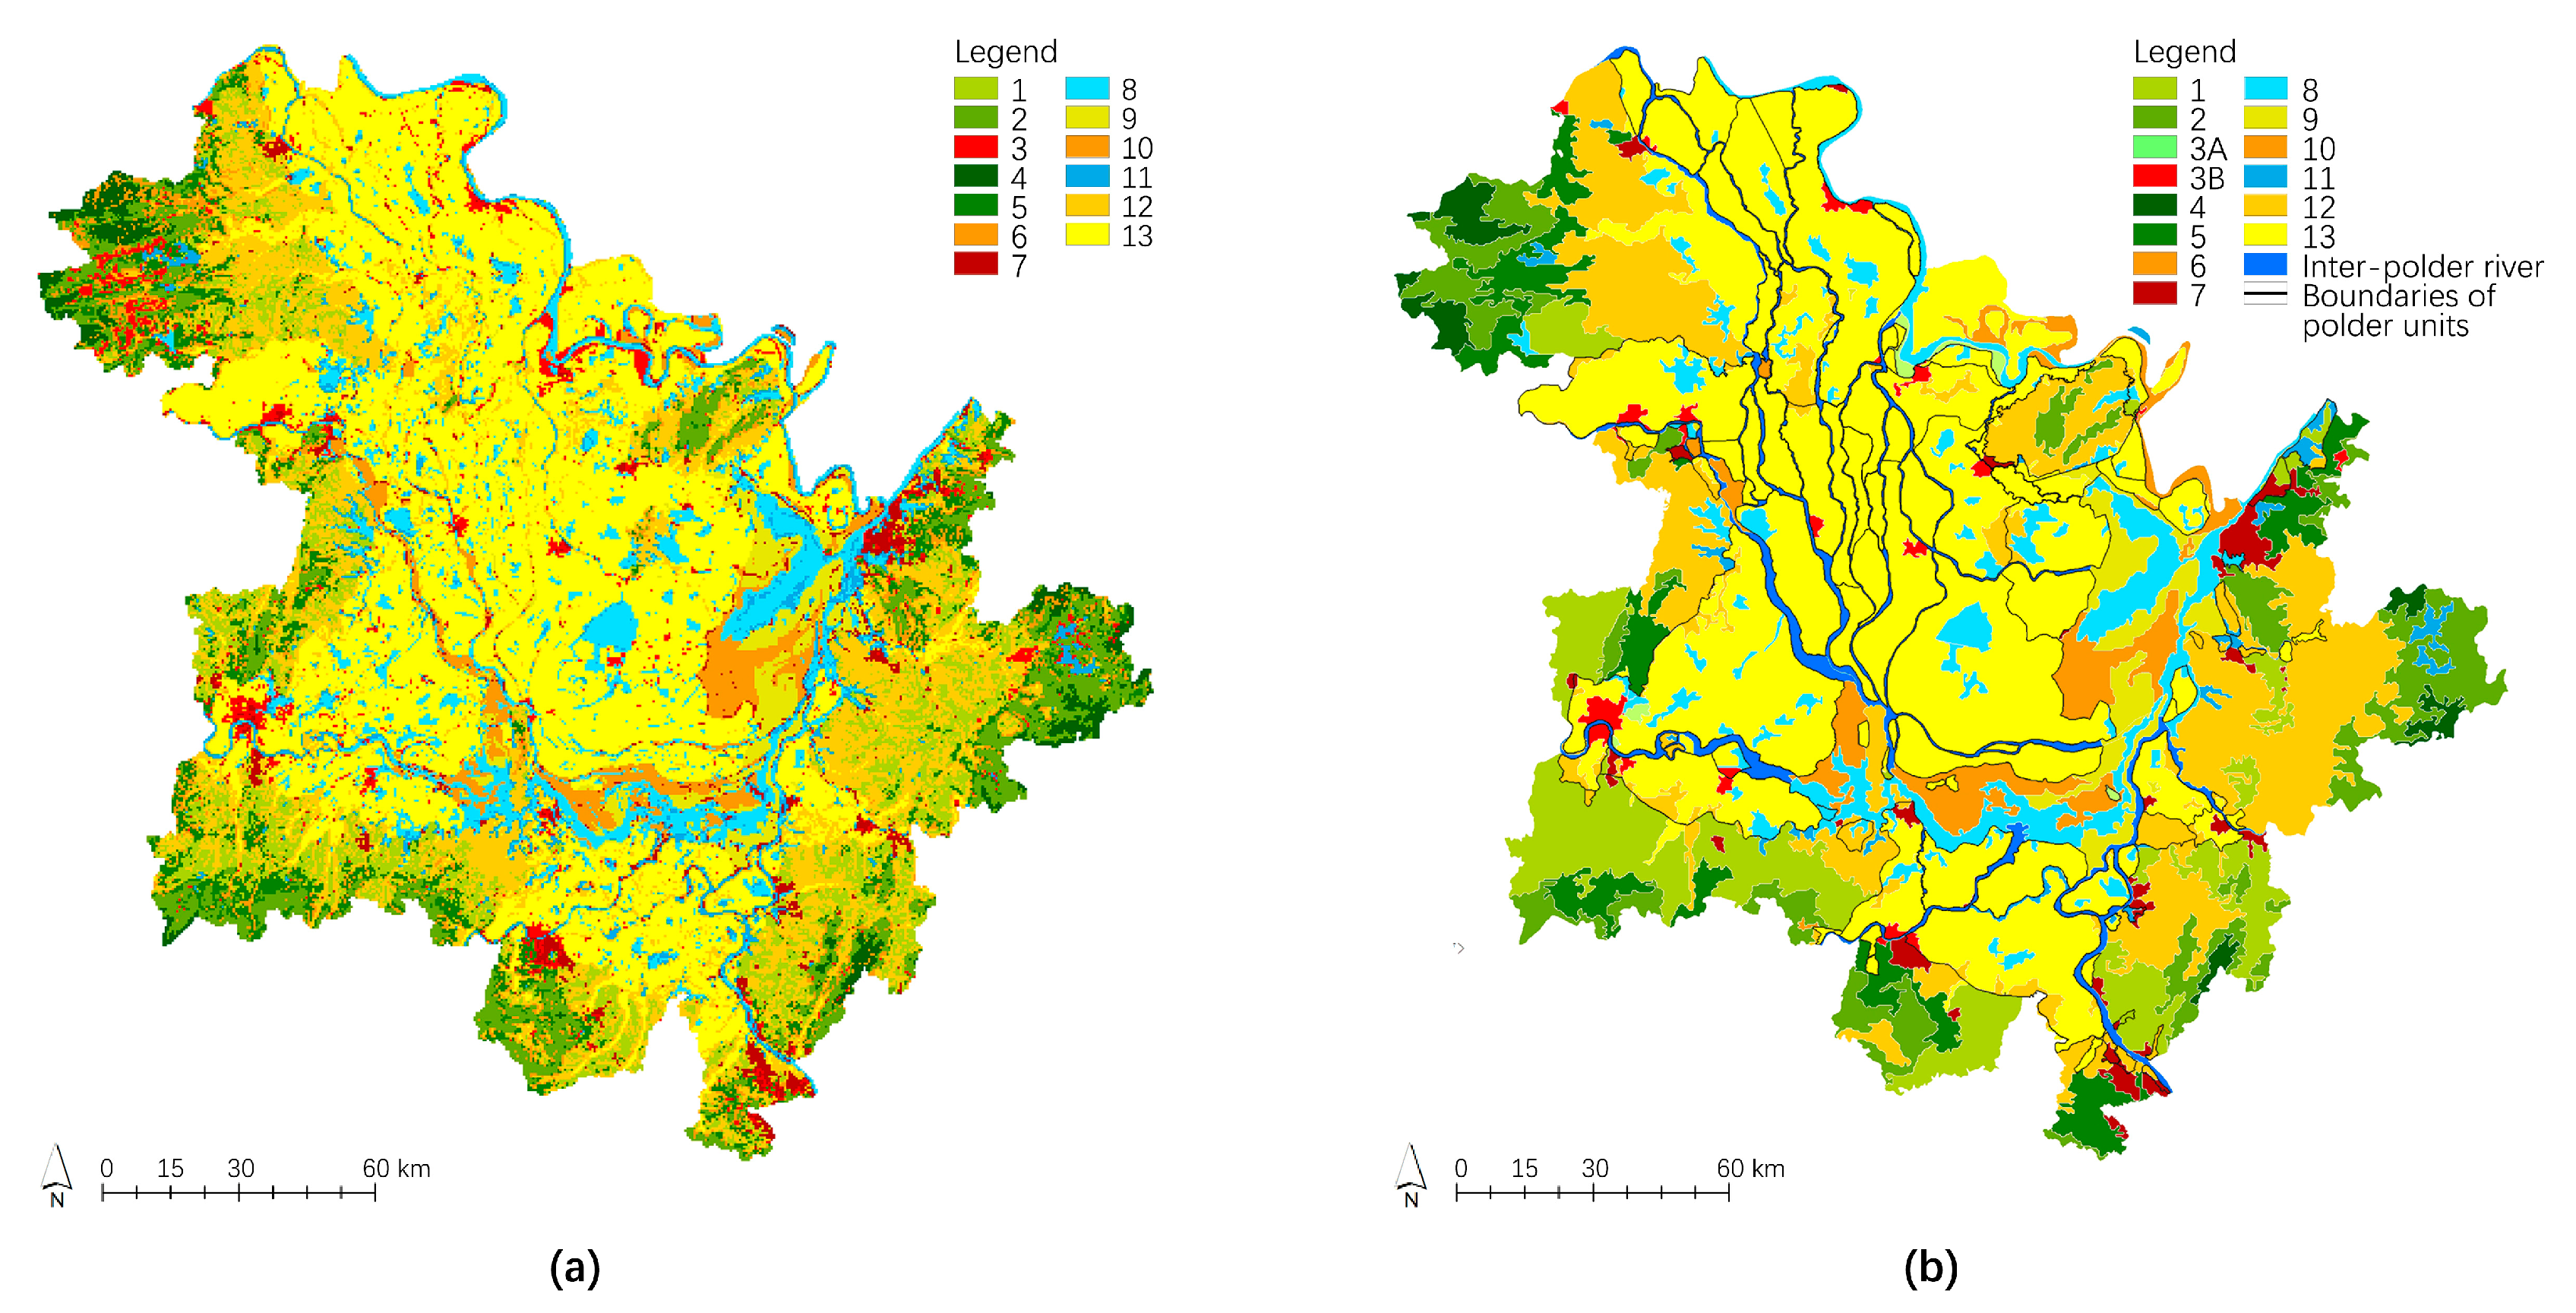
2.3.2. Identification of Landscape Character Types at the Lake Scale
These landscape character variables described above displayed a limited diversity, primarily concentrated in several selected types. Therefore, the application of the two-step cluster analysis was effective in identifying the LCTs [7]. Firstly, the study area was evenly divided into grid cells of 0.5 km × 0.5 km in ArcMap 10.8.1, which was referred to as the dimensions used in similar-scale studies, such as 1 km × 1 km in Qinghai Lake Basin and 0.5 km × 0.5 km in Poyang Lake Eco-economic zone [7,26]. Subsequently, all variables were assigned into each grid cell, and a matrix was established to associate these variables with grid cells. In this matrix, the variables were denoted as either 1 (existent) or 0 (non-existent) in each grid cell. Finally, the matrix underwent the two-step cluster analysis in SPSS 27.0 to identify the LCTs of each grid cell. The code name for each LCT was determined according to the occupation of variables within each LCT, expressed as X (30–60%), [X] (10–30%), or (X) (10–30%). Variables less than 10% were not considered [7].
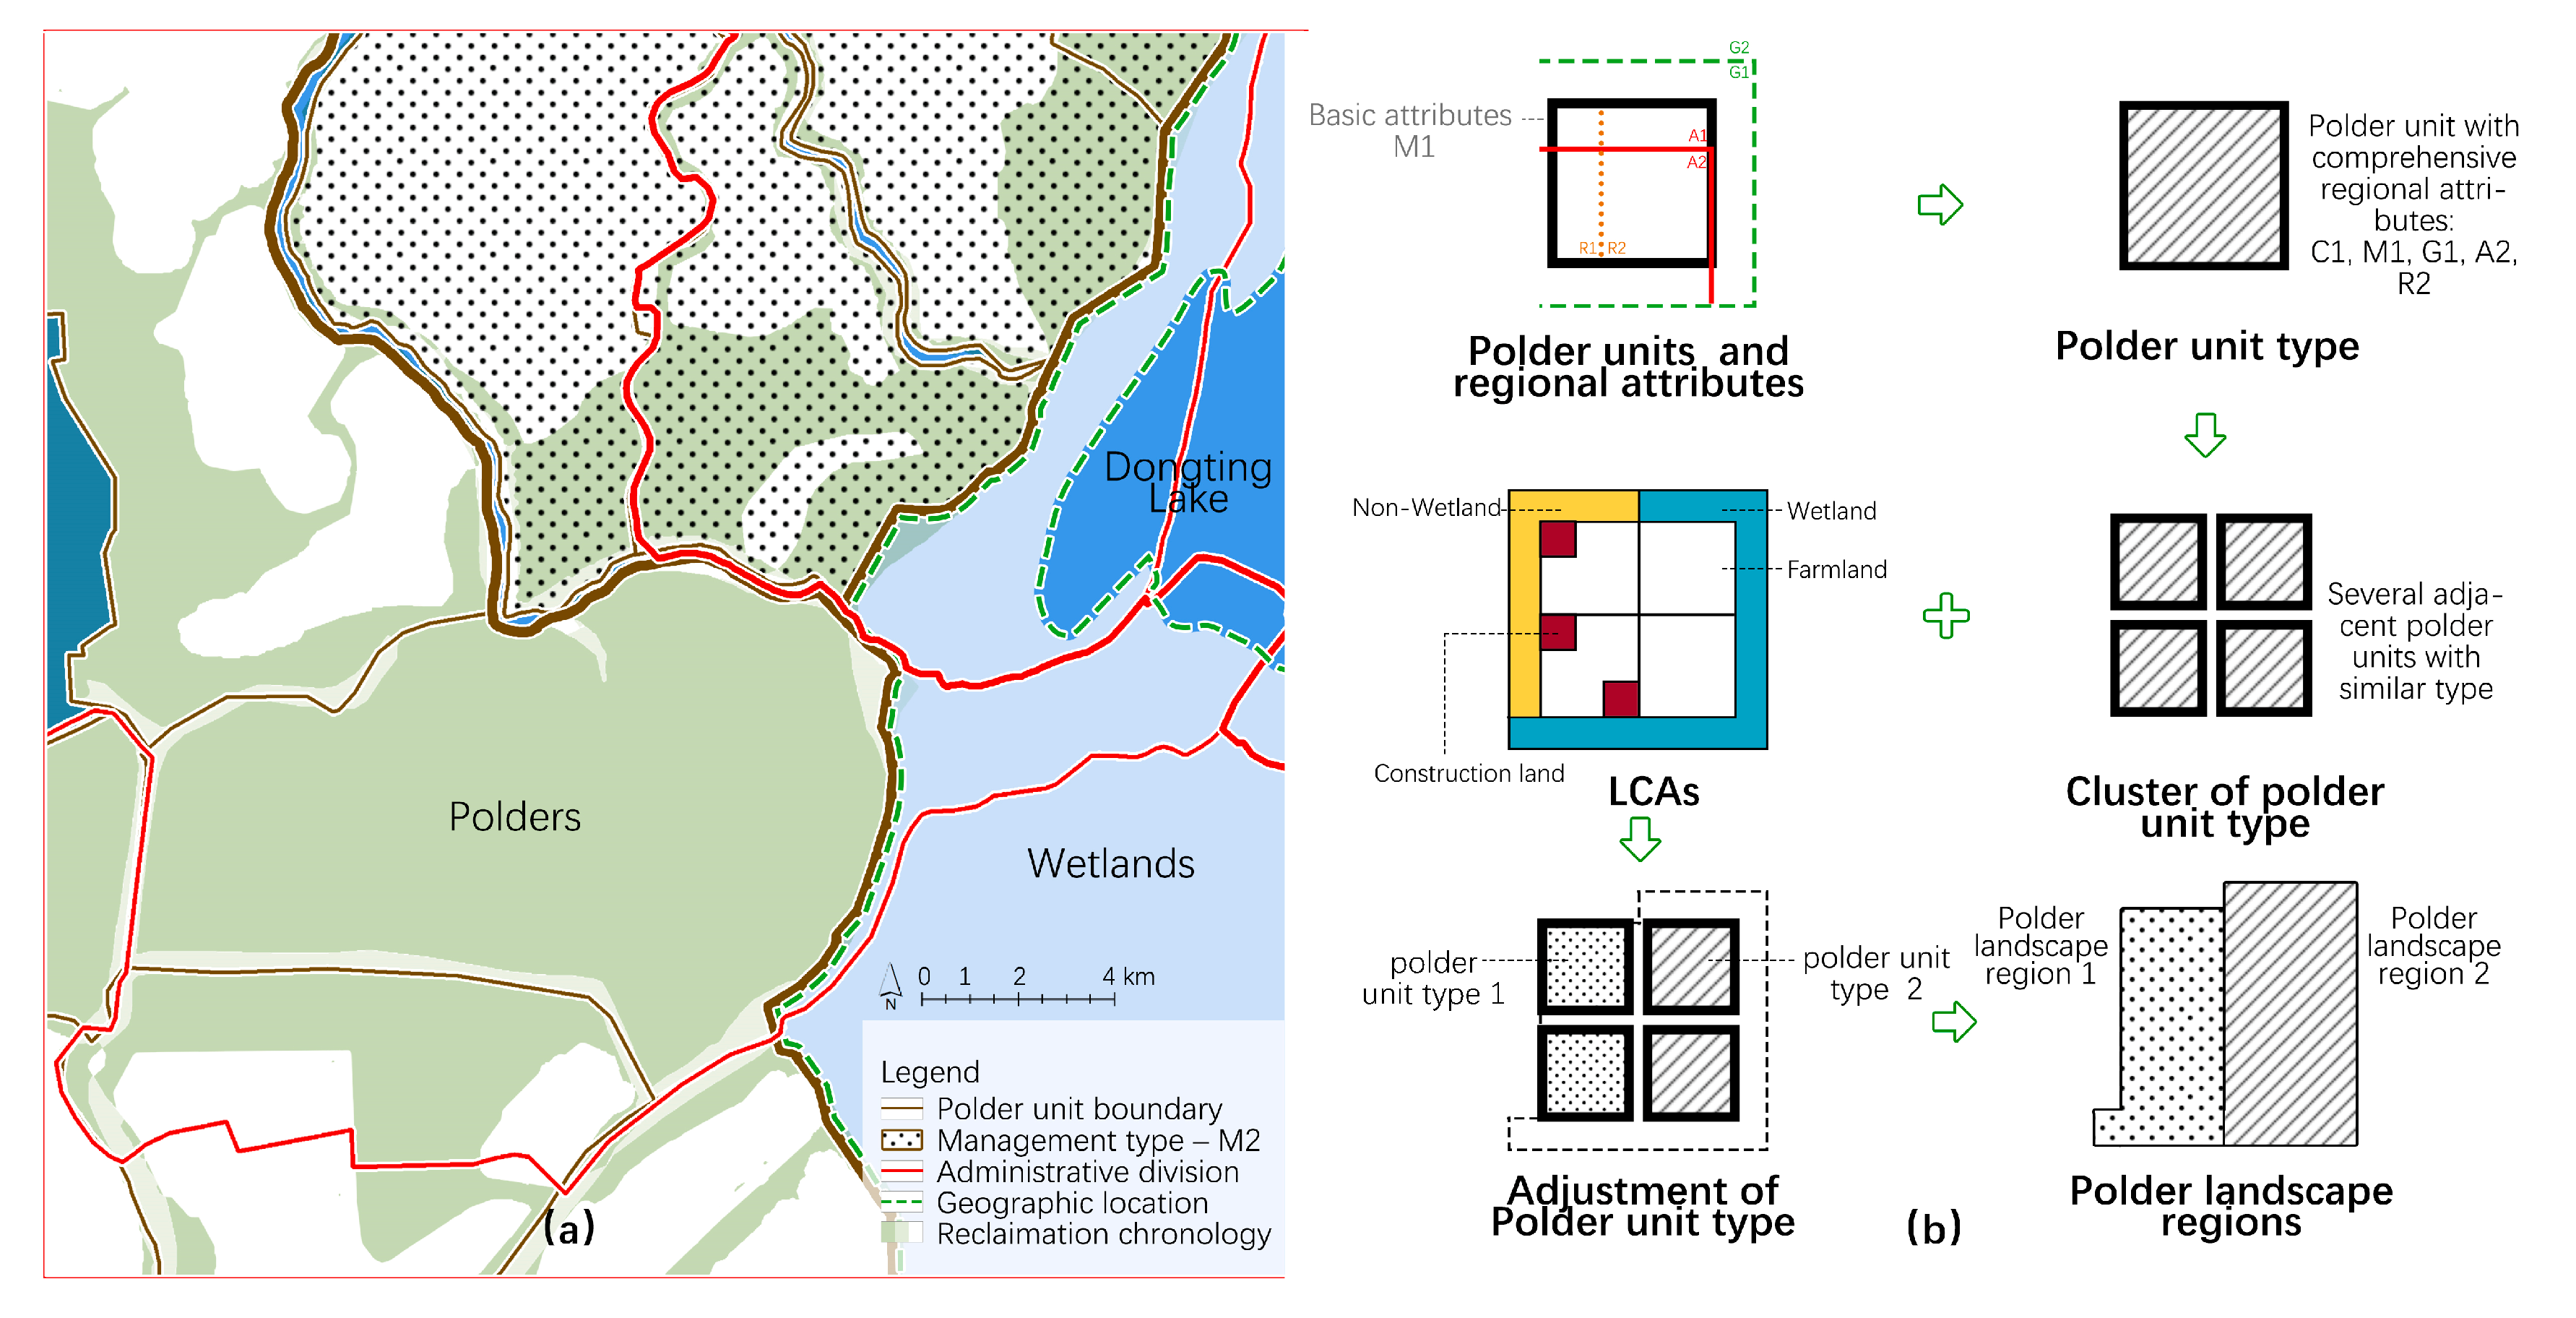
2.3.3. Establishment the Polder Unit Database
The digitization of polder units is a prerequisite for the classification and visualization of polder landscapes [1]. The polder unit database was established based on satellite images and existing studies [2,11,27], with reference to various atlases and spatial database associated with the DLA [13,28,29,30]. After that, a total of 100 polder units were selected for detailed analysis, each covering an area larger than 5 km2 and being entirely located in the south of the Yangtze River. These polder units processed two basic attributes: management types and classification levels. According to the management types, these polder units were composed of 11 key polders, 27 flood storage polders, and 62 normal polders (including several abandoned polders) [13,27]. Given that the majority of key polders, as well as some large polders, can be further divided into multiple smaller polder units [27], in this study, we categorized these situations into two classification levels. The polder units of the primary classification level were utilized at the Lake Scale to avoid excessive segmentation in the delineation of LCAs, while the polder units of the secondary classification level were used at the Local Scale.
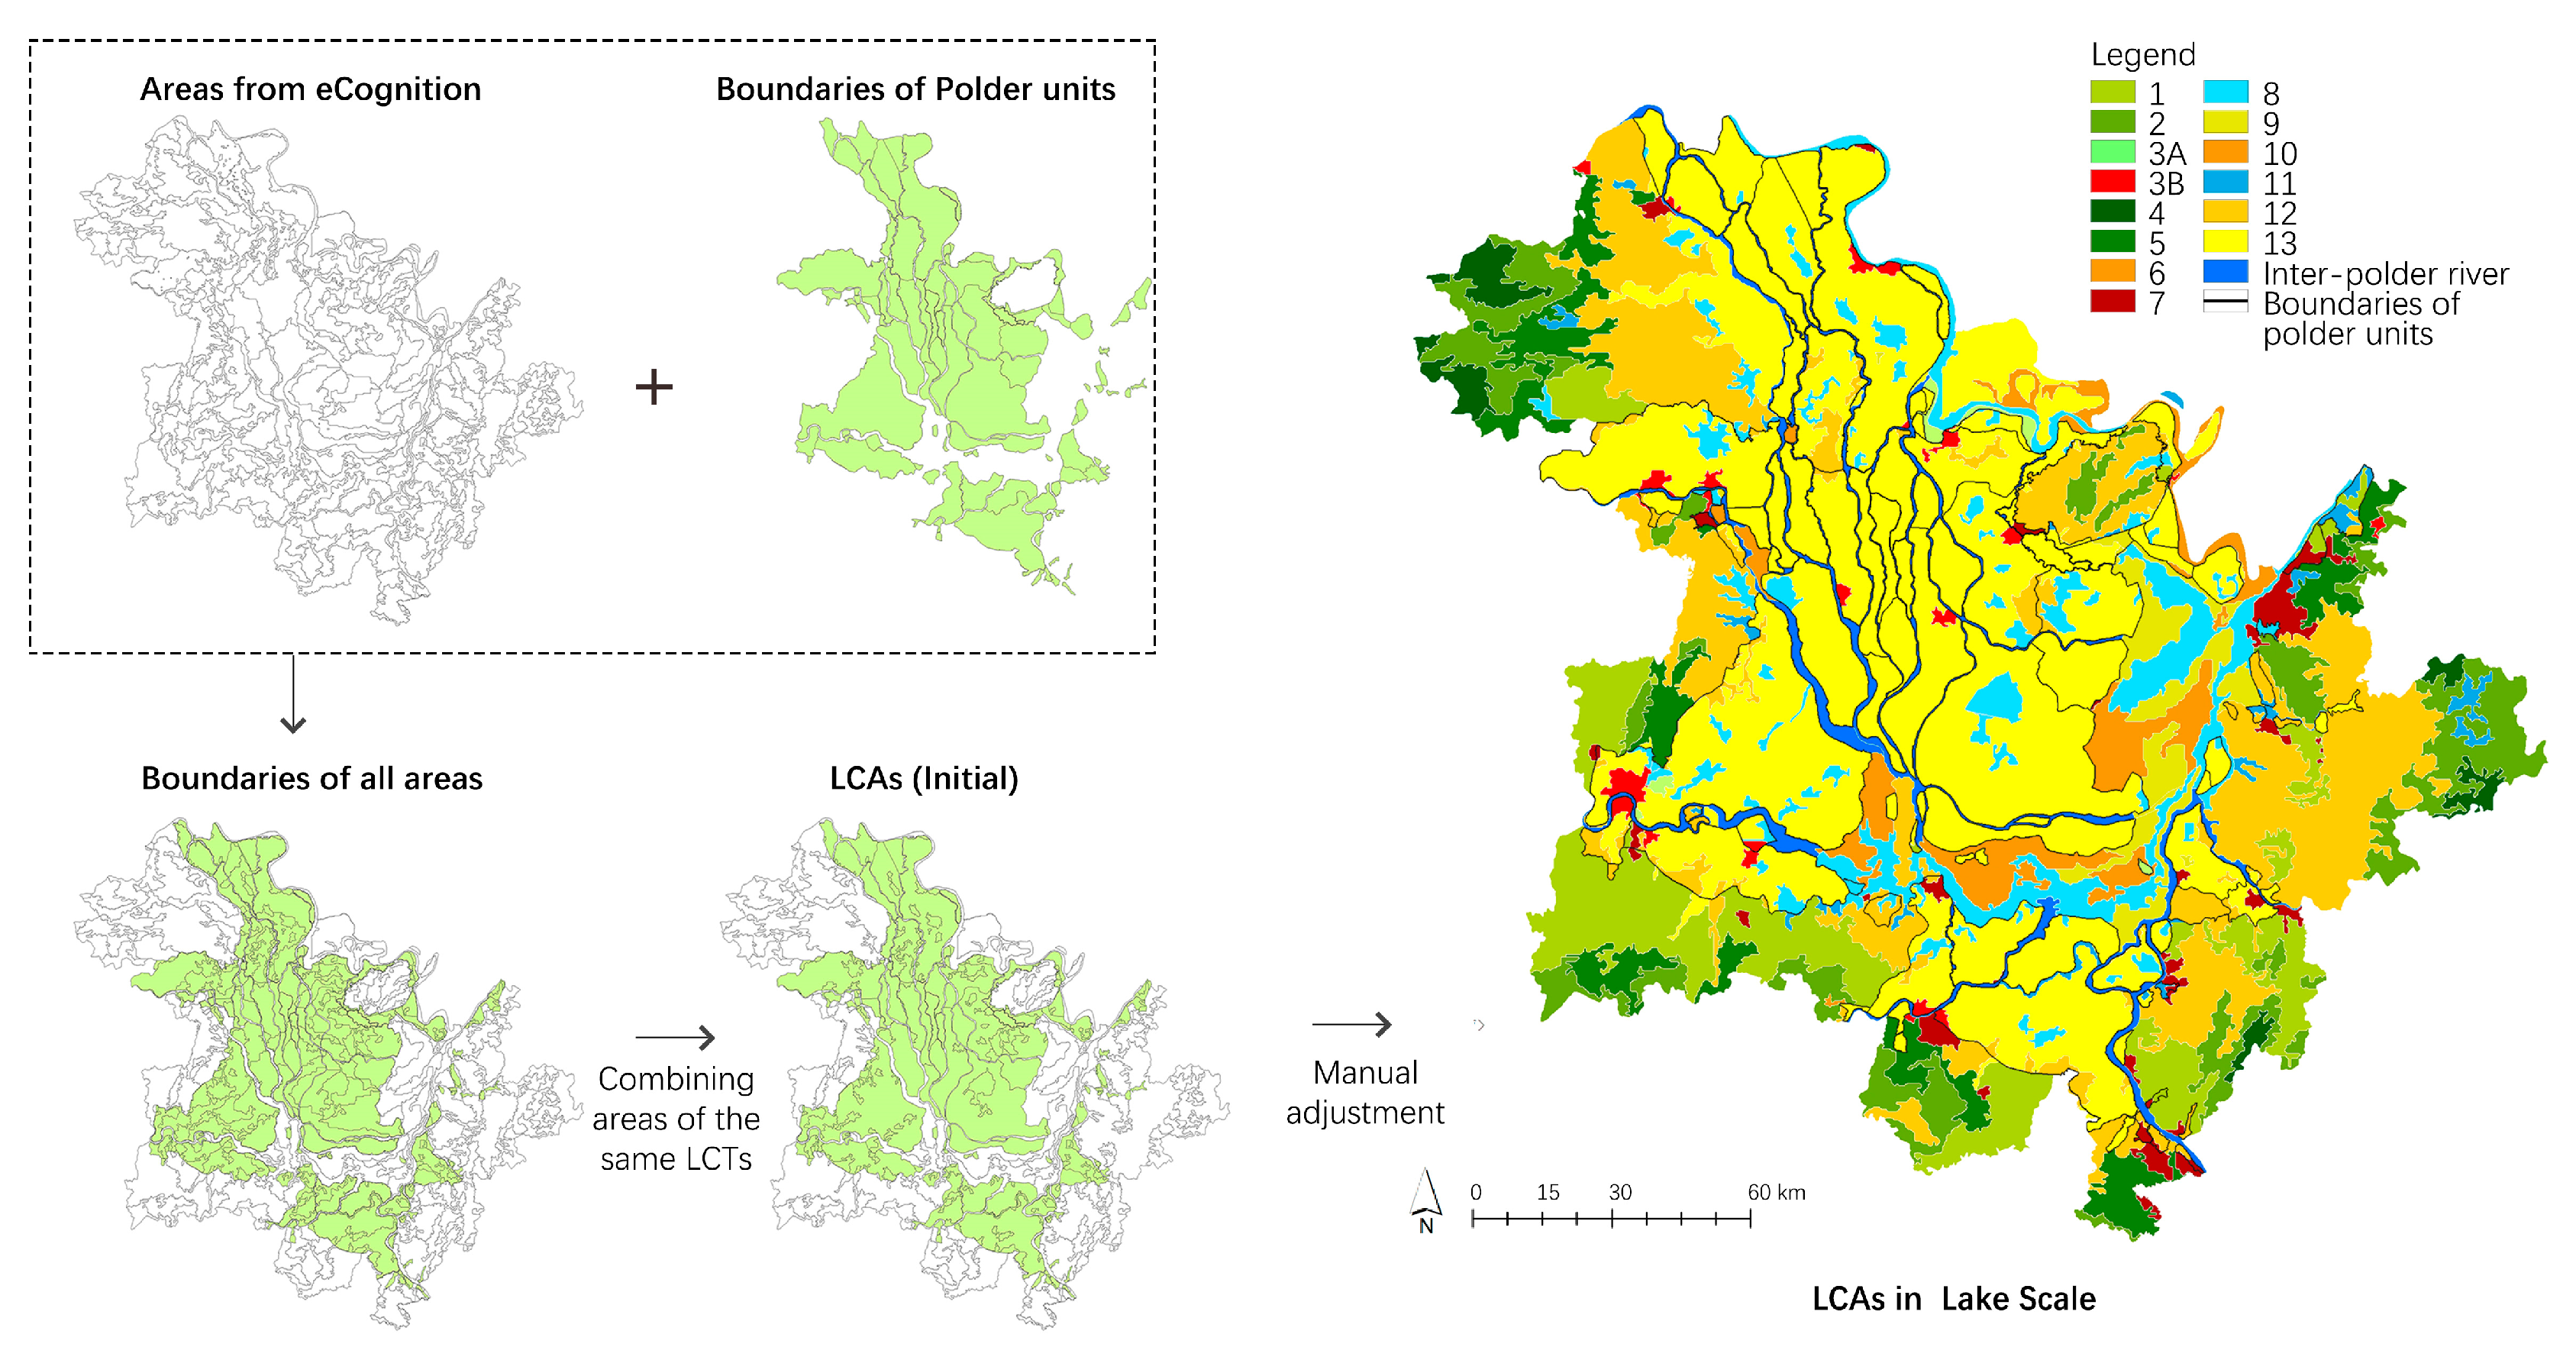
2.3.4. Delineation of Landscape Character Areas at the Lake Scale
The semi-automatic image segmentation process, which combines object-oriented image automatic segmentation in eCognition 9.0 with manual adjustment, has been a well-established method for delineating LCAs in previous studies [7,9]. However, for polder landscapes, additional processes are required to integrate the polder unit boundary data with the results of automatic segmentation. Firstly, the layers of land use and landform were converted into a three-band RGB color composite in ENVI 5.6. Subsequently, the automatic segmentation process was conducted through the Multi-resolution Segmentation tool in eCognition 9.0. Three crucial parameters (scale, shape, and compactness) were adjusted individually by a factor of ten, to find appropriate segmentation areas that align with the satellite images [7]. After that step, the results generated by eCognition 9.0 needed to be refined in ArcMap 10.8.1, including smoothing right-angle boundaries and consolidating areas with similar dominant LCTs. The polder unit boundaries were then overlaid on the refined boundaries. Areas smaller than 2 km2 were merged into the surrounding areas. Finally, the LCAs were delineated after careful manual adjustments based on satellite images and field surveys.
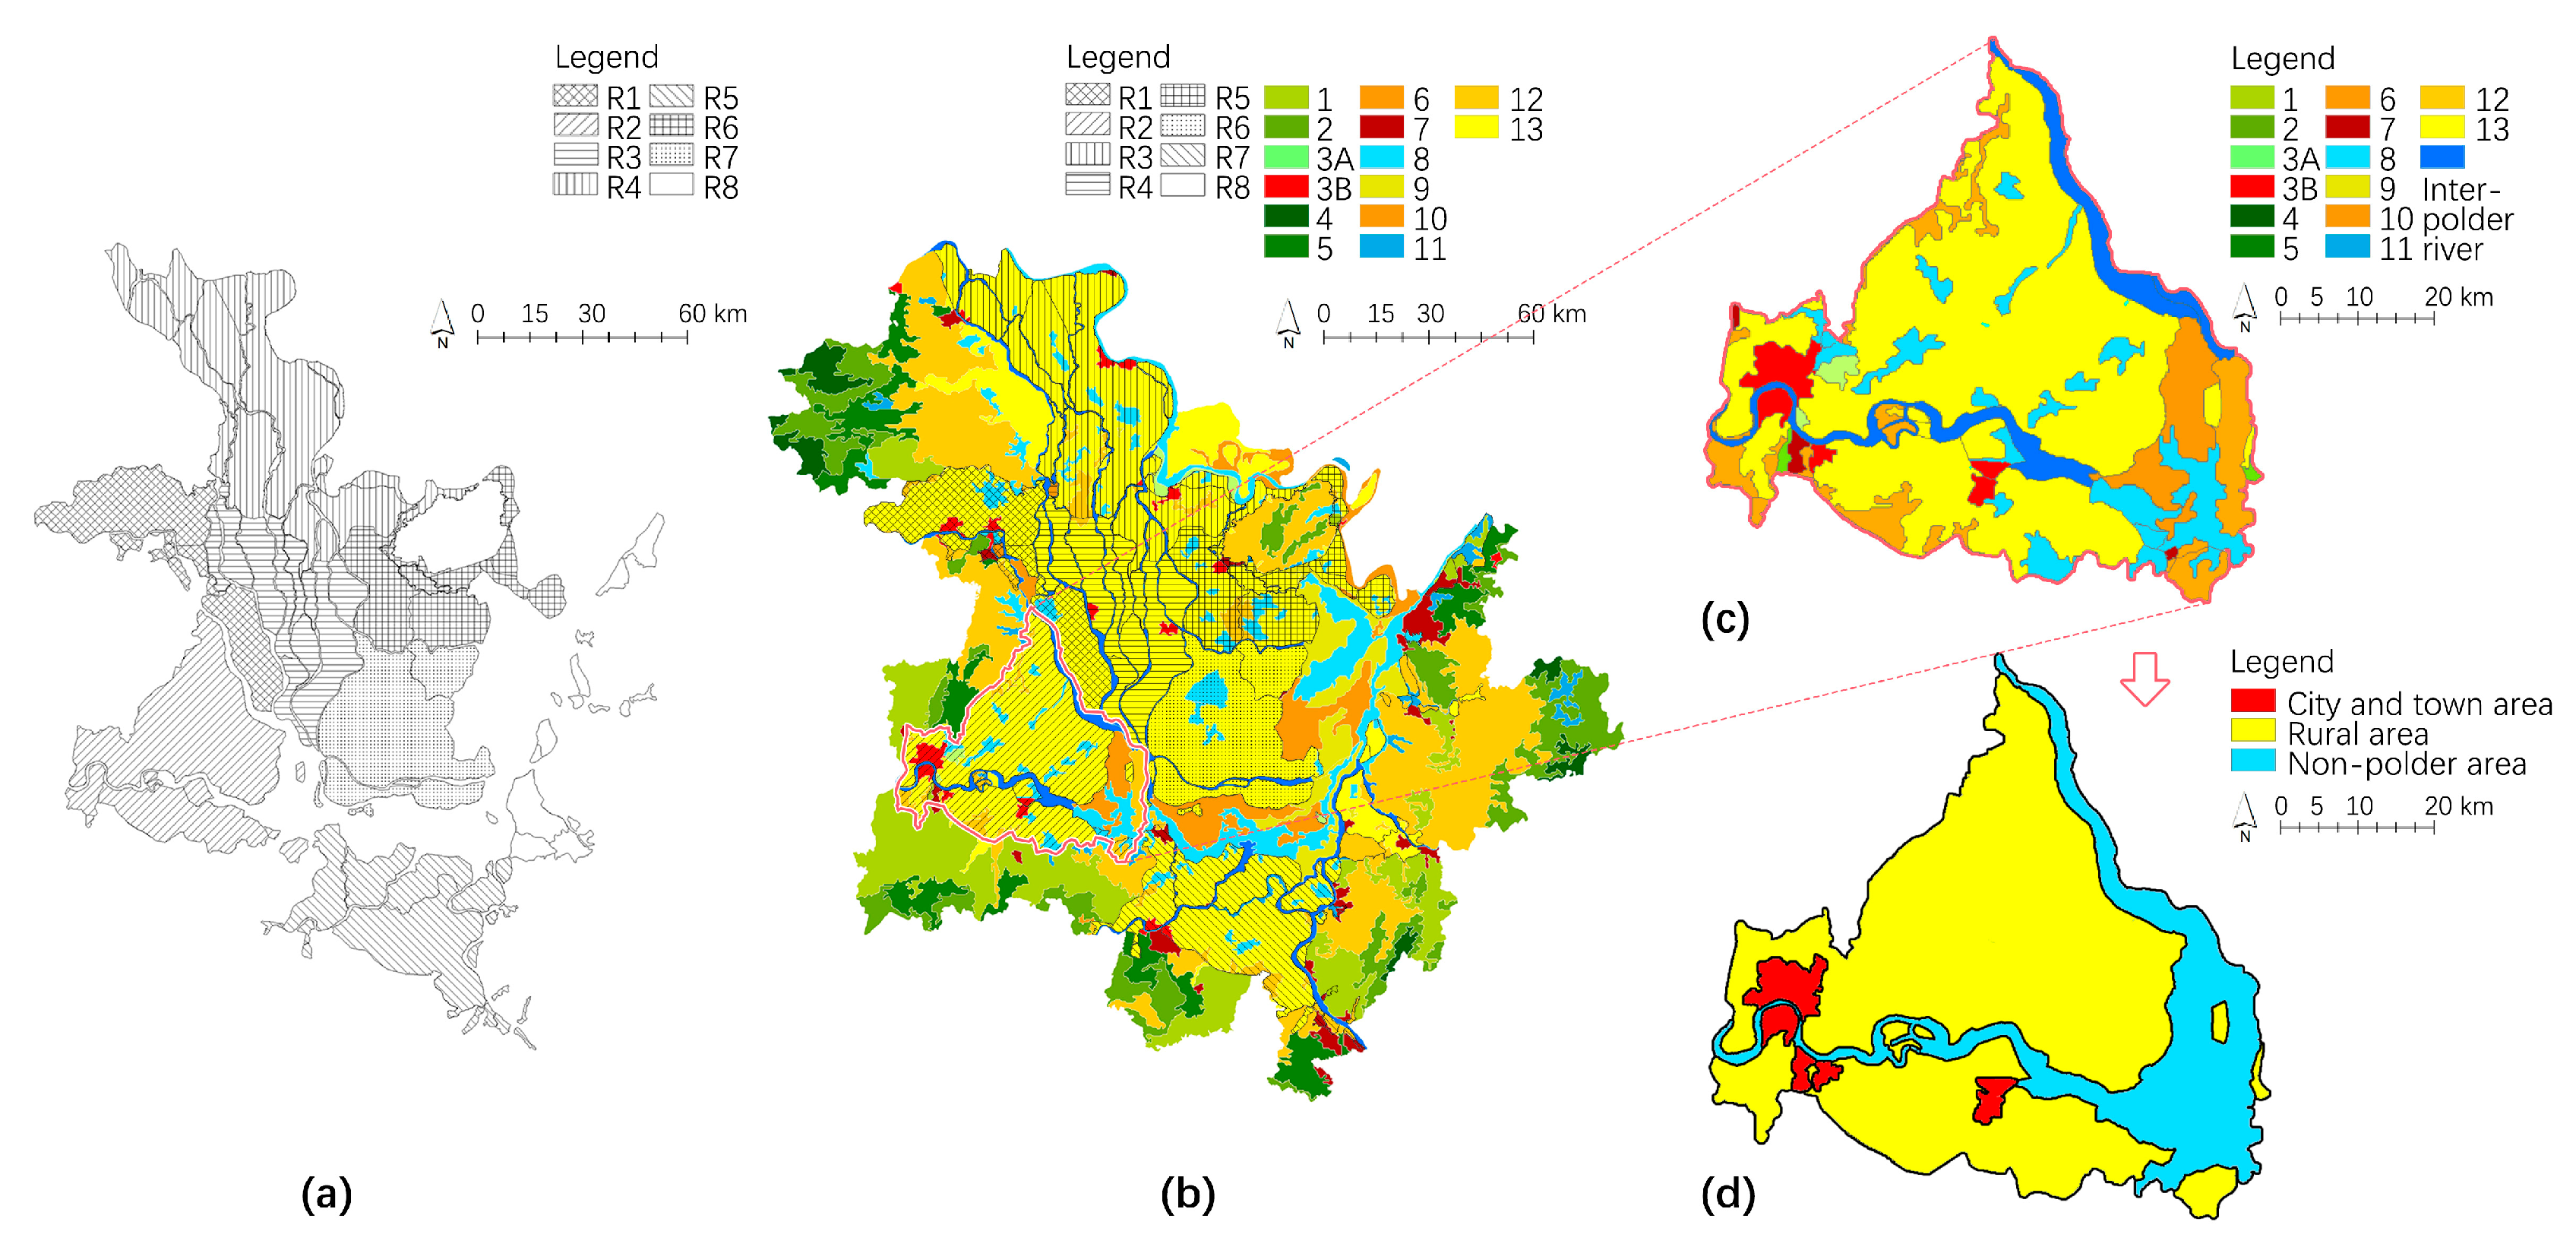
2.3.5. Classification of Polder Unit Types and Delineation of Polder Landscape Regions
Firstly, in order to simplify the influence of intricate landscape boundaries (Figure 3a), the polder units were selected as carriers, with other landscape boundaries serving as type attributes assigned to each polder unit. These type attributes, along with the polder units’ basic attributes, formed the regional attributes of each polder unit (Table 2). Then, these polder units were initially classified into distinct polder unit types based on different combinations of regional attributes. Subsequently, the extents of polder unit clusters with the same polder unit types were adjusted according to the distribution patterns of LCAs, in order to ensure that the distribution patterns between each cluster were as different as possible. Finally, the precise boundaries of the polder landscape regions were defined by combining the corresponding polder unit types with their adjacent LCAs related to wetland environments (Figure 3b). The polder landscape regions associated with the Yuan River were selected as the study scope for the Local Scale.
Figure 3.
Complex landscape boundaries and the delineation process for polder landscape regions: (a) Polder units possess diverse basic attributes, and they were influenced by multiple landscape boundaries. (b) The overall process of delineating the polder landscape regions.
Table 2.
Regional attributes of polder units.
2.4. Landscape Character and Management Zones at the Local Scale
The study conducted at the Local Scale comprised two main components: (1) the identification of LCTs and LCAs in three distinct areas, and (2) the delimitation of the landscape management zones and the proposal of corresponding strategies.
2.4.1. Selection and Pre-Procession of Landscape Character Variables for Different Areas
In each area, different landscape character variables were applied for further classification to increase the diversity of identifiable LCTs at the local scale. This step takes into consideration the fact that some variables may not be suitable for classification at the entire Local Scale but remain indispensable for specific areas. For instance, in City and Town areas, building density is a critical variable for delineating construction land, and the fraction vegetation coverage (FVC) is important for identifying ecological spaces such as water bodies and green areas. In contrast, both building density and FVC have limited utility in distinguishing the vast Rural Area. Based on the four primary landscape systems of polder landscape (nature, water resource, agriculture, and settlement) and the distribution pattern of LCAs at the Lake Scale, it was appropriate to divide the Local Scale into three distinct areas: (1) City and Town Area, (2) Rural Area, and (3) Non-polder Area. All variables are indicated in Table 3.
Table 3.
Landscape character variables for LCTs at the local scale.
- 1.
- City and Town Area
The City and Town Area mainly comprised Changde City and Hanshou County Town, both of which served as the administrative centers of this region and had a rich history spanning thousands of years. In this area, the primary landscape character variables included land use, building density, and FVC.
The land use data used in this scale originated from the same data source as the previous scale but differed in classification level, to ensure both the continuity and hierarchy of the landscape characters across two scales. In this region, there were a total of 11 land use types at the secondary classification level. Building density, a crucial indicator reflecting the degree of urban land use intensification, was defined as the percentage of the building contour area in certain occupied land areas. Based on the block sizes in this region, the grid cells of 100 m × 100 m were used as the basic units for density calculation. The building density data were then classified into three levels: high (≥30%), medium (10–30%), and low (<10%). FVC represented the percentage of vertical projection area of vegetation on the ground in a certain area, reflecting the spatial distribution and ecological conditions of green and water spaces in the City and Town Area. The NDVI data were transformed to FVC data in ENVI 5.6, and the FVC data were also sorted into three levels (high, medium, low) by the natural break method in ArcMap 10.8.1.
- 2.
- Rural Area
The Rural Area included vast farmland and various water bodies inside the polders, as well as a few small polders and abandoned polders scattered in rivers and lakes outside the polders. In this area, the key landscape character variables were farmland texture, land use and landform.
For Rural Areas, land texture represents the integrated form of settlements, farmland, and water systems. It served as a crucial variable for delineating LCAs in cultivated areas, and it was one of the most common classification methods in polder typology. It could be determined at this Local Scale by manual visual interpretation based on satellite images [10]. Referring to the categories in other polders studies [1,14], the farmland texture in this region was eventually categorized into six types. Landform had a significant impact on production conditions, cropland patterns, and agricultural vegetation types by influencing the distribution of surface water and heat [31]. At this scale, landform types were further subdivided into six types based on the previous scale.
- 3.
- Non-polder Area
The Non-polder Area represented the natural environment outside the polders, including Li River, Yuan River, Chi Mountain, West Dongting Lake, and their adjacent wetlands. In this area, the primary landscape character variables were land use and landform.
2.4.2. Identification of Landscape Character Types at the Local Scale
The process for identifying LCTs at this scale followed a similar step to that at the previous scale, except for three significant differences: (1) Given that the Yuan River Region was divided into three distinct areas with differentiated variables, the clustering process was performed separately in each area. (2) The grid cell size was adjusted, with 100 m × 100 m in the City and Town Area, and 200 m × 200 m in the other two areas. (3) The final LCT map was generated by combining the clustering results of these three areas into a single raster map.
2.4.3. Selection and Pre-Procession of Polder Unit Boundary Data
At this scale, the polder unit data at the secondary classification level subdivided the 11 polder units from the Lake Scale into a total of 44 polder units. Additionally, all interconnected lakes, rivers, and ditches between the polder units were combined into a single entity referred to as ‘Inter-polder Waterways’ to avoid potential excessive segmentation in the delineation of LCAs.
2.4.4. Delineation of Landscape Character Areas at the Local Scale
The process for delineating LCAs at this scale was similar to the previous scale, with three notable differences: (1) Automated segmentation in eCognition 9.0 and manual adjustments in ArcMap 10.8.1 were performed independently in each area. (2) The size of the eliminated area varied across different areas, with 0.5 km2 in the City and Town Area and 1 km2 in the other two areas. (3) The final LCA map required combining the results from three areas into a single map.
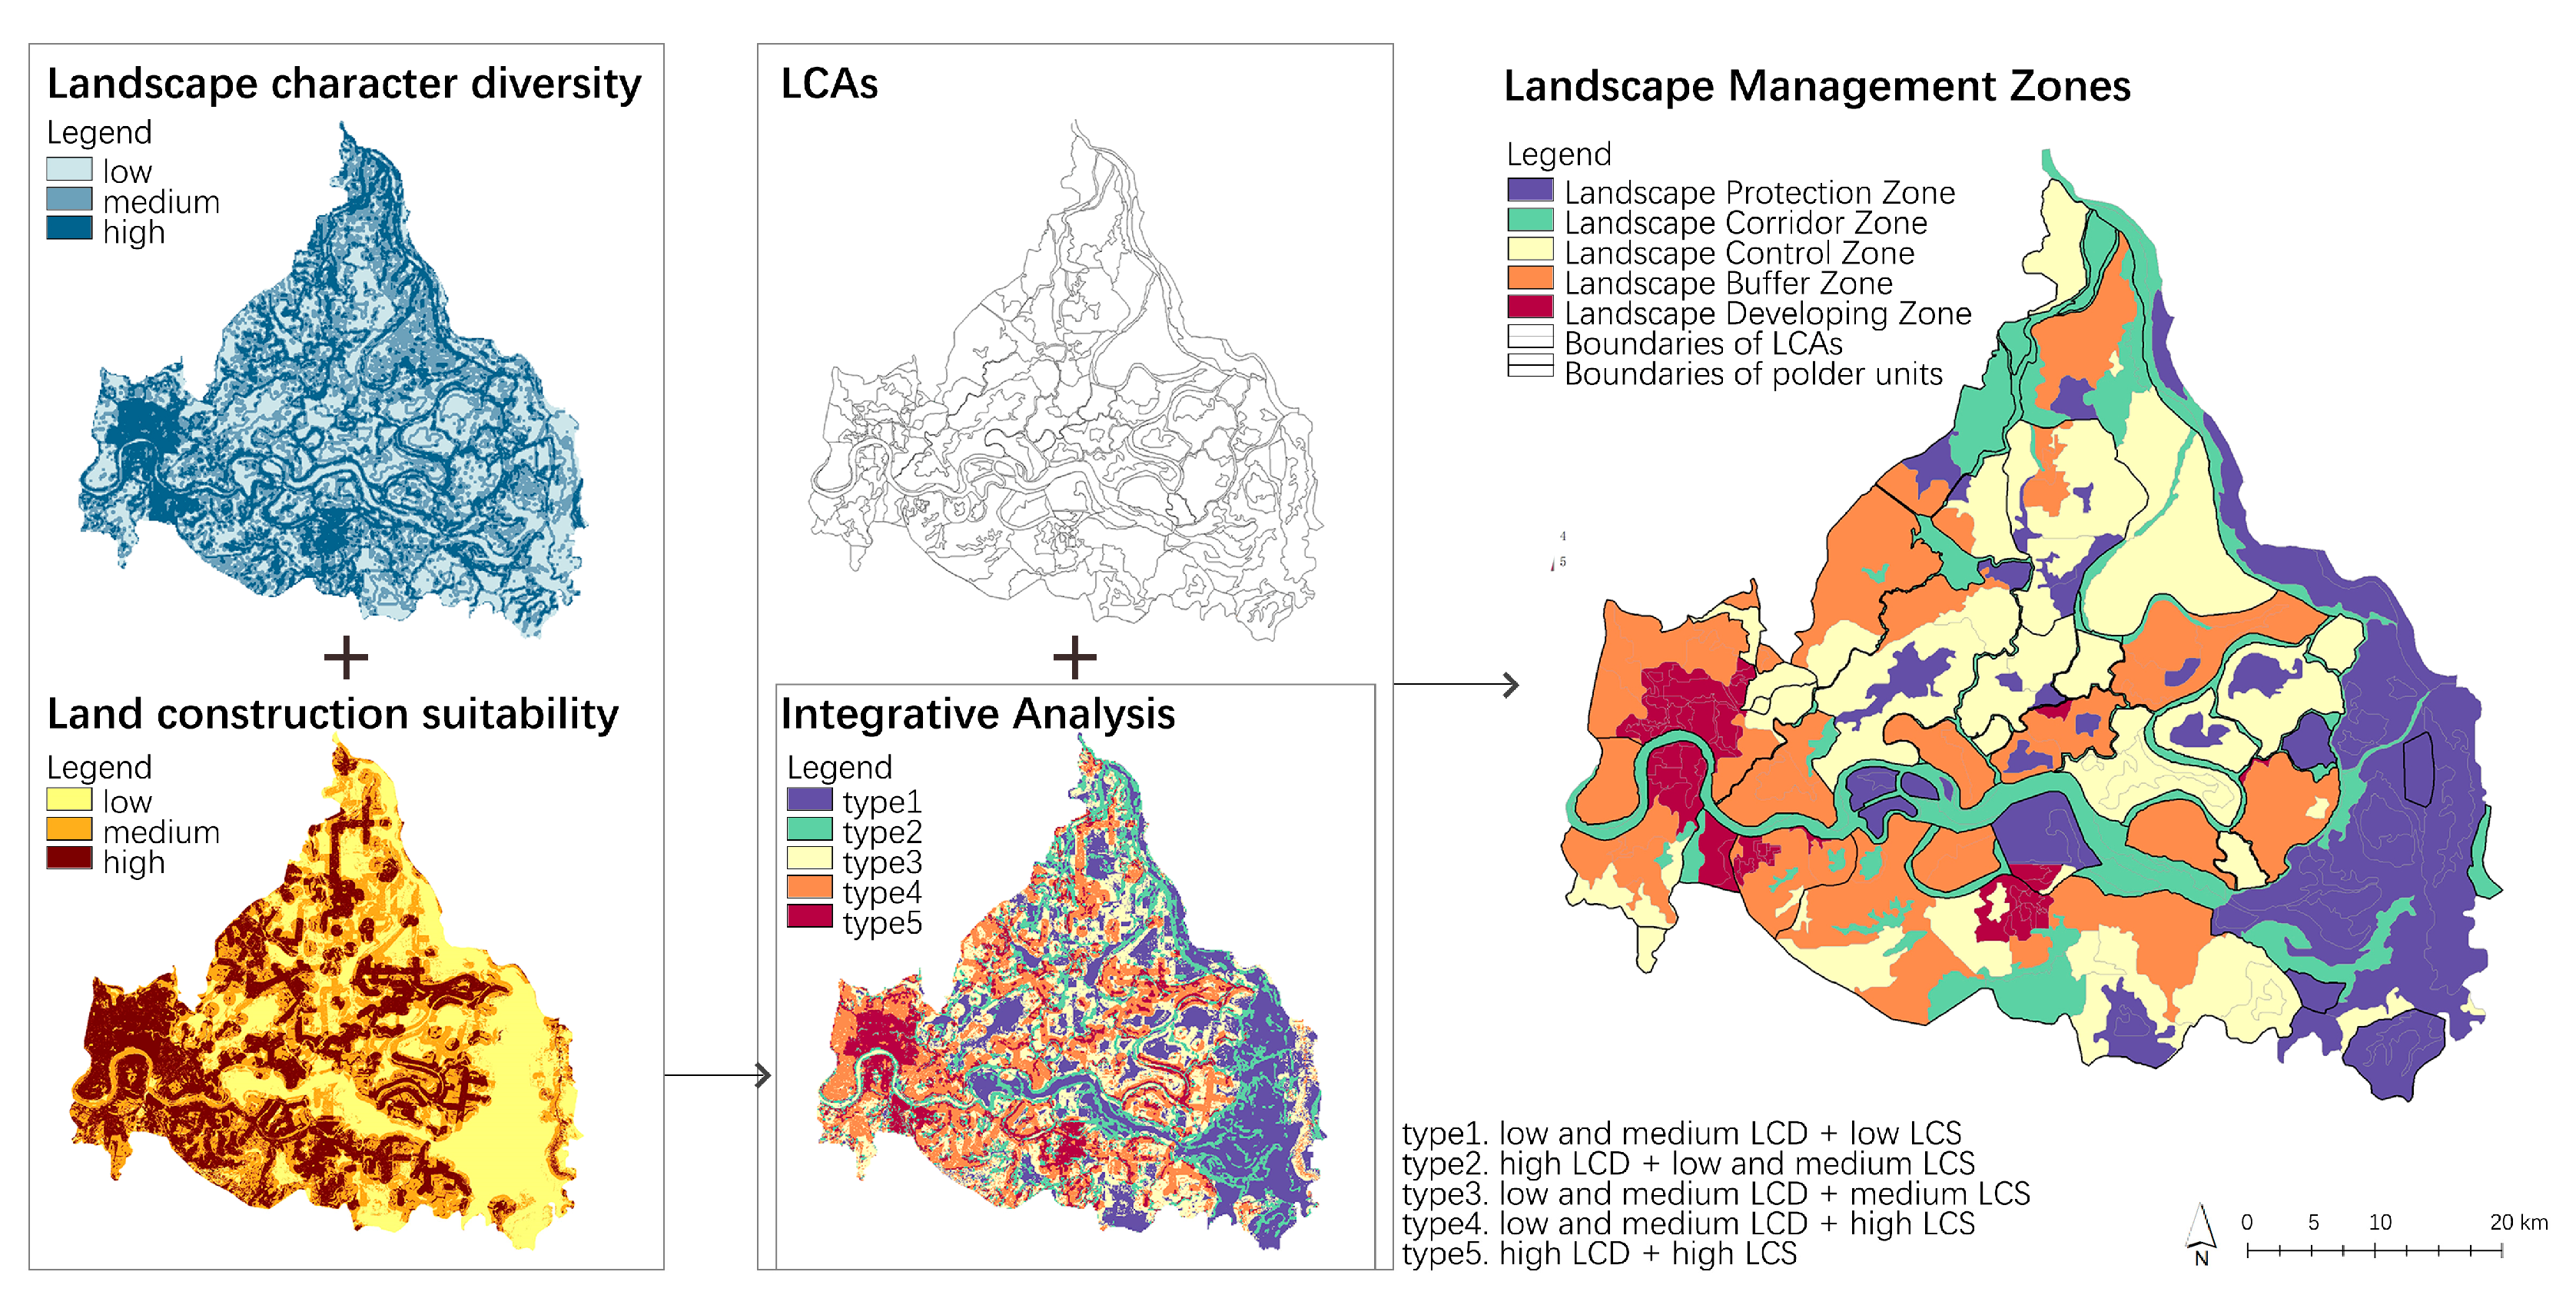
2.4.5. Delimitation of Landscape Management Zones
At the Local Scale, the landscape management zones were established through an integrative analysis of an LCD and LCS assessment, with LCAs serving as the basic units of analysis.
- 1.
- Assessment of LCD
The Shannon’s Diversity Index (SHDI) was selected as the primary indicator to reflect the landscape heterogeneity and complexity of LCTs [19]. In Fragstats 4.2, a raster map of LCD was generated by selecting the SHDI at the landscape type level and employing the moving window method with a 400 m radius. Subsequently, the LCD raster was reclassified into three levels (high, medium, and low) using the natural break method in ArcMap 10.8.1.
- 2.
- Assessment of LCS
To effectively manage land construction in the Yuan River Region, it is necessary to comprehensively consider the living needs of both urban and rural residents, the potential impacts on agricultural production, and the conservation of natural landscape, particularly in terms of water bodies [6]. Consequently, the assessment of LCS comprised three distinct components: landform condition, geographical location, and surface coverage. Detailed indicators of each component are provided in Table 4.
Table 4.
Indicators and weights of LCS assessment.
Through the expert scoring method and analytic hierarchy process, the weight of each indicator was determined and passed the consistency test. All indicators were subsequently classified and assigned values in ArcMap 10.8.1, after which they were integrated into a single raster by a raster calculator tool. Finally, the LCS raster was reclassified into three levels (high, medium, and low) based on the natural break method.
3. Results
3.1. Landscape Characters at the Lake Scale
At the Lake Scale, 12 variables were assigned into 121,908 grid cells, with 46.71% located inside the polders and the remaining 53.29% distributed outside the polders. Through a two-step cluster analysis in SPSS 27.0, a total of 13 LCTs were identified. As shown in Table 5 and Figure 4a, there was a significant difference in the typical LCTs (with proportions exceeding 5%) between the inside and outside of the polders. Inside the polders, Type 13 (69.37%) occupied the largest proportion, followed by Type 12 (10.26%) and Type 8 (8.38%). These three types represent the typical LCTs inside the polders, with each of the remaining LCTs accounting for less than 5.00%. Outside the polders, the first three LCTs with the largest proportion were Type 12 (23.15%), Type 1 (15.60%), and Type 2 (11.80%). A total of eight LCTs had a larger percentage than 5%, representing the typical LCTs outside the polder. The remaining LCTs each accounted for the range between 2.00% and 5.00%.
Table 5.
Landscape character types at the lake scale.
Figure 4.
LCTs and LCAs at the lake scale: (a) map of LCTs, and (b) map of LCAs.
The initial delineation of LCAs was conducted through the Multi-resolution Segmentation tool in eCognition 9.0. The segmentation was considered appropriate with the following parameters: scale (40), shape (0.2), and compactness (0.1), resulting in a total of 345 areas. In addition to the process mentioned in 2.2.4, the specific manual adjustment involved two additional steps (Figure A1): (1) The fragmented areas in the rivers between the polder units were consolidated into eight LCAs based on corresponding water systems, collectively referred to as ‘Inter-polder River’. (2) The LCAs dominated by Type 3 were subdivided into two distinct parts: Type 3A (natural land) and Type 3B (construction land). Ultimately, a total of 433 LCAs were delineated, including 254 LCAs inside the polders and 179 LCAs outside the polders, as shown in Figure 4b.
A total of eight polder unit types were identified based on the different combination of regional attributes and the distribution patterns of LCAs (Table 6, Figure 5a). Subsequently, the polder unit type of the Yuan River region was selected as a typical case. By combining the polder unit boundaries of this type with their adjacent LCAs related to wetland environments, the boundary of the Yuan River Region as a polder landscape region was finally delimited (Figure 5b). This boundary would serve as the study scope for the Local Scale analysis (Figure 5c).
Table 6.
Polder unit types at the lake scale.
Figure 5.
The delimitation of the Yuan river region: (a) eight polder unit types, (b) the boundary of the Yuan river region, (c) LCAs in the Yuan river region, (d) three areas in the Yuan river region.
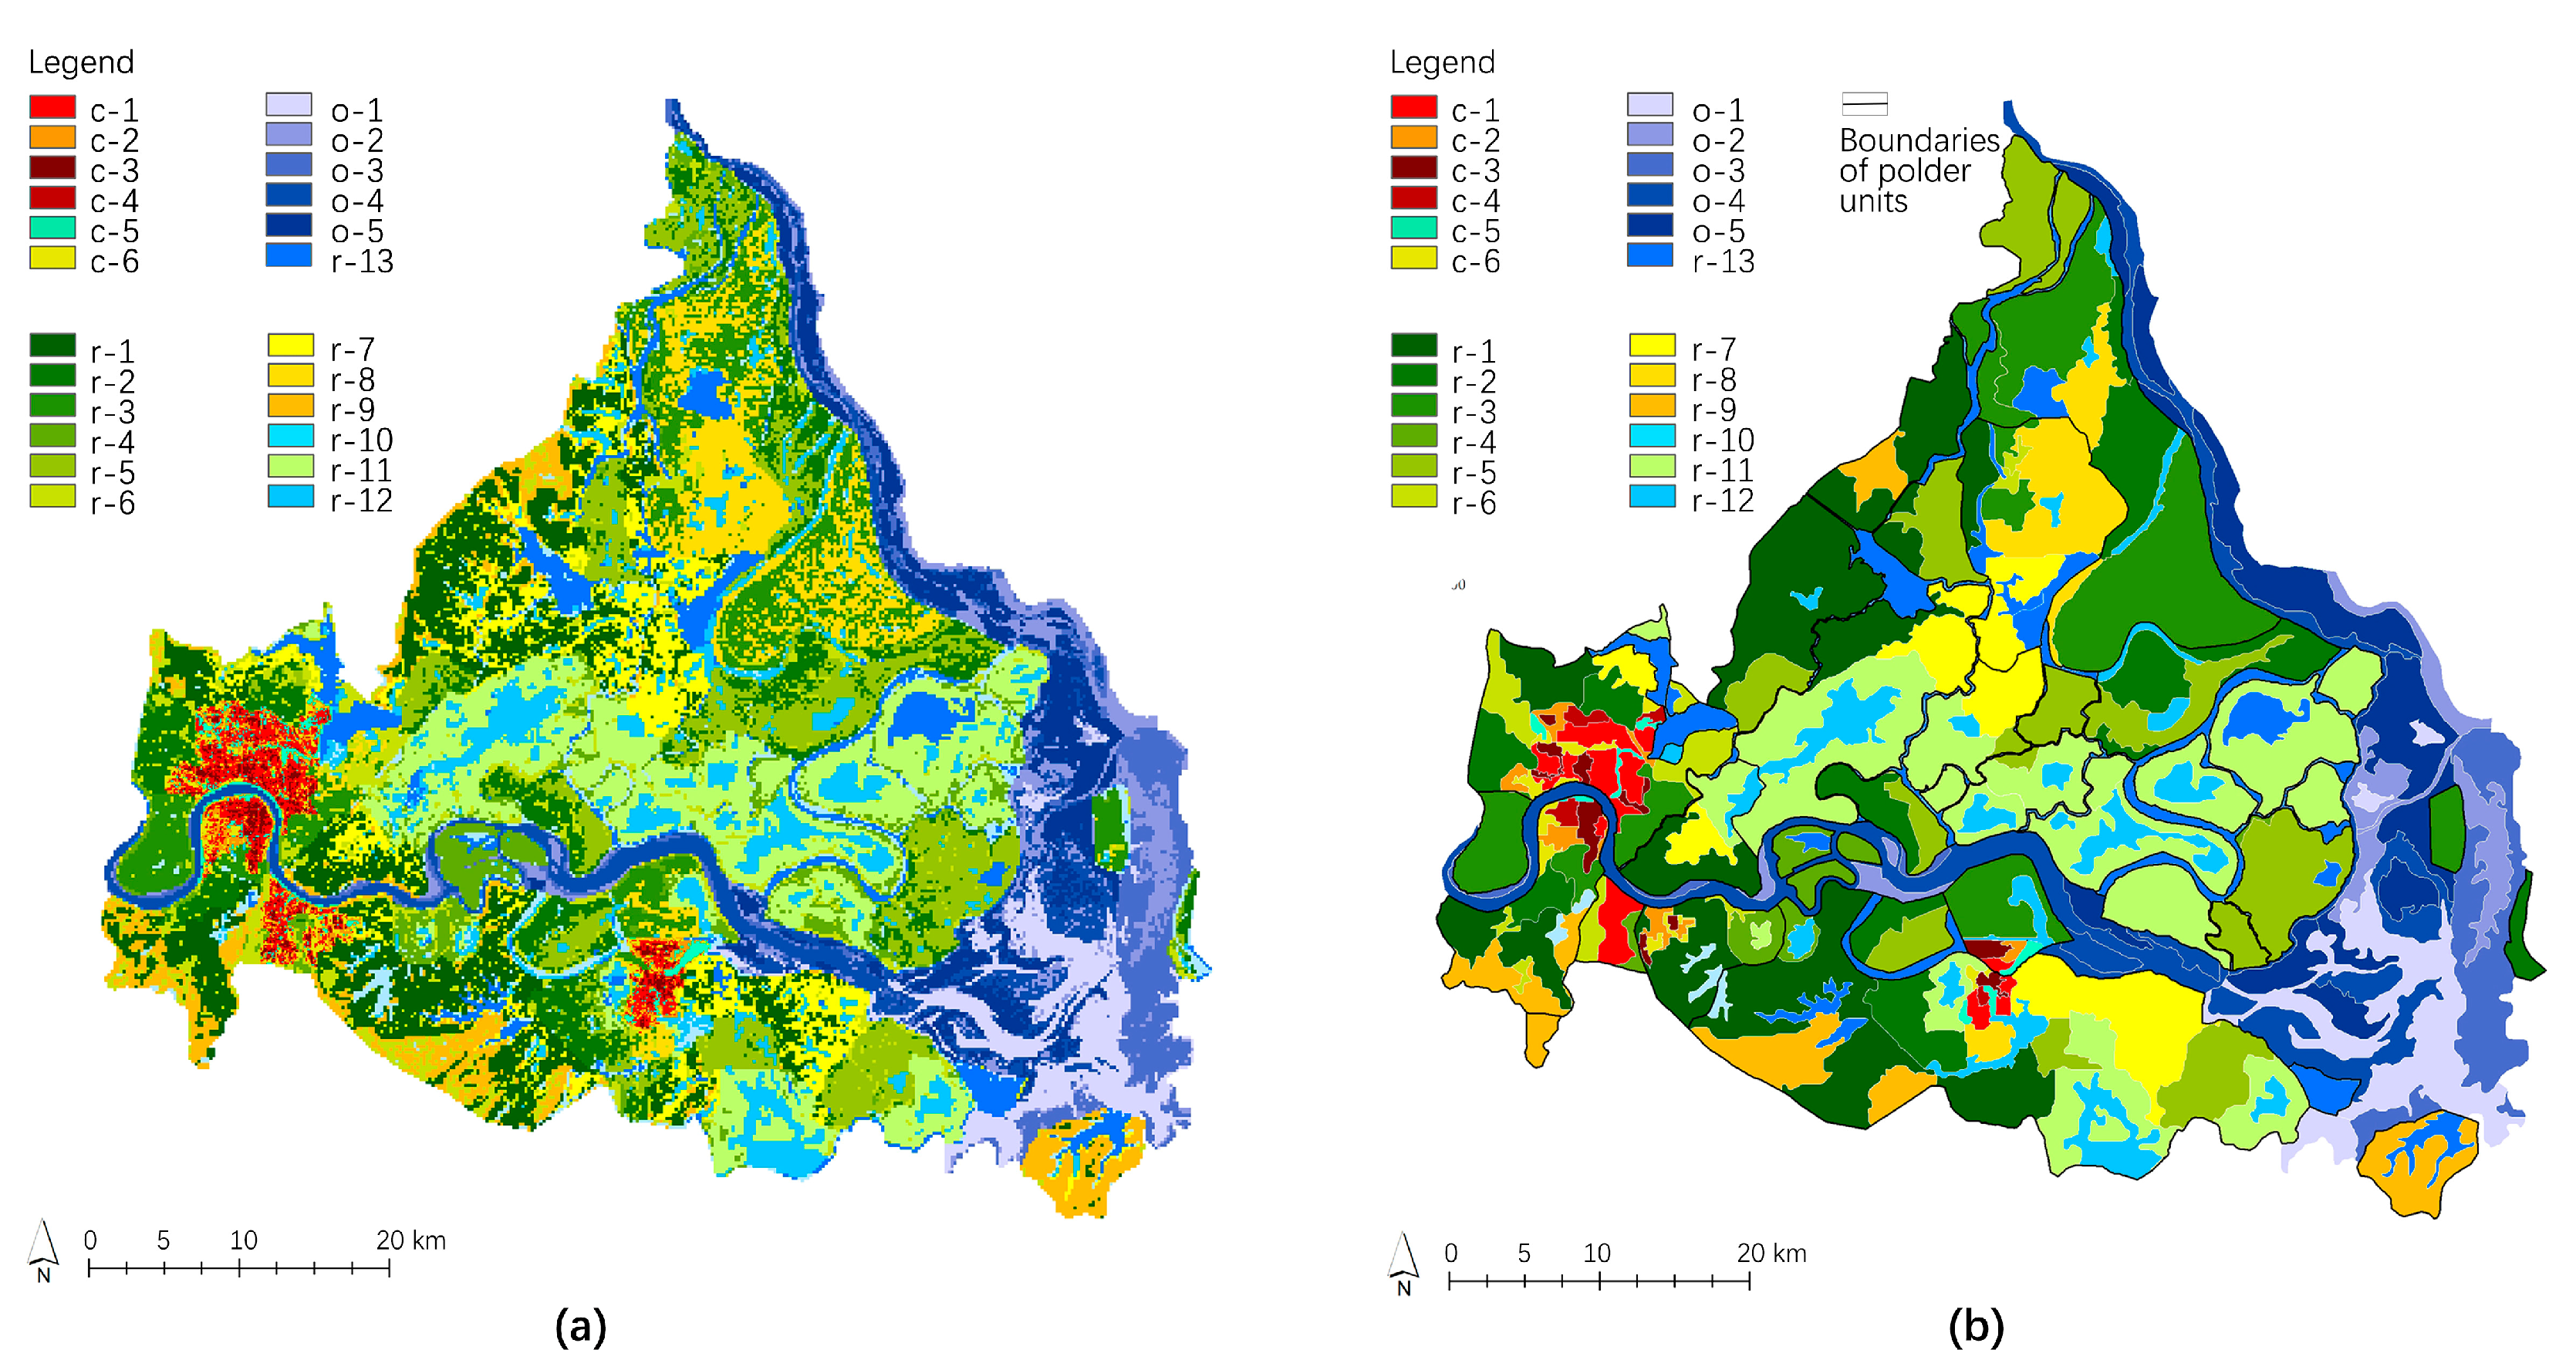
3.2. Landscape Characters at the Local Scale
The Local Scale was divided into three areas according to the distribution pattern of LCAs at the Lake Scale (Figure 5d). In the Rural Area, 23 variables were overlaid into 54,417 grid cells. Through a two-step cluster analysis in SPSS 27.0, a total of 13 LCTs were identified. The top three types, with the largest proportions, were r-11 (12.87%), r-1 (12.09%), and r-5 (10.55%), while the remaining LCTs ranged from 4% to 10%. Inside the polders, there were 10 LCTs with proportions exceeding 5%, representing the typical LCTs inside the polders. (Table 7). These LCAs were typically delineated by dikes and water systems.
Table 7.
Landscape character types in the rural area.
Appropriate segmentation occurred when the parameters of scale, shape, and compactness were set at 40, 0.4, and 0.2, respectively, resulting in a total of 181 areas. Combining these areas with the existing 44 polder units and Inter-polder Waterways, 155 LCAs were ultimately identified.
In the City and Town Area, 17 variables were overlaid into 11,796 grid cells, which were subsequently clustered into six LCTs. The LCT with the largest proportion in this area was c-1, encompassing 21.69% and characterized by cities and towns with medium building density and medium FVC. The smallest was c-5 (12.95%), representing the landscape closely associated with the water environment (Table 8).
Table 8.
Landscape character types in the city and town area.
When the parameters of scale, shape, and compactness were 30, 0.3, and 0.3, respectively, 106 areas were generated through automated segmentation. After boundary processing steps similar to those in the Rural Area, a total of 49 LCAs were finally identified. These LCAs were primarily delineated by the dikes, water systems, and road networks.
In the Non-polder Area, 17 variables were overlaid in 14,621 grid cells and were then clustered into five LCTs. These LCTs exhibited a relatively uniform proportion in this area, with o-4 as the largest at 22.89%, and o-2 as the smallest at 17.11% (Table 9).
Table 9.
Landscape character types in non-polder area.
Appropriate segmentation was achieved with the following parameters: scale (40), shape (0.4), and compactness (0.2), resulting in 83 areas. Subsequently, these areas were integrated into 39 LCAs, which were primarily segmented by dispersed mudflats and marshlands.
By combining the LCTs and LCAs obtained from these three areas (Figure A2), the maps of LCTs and LCAs at the Local Scale were ultimately generated, comprising a total of 24 LCTs (Figure 6a) and 242 LCAs (Figure 6b).
Figure 6.
LCTs and LCAs at the local scale: (a) map of LCTs, (b) map of LCAs.
3.3. Landscape Management Zones
Through an integrative analysis of the LCD and LCS assessments, a total of nine integrative zones were initially identified. The combination of these analytical results represented different site conditions and served as the basis for subsequent landscape management zones according to different management objectives. Therefore, these zones were combined into five distinct landscape management zones based on similar site conditions, as well as specific conservation and development objectives, as shown in Figure 7 and Table 10.
Figure 7.
Delimitation processes and results of the landscape management zones.
Table 10.
Landscape management zones at the local scale.
- 1.
- Landscape Protection Zones
The zones with low-to-medium LCD and low LCS were primarily located in West Dongting Lake, Chi Mountain, and marshlands outside the polders, as well as lakes, ponds, and abandoned polders inside the polders. The LCTs were dominated by marshlands in plains (o-5), lakes in lowland (o-1), farmlands in plains (o-3), as well as reservoirs and ponds in lowlands (r-12). For water and wetland landscapes, it is imperative to strengthen the protection of natural ecology and prohibit excessive reclamation. For reclaimed lakes, efforts should focus on returning reclaimed farmland back to lakes to restore natural water surface and ecological functions.
- 2.
- Landscape Corridor Zones
Characterized by high LCD and low-to-medium LCS, these zones were distributed around the waterways between the polder units, as well as the Yuan River and the Li River outside the polders, showing a distinct linear distribution pattern. The dominant LCTs included rivers, ditches, lakes, reservoirs, and ponds in lowlands (o-4, r-13, r-10). These zones were both ecological and living corridors. For waterways, ensuring unimpeded water flow and flood safety should be essential. Natural landscapes along waterways can benefit from increased landscape diversity through the introduction of diverse natural vegetation. For artificial landscapes along the dikes, infrastructure construction and transportation functions should be enhanced to ensure the daily convenience and security of the residents.
- 3.
- Landscape Control Zones
The zones had low-to-medium LCD and medium LCS, mainly located in lowland farmlands with lakes, ponds, or reservoirs. The primary LCTs consisted of three types of farmlands in lowland: r-11, r-5, and r-8. These zones consist of farmland closely related to natural landscapes and are sensitive to the impacts of human activities. It is essential to control the expansion of cultivated land to avoid excessive encroachment on the natural environment.
- 4.
- Landscape Buffer Zones
The zones were characterized by low-to-medium LCD and high LDS, distributed in the farmlands, in plains, and around urban or rural settlements. The main LCTs included cropland with natural texture in plains (r-1), cropland with semi-regular texture in plains (r-2) and lowland (r-5). These zones serve as the transition spaces between residential areas and farmlands. Rational construction activities could be carried out to satisfy the living and production needs of suburban and village residents. Attention should be paid to both the cultural landscape factors and natural vegetation to maintain high landscape diversity in these zones.
- 5.
- Landscape Developing Zones
The zones with high LCD and high LCS were distributed in and around the central areas of cities and towns, with LCTs dominated by various types of urban landscapes (c-1, c-2, c-3, c-4, c-6). Construction activities could be appropriately carried out to improve landscape functions and structures. For areas dominated by natural landscapes such as rivers or forest lands, it is necessary to enhance natural ecological protection and diversify vegetation.
4. Discussion
4.1. Increasing the Number of Polder Landscape Character Types
The initial step in identifying landscape character types (LCTs) involves a careful selection of appropriate landscape character factors (variables) with differentiating criteria and fundamental data sources [9]. However, the landscape factors of the polder landscape exhibit significant variations at different scales: at a larger scale, there is limited variability in landscape character variables, while, at a smaller scale, landscape factors were intertwined with each other [32]. This characteristic presents challenges in the identification of landscape types.
With the comprehensive application of three measures—multiscale identification, differentiated data, and stratified data sources—as previously demonstrated in the literature to effectively increase the number of recognizable LCTs, the quantity of typical LCTs inside the polders increased from three at the Lake Scale to ten at the Local Scale. In addition, the total number of LCTs inside the polders reached 13 at the Lake Scale and 24 at the Local Scale, respectively. In comparison to the traditional polder typology that commonly identifies a single-digit number of polder landscape types [1,14], this approach significantly enhanced the number of recognizable polder landscape types in a reasonable range.
4.2. Establishment of Polder Unit Database
In the process of delineating the LCAs, two challenges emerged: the segmentation effect of polder unit boundaries on polder landscapes and the influence of multiple landscape boundaries on the distribution pattern of polder landscapes. These challenges arose from the fact that polder landscapes were surrounded by inflexible dikes and were situated in continuously dynamic wetland environments. To address these challenges, we established the polder unit database and utilized the following two measures.
4.2.1. Introduction of Polder Unit Boundary Data
Considering that dikes serve as relatively stable boundaries in the dynamically changing wetland environment, polder unit boundary data (delineated by dikes) were introduced into the semi-automatic image segmentation process. This method achieves the visualization of LCAs with polder unit boundaries at two different scales. The map of LCAs at the Lake Scale revealed that, despite the limited number of typical LCTs inside the polders compared to those outside the polders, notable regional disparities were observed in the distribution patterns of construction lands (Type 3A) and water bodies (Type 8 and 11). The utilization of the relationship between construction lands and polder units as a criterion for classifying polder unit types was a perspective rarely used in other studies. However, this method aligns with the existing polder management classifications in the DLA, where key polders are defined as those that internally protect significant cities, towns, and industrial areas [13].
4.2.2. Polder Units as the Carriers of Regional Attributes and Management Zones
Polder units typically serve as the fundamental units for agricultural and water resource management [32]. In this study, the polder units were designated as carriers, with other landscape boundaries transformed into regional attributes assigned to each polder unit. As a result, eight polder unit types with diverse combinations of regional attributes were identified. Subsequently, the clear boundary of the Yuan River Region, as a typical case of polder landscape regions, was delineated by integrating polder unit types and their surrounding LCAs. This comprehensive classification method bridged the gap in the intermediate-scale studies, achieving a stepwise transition in scale from polder areas to polder unit clusters and ultimately to individual polder units. This method not only provided a clear study scope for the Local Scale but also ensured the integrity of polder landscape characters across various landscape boundaries [7]. Moreover, the study scope at each scale included the surrounding wetland environments outside the polders. Compared to the external environment in highly developed polder areas, which can be simply delineated by surrounding river channels [14,33], the external environments in the DLA are relatively complex and dynamic, characterized by ever-changing natural boundaries such as mudflats, wetlands, natural rivers, and lakes [27]. Therefore, this method provides a comprehensive demonstrative effect for polder landscapes, especially for those either in the process of development or located in dynamically changing regions.
4.3. Refinement of Management Zones and Strategies
This study further divided the Local Scale into five landscape management zones through an integrative analysis of LCD and LCS assessments. It is noteworthy that these zones were not merely an overlay of different assessment results [19] but rather a balanced method that harmonized the conservation of the landscape diversity of polder landscapes with the promotion of sustainable development in wetland environments. In addition, this method had the capacity of formulating tailored strategies for similar LCTs in different zones [20]. For instance, for water landscapes (o-1, o-5, r-12) situated in Landscape Protection Zones, a crucial priority was to enhance the preservation of natural ecology and strictly prohibit reclamation activities. While for water landscapes (o-4, r-13, r-10) in Landscape Corridor Areas, it was imperative to ensure unimpeded water flow and flood safety.
4.4. Limitations and Future Prospects
This study has two limitations. Firstly, it lacks timely and precise data on soil distribution and agricultural vegetation types, which may have some impact on the diversity of LCTs in rural areas at the Local Scale. Secondly, the delineation of polder unit boundaries used in this study was based on dikes, in contrast to some studies that define boundaries according to the edges of rivers at specific water levels [12]. Consequently, the measured areas of the polder units in this study were relatively small. In the future, it is imperative to enhance collaboration with local organizations to explore more suitable variables and methods for revealing polder landscape characters.
5. Conclusions
In this study, we selected the DLA as a typical case of polder landscapes. By employing LCA methods in combination with polder typology approaches, we conducted a systematic analysis on its landscape character, as well as landscape management zones and strategies.
- 1.
- The quantity of recognizable LCTs of polder landscapes was significantly enhanced through three measures that refined the selection and data processing method of landscape character variables, identifying 13 types of LCTs at the Lake Scale and 24 types at the Local Scale. This refinement led to a more accurate and comprehensive identification of LCTs within the DLA.
- 2.
- After establishing the polder unit database, LCAs were visualized by incorporating polder unit boundary data into the semi-automatic image segmentation process of the LCA method. A total of 433 LCAs were identified at the Lake Scale and 242 LCAs were identified at the Local Scale. This integration elucidated distinct regional differences in the distribution patterns of LCAs, thereby providing the foundation for delineating distinct polder landscape regions.
- 3.
- Building upon these regional differences, we established a comprehensive classification method for polder unit types and polder landscape regions. This method achieved a stepwise transition from polder areas to polder clusters, then to individual polder units, integrating LCAs and landscape management zones across different scales.
- 4.
- At the Local Scale, we further divided into five landscape management zones through an integrative analysis of LCD and LCS assessments, including the Landscape Protection Zone, Landscape Corridor Zone, Landscape Control Zone, Landscape Buffer Zone, and Landscape Developing Zone. This division provided a basis for tailored strategies for similar LCTs in different zones, ensuring that management practices are context-specific and effective.
By identifying LCTs and polder unit types, as well as delineating LCAs and polder landscape management zones at two scales, this study establishes a foundation and reference for landscape management and planning in the DLA. This method supports the aim of conserving regional character and the promotion of sustainable development of wetlands in the DLA. In general, this study provided an operational and replicable approach for identifying landscape character and delineating management zones in polder landscapes. It is particularly applicable for those polders that are undergoing development or in dynamically changing environments, and it could be expanded to other lowland or plain agricultural landscapes.
Author Contributions
Conceptualization, Q.L.; Data curation, J.D.; Formal analysis, J.D.; Investigation, J.D.; Methodology, Q.L.; Project administration, Q.L.; Resources, Q.L.; Validation, J.D. and Q.L.; Visualization, J.D.; Writing—original draft, J.D.; Writing—review and editing, Q.L. All authors have read and agreed to the published version of the manuscript.
Funding
This research was supported by the National Key R&D Program of China “Urban Ecological Space Control and Layout Optimization Technology” (2022YFC3800203).
Data Availability Statement
The data associated with our study could not be deposited into a publicly available repository. Data will be made available upon request.
Conflicts of Interest
The authors declare no conflicts of interest.
Appendix A
Figure A1.
Process for delineating LCAs at the Lake Scale.
Figure A2.
Process for delineating LCAs at the Local Scale.
References
- Nijhuis, S.; Bing, H. Polderscapes: The Landscape Architecture of the Dutch Lowlands. Landsc. Archit. 2016, 8, 38–57. [Google Scholar] [CrossRef]
- Li, Y.; Ye, Y.; Li, J.; Zhang, C.; Fang, X. Reconstructing the spatiotemporal distribution of polders in modern Dongting Plain, Hunan Province. Appl. Geogr. 2020, 123, 102250. [Google Scholar] [CrossRef]
- ILRI. Polders of the World; International Institute for Land Reclamation and Improvement: Wageningen, The Netherlands, 1982; p. 721. [Google Scholar]
- Guo, W.; Hou, X. Analysis of Polder Landscape in Ningshao Plain. Landsc. Archit. 2018, 25, 21–26. [Google Scholar]
- Nijhuis, S. The noordoostpolder: A landscape planning perspective on the preservation and development of twentieth-century polder landscapes in the Netherlands. In Adaptive Strategies for Water Heritage; Springer: Cham, Switzerland, 2020; pp. 213–230. [Google Scholar]
- Ning, Q.; OuYang, H.; Tang, F.; Zeng, Z. Temporal and Spatial Evolution of Landscape Pattern in Dongting Lake Areaunder the Influence of Land Use Change. Econ. Geogr. 2020, 40, 196–203. [Google Scholar]
- Yang, D.; Gao, C.; Li, L.; Van Eetvelde, V. Multi-scaled identification of landscape character types and areas in Lushan National Park and its fringes, China. Landsc. Urban Plan 2020, 201, 103844. [Google Scholar] [CrossRef]
- Simensen, T.; Halvorsen, R.; Erikstad, L. Methods for landscape characterisation and mapping: A systematic review. Land Use Policy 2018, 75, 557–569. [Google Scholar] [CrossRef]
- Mücher, C.A.; Klijn, J.A.; Wascher, D.M.; Schaminée, J.H.J. A new European Landscape Classification (LANMAP): A transparent, flexible and user-oriented methodology to distinguish landscapes. Ecol. Indic 2010, 10, 87–103. [Google Scholar] [CrossRef]
- Xie, Y.; Nolf, C. Cultural Landscape Characterization in the Metropolitan Areas of the Yangtze River Delta. Chin. Landsc. Archit. 2020, 36, 73–78. [Google Scholar]
- Wang, J.; Gao, M.; Guo, H.; Chen, E. Spatiotemporal distribution and historical evolution of polders in the Dongting Lake area, China. J. Geogr. Sci. 2016, 26, 1561–1578. [Google Scholar] [CrossRef]
- Li, J.; Yi, B.; He, Q. The Monitoring of Land Use Status lnvestigation in Dongting Lake Area’s Main Encirclement Dikes. Land Resour. Her. 2016, 13, 29–32. [Google Scholar]
- Department of Natural Resources of Hunan Province. Atlas of Historical Vicissitude in Dongting Lake; Hunan Map Publishing Commpany: Changsha, China, 2010. [Google Scholar]
- Xie, Y.; Ying, J.; Chen, L. Typology, Morphogenesis and Adaptive Transformation of Polder Landscape in the Yangtze River Delta. Urban Dev. Stud. 2022, 29, 70–77. [Google Scholar]
- Atik, M.; Işıklı, R.C.; Ortaçeşme, V.; Yıldırım, E. Exploring a combination of objective and subjective assessment in landscape classification: Side case from Turkey. Appl. Geogr. 2017, 83, 130–140. [Google Scholar] [CrossRef]
- Li, G.; Zhang, B. Identification of landscape character types for trans-regional integration in the Wuling Mountain multi-ethnic area of southwest China. Landsc. Urban Plan 2017, 162, 25–35. [Google Scholar] [CrossRef]
- Bao, Z.; Zhou, J.; Huang, D.; Lian, X.; Yuan, Y. The Establishment of Provincial Multi-scale Landscape Character Classification System in Guangxi Autonomous Region Province. Chin. Landsc. Archit. 2021, 37, 52–57. [Google Scholar]
- Swanwick, C. Landscape Character Assessment: Guidance for England and Scotland; The Countryside Agency and Scottish Natural Heritage: Gloucestershire, UK, 2002; p. 84. [Google Scholar]
- Wu, Y.; Wang, H.; Bin, Z. Landscape Character Diversity and Zoning Management: Case of Wuhan Metropolitan Area. J. Urban Plan. Dev. 2021, 147, 04020062. [Google Scholar] [CrossRef]
- Sun, Z.; Liu, Y.; Zhang, J.; Wang, S.; He, D. Study on Landscape Protection and Utilization Planning of Cultural Heritage Sites Based on LCA: A Case Study of Gubeikou Town, Beijing Great Wall Cultural Belt. Urban Dev. Stud. 2022, 29, 107–115. [Google Scholar]
- Li, Y. Dong Ting Hu De Yan Bian Kai Fa He Zhi Li Jian Shi (A Brief History of the Evolution, Development and Management of Dongting Lake); Hunan University Press: Changsha, China, 2014. [Google Scholar]
- Mei, L.; Zhang, G.; Yan, C. Liang Hu Ping Yuan Kai Fa Tan Yuan (A Study on the Reclamation Process of the Jianghan-Dongting Plain); Jiangxi Education Publishing House: Nanchang, China, 1995. [Google Scholar]
- Li, Y.; Ye, Y.; Zhang, C.; Li, J.; Fang, X. A spatially explicit reconstruction of cropland based on expansion of polders in the Dongting Plain in China during 1750–1985. Reg. Environ. Change 2019, 19, 2507–2519. [Google Scholar] [CrossRef]
- Van Eetvelde, V.; Antrop, M. A stepwise multi-scaled landscape typology and characterisation for trans-regional integration, applied on the federal state of Belgium. Landsc. Urban Plan 2009, 91, 160–170. [Google Scholar] [CrossRef]
- Zhu, G. Hu nan sheng xian ji nong ye di mao qu hua fang fa de tan tao. J. Nat. Sci. Hunan Norm. Univ. 1982, 1, 105–111. [Google Scholar]
- Sun, Q.; Zhang, Y. Landscape Character ldentification and lts Value Assessment in Natural Areas: A Case Study of Qinghai Lake Basin. Chin. Landsc. Archit. 2020, 36, 76–81. [Google Scholar]
- Li, Y. Dong Ting Hu Zhi (General History of Dongting Lake); Hunan People’s Publishing House: Changsha, China, 2013; Volume 1, p. 440. [Google Scholar]
- Dongting Lake Water Resources Administration Bureau of Hunan Province. Hu Nan Sheng Dong Ting Hu Qu Di Yuan Tu Ji (Atlas of Polder in Dongting Lake Area, Hunan Province); Human Map Puhlishing Company: Changsha, China, 2004; p. 174. [Google Scholar]
- Hunan Provincial Department of Water Resources. Hu Nan Sheng Dong Ting Hu Qu Di Yuan Tu Ji (Atlas of Polder in Dongting Lake Area, Hunan Province); Hunan Provincial Department of Water Resources: Changsha, China, 1992. [Google Scholar]
- Wang, J.; Gao, M.; Guo, H.; Chen, E. Polders Spatial Dataset around Dongting Lake, China (1949–2013). J. Glob. Chang. Data Discov. 2017, 1, 93–99. [Google Scholar]
- Gao, X.; Cheng, W.; Wang, N.; Liu, Q.; Ma, T.; Chen, Y.; Zhou, C. Spatio-temporal distribution and transformation of cropland in geomorphologic regions of China during 1990–2015. J. Geogr. Sci. 2019, 29, 180–196. [Google Scholar] [CrossRef]
- Xia, T.; Guo, W.; Wen, B. Study of the Polder Landscape in Dongting Lake District. Chin. Landsc. Archit. 2020, 36, 86–91. [Google Scholar]
- Sun, J.; Zhang, L. Analysis on Traditional Polder Landscape of Jiangnan Area: A Case Study of Furongwei Polder. Agric. Hist. China 2022, 41, 55–65. [Google Scholar]
Disclaimer/Publisher’s Note: The statements, opinions and data contained in all publications are solely those of the individual author(s) and contributor(s) and not of MDPI and/or the editor(s). MDPI and/or the editor(s) disclaim responsibility for any injury to people or property resulting from any ideas, methods, instructions or products referred to in the content. |
© 2024 by the authors. Licensee MDPI, Basel, Switzerland. This article is an open access article distributed under the terms and conditions of the Creative Commons Attribution (CC BY) license (https://creativecommons.org/licenses/by/4.0/).


