Article

Treating Tropical Soils with Composted Sewage Sludge Reduces the Mineral Fertilizer Requirements in Sugarcane Production

by
Rafael dos Santos Silva
1,
Marcelo Carvalho Minhoto Teixeira Filho
1,
Arshad Jalal
2,
Rodrigo Silva Alves
3,
Nathércia Castro Elias
3,
Raimunda Eliane Nascimento do Nascimento
3,
Cassio Hamilton Abreu-Junior
4,
Arun Dilipkumar Jani
5,
Gian Franco Capra
6,* and
Thiago Assis Rodrigues Nogueira
1,3
1
Department of Plant Protection, Rural Engineering, and Soils, School of Engineering, São Paulo State University, Ilha Solteira 15385-000, SP, Brazil
2
The BioActives Lab, Center for Desert Agriculture (CDA), Division of Biological and Environmental Sciences (BESE), King Abdullah University of Science and Technology (KAUST), Thuwal 23955-6900, Saudi Arabia
3
Department of Soil Science, School of Agricultural and Veterinarian Sciences, São Paulo State University, Via de Acesso Prof. Paulo Donato Castellane s/n, Jaboticabal 14884-900, SP, Brazil
4
Center of Nuclear Energy in Agriculture, University of São Paulo, Av. Centenário n◦ 303, Piracicaba 13416-000, SP, Brazil
5
Department of Biology and Chemistry, California State University, Monterey Bay, Seaside, CA 93955, USA
6
Dipartimento di Architettura, Design e Urbanistica, Università di Sassari, Via Piandanna 4, 07100 Sassari, Italy
*
Author to whom correspondence should be addressed.
Land 2024, 13(11), 1820; https://doi.org/10.3390/land13111820
Submission received: 23 August 2024 / Revised: 15 October 2024 / Accepted: 1 November 2024 / Published: 2 November 2024
(This article belongs to the Section Land, Soil and Water)

Abstract

:
Conventional mineral fertilization (CMF) is a common practice in infertile sugarcane-cultivated tropical soils, increasing production costs and environmental concerns. Combining CMF with composted sewage sludge (CSS) could be a sustainable strategy. We aim to evaluate changes in soil chemical properties, macro- and micronutrient concentrations in the soil surface (Ap1; 0–25 cm) and subsurface (Ap2; 25–50 cm) horizons, after CSS application with or without CMF in sugarcane cultivation (first and second ratoon cane). Eleven treatments, featured by CSS increase rates and mixed with CMF at different concentrations, were tested in the first ratoon; during the second, the CSS residual effect was evaluated. Applying CSS in sugarcane-cultivated soils, improved the following: (i) soil organic matter, pH, the sum of bases, cation-exchange capacity, and base saturation; (ii) overall nutrient concentrations (P, K, Ca, Mg, B, Cu, and Zn). The treatments showing the best performances were those with 5.0 Mg ha−1 of CSS. Composted sewage sludge has the potential for use as an organic natural fertilizer reducing the need for CMF. When applied in infertile tropical soils, additional positive effects can be achieved, such as decreasing production costs and providing socio-economic benefits.

1. Introduction

With 8.3 million hectares resulting in yields of 713.2 million tons (meaning 32 billion liters of ethanol), Brazil is the largest producer of Sugarcane (Saccharum spp.), thus being the worldwide leader in the global sugar-energy sector [1]. Southeast Brazil is the largest producer, with an estimated production of 387.7 million tons. São Paulo state, with 51% share, is the largest national producer [2,3]. Sugarcane production contributes over 2% to Brazil’s Gross Domestic Product (GDP) [3].
The bioenergy production from sugarcane has tremendously increased in the last few years. Indeed, several studies demonstrated the environmental and socio-economic sustainability of sugarcane-derived bioenergy, especially in terms of greenhouse gas (GHG) reduction and related positive global effects [1]. Sugar cultivation has several additional socio-economic and environmental advantages, such as the recovery of degraded areas, maintenance of soil carbon stocks, production of bioenergy sources, nutrient cycling, job creation, etc. [4,5,6].
To achieve profitable production, fertilization is a key factor in both the initial growth phase (cane plant) and the subsequent regrowth phase (ratoon). Adequate fertilization increases plant height and diameter, thus, significantly contributing to the technological variables that influence the sugar quality, such as brix degrees, sucrose content (POL), total recoverable sugar (TRS), and sugar productivity in tons per hectare (TSH) [1,7,8].
The conventional mineral fertilization (CMF) recommended for sugarcane planting [9] is related to (i) expected productivity and (ii) soil analysis, whereas nitrogen (N) recommendation relies on only expected productivity and cropping history of the agricultural area. For example, if the expected productivity is above 100 Mg ha−1 then 30, 120, and 150 kg ha−1 of N, P, and K, respectively, must be applied. If soil is featured by low B, Cu, and Zn concentrations, then an application of 2, 4, and 5 kg ha−1, is recommended. Mineral fertilization for ratoon cane is also related to the aforementioned variables, however, N, K, B, and Zn are commonly applied. For example, if the expected productivity is above 100 Mg ha−1 then 120 and 160 kg ha−1 of N and K, respectively, must be applied. Organic fertilizer is used in sugarcane cultivation; 10 to 30 Mg ha−1 is the recommended rate, to be applied in the planting furrow or close to the ratoon line [9].
The mineral fertilizer used in sugarcane production in Brazil is largely imported (≈ 85%), which increases production costs. In this context, alternative sources of nutrients (e.g., organic fertilizers) become crucial, allowing the reduction of acquisition costs while ensuring the sustainability of the production chain in the sugar-energy sector [10,11,12]. Sewage sludge (SS), a “waste” product coming from urban wastewater treatment plants, can be an excellent option. Composted sewage sludge may be used as a soil amendment/fertilizer, due to its large amounts of organic matter (OM) and nutrients. Indeed, CSS can be commercialized as a Class B organic fertilizer in Brazil [13,14].
Using CSS as an organic fertilizer represents the best way to manage SS. The development of new products and alternative sources of nutrients in agriculture is provided in the National Fertilizer Plan of Brazil [13,14], bringing more competitiveness and socio-environmental improvement. The transformation of waste into organic fertilizers combines (i) technology for reducing agricultural production costs while (ii) improving soil quality.
Several studies have demonstrated benefits of CSS on soil bio-physico-chemical properties apart from improving crop development [15,16,17,18]. We previously demonstrated that CSS applied at a dose of 5.0 Mg ha−1, and associated with mineral fertilization, increased CEC, SB, P, Ca, Cu, and Zn concentration in a sugarcane seedling nursery [19]. However, field studies are still lacking, thus further in-depth investigations to evaluate the agronomic feasibility of the integrated use of mineral fertilizers and CSS in sugarcane cultivated areas, are required.
In the present study, we sought to validate the hypothesis that the application of CSS, with or without mineral fertilizers, would improve soil fertility. Thus, our objectives were to (1) evaluate changes in chemical properties of an infertile tropical soil after CSS application with or without CMF in the first sugarcane crop, and (2) assess the residual effect of CSS in the second ratoon in a commercial sugarcane production area.

2. Materials and Methods

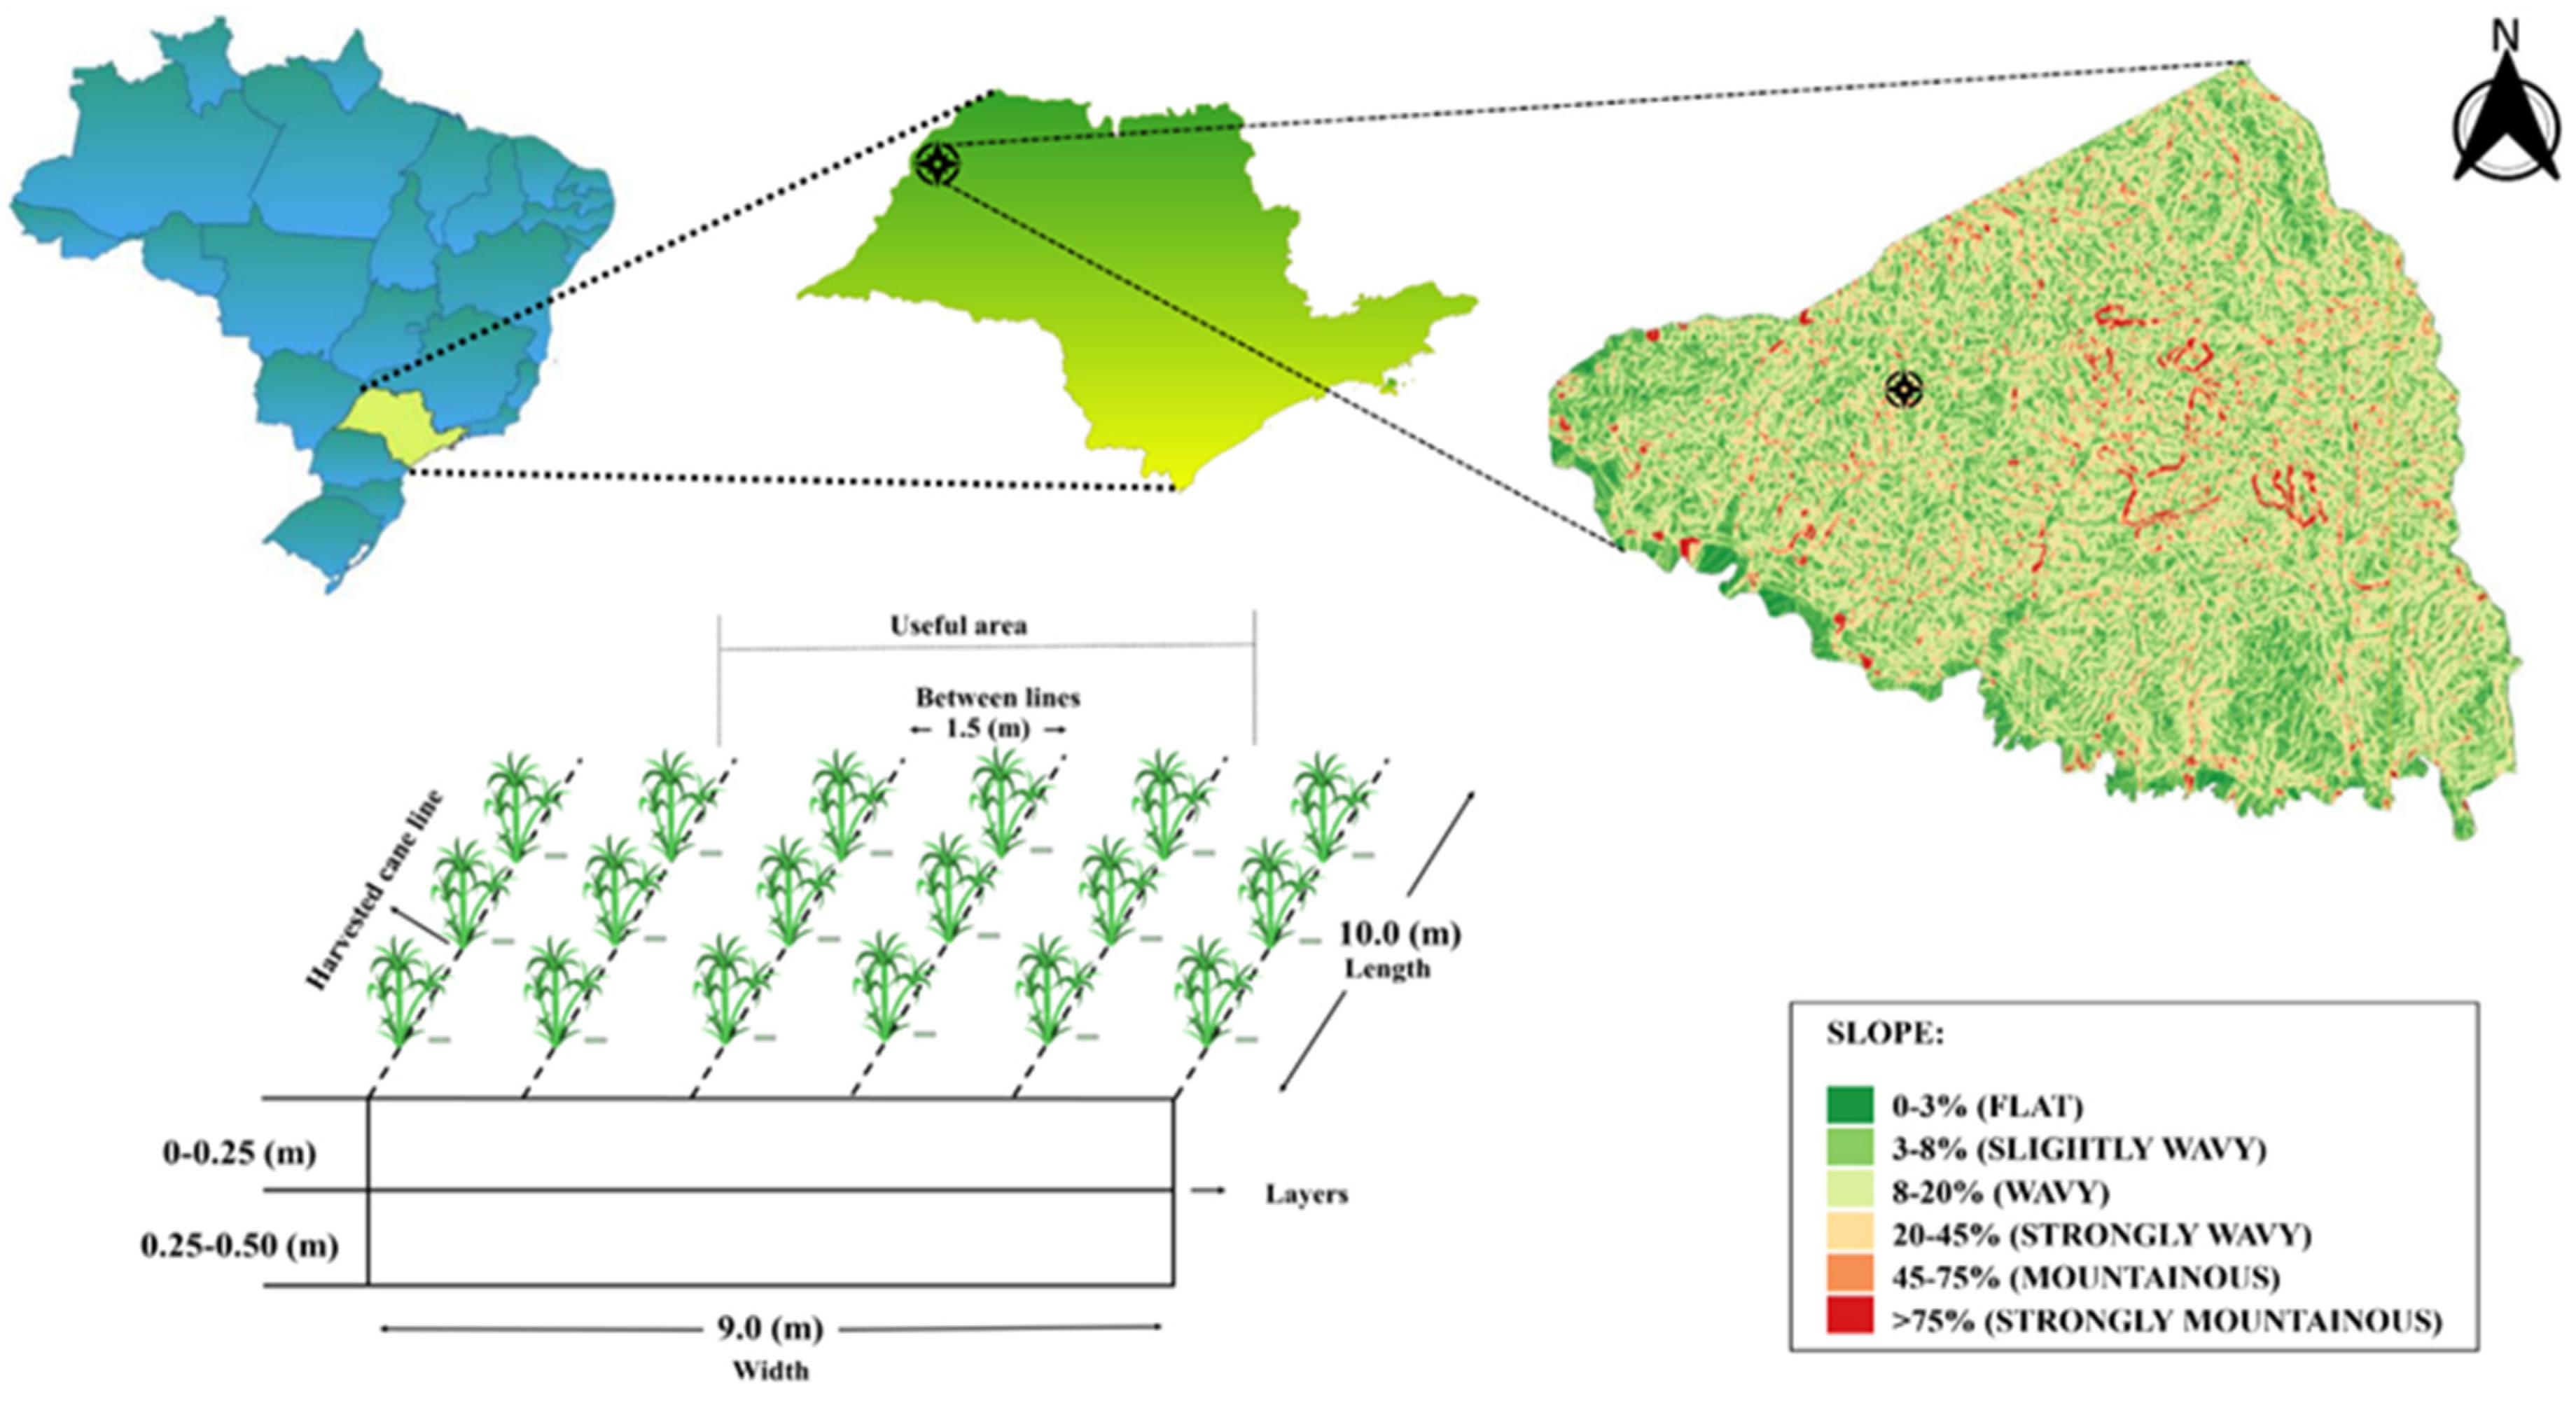
2.1. Description of the Experimental Area

The experiment was conducted under field conditions in two agricultural years (2020/21 and 2021/22) in the municipality of Suzanápolis, São Paulo, Brazil (20°28′47.40″ S and 51° 4′33.14″ W; 354 m a.s.l.; Figure 1).
According to the Köppen climate classification [20], the climate is of the Aw type (A = Equatorial; w = winter dry), characterized by a tropical wet and dry climate with maximum rainfall in summer and autumn and a dry winter. Monthly climatological data were collected throughout the study (Figure S1).
Before the experiment began, both surface Ap1 (0–25 cm) and subsurface Ap2 horizons (25–50 cm) were characterized for physical and chemical properties. The soil was classified as Xanthic Hapludox [21], i.e., a low fertility, sandy soil (Table 1).

2.2. Treatments and Experimental Design

The experiment was conducted using a randomized complete block design. There were 11 treatments (Table 2) replicated four times, totaling 44 experimental units. The treatments used in the first year of the experiment (first ratoon—2020/21) consisted of doses of CSS (wet basis) and N-P-K mineral fertilizer (formulation 20–00–20). Since we aimed to evaluate the residual effect of CSS doses applied in the first year, during the second year (second ratoon—2021/22), no CSS was applied; N-P-K fertilization was used in the formulation 20–00–20. Fertilizers were applied at 1.0 kg ha−1 of N and K2O per ton of sugarcane. Indeed, fertilization of sugarcane in Brazil for ratoon cane is based on the expected yield per hectare. Therefore, recommendations from the Agronomic Institute (IAC) were applied, by using the local bulletin for sugarcane fertilization (for instance: if the expected yield per hectare is 100 Mg ha−1 of cane, it is recommended to apply 100 kg ha−1 of N. Additionally, the wet basis application was chosen because, in agricultural practice, the CSS rates are applied by farmers this way directly in the field. Therefore, while the CSS application rates are done on a wet basis, the chemical analyses have been conducted on a dry basis to ensure standardized results (Table 2).

2.3. Composted Sewage Sludge Characterization

The CSS was provided by the company Tera Ambiental Ltd.a (Jundiaí, SP, Brazil). It is a Class B organic compost fertilizer registered with Ministry of Agriculture, Livestock and Food Supply (MAPA) in Brazil [23]. It was produced from the composting of various urban organic waste, such as sanitary sewage sludge (SS), urban- and agro-industrial organic waste (bagasse, fruit and vegetable peels from food processing, poultry litter, and wood chips). Because CSS composition is heavily influenced by the composition of the raw materials, we calculated the weighted average of the three CSS batches used in our experiment (see Table 2). Organic compounds undergo decomposition and biological stabilization through thermophilic composting with a temperature above 60 °C for approximately two weeks, making it completely sanitized. Afterward, the product goes through the sieving and stocking process, an essential phase for its maturation. After this step, CSS was ready for use with about 40% moisture. The CSS was finally characterized according to Resolution–375/2006 [23], thus being considered appropriate for their use in the field (Table S1).

2.4. Field Experiment

The experimental area was prepared to begin in November 2019. Weeds were managed with glyphosate at 3.1 kg ha−1 a.i. based on initial soil properties (Table 1), limestone (PRNT = 85) and gypsum were applied at 0.5 and 0.7 Mg ha−1, respectively, along the entire experimental area as recommended by Cantarella [9]. A heavy harrowing was done, followed by an intermediate harrowing and subsoiling at depths of 30, 25, and 45 cm respectively, with the application of 1.2 kg ha−1 a.i. of imidacloprid insecticide. The CSS and CMF used in each treatment were manually applied in furrows at planting.
Sugarcane planting was planted in a semi-mechanized way, using 14.26 Mg ha−1 of ‘RB867515’ sugarcane seedlings. As reported by Oliveira [24], this variety has good vegetative development, high production index, and high sugar concentration. The depth of the furrow for planting was approximately 0.35 m and the seedlings were positioned at the bottom of the furrow at 22 viable buds per meter. Each plot consisted of six sugarcane rows, spaced 1.50 m apart and 10 m long, totaling 90 m2 per plot and 3960 m2 of total area. The harvested area of plots consisted of the three central rows.
Soon after harvesting sugarcane in August 2020, diuron 2.4 kg ha−1 a.i. and s–metolachlor 2.2 L ha−1 a.i. were applied for weed control. Limestone and gypsum were applied again at the beginning of the third agricultural year [9]. The application of CSS and CMF took place 60 days after harvest (October 2020) of the first season. In the second ratoon (November 2021), only mineral fertilizers were applied (Table 2). Both CSS and CMF were distributed manually over the soil surface without incorporation.
Soil collections occurred 20 days after harvest for the first and second ratoon. Soil samples were collected from surface Ap1 (0–25 cm) and subsurface Ap2 (25–50 cm) horizons. In particular, six subsamples were randomly collected per plot to make a composite sample.

2.5. Soil Chemical Analyses

Soil samples were analyzed in the laboratory on air-dried ∅ < 2 mm sieved soil, following the Brazilian official procedures [22]. Soil pH was determined potentiometrically in suspensions of air-dried fine earth in a 0.01 mol L−1 CaCl2 solution with a soil–solution ratio of 1:2.5. Organic matter (OM) was determined after oxidation with K2Cr2O7 in the presence of H2SO4 and titration of excess dichromate with Fe(NH4)2(SO4)2.6H2O 0.4 mol L−1 solution. Exchangeable aluminum (Al3+) was extracted with 1.0 mol L−1 and then titrated with 0.025 mol L−1 of NaOH. Exchangeable calcium (Ca2+) and magnesium (Mg2+) were extracted by ion exchange resin and quantified by atomic absorption spectrophotometry (EAA, Model Varian SpectrAA–55B, Varian, CA, USA). Exchangeable potassium (K+) and phosphorus (P) were also extracted by resin, with K+ determined by flame photometry and P by colorimetry. Potential acidity (H+Al3+) was estimated using the pH SMP method. Sulfur was extracted by Ca(H2PO4)2 solution 0.01 mol L−1 and subsequently measuring the turbidity formed by the precipitation of sulfate and barium chloride in colorimetry. The sum of bases (SB), cation exchange capacity (CEC) at pH 7.0, and base saturation (BS) were also calculated. Copper, Fe, Mn, and Zn were assessed by DTPA extraction at pH 7.3 and determined by EAA. Soil B concentration was evaluated through extraction with barium chloride using microwave oven heating and quantified in a UV-VIS spectrophotometer (Model Varian Cary–50, Varian, Victoria, Australia) at 420 nm.

2.6. Statistical Analysis

Statistical analyses were carried out using the R software, version 4.4.1 [25]. The results were subjected to analysis of variance using the F test, and when significant, the means were grouped using the Scott–Knott test (p ≤ 0.05) for qualitative variables. Subsequently, regression analysis was performed to verify the effect of the treatments with CSS doses.

3. Results and Discussion

During the first ratoon (Table 3) a positive linear increase for Cu and Zn in response to the application of CSS doses (ranging from 0.0 to 7.5 Mg ha−1, wet basis) at a depth of 0–25 cm was observed; they ranged from 0.8 to 1.3 mg kg−1 (Cu) and 0.59 to 2.3 mg kg−1 (Zn). In addition, a positive quadratic adjustment was observed for SB, BS, CEC, and Ca in the second ratoon.
Soil K and Mg concentrations responded significantly in both crops with doses 2.6 and 7.0 Mg ha−1 of CSS respectively, showing a positive quadratic adjustment. The positive effects of CSS application on OM, CEC, and macronutrients (P, Ca, and Mg) have been reported elsewhere [26,27]. An increase in soil OM content improves soil structure and water retention while CEC allows greater availability of nutrients for plants [28]. Potassium and Mn concentrations increased with a dose of 2.2 Mg ha−1 CSS both years. The highest soil Mn concentration (7.6 mg kg−1) was found with 7.5 Mg ha−1 CSS. There was a linear increase in Cu concentration in the first ratoon while P and Zn concentration showed a quadratic adjustment and linear increase, respectively (Table 3). The highest P concentration (37.9 mg kg−1) at 0–25 cm soil depth was observed with 5.0 Mg ha−1 of CSS (Figure 4a) while the Zn concentration ranged from 0.6 to 2.3 mg kg−1 (Figure 6e).
Treatments T6 and T7 increased soil OM by 18 and 15% in the surface horizons, respectively, over the years. It was possible to observe that all soils treated with CSS significantly increased OM with a mean value of 25%; this was particularly true for the first ratoon compared to the second one (Figure 2a). In addition, OM increased with a variation between 23.2 g kg−1 and 26.3 g kg−1 in the first ratoon and between 21.7 g kg−1 and 24.9 g kg−1 in the second ratoon in the subsurface horizons both years (Figure 3a). An increase in soil OM improves overall soil environmental conditions, promoting better aggregation, increasing microbial activity, enhancing water retention, thus contributing to soil health and fertility under different CSS doses [29,30,31].
The pH values in the Ap1 surface horizons range from 5.1 to 5.8 in the first ratoon and 4.5 to 5.5 in the second one. The lowest pH values were observed in T1, T5, T8, T9–11 treatments both years. In the 0–25 cm surface horizon, T6 and T4 featured a higher pH, ranging from 5.5 to 5.8 (Figure 2b). Treatments 1 and 3 produced higher pH values of 5.2 and 5.1, respectively, while T7 (4.5) and T10 (4.6) led to the lowest values (Figure 3b). An increase in pH with CSS application (usually ranging from 10 to 40 Mg ha−1) in infertile, tropical soils, has already been reported as a consequence of SOM decomposition processes, releasing basic cations, such as Ca and Mg [15,32].
A reduction from 6 to 15% in H+Al was observed in T2, T6, and T4 surface horizons both years. Likewise, there were significant differences in H+Al values between years, with higher mean values in T3, T5, and T9 (Figure 2c) vs. a reduction of up to 5% in T3 and T11 (Figure 3c). Composted sewage sludge applied in infertile soils, increased pH while, consequently, decreasing potential acidity. Indeed, SOM decomposition in CSS accelerates the release of hydrogen ions, responsible for the potential acidity of the soil, thus reducing H+Al values in soils [33].
Significant differences in base saturation (BS) values were observed between treatments in the 0–25 cm horizons. In particular, the analysis of the two harvests revealed an interaction that generated variations in SB values, with emphasis on T2, T4, and T6 (Figure 2d). A significant influence of treatments on SB values in 25–50 cm deep soil horizons was also observed for T2 in the second ratoon (Figure 3d). It is important to highlight that the interaction in the two years of harvest had reduced SB values up to 20% in the second ratoon. This reduction seems to be related to the process of extracting exchangeable cations by plants, mainly Ca and Mg [19,34].
Similarly, there was a difference in CEC values depending on the treatments, with the higher values being observed in T4 and T6 in the surface horizons (Figure 2e). The highest CEC values were noted in T3, T4, and T8 in the subsurface horizons. In T3, T4, and T8 a CEC reduction of 1, 5, and 13% from the first ratoon to second ratoon sugarcane, respectively, was observed (Figure 3e). Plant nutrient uptake processes seemed to have reduced CEC. This effect was due to the rapid mineralization of organic matter under tropical conditions in sandy soils. Indeed, under such conditions, plants use available soil nutrients in larger amounts, to sustain growth and development [35,36].
Average BS values in the surface layer varied from 65 to 75% for the first ratoon and 53 to 75% for the second one (Figure 2f). Treatments 1, 2, 6, and 11 showed variation in BS values when compared to other treatments in the second ratoon. The lower BS values were a feature of T8 and T9 in the first ratoon cane. The CSS doses vs. BS values were adjusted to a quadratic function (Table 3). Treatment 3, T4, and T6 indicated BS may increase in the subsurface horizons (Figure 3f), implying CSS doses provided a considerable amount of exchangeable bases at this depth [37]. It is worth highlighting that levels above 70% are still considered high according to the interpretation limits established for soils in the State of São Paulo [9].
The average macronutrient concentration in the 0–25 cm deep soil horizons showed a significant difference between the two sugarcane cultivation seasons. The macronutrients ranged as follows: P = 12–34 mg kg−1; K = 0.1–0.2 cmolc kg−1; Ca = 2.1–2.8 cmolc kg−1; Mg = 0.9–1.5 cmolc kg−1 and S = 0.4–0.6 mg kg−1 in the first ratoon while P = 8–25 mg kg−1; K = 0.1–0.3 cmolc kg−1; Ca = 1.2–2.7 cmolc kg−1; Mg = 0.5–1.5 cmolc kg−1 and S = 5–8 mg kg−1 in the second ratoon (Figure 4).
After harvesting the first ratoon sugarcane, the average P levels in the surface horizons ranged from 16 to 40 mg kg−1, except for treatment 1, which ranges from 7 to 15 mg kg−1. In the second ratoon, P levels were low (7–16 mg kg−1) for treatments T1, T3–6, and T8–10, and medium (16–40 mg kg−1) for T7, T2, and T11 (Figure 4a) (interpretation limits: Cantarella et al. [9]). These results confirmed the residual effect of CSS with or without CMF; indeed, soil treated with CSS maintained favorable P levels as time went by. Previous studies also reported similar results, highlighting the efficiency of CSS in maintaining P levels in the soil. This effect can reduce phosphate fixation due to the presence of specific organic compounds featuring the sewage sludge, such as humic and fulvic acids; they can bind to P ions in the soil, making them (i) more soluble and, consequently, (ii) tremendously increasing their availability for plants [12,38].
During the first ratoon cane, the nutrient concentrations ranges were 5–17 mg kg−1 (P), 0.1–0.3 cmolc kg−1 (K), 1.0–2.0 cmolc kg−1 (Ca), 0.6–1.2 cmolc kg−1 (Mg), and 0.5–1.0 mg kg−1 (S) in 25–50 cm soil horizons. In the second ratoon, the levels varied from 6 to 17 mg kg−1 (P), 0.1–0.3 cmolc kg−1 (K), 1.0–2.1 cmolc kg−1 (Ca), 0.6–1.1 cmolc kg−1 (Mg), and 5–15 mg kg−1 (S) in 25–50 cm soil horizons (Figure 5a). Among the treatments with CSS, P concentrations, at the end of the second agricultural year, were classified as very low (T6, T9, and T11), low (T1–T3, T5, T8, and T10), and medium (T4 and T7; [9]). The low P concentration, especially in the second ratoon, may be related to the adsorption or fixation of the element in soil, making it unavailable. In addition, the low soil pH is another factor that can further reduce and even limit P availability for plant uptake. This fact occurs because soil pH plays an important role in the P availability for plants. In acidic soils, P can bind to Fe, Al, and Mn ions, becoming unavailable [39].
Potassium concentration significantly increased in T4 (26%) and T11 (20%), in the surface horizons at the end of the first ratoon (Figure 4b). The application of CMF in T11 (7.5 Mg ha−1 +100% CMF) was efficient in increasing soil K concentration. In addition, the CSS–7.5 Mg ha−1 dose increased K concentration from medium (0.2–0.3 cmolc kg−1) to high (0.3–0.6 cmolc kg−1) when compared to CMF. This effect was corroborated by the quadratic adjustment observed between CSS doses (0–7.5 Mg ha−1) (Table 3). Although CSS does not have high K concentrations, some studies have shown its potential to increase K levels in the soil due to its availability [40,41].
In the first ratoon, K concentrations were in the average range except for T2 and T3 (low), ranging between 0.07 and 0.16 cmolc kg−1. The exchangeable K levels varied between low (T1–T3 and T8), medium (T3, T5, T7, T9, and T10), and high (T4 and T11) in the second ratoon cane (Figure 5b). The combined treatment of CSS+CMF (T11) was different from the others in both harvests in the subsurface horizons, showing a 35% K reduction in the second ratoon cane. Furthermore, T6 (0.0 CSS tha−1 + CMF 50%) was featured by an increase of 31% in K concentration. This increase may be attributed to the dose of conventional mineral fertilizers since there was no CSS reapplication in the second ratoon sugarcane. Regarding the classification of K concentrations in the subsurface horizons, the treatments (T1–2, T7, and T10) were classified as low, T3–6, T8, and T9 as medium, and T11 as high in the first ratoon; after the second, T1 and T3 as low, T2–4 and T7–10 as medium (Figure 5b).
Treatments T4, T6, and T2 in the first ratoon and T2, T4, T6, and T11 in the second one showed the highest Ca concentrations in the surface horizons (Figure 4c). It seemed to be related to the presence of Ca in CSS formulation in addition to agricultural limestone used in the composting process. Due to the increase in Ca concentration among treatments as well as its stability over the years, it can be underlined that CSS can be used as a Ca supplier, including increasing soil pH (Figure 2b). It is important to highlight that none of the treatments received limestone and agricultural gypsum in the first ratoon. Therefore, the role of CSS in the efficiency of replacing this nutrient is evident.
The Ca concentrations in the subsurface horizons showed a variation of 1.0–2.0 cmolc kg−1 in the first ratoon and 1.0–2.1 cmolc kg−1 in the second one. Treatments 8 and 11 in the first ratoon and T6 in the second one, exhibited the highest Ca concentrations (Figure 5c). According to Cantarella et al. [9], Ca levels above 0.7 cmolc kg−1 are considered high, hence, all treatments evaluated in both first and second ratoon in both soil horizons showed high Ca levels. However, it is important to highlight that the increase in Ca levels in the subsurface horizons was due to the application of limestone and gypsum in agricultural management before the second ratoon. This application resulted in the dissolution of calcium sulfate, releasing sulfate and calcium ions, which facilitates their movement to the subsurface due to their high mobility in the soil environment [42,43].
The doses of 5.0 Mg ha−1 of CSS (T4), 2.5 Mg ha−1, and 5.0 Mg ha−1 + 50% CMF (T6 and T7) provided higher Mg levels in the surface horizons, showing differences between treatments and years (Figure 4d). All the treatments were classified as high in Mg concentrations (>0.8 cmolc kg−1) in both years, except T3, T8, and T11 in the first ratoon, where Mg concentrations were medium (0.5–0.8 cmolc kg−1). A direct positive relationship was observed between Mg and CSS applied doses. Furthermore, it is important to highlight that this relationship was also observed with CEC (Figure 2e), which has influenced the capacity of soils to supply Mg to plants due to the greater reserve of the nutrient retained in soil colloids [15,19]. Around 63% of treatments were classified with high Mg levels in both first and second ratoons. Therefore, it is worth highlighting that the residual effect of CSS in these treatments enabled Mg contribution to the soil.
A significant increase of 25 and 22% in S concentrations was observed in T3 and T4, respectively, throughout the experimental years, specifically in the surface soil horizons. Sulfur levels ranged from 4–6 mg kg−1 in the first ratoon to 5–8 mg kg−1 in the second ratoon (Figure 4e). Only treatments with T1 and T8 were classified with low S levels (0–4 mg kg−1) while the other treatments were featured by medium levels (5–10 mg kg−1). A significant increase in S concentration was observed between years and treatments in the subsurface horizons. Depending on the years, there was an increase of 33% for T7. Furthermore, in T6 and T7, S concentrations increased from medium (0.5–1.0 mg kg−1) on the surface, to high (>10 mg kg−1) in the subsurface horizons, showing the highest S concentration (Figure 5e). Considering the sandy soil texture of the experimental area (Table 1), it was found that S was not retained in the surface horizons, instead migrating to the subsurface once, through leaching processes. This phenomenon was favored by the high rainfall that occurred in November and December during the second experimental year (Figure S1).
The 0–25 cm deep horizons presented mean micronutrient concentrations as: B = 0.19–0.27 mg kg−1; Cu = 0.8–1.4 mg kg−1; Fe = 22–33 mg kg−1; Mn = 10–18 mg kg−1, Zn = 0.6–2.3 mg kg−1 in the first year, while B = 0.24–0.40 mg kg−1; Cu = 0.5–0.8 mg kg−1; Fe = 10–20 mg kg−1; Mn = 8–21 mg kg−1, and Zn = 0.4–0.6 mg kg−1 in the second one (Figure 6).
A significant increase in B levels in the second year in T1–T3 and T4 was observed. It must be highlighted that the highest B concentrations were observed with the 2.5–7.5 Mg ha−1 of CSS doses.
The increase in soil B concentration as a residual effect was observed in studies where 7.5 to 12.5 Mg ha−1 of CSS was applied in degraded/infertile soils [44,45]. In the subsurface horizons, all treatments were classified as low in B concentrations (0.0–0.2 mg kg−1). Differences were observed between treatments, with T2, T4, T5, and T8 showing higher B concentrations (Figure 7a). Sandy soils generally have a low B concentration, especially in the subsurface horizons; indeed, low B availability may occur due to leaching processes, justifying the B low levels in the investigated surface horizons.
The Cu concentrations in the surface horizons were considered high (>0.8 mg kg−1) in the first ratoon, with T3, T4, T7, and T10 showing greater responsiveness. All the treatments were classified as featured by medium Cu concentration (0.3–0.8 mg kg−1) except for T7 and T11 (high: > 0.8 mg kg−1) in the second ratoon (Figure 6b). In the subsurface layer, differences were observed among treatments and years, with T4 showing the highest Cu concentration (Figure 7b). There was a linear adjustment for Cu, when comparing only CSS doses (2.5–7.5 Mg ha−1), thus demonstrating that at increasing CSS doses, an increase in Cu availability in the soil environment is expected (Table 3). However, it is important to highlight that some treatments showed a reduction of 17 to 20% in Cu concentrations, after T6 (Figure 7b). This process may occur in sandy soils due to the Cu fixation when: (i) it is present in less soluble forms; thus, (ii) bringing lower retention and adsorption capacity which is responsible for lower Cu availability for plants [46,47].
Soil Fe concentrations were significantly different depending on the studied years, with the higher values observed in the first with particular emphasis on the T7 and T9–T10 treatments. Additionally, it is important to note that for all treatments in both years, Fe concentrations remained high (>12 mg kg−1) except for T8. Furthermore, Fe concentrations were medium (5–12 mg kg−1) in T9–T10 in the first year and high (>12 mg kg−1) in T6–T10 in 25–50 cm deep soil horizons (Figure 7c). Tropical soils are naturally high in Fe due to substrate nature and strongly weathering processes affecting them. This is particularly true for Oxisols, i.e., the most widespread soil order in the Brazilian territory (39%) [48] and those investigated in our study. Indeed, Fe is one of the prevalent micronutrients in its chemical composition [49,50,51].
Manganese concentrations were classified as high (>5 mg kg−1) in all treatments in the first experimental year. In the second ratoon, the residual effect of CSS doses with or without CMF allowed Mn levels to remain at high levels. These results demonstrated that the availability of Mn depends on CSS treatments, including residual effects (Table 3). Conversely, the presence of nutrients such as N and K from mineral fertilizers could also influence the absorption of Mn from the soil by plants [52,53]. The Mn concentrations in the surface and subsurface horizons showed similar behavior, where all treatments were classified as high in Mn concentrations for both harvest years, except T2 and T7 in the first ratoon and T1 and T7 in the second one, classified as low in Mn concentration (0–4 mg kg−1) (Figure 7d).
The CSS doses of 2.5 and 5.0 Mg ha−1 (T3 and T4) significantly increased soil Zn concentration, especially in the surface horizons (Figure 6e). Likewise, the application of doses of 7.5 Mg ha−1 with 50–100% of CMF increased Zn levels in the first ratoon. In the second ratoon, a residual effect of these CSS doses was also observed. It is worth mentioning that CSS has a high Zn concentration (Table 3), which makes it a relevant source of macro- and micronutrients. Oliveira et al. [45], Prates et al. [22], and Silva et al. [19], corroborate the evidence of the supply of micronutrients through the application of this organic fertilizer.
Despite the observed differences among treatments and years in the subsurface horizons, only T4 was featured by a medium Zn concentration (0.75 mg kg−1), after the first ratoon cane (Figure 7e). The other treatments were low in Zn concentration (<0.5 mg kg−1). The use of both dry and wet basis CSS with or without CMF in infertile soils cultivated with various crops, including sugarcane, has demonstrated high Zn levels, especially in the surface soil horizons [19,37,54,55].

4. Conclusions

The application of CSS with or without CMF in sugarcane-cultivated soils, improved almost all investigated soil chemical features (OM, pH, SB, CEC, and BS) and nutrient concentrations (P, K, Ca, Mg, B, Cu, and Zn) in the first and second ratoon, as well as at both investigated soil depths. The treatments showing the best performances were the T4 (5.0 Mg ha−1 of CSS) and T7 (5.0 Mg ha−1 of CSS + CMF 50%), statistically improving soil fertility and nutrient availability in the two sugarcane production cycles. Our research demonstrates that CSS has the potential for use as an organic natural fertilizer, as it can (i) reduce the need for conventional mineral fertilizer, thus (ii) meaning a strong decrease in production costs and dependence on mineral fertilizers. By promoting its application in infertile tropical soils, several other benefits can be achieved, such as respect for the principles of the circular economy, thus reducing waste production and disposal (typically featuring the linear economy) with associated human health and socio-environmental issues. Future research will focus on longer field experiments to provide additional evidence of residual effects and related benefits of CSS.

Supplementary Materials

The following supporting information can be downloaded at: https://www.mdpi.com/article/10.3390/land13111820/s1, Figure S1: Monthly rainfall, relative humidity, mean, maximum (max.), and minimum (min.) temperatures recorded during cultivation of sugarcane crops (weather station: School of Engineering, São Paulo State University, Ilha Solteira, SP); Table S1. Chemical and microbiological composition of sewage sludge composite samples (Mean ± SD; n = 3).

Author Contributions

Conceptualization, M.C.M.T.F. and T.A.R.N.; methodology, R.d.S.S., R.S.A., N.C.E. and R.E.N.d.N.; software, N.C.E. and R.E.N.d.N.; validation, A.J., C.H.A.-J., G.F.C. and T.A.R.N.; formal analysis, R.d.S.S., R.S.A., G.F.C. and T.A.R.N.; investigation, R.d.S.S., R.S.A., N.C.E. and R.E.N.d.N.; resources, T.A.R.N.; data curation, R.d.S.S., R.S.A., A.D.J., G.F.C. and T.A.R.N.; writing—original draft preparation, R.d.S.S., A.J., A.D.J., G.F.C. and T.A.R.N.; writing—review and editing, A.D.J., G.F.C. and T.A.R.N.; visualization, R.d.S.S., R.S.A., G.F.C. and T.A.R.N.; supervision, T.A.R.N.; project administration, T.A.R.N.; funding acquisition, T.A.R.N. All authors have read and agreed to the published version of the manuscript.

Funding

The research was co-financed by the Usina Vale do Paraná S/A—Álcool e Açúcar. This study was financed in part by the Ilha Solteira Education, Research and Extension Foundation (FEPISA), project No. 2001/2020.

Data Availability Statement

Data will be available on request (last author).

Acknowledgments

We thank the GENAFERT (Study Group on Nutrition, Fertilization, and Soil Fertility) and Usina Vale do Paraná S/A—Álcool e Açúcar, for technical support. We would also like to thank Tera Ambiental Ltd.a for supplying the organic fertilizer. Thiago Nogueira also thanks The National Council for Scientific and Technological Development (CNPq) for the fellowship (grant number 308374/2021-5).

Conflicts of Interest

The authors declare no conflicts of interest. The funders had no role in the design of the study; in the collection, analyses, or interpretation of data; in the writing of the manuscript; or in the decision to publish the results.

References

  1. Dias, A.S.; Santos, C.C. Maximizando a produção de canaviais brasileiros: Uma abordagem prática para implantação e manejo nutricional. Manejo fisiológico e nutricional de plantas: Abordagens práticas na agricultura 1. Ed. Cient. Digit. 2023, 1, 29–61. [Google Scholar] [CrossRef]
  2. Filho, C.H.A.M.; Sousa, R.S.; Neto, F.A.; Silva, V.B.; Diniz, Y.B.; Júnior, G.M.C.; Nascimento, F.N.; Silva, R.R.C.; Sousa, G.L. Avaliação de clones de cana-de-açúcar para produção de biomassa de qualidade na região canavieira do Piauí. Peer Rev. 2023, 5, 188–204. [Google Scholar] [CrossRef]
  3. CONAB; National Supply Company. Acompanhamento da Safra Brasileira de Cana-de-Açúcar; CONAB: Brasilia, Brazil, 2024. Available online: https://www.conab.gov.br/info-agro/safras/cana/boletim-da-safra-de-cana-de-acucar/item/download/50386_66eb66936a5d73a592e5fb25bc9cb71b (accessed on 12 June 2024).
  4. Cherubin, M.R.; Carvalho, J.L.N.; Cerri, C.E.P.; Nogueira, L.A.H.; Souza, G.M.; Cantarella, H. Land Use and Management Effects on Sustainable Sugarcane-Derived Bioenergy. Land 2021, 10, 72. [Google Scholar] [CrossRef]
  5. IBGE—Brazilian Institute of Geography and Statistics. Produto Interno Bruto; PIB: New Delhi, India, 2022. Available online: https://agenciadenoticias.ibge.gov.br/agencia-sala-de-imprensa/2013-agencia-de-noticias/releases/38284-release-contas-nacionais#:~:text=Destaques,e%20a%20Agropecu%C3%A1ria%20ficou%20est%C3%A1vel (accessed on 12 June 2024).
  6. Zhao, Y.; Cao, J.; Wang, Z.; Liu, L.; Yan, M.; Zhong, N.; Zhao, P. Enhancing sugarcane growth and improving soil quality by using a network-structured fertilizer synergist. Sustainability 2023, 15, 1428. [Google Scholar] [CrossRef]
  7. Pang, Z.; Huang, J.; Fallah, N.; Lin, W.; Yuan, Z.; Hu, C. Combining N fertilization with biochar affects root-shoot growth, rhizosphere soil properties and bacterial communities under sugarcane monocropping. Ind. Crops Prod. 2022, 182, 114899. [Google Scholar] [CrossRef]
  8. McCray, J.M.; Rice, M. Nutritional Requirements and Fertilizer Recommendations for Florida Sugarcane; SS-AGR-228/SC028, rev. 1/2023; EDIS: Gainesville, FL, USA, 2023; Available online: https://edis.ifas.ufl.edu/publication/SC028 (accessed on 12 June 2024).
  9. Cantarella, H.; Quaggio, J.A.; Junior, D.M.; Boareto, R.M.; Raij, B.V. Boletim 100: Recomendações de Adubação e Clagem Para o Estado de São Paulo; Instituto Agronômico de Campinas: Campinas, Brazil, 2022.
  10. Vasconcellos, G.; Lopes, E.C.; Scheuer, L. Informational Flow of Logistics Processes: Study on the process of fertilizer importation to Brazil. Int. J. Innov. Educ. Res. 2019, 7, 123–132. [Google Scholar] [CrossRef]
  11. Carpanez, T.G.; Moreira, V.R.; Assis, I.R.; Amaral, M.C.S. Sugarcane vinasse as organo-mineral fertilizers feedstock: Opportunities and environmental risks. Sci. Total Environ. 2022, 832, 154998. [Google Scholar] [CrossRef]
  12. Souza, A.A.B.; Silva, W.R.; Nascimento, C.W.A.; Silva, Y.J.A.B.; Biondi, C.M. Residual effects of alkalized sewage sludge application on soil quality and sugarcane yield. Arch. Agron. Soil Sci. 2022, 69, 1705–1717. [Google Scholar] [CrossRef]
  13. CONAMA—National Environmental Council. Resolução N°498. Ministério do Meio Ambiente e Mudança do Clima; CONAMA: Brazilia, Brazil, 2020. Available online: https://conama.mma.gov.br/index.php?option=com_sisconama&task=arquivo.download&id=797 (accessed on 17 June 2024).
  14. MAPA—Ministry of Agriculture, Livestock and Supply. Normative Instruction SDA No 61 DE 08/07/2020; MAPA: Brazilia, Brazil, 2020. Available online: https://www.legisweb.com.br/legislacao/?id=398558. (accessed on 17 June 2024).
  15. Prates, A.R.; Coscione, A.R.; Filho, M.C.M.T.; Miranda, B.G.; Arf, O.; Abreu-Junior, C.H.; Oliveira, F.C.; Moreira, A.; Galindo, F.S.; Sartori, M.M.P.; et al. Composted sewage sludge enhances soybean production and agronomic performance in naturally infertile soils (Cerrado Region, Brazil). Agronomy 2020, 10, 1677. [Google Scholar] [CrossRef]
  16. Dar, Z.A.; Bhat, J.I.A.; Qazi, G.; Ganie, S.A.; Amin, A.; Farooq, S.; Nazir, A.; Rasool, A. Municipal sewage sludge, aquatic weed compost on soil enzymatic activity and heavy metal accumulation in Kale (Brassica oleracea L.). Appl. Water Sci. 2023, 13, 60. [Google Scholar] [CrossRef]
  17. Feng, J.; Yang, Y.; Ruan, K.; Wu, D.; Xu, Y.; Jacobs, D.F.; Zeng, S. Combined application of sewage sludge, bagasse, and molybdenum tailings ameliorates rare earth mining wasteland soil. J. Soils Sediments 2023, 23, 1775–1788. [Google Scholar] [CrossRef]
  18. Kazimierowicz, J.; Dębowski, M. Characteristics of solidified carbon dioxide and perspectives for its sustainable application in sewage sludge management. Int. J. Mol. Sci. 2023, 24, 2324. [Google Scholar] [CrossRef]
  19. Silva, R.S.; Jalal, A.; Nascimento, R.E.N.; Elias, N.C.; Kawakami, K.C.; Abreu-Junior, C.H.; Oliveira, F.C.; Jani, A.D.; Ele, Z.; Zhao, F.; et al. Composted sewage sludge application reduces mineral fertilization requirements and improves soil fertility in sugarcane seedling nurseries. Sustainability 2022, 14, 4684. [Google Scholar] [CrossRef]
  20. Köppen, W.; Geiger, R. Klimate der Erde; Justus Perthes: Gotha, Germany, 1928. [Google Scholar]
  21. Soil Survey Staff. Keys to Soil Taxonomy, 12th ed.; Natural Resources Conservation Service: Washington, DC, USA, 2014.
  22. Raij, B.V.; Andrade, J.C.; Cantarella, H.; Quaggio, J.A. Análise Química Para Avaliação da Fertilidade de Solos Tropicais; Instituto Agronômico: Campinas, Brazil, 2001.
  23. CONAMA—National Environmental Council. Resolução N° 375. Ministério do Meio Ambiente e Mudança do Clima; CONAMA: Brazilia, Brazil, 2006. Available online: https://conama.mma.gov.br/?option=com_sisconama&task=arquivo.download&id=797 (accessed on 17 June 2024).
  24. Oliveira, R.A.; Hoffmann, H.P.; Barbosa, G.V.S. Liberação Nacional de Variedades RB de Cana-de-Açúcar; RIDESA: Cutitiba, Brazil, 2021.
  25. R Core Team. A Language and Environment for Statistical Computing; R Foundation for Statistical Computing: Vienna, Austria, 2023. [Google Scholar]
  26. Balaganesh, P.; Vasudevan, M.; Suneethkumar, S.M.; Shahir, S.; Natarajan, N. Evaluation of sugarcane and soil quality amended by sewage sludge derived compost and chemical fertilizer. Nat. Environ. Pollut. Technol. 2020, 19, 1737–1741. [Google Scholar] [CrossRef]
  27. Delibacak, S.; Voronina, L.; Morachevskaya, E. Use of sewage sludge in agricultural soils: Useful or harmful. Eurasian J. Soil Sci. 2020, 9, 126–139. [Google Scholar] [CrossRef]
  28. Gonçalves, C.A.; Camargo, R.; Sousa, R.T.X.; Soares, N.S.; Oliveira, R.C.; Stanger, M.C.; Lana, R.M.Q.; Lemes, E.M. Chemical and technological attributes of sugarcane as functions of organomineral fertilizer based on filter cake or sewage sludge as organic matter sources. PLoS ONE 2021, 16, e0236852. [Google Scholar] [CrossRef]
  29. Börjesson, G.; Kätterer, T. Soil fertility effects of repeated application of sewage sludge in two 30-year-old field experiments. Nutr. Cycl. Agroecosyst. 2018, 112, 369–385. [Google Scholar] [CrossRef]
  30. Curci, M.; Lavecchia, A.; Cucci, G.; Lacolla, G.; Corato, U.; Crecchio, C. Short-term effects of sewage sludge compost amendment on semiarid soil. Soil Syst. 2020, 4, 48. [Google Scholar] [CrossRef]
  31. Farsang, A.; Babcsányi, I.; Ladányi, Z.; Perei, K.; Bodor, A.; Csányi, K.T.; Barta, K. Evaluating the effects of sewage sludge compost applications on the microbial activity, the nutrient and heavy metal concentration of a Chernozem soil in a field survey. Arab. J. Geosci. 2020, 13, 982. [Google Scholar] [CrossRef]
  32. Silva, W.R.; Nascimento, C.W.A.; Silva, F.B.V.; Souza, A.A.B.; Fracetto, G.G.M.; Ximenes, D.H.S.V. Effects of sewage sludge stabilization processes on soil fertility, mineral composition, and grain yield of maize in successive cropping. J. Soil Sci. Plant Nutr. 2021, 21, 1076–1088. [Google Scholar] [CrossRef]
  33. Titova, J.; Baltrėnaitė, E. Physical and chemical properties of biochar produced from sewage sludge compost and plants biomass, fertilized with that compost, important for soil improvement. Waste Biomass Valorization 2021, 12, 3781–3800. [Google Scholar] [CrossRef]
  34. Wanderley, L.R.S.; Oliveira, E.C.A.; Freire, F.J.; Neto, D.E.S.; Santos, R.L. Nutritional requirement by irrigated Brazilian sugarcane varieties. SugarTech 2021, 23, 762–775. [Google Scholar] [CrossRef]
  35. Masmoudi, S.; Magdich, S.; Rigane, H.; Medhioub, K.; Rebai, A.; Ammar, E. Effects of compost and manure application rate on the soil physico-chemical layers properties and plant productivity. Waste Biomass Valorization 2020, 11, 1883–1894. [Google Scholar] [CrossRef]
  36. Oueriemmi, H.; Kidd, P.S.; Trasar-Cepeda, C.; Rodríguez-Garrido, B.; Zoghlami, R.I.; Ardhaoui, K.; Prieto-Fernández, Á.; Moussa, M. Evaluation of composted organic wastes and farmyard manure for improving fertility of poor sandy soils in arid regions. Agriculture 2021, 11, 415. [Google Scholar] [CrossRef]
  37. Cardoso, P.H.S.; Gonçalves, P.W.B.; Alves, G.O.; Pegoraro, R.F.; Fernandes, L.A.; Frazão, L.A.; Sampaio, R.A. Improving the quality of organic compost of sewage sludge using grass cultivation followed by composting. J. Environ. Manag. 2022, 314, 115076. [Google Scholar] [CrossRef]
  38. Alves, B.; Queiroz, S.; Zelaya, K.P.S.; Colen, F.; Frazão, L.A.; Parikh, A.N.; Sanjai, J.; Fernandes, L.A. Effect of sewage sludge and sugarcane bagasse biochar on soil properties and sugar beet production. Pedosphere 2021, 31, 572–582. [Google Scholar] [CrossRef]
  39. Filipović, V.; Černe, M.; Šimůnek, J.; Filipović, L.; Romić, M.; Ondrašek, G.; Bogunović, I.; Mustac, I.; Krevh, V.; Ferencevic, A.; et al. Modeling water flow and phosphorus sorption in a soil amended with sewage sludge and olive pomace as compost or biochar. Agronomy 2020, 10, 1163. [Google Scholar] [CrossRef]
  40. Samsudin, M.H.; Yusoff, M.Z.M.; Hassan, M.A.; Zakaria, M.R.; Roslan, A.M.; Salamat, S.S.; Hasan, M.Y.; Zainudin, M.H.M.; Farid, M.A.A.; Shirai, Y. Assessment of pilot-scale sewage sludge pelletization for non-food crop fertilization: Nutrient content, pathogenicity, and growth performance. Environ. Monit. Assess. 2024, 196, 807. [Google Scholar] [CrossRef]
  41. Dridi, N.; Romdhane, L.; Ferreira, R.; Sleimi, N. Fertilizer effect of composted sewage sludge and cattle manure on Pelargonium growth. J. Water Sanit. Hyg. Dev. 2020, 10, 1019–1025. [Google Scholar] [CrossRef]
  42. Luiz, M.S.; Junior, L.A.Z.; Ribeiro, M.R.; Matos, M.A.; Andrade, D.S. Residual effects of agricultural gypsum on soil chemical and microbiological characteristics. Soil Use Manag. 2022, 38, 1656–1666. [Google Scholar] [CrossRef]
  43. Oliveira, I.N.; Souza, Z.M.; Bolonhezi, D.; Totti, M.C.V.; Moraes, M.T.; Lovera, L.H.; Lima, E.S.; Esteban, D.A.A.; Oliveira, C.F. Tillage systems impact on soil physical attributes, sugarcane yield and root system propagated by pre-sprouted seedlings. Soil Tillage Res. 2022, 223, 105460. [Google Scholar] [CrossRef]
  44. Prates, A.R.; Kawakami, K.C.; Coscione, A.R.; Filho, M.C.M.T.; Arf, O.; Abreu-Junior, C.H.; Oliveira, F.C.; Moreira, A.; Galindo, F.S.; Ele, Z.; et al. Composted sewage sludge sustains high maize productivity on an infertile Oxisol in the Brazilian Cerrado. Land 2022, 11, 1246. [Google Scholar] [CrossRef]
  45. Oliveira, G.S.; Jalal, A.; Prates, A.R.; Filho, M.C.M.T.; Alves, R.S.; Silva, L.C.; Nascimento, R.E.N.; Silva, P.S.T.; Arf, O.; Galindo, F.S.; et al. Common bean productivity and micronutrients in the soil-plant system under residual applications of composted sewage sludge. Plants 2023, 12, 2153. [Google Scholar] [CrossRef]
  46. Kuziemska, B.; Trębicka, J.; Wysokinski, A. Uptake and utilization of nitrogen from organic fertilizers influenced by different doses of copper. Agronomy 2021, 11, 1219. [Google Scholar] [CrossRef]
  47. Rangel, T.S.; Santana, N.A.; Jacques, R.J.S.; Ramos, R.F.; Koppe, D.L.S.; Tabaldi, E.L.A.; Silveira, A.O. Organic fertilization and mycorrhization increase copper phytoremediation by Canavalia ensiformis in a sandy soil. Environ. Sci. Pollut. Res. 2023, 30, 68271–68289. [Google Scholar] [CrossRef] [PubMed]
  48. IBGE—Brazilian Institute of Geography and Statistics. Mapa de Solos do Brasil; IBGE: Brazilia, Brazil, 2001. Available online: https://geoftp.ibge.gov.br/informacoes_ambientais/pedologia/mapas/brasil/solos.pdf (accessed on 17 June 2024).
  49. Karlsson, T.; Persson, P.; Skyllberg, U.; Morth, C.; Giesler, R. Characterization of iron(III) in organic soils using extended X-ray absorption fine structure spectroscopy. Environ. Sci. Technol. 2008, 42, 5449–5454. [Google Scholar] [CrossRef]
  50. Silva, L.S.; Júnior, J.M.; Barrón, V.; Gomes, R.P.; Teixeira, D.B.; Siqueira, D.S.; Vasconcelos, V. Spatial variability of iron oxides in soils from Brazilian sandstone and basalt. CATENA 2020, 185, 104258. [Google Scholar] [CrossRef]
  51. Cantão, L.C.; Júnior, I.G.S.; Silva, L.S.; Júnior, J.M.; Costa, A.C.S. Identification and quantification of iron oxides by diffuse reflectance spectroscopy with Praying Mantis accessory and integration sphere. CATENA 2021, 196, 104899. [Google Scholar] [CrossRef]
  52. Vasconcelos, R.L.; Cremasco, C.P.; Almeida, H.J.; Garcia, A.; Neto, A.B.; Mauad, M.F.; Almeida, G.L.R. Multivariate behavior of irrigated sugarcane with phosphate fertilizer and filter cake management: Nutritional state, biometry, and agroindustrial performance. J. Soil Sci. Plant Nutr. 2020, 20, 1625–1636. [Google Scholar] [CrossRef]
  53. Vijayakumar, M.; Thirunavukkarasu, M.; Dhanasekara, R.; Ian, P. Enhancement of sugarcane productivity through stcr based balanced fertilization. Int. J. Curr. Microbiol. Appl. Sci. 2020, 9, 3433–3449. [Google Scholar] [CrossRef]
  54. Sharma, S.; Dhaliwal, S.S. Effect of sewage sludge and rice straw compost on yield, micronutrient availability and soil quality under rice-wheat system. Commun. Soil Sci. Plant Anal. 2019, 50, 1943–1954. [Google Scholar] [CrossRef]
  55. Phung, L.D.; Ichikawa, M.; Pham, D.V.; Sasaki, A.; Watanabe, T. High yield of protein-rich forage rice achieved by soil amendment with composted sewage sludge and topdressing with treated wastewater. Sci. Rep. 2020, 10, 10155. [Google Scholar] [CrossRef] [PubMed]
Figure 1. Location of the experimental area (municipality of Suzanápolis, São Paulo, Brazil) and a schematic representation of a single plot with the individuation of the “useful area” for soil and plant data collection.
Land 13 01820 g001
Figure 2. Organic matter—OM (a), active acidity—pH (b), potential acidity—H+Al (c), sum of bases—SB (d), cation exchange capacity—CEC (e), and bases saturation—BS (f) in soil samples collected after sugarcane cultivation, in 0–25 cm soil horizon (Ap1), depending on treatments and years. First ratoon: T1 = control (no CSS and CMF application); T2 = 100% of the CMF recommended dose; T3 = 2.5 Mg ha−1 of CSS; T4 = 5.0 Mg ha−1 of CSS; T5 = 7.5 Mg ha−1 of CSS; T6 = 2.5 Mg ha−1 of CSS + 50% of CMF; T7 = 5.0 Mg ha−1 of CSS + 50% of CMF; T8 = 7.5 Mg ha−1 of CSS + 50% of CMF; T9 = 2.5 Mg ha−1 of CSS + 100% of CMF; T10 = 5.0 Mg ha−1 of CSS + 100% of CMF; T11 = 7.5 Mg ha−1 of CSS + 100% of CMF. Second ratoon: T1 = control (no CSS and CMF application); T2 = 100% of the CMF recommended for dose; T3 = Residual of (R) 2.5 Mg ha−1 of CSS; T4 = R 5.0 Mg ha−1 of CSS; T5 = R 7.5 Mg ha−1 of CSS; T6 = R 2.5 Mg ha−1 of CSS + 50% of CMF; T7 = R 5.0 Mg ha−1 of CSS + 50% of CMF; T8 = R 7.5 Mg ha−1 of CSS + 50% of CMF; T9 = R 2.5 Mg ha−1 of CSS + 100% of CMF; T10 = R 5.0 Mg ha−1 of CSS + 100% of CMF; T11 = R 7.5 Mg ha−1 of CSS + 100% of CMF. Means followed by the same letter (uppercase for treatments and lowercase for the year) do not differ from each other using the Scott–Knott test at 5% probability (mean ± SE, n = 4). The horizontal lines on the bars represent the limits of interpretation established by Cantarella et al. [9] for soils from the State of São Paulo, Brazil.
Land 13 01820 g002
Figure 3. Organic matter—OM (a), active acidity—pH (b), potential acidity—H+Al (c), sum of bases—SB (d), cation exchange capacity—CTC (e) and base saturation of–BS (f) in soil samples collected after sugarcane cultivation, in 25–50 cm soil horizon (Ap2), depending on treatments and years. For treatments, ratoon years, and statistics see legend in Figure 2.
Land 13 01820 g003
Figure 4. Phosphorus (P) (a), potassium (K) (b), calcium (Ca) (c), magnesium (Mg) (d), and sulfur (S) (e) concentrations in soil samples collected after sugarcane cultivation, in layers 0–25 cm soil horizon, depending on treatments and years. For treatments, ratoon years, and statistics see legend in Figure 2.
Land 13 01820 g004
Figure 5. Phosphorus (P) (a), potassium (K) (b), calcium (Ca) (c), magnesium (Mg) (d), and sulfur (S) (e) concentrations in soil samples collected after sugarcane cultivation, in layers 25–50 cm soil horizon, depending on treatments and years. For treatments, ratoon years, and statistics see legend in Figure 2.
Land 13 01820 g005
Figure 6. Boron (B) (a), copper (Cu) (b), iron (Fe) (c), manganese (Mn) (d), and zinc (Zn) (e) concentrations in soil samples collected after sugarcane cultivation, in layers 0–25 cm soil horizon, depending on treatments and years. For treatments, ratoon years, and statistics see legend in Figure 2.
Land 13 01820 g006
Figure 7. Boron (B) (a), copper (Cu) (b), iron (Fe) (c), manganese (Mn) (d), and zinc (Zn) (e) concentrations in soil samples collected after sugarcane cultivation, in layers 25–50 cm soil horizon, depending on treatments and years. For treatments, ratoon years, and statistics see legend in Figure 2.
Land 13 01820 g007
Table 1. Soil physical–chemical [22] features (mean ± SD; n = 3).
Soil HorizonpH
(CaCl2)
OM 1PK+Ca2+Mg2+Al3+H+AlSB 2CEC 3
cm g kg−1mg kg−1------------------------- cmolc kg−1 -------------------------
0–255.2 ± 0.112.7 ± 1.51.3 ± 0.50.1 ± 0.01.5 ± 0.50.8 ± 0.00.1 ± 0.11.6 ± 0.22.5 ± 0.64.2 ± 0.4
25–505.1 ± 0.112.0 ± 0.82.7 ± 1.70.1 ± 0.01.7 ± 0.51.1 ± 0.00.2 ± 0.11.6 ± 0.12.9 ± 0.54.5 ± 0.5
Soil horizonBS 4S–SO4BCuFeMnZnSandSiltClay
cm%------------------------- mg kg−1 ------------------------------------ % -----------
0–2560.0 ± 7.82.0 ± 0.00.20 ± 0.01.1 ± 0.113.3 ± 17.412.4 ± 3.00.6 ± 0.078 ± 09 ± 013 ± 0
25–5064.0 ± 5.72.3 ± 0.40.10 ± 0.01.3 ± 0.116.0 ± 21.27.9 ± 1.80.2 ± 0.175 ± 011 ± 014 ± 0
1 Soil organic matter. 2 Sum of bases. 3 Cation–exchange capacity. 4 Base saturation.
Table 2. Composition of treatments studied in the present research.
Treatments2019/202020/212021/22
Cane PlantFirst RatoonSecond Ratoon
T1CSS 1 0.0 Mg ha−1 and CMF 0%CSS 0.0 Mg ha−1 and CMF 0%CSS 0.0 Mg ha−1 and CMF 0%
T2100% CMF 2100% CMF 3100% CMF 3
T3CSS 2.5 Mg ha−1CSS 2.5 Mg ha−1
T4CSS 5.0 Mg ha−1CSS 5.0 Mg ha−1
T5CSS 7.5 Mg ha−1CSS 7.5 Mg ha−1
T6CSS 2.5 Mg ha−1 + CMF 50%CSS 2.5 Mg ha−1 + CMF 50%CMF 50%
T7CSS 5.0 Mg ha−1 + CMF 50%CSS 5.0 Mg ha−1 + CMF 50%CMF 50%
T8CSS 7.5 Mg ha−1 + CMF 50%CSS 7.5 Mg ha−1 + CMF 50%CMF 50%
T9CSS 2.5 Mg ha−1 + CMF 100%CSS 2.5 Mg ha−1 + CMF 100%CMF 100%
T10CSS 5.0 Mg ha−1 + CMF 100%CSS 5.0 Mg ha−1 + CMF 100%CMF 100%
T11CSS 7.5 Mg ha−1 + CMF 100%CSS 7.5 Mg ha−1 + CMF 100%CMF 100%
1 Composted sewage sludge (doses in wet basis). 2 Conventional mineral fertilizer (CMF) with NPK (06–30–24, i.e., 33 kg ha−1 of N, 165 kg ha−1 of P2O5, and 132 kg ha−1 of K2O). 3 CMF NPK (20–00–20, i.e., 90 kg ha−1 of N and 90 kg ha−1 of K2O. 3 CMF NPK (20–00–20, i.e., 75 kg ha−1 of N and 75 kg ha−1 of K2O).
Table 3. Regression analysis of soil chemical properties of samples collected in the 0–25 and 25–50 cm depth layers, after harvesting the first and second ratoon sugarcane, in response to CSS doses (0.0; 2.5; 5.0, and 7.5 Mg ha−1, wet basis) applied.
PropertiesFirst Ratoon (2020/21)Second Ratoon (2021/22)
EquationsR2FEquationsR2F
Ap1 horizon; Depth 025 cm
SOM 1ŷ = 24.16nsŷ = 23.98ns
pHŷ = 5.180 + 0.052xnsŷ = 5.24ns
H+Alŷ = 14.606 + 0.101xnsŷ = 15.00 ns
SB 2ŷ = 37.407 − 0.206xnsŷ= 40.351 − 3.740x + 0.471x20.249.64 *
BS 3ŷ = 72.371 + 0.130xnsŷ = 73.394 − 4.155x + 0.422x20.257.18 *
CEC 4ŷ = 52.014 − 0.105xnsŷ = 55.357 − 4.116x + 0.534x20.7810.47 *
Pŷ = 21.50nsŷ = 12.840 + 3.009x − 0.457x20.569.52 **
Kŷ = 1.772 − 0.213x + 0.039x20.9115.12 **ŷ= 1.156 − 0.076x + 0.042x20.9717.50 **
Caŷ = 24.254 − 0.315xnsŷ = 25.859 − 2.240x + 0.256x20.228.43 *
Mgŷ = 9.958 + 0.583x0.626.65 *ŷ = 15.767 − 2.893x + 0.293x20.548.42 *
Sŷ = 5.885 + 0.125xnsŷ = 5.96ns
Bŷ = 0.306 + 0.002xnsŷ = 0.32ns
Cuŷ = 0.759 + 0.063x 0.9037.51 **ŷ = 0.73ns
Feŷ = 21.196 + 0.007xnsŷ = 22.50ns
Mnŷ= 13.146 − 0.460xnsŷ = 13.12 ns
Znŷ = 0.621 + 0.189x 0.9351.67 **ŷ = 0.500 − 0.006xns
Ap2 horizon; Depth 2550 cm
OMŷ = 17.05nsŷ = 21.08ns
pHŷ = 4.948 − 0.010xnsŷ = 4.93ns
H+Alŷ = 17.387 + 0.170xnsŷ = 18.12ns
SBŷ = 26.028 + 0.372xnsŷ = 27.78ns
BSŷ = 59.250 − 0.002xnsŷ = 59.80ns
CECŷ = 43.416 + 0.542xnsŷ = 45.84ns
Pŷ = 8.56nsŷ = 8.536 + 2.987x − 0.413x20.519.05 *
Kŷ = 1.192 + 0.102x0.79 10.96 **ŷ = 3.187 − 0.893x + 0.114x20.9469.4 **
Caŷ = 15.952 + 0.097xnsŷ = 16.60ns
Mgŷ = 8.246 + 0.239xnsŷ = 8.30ns
Sŷ = 9.443 + 0.053xnsŷ=8.56ns
Bŷ = 0.078 + 0.003xnsŷ = 0.08ns
Cuŷ = 0.297 + 0.0153x0.85 19.24 **ŷ = 0.31ns
Feŷ = 17.667 − 0.322xnsŷ = 17.14ns
Mnŷ = 6.911 − 0.383xnsŷ= 8.326 − 2.081x + 0.226x20.9912.14 **
Znŷ = 0.26nsŷ = 0.285 − 0.031x 0.8625.82 **
*, ** and ns = significant at p ≤ 0.05, p ≤ 0.01, and not significant, respectively. 1 Soil organic matter. 2 Cation exchange capacity. 3 Sum of bases. 4 Base saturation.
Disclaimer/Publisher’s Note: The statements, opinions and data contained in all publications are solely those of the individual author(s) and contributor(s) and not of MDPI and/or the editor(s). MDPI and/or the editor(s) disclaim responsibility for any injury to people or property resulting from any ideas, methods, instructions or products referred to in the content.

