
Modeling the Effect of Greenways’ Multilevel Visual Characteristics on Thermal Perception in Summer Based on Bayesian Network and Computer Vision


Abstract
1. Introduction
2. Literature Review
2.1. Visual Perception
2.2. Thermal Perception
Factors Influencing Thermal Perception
2.3. Visual and Thermal Perception
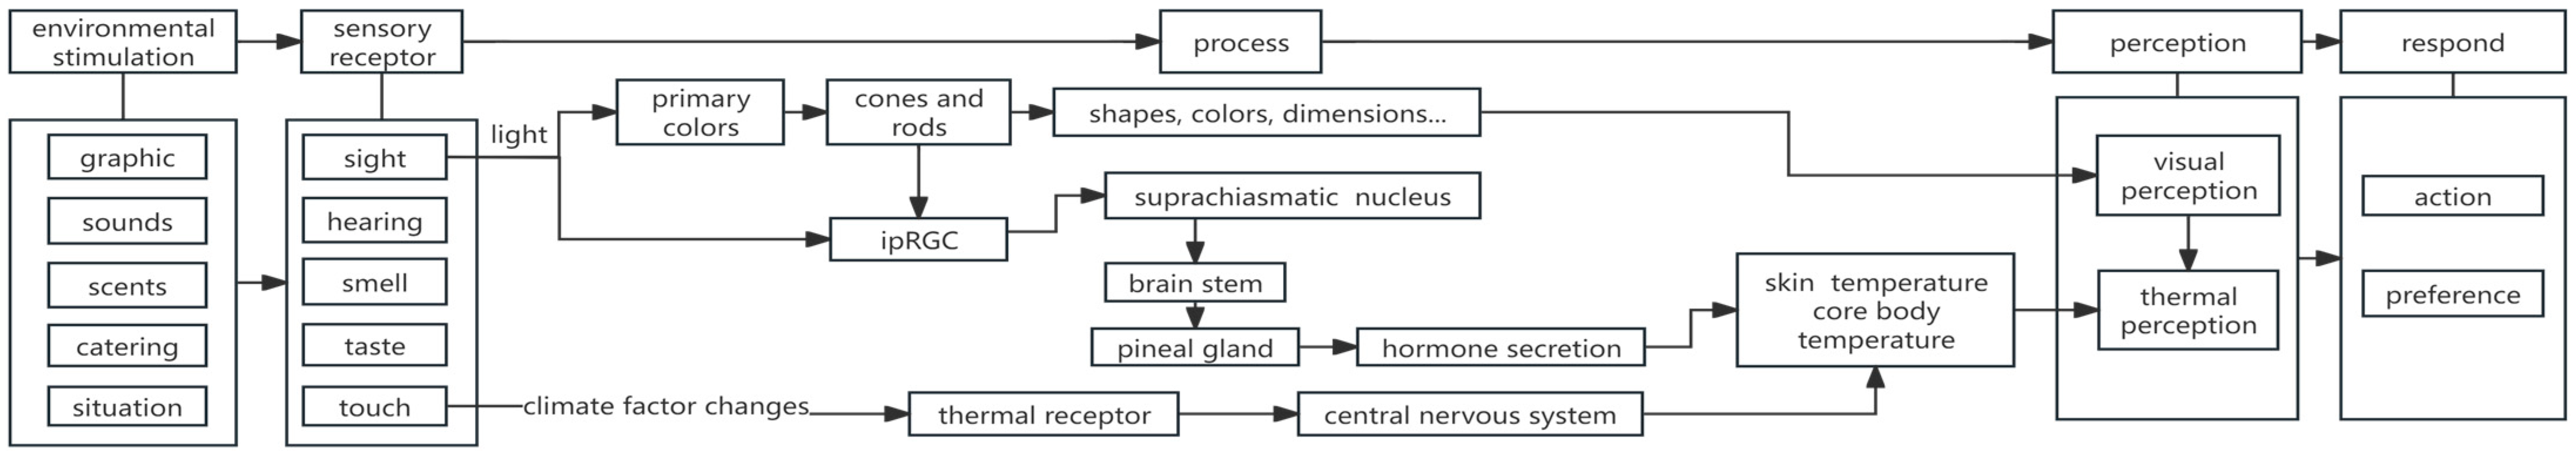
2.3.1. Pathways for the Formation of Thermal Perception with Visual Stimuli
2.3.2. The Influence of Visual Characteristics on Thermal Perception
2.4. Methods for Assessing Thermal Perception with Visual Stimuli
2.5. Research Questions and Objectives
- What visual physical characteristics affect thermal perception?
- What visual perceptual characteristics influence thermal perception?
- What are the pathways of influence of multilevel visual characteristics on thermal perception?
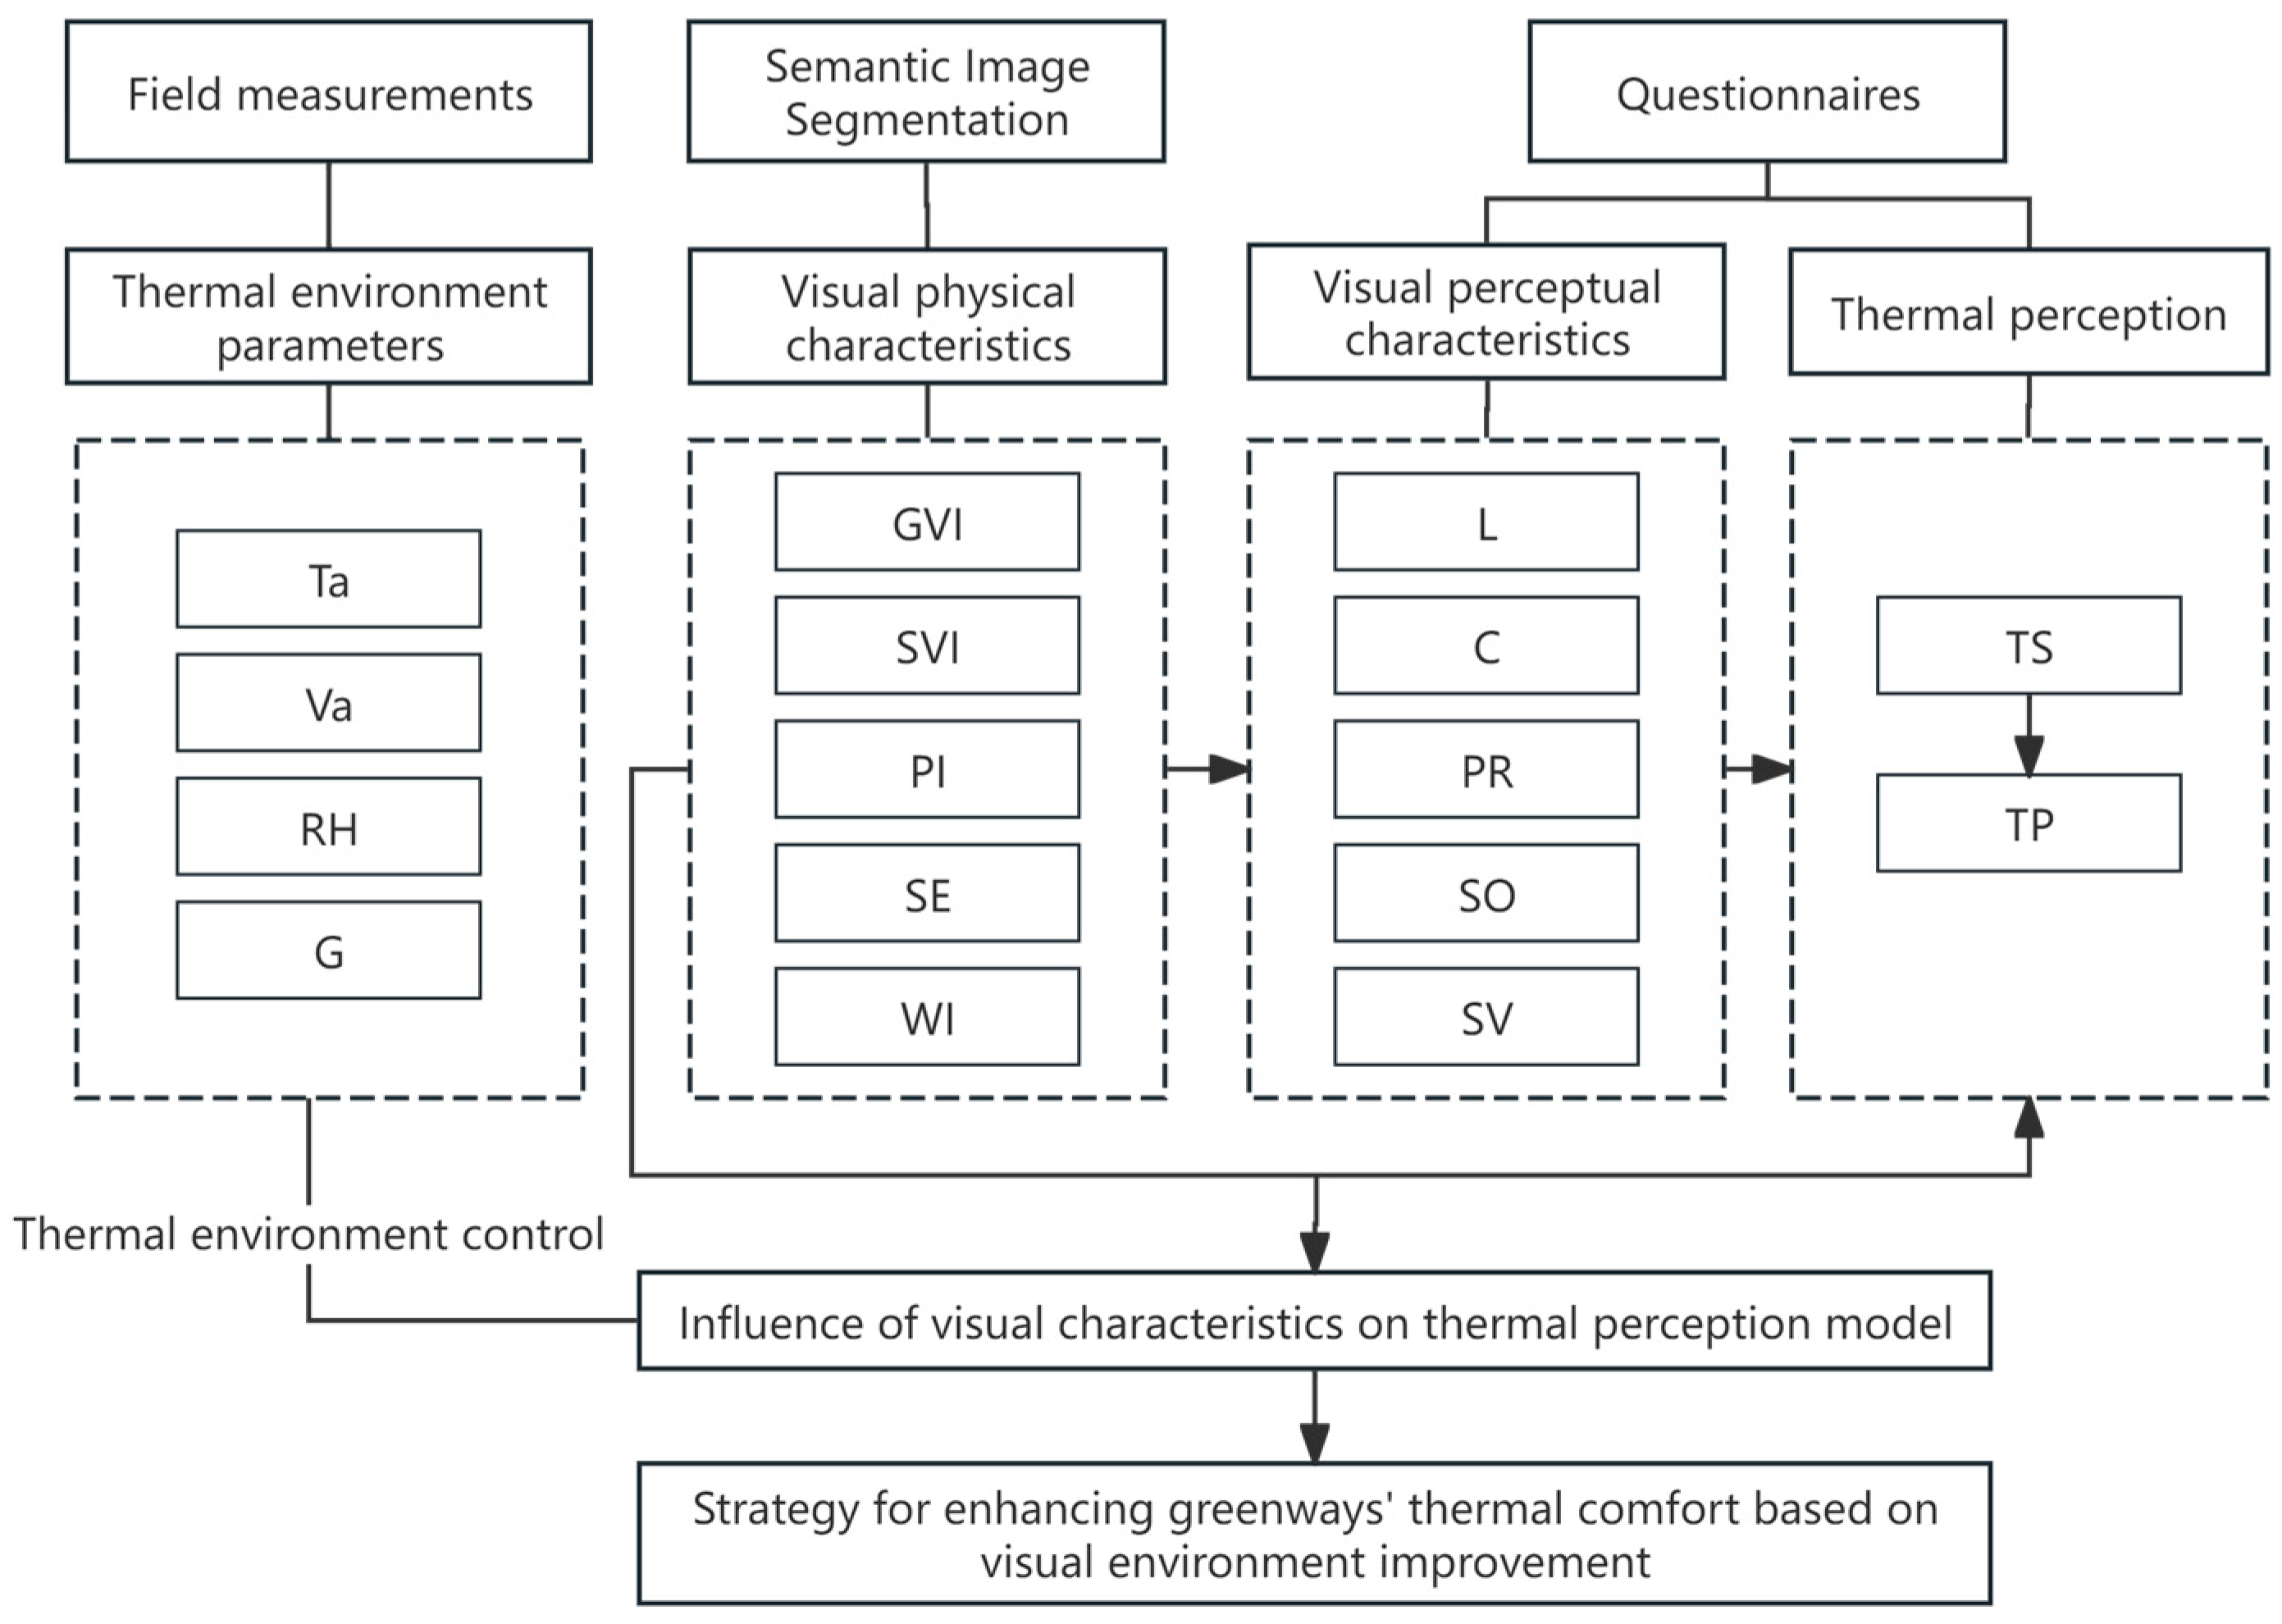
3. Materials and Methods
3.1. Overview of the Study Area
Field Measurements
3.2. Variables and Measurement
3.2.1. Visual Physical Characteristics
3.2.2. Visual Perception Characteristics
3.2.3. Thermal Perception Variables
3.2.4. Questionnaires
3.3. Data Analysis Methods
4. Results
4.1. Descriptive Statistics
4.1.1. Sociological and Behavioral Characteristics of Populations
4.1.2. Thermal Experience
4.1.3. Thermal Environment and Visual Physical Characteristics
4.2. Perception Evaluation
4.2.1. Rater Agreement Index
4.2.2. Overall Perception
4.2.3. Influence of Individual Factors on Thermal Perception
4.3. Model Construction and Validation
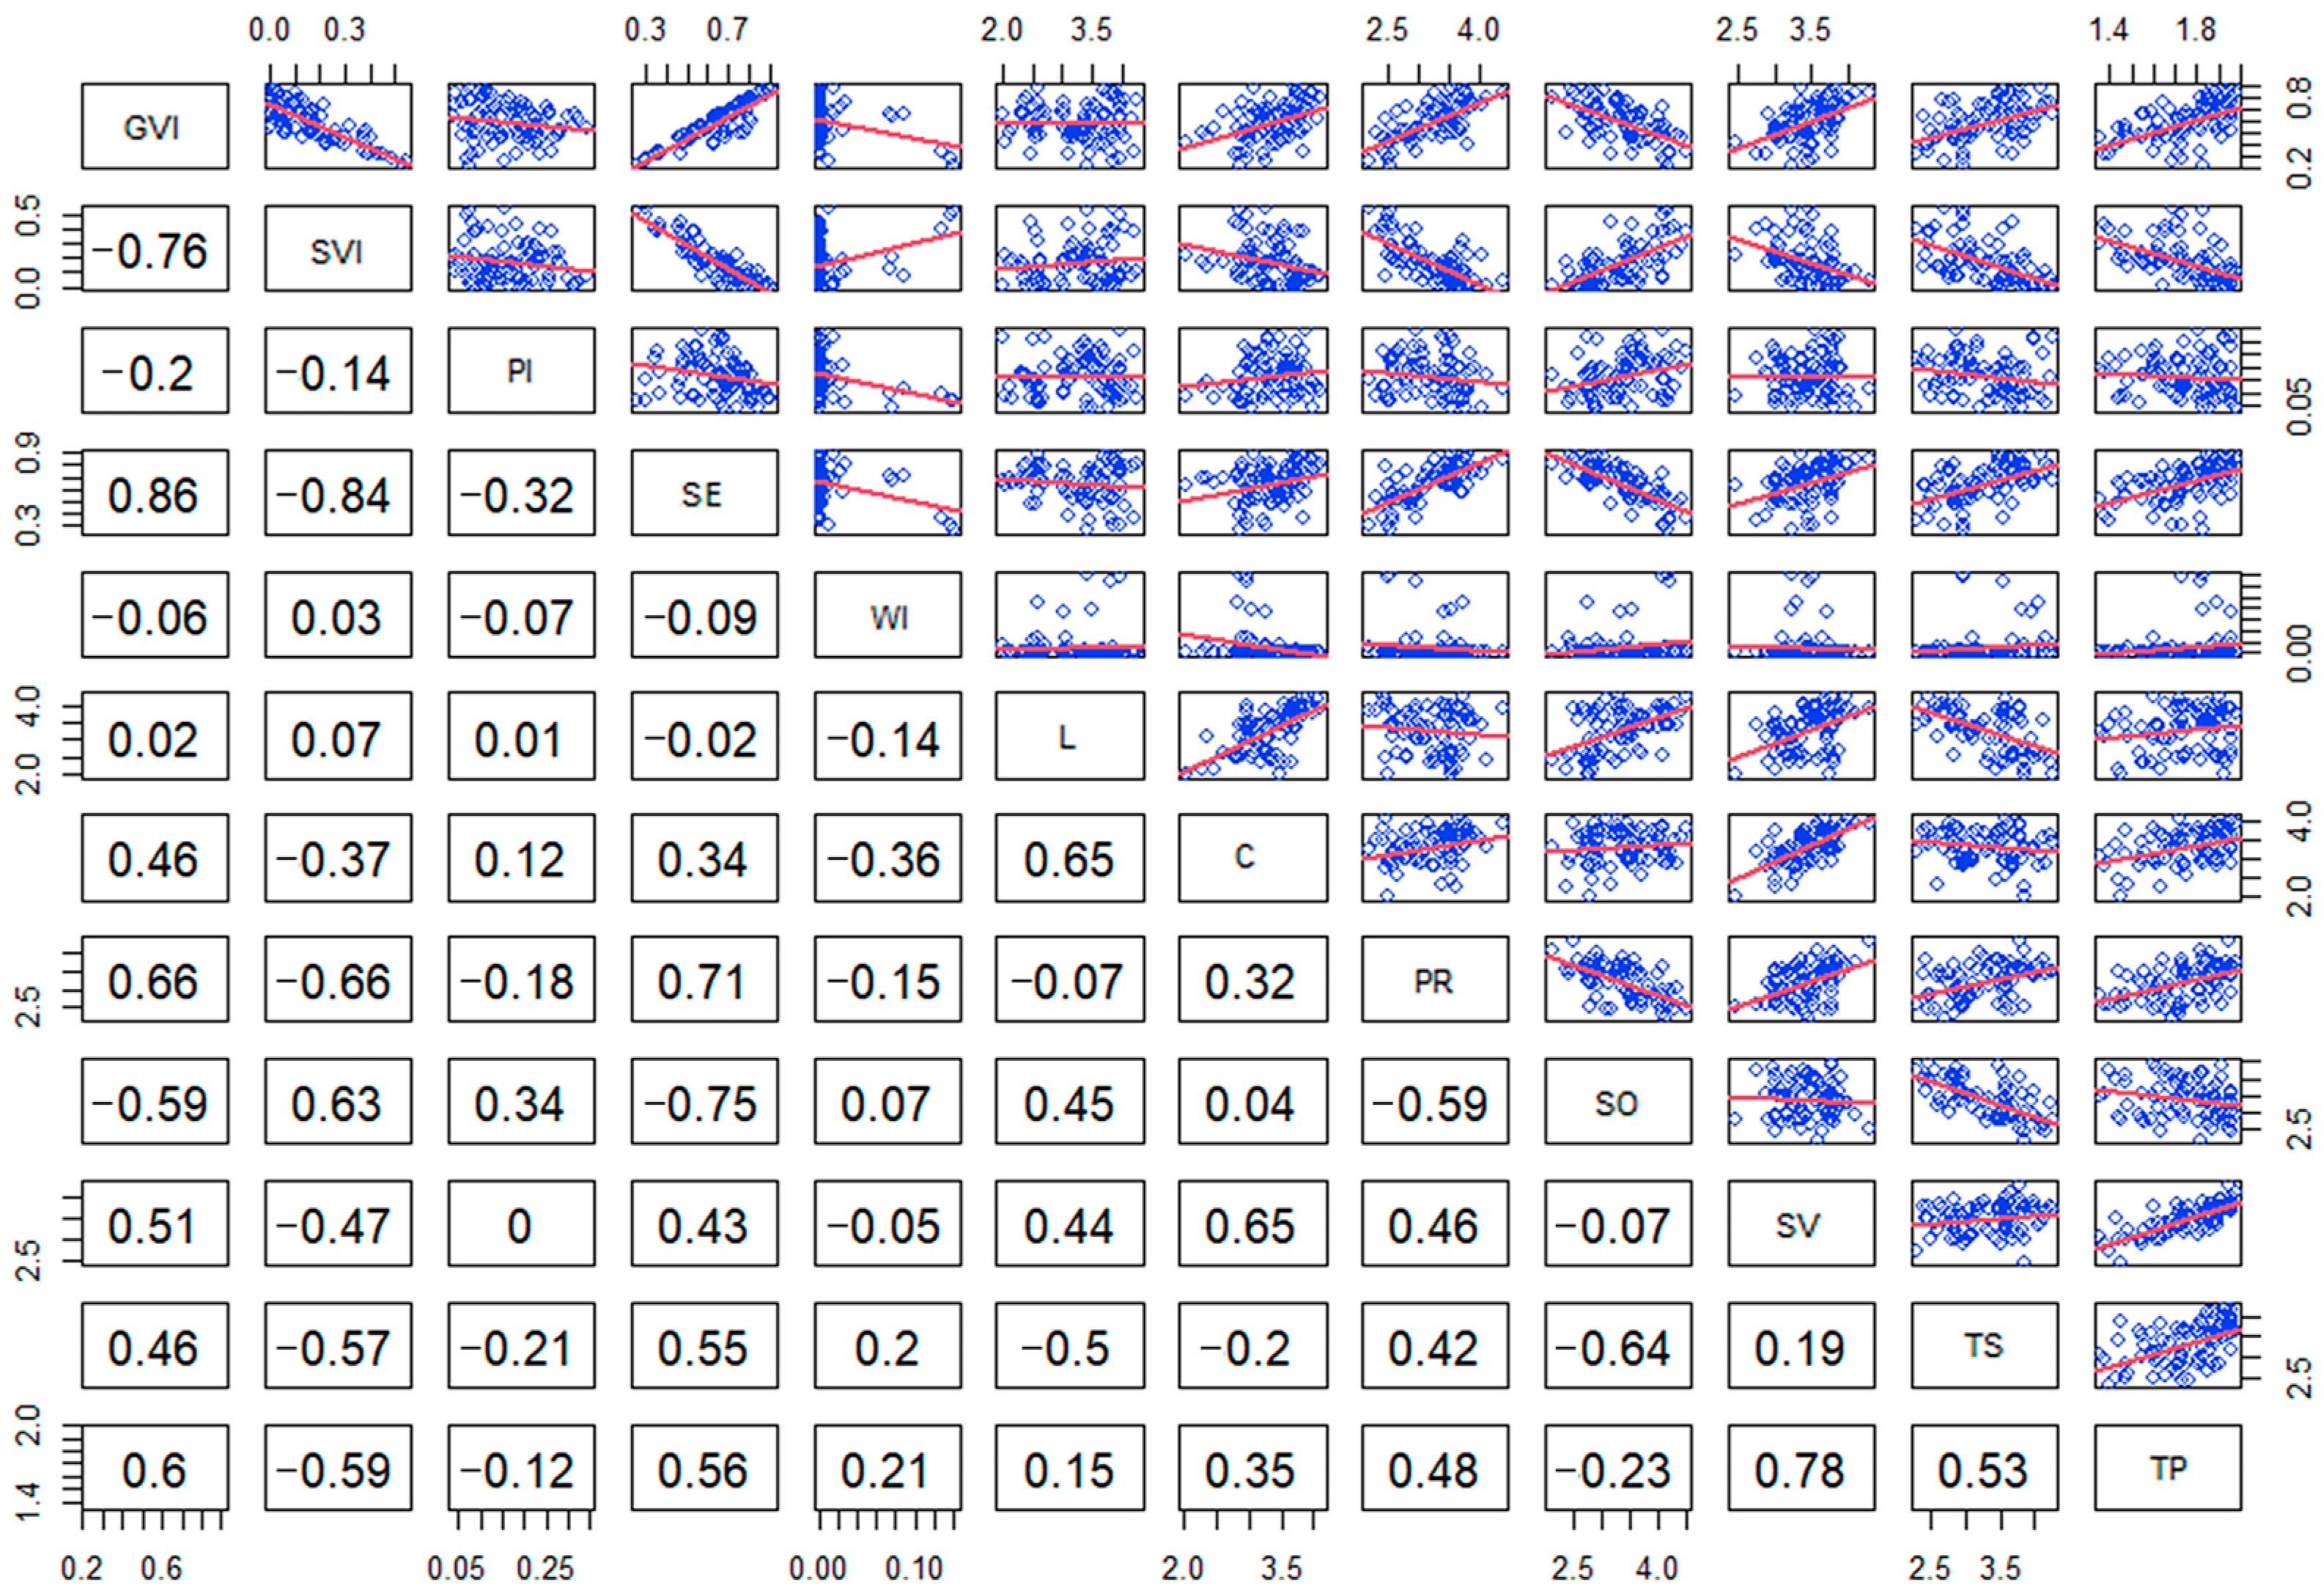
4.3.1. Data Exploration
4.3.2. Model Structure Learning
4.3.3. Model Fitting
4.3.4. Model Validation and Prediction Accuracy
5. Discussion
5.1. Multilevel Visual Characteristics and Thermal Perception
5.1.1. Associations Between Multilevel Visual Characteristics
5.1.2. The Effect of Multilevel Visual Characteristics on Thermal Perception
5.1.3. Visual Design Strategies to Enhance Thermal Perception of Greenways
5.2. Limitations and Prospects of the Study
6. Conclusions
Supplementary Materials
Author Contributions
Funding
Data Availability Statement
Acknowledgments
Conflicts of Interest
Appendix A
Appendix A.1. The Specifications of the Tools Used

| Microclimate Parameters | Measuring Tools | Measurement Range | Accuracy | Resolution | Response Time |
|---|---|---|---|---|---|
| Temperature (Ta) | Kestrel 5500 Handheld Weather Meter | −29 °C−70 °C | 0.5 °C | 0.1 °C | 1 s |
| Wind speed (Va) | 0.6–60 m/s | ±3% | 0.1 m/s | 1 s | |
| Humidity (RH) | 5.0–95.0% | ±2% | 0.1 | 60 s | |
| Solar radiation (G) | TES-1333 Solar Power Meter | 0 to 1999 W/m2 | ±10 W/m2 | 0.1 W/m2 | 1 s |
Appendix A.2. Weather Conditions during the Survey
| Date | Temperature Range (°C) | Weather | Wind Force |
|---|---|---|---|
| 6 July 2023 | 28–38 | Cloudy | Level 2 |
| 7 July 2023 | 28–38 | Cloudy | Level 2 |
| 8 July 2023 | 28–40 | Sunny | Level 2 |
| 9 July 2023 | 28–40 | Cloudy–Sunny | Level 1 |
| 10 July 2023 | 28–38 | Cloudy–Sunny | Level 2 |
| 11 July 2023 | 27–38 | Cloudy–Sunny | Level 2 |
| 12 July 2023 | 27–38 | Cloudy | Level 2 |
| 13 July 2023 | 26–38 | Cloudy | Level 2 |
Appendix A.3. Measured Thermal Environment Parameters of the Greenways
| Ta (°C) | RH (%) | Va (m/s) | G (W/m²) | |||||||||
|---|---|---|---|---|---|---|---|---|---|---|---|---|
| Site | Mean | Min | Max | Mean | Min | Max | Mean | Min | Max | Mean | Min | Max |
| A | 32.5 | 31.6 | 33.8 | 75.1 | 71.3 | 77.0 | 0.4 | 0 | 0.9 | 196 | 27.8 | 368.7 |
| B | 31.1 | 29.9 | 33.0 | 77.8 | 49.9 | 82.7 | 0.1 | 0 | 0.6 | 174.7 | 49.3 | 728.2 |
| C | 33.4 | 32.2 | 35.3 | 69.4 | 65.7 | 72.4 | 0.5 | 0 | 1.2 | 222.5 | 25.3 | 693.4 |
| D | 33.2 | 30.9 | 35.2 | 70.7 | 61.9 | 78.0 | 0.4 | 0 | 0.7 | 292.3 | 136.1 | 598.7 |
| E | 34.5 | 32.9 | 35.8 | 67.9 | 63.6 | 72.2 | 0.4 | 0 | 1.1 | 410.6 | 49.7 | 811.8 |
| F | 32.5 | 31.1 | 33.7 | 74.9 | 70.5 | 78.20 | 0.2 | 0 | 1.1 | 178.0 | 25.6 | 719.4 |
| G | 35.4 | 34.8 | 36.2 | 64.2 | 61.4 | 67.9 | 0.4 | 0 | 1.0 | 379.4 | 25.3 | 885.3 |
| H | 33.7 | 32.9 | 35.0 | 72.8 | 67.7 | 75.6 | 0.3 | 0 | 0.7 | 266.1 | 104.9 | 580.3 |
Appendix A.4. Element of Visual Physical Characteristics
| Percentage of Elements (n = 101) | ||||||||
|---|---|---|---|---|---|---|---|---|
| Tab | A (n = 11) | B (n = 15) | C (n = 12) | D (n = 12) | E (n = 14) | F (n = 15) | G (n = 14) | H (n = 8) |
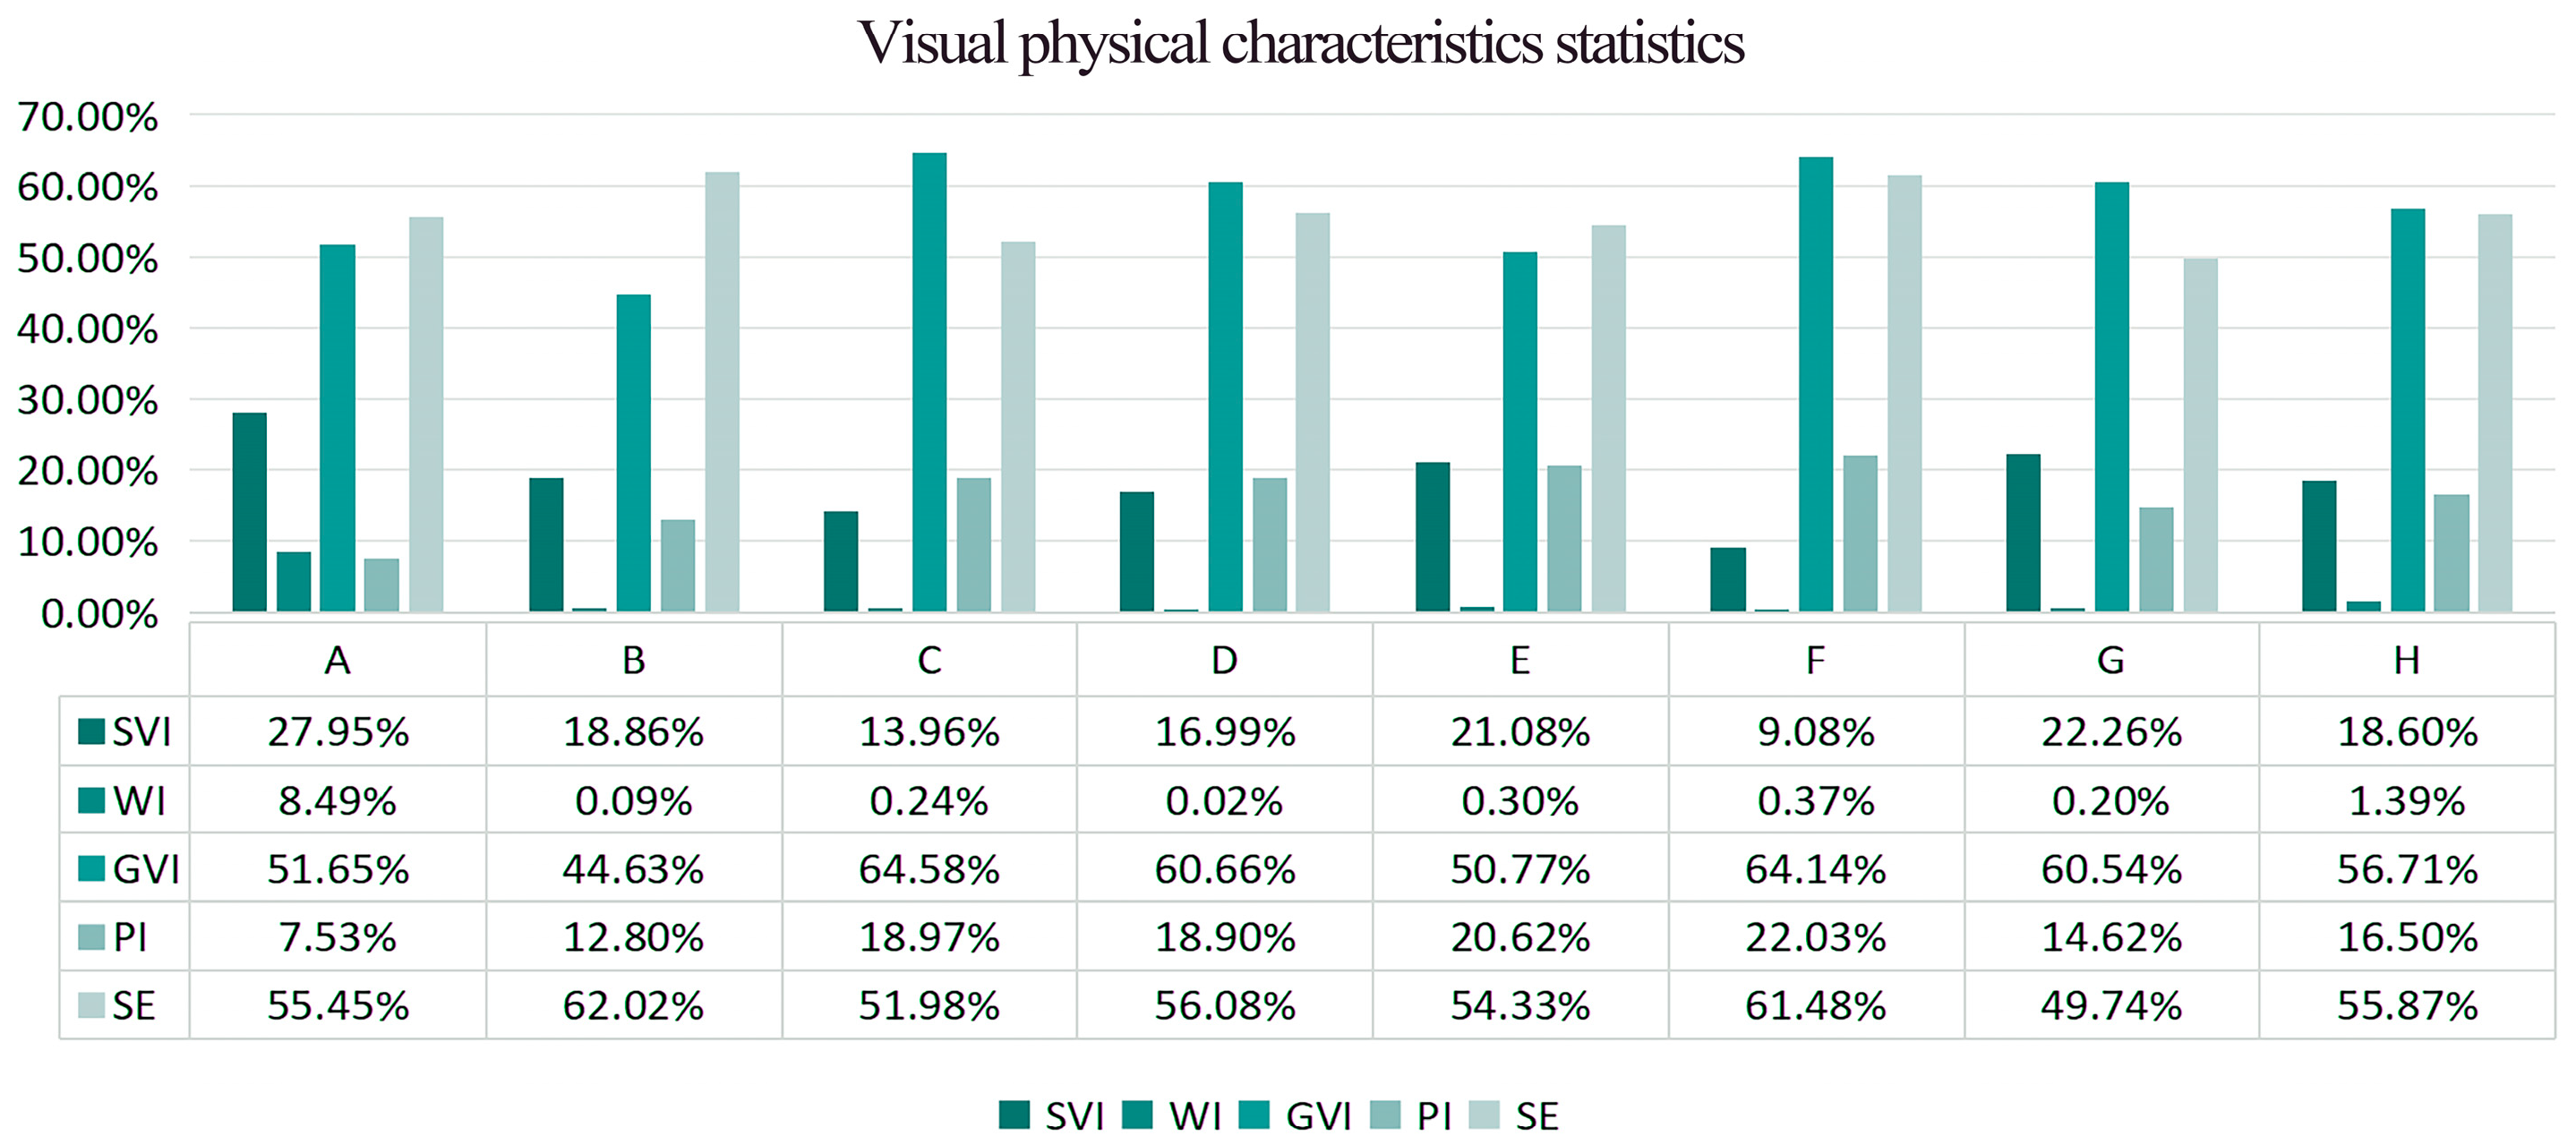
| sky | 27.95% | 18.86% | 13.96% | 16.99% | 21.08% | 9.08% | 22.26% | 18.60% |
| tree | 40.70% | 37.11% | 47.70% | 36.79% | 37.83% | 47.49% | 42.79% | 41.49% |
| road | 0.20% | 3.02% | 15.17% | 1.20% | 15.26% | 4.26% | 5.48% | 6.37% |
| grass | 0.35% | 2.73% | 13.67% | 6.47% | 3.12% | 6.40% | 12.70% | 6.49% |
| sidewalk | 3.03% | 0.98% | 2.31% | 10.75% | 2.69% | 3.33% | 7.35% | 4.35% |
| earth | 1.10%s | 1.55% | 1.13% | 1.41% | 1.72% | 6.41% | 0.98% | 2.04% |
| plant | 10.60% | 4.79% | 3.21% | 17.41% | 9.83% | 10.26% | 5.06% | 8.73% |
| water | 8.49% | 0.09% | 0.24% | 0.02% | 0.30% | 0.37% | 0.20% | 1.39% |
| fence | 2.31% | 17.41% | 0.56% | 1.30% | 5.65% | 2.99% | 1.12% | 4.48% |
| railing | 1.51% | 2.67% | 0.03% | 0.34% | 0.69% | 0.08% | 0.14% | 0.78% |
| path | 3.21% | 7.24% | 0.34% | 5.53% | 0.94% | 8.03% | 0.80% | 3.73% |
| streetlight | 0.33% | 0.04% | 0.48% | 0.24% | 0.33% | 0.66% | 0.64% | 0.39% |
Appendix B
Appendix B.1. Visual Physical Characteristics Statistics
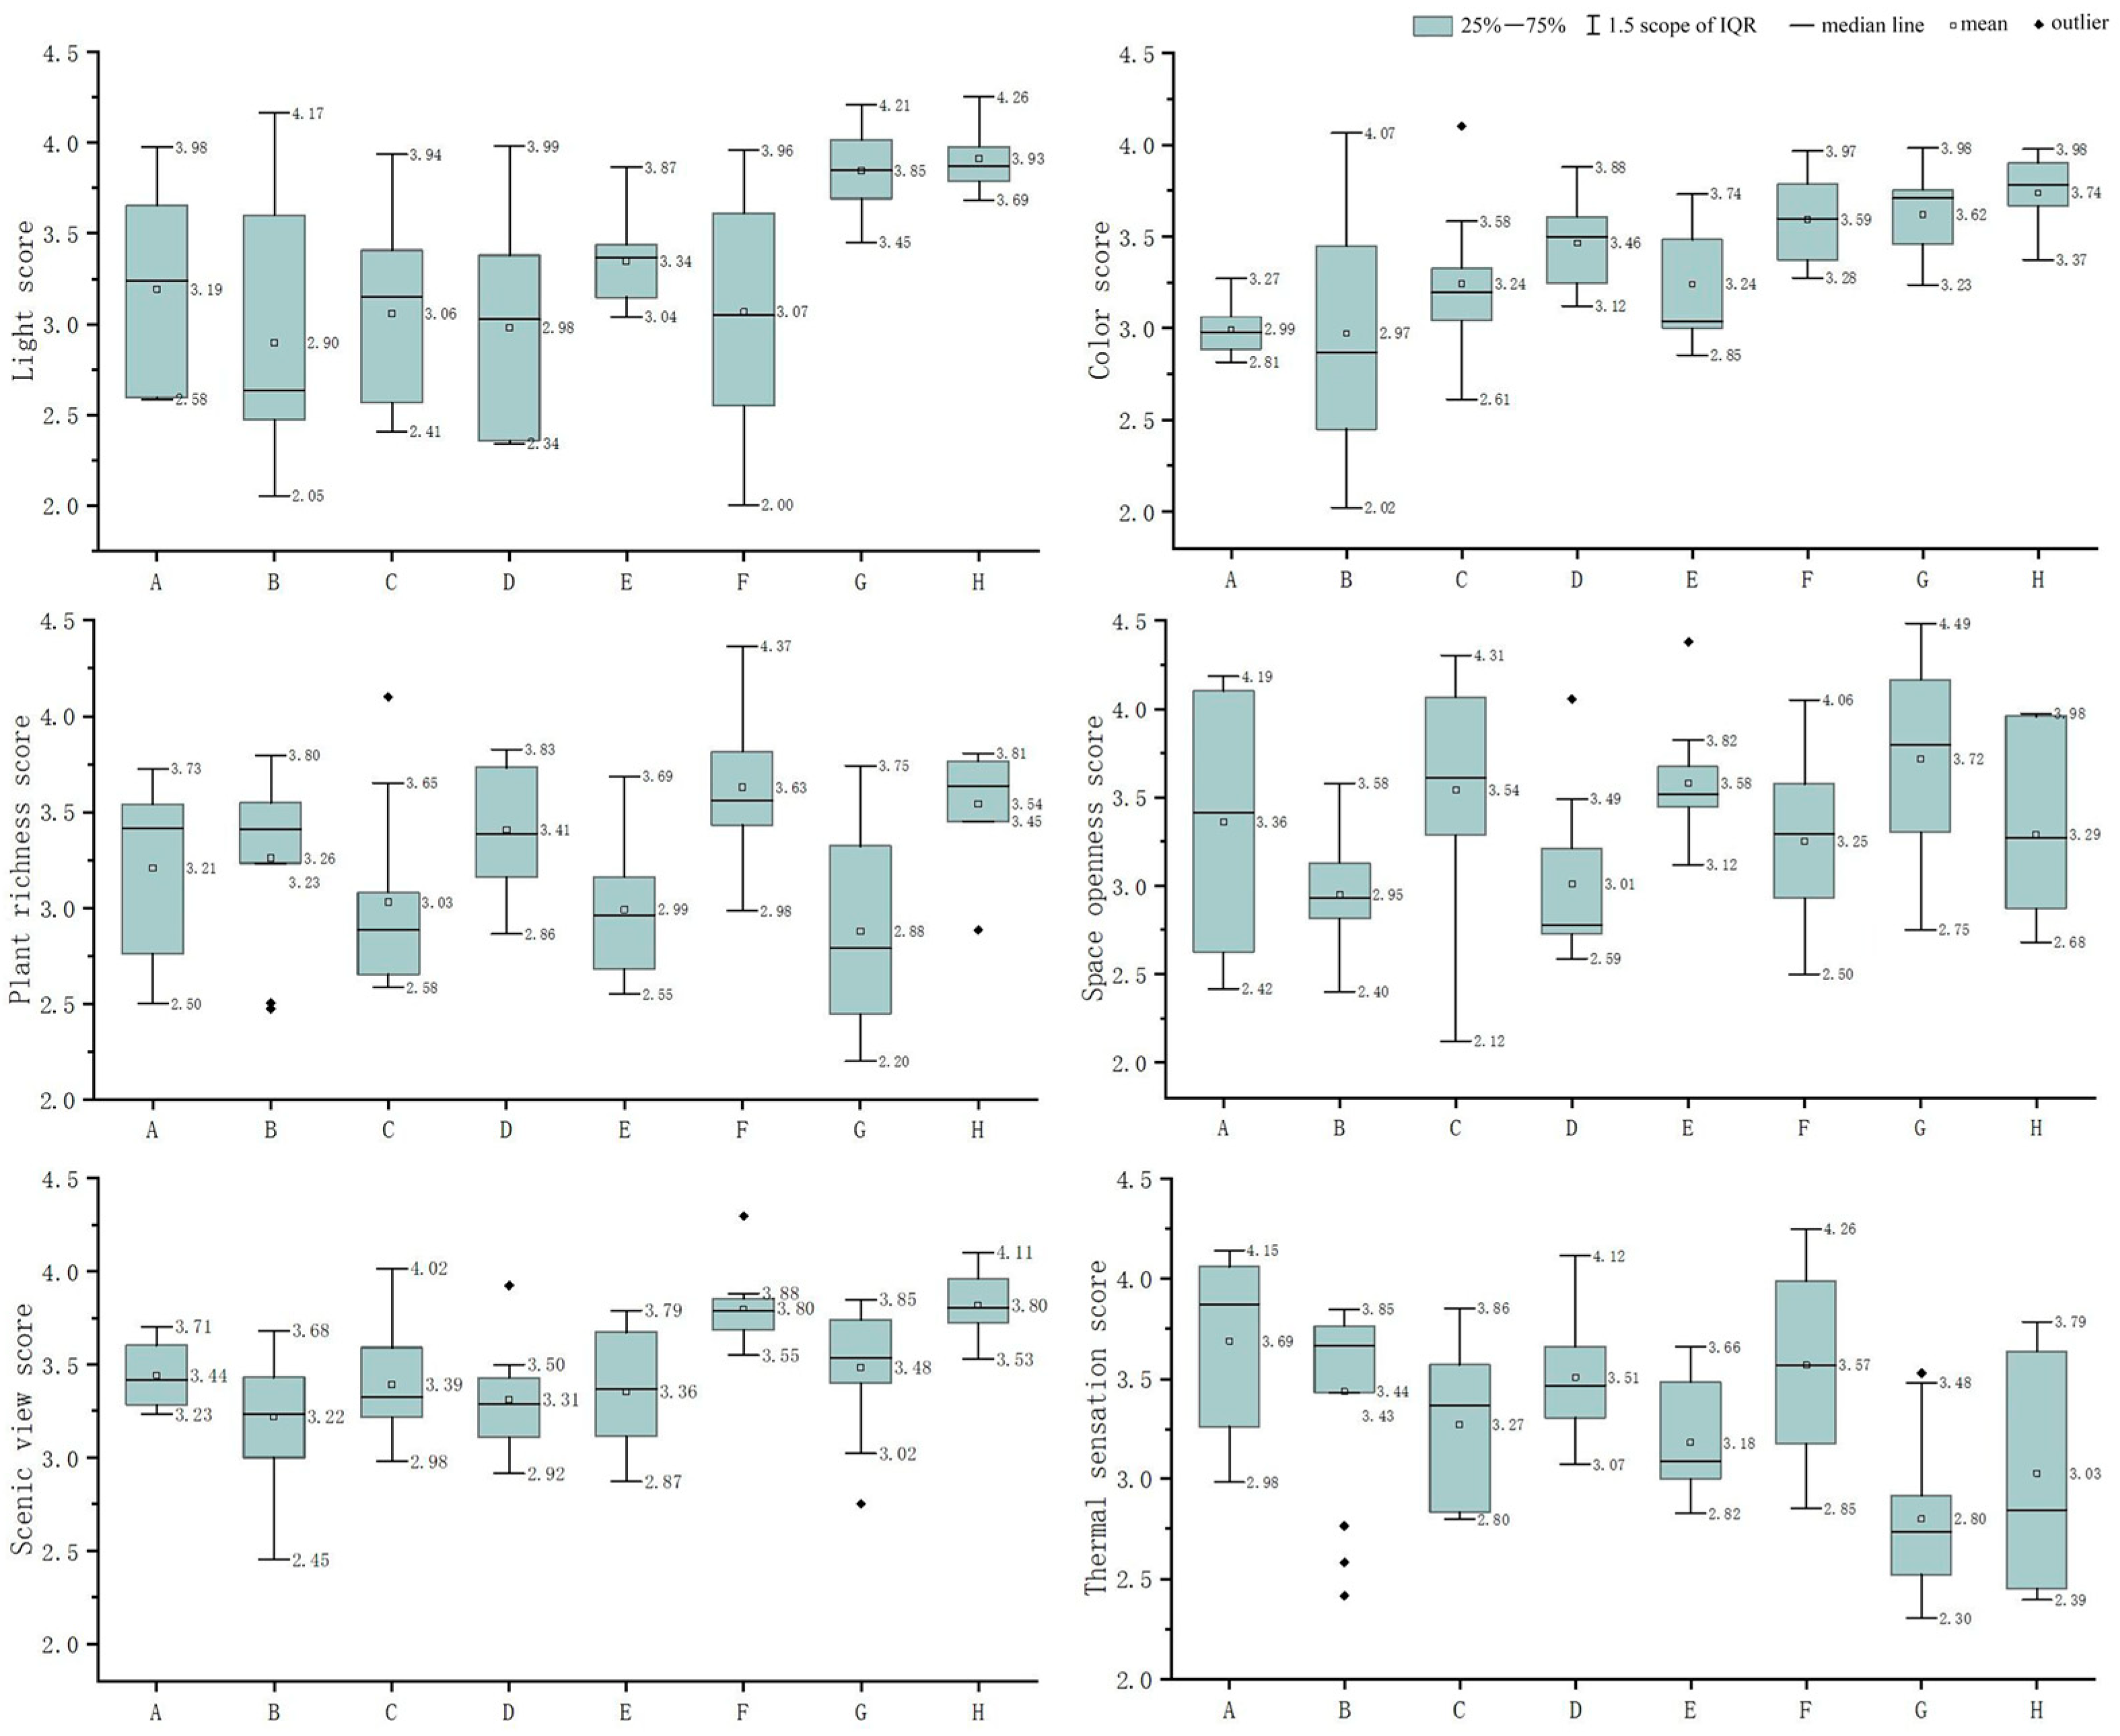
Appendix B.2. Visual Perception and Thermal Perception Statistics
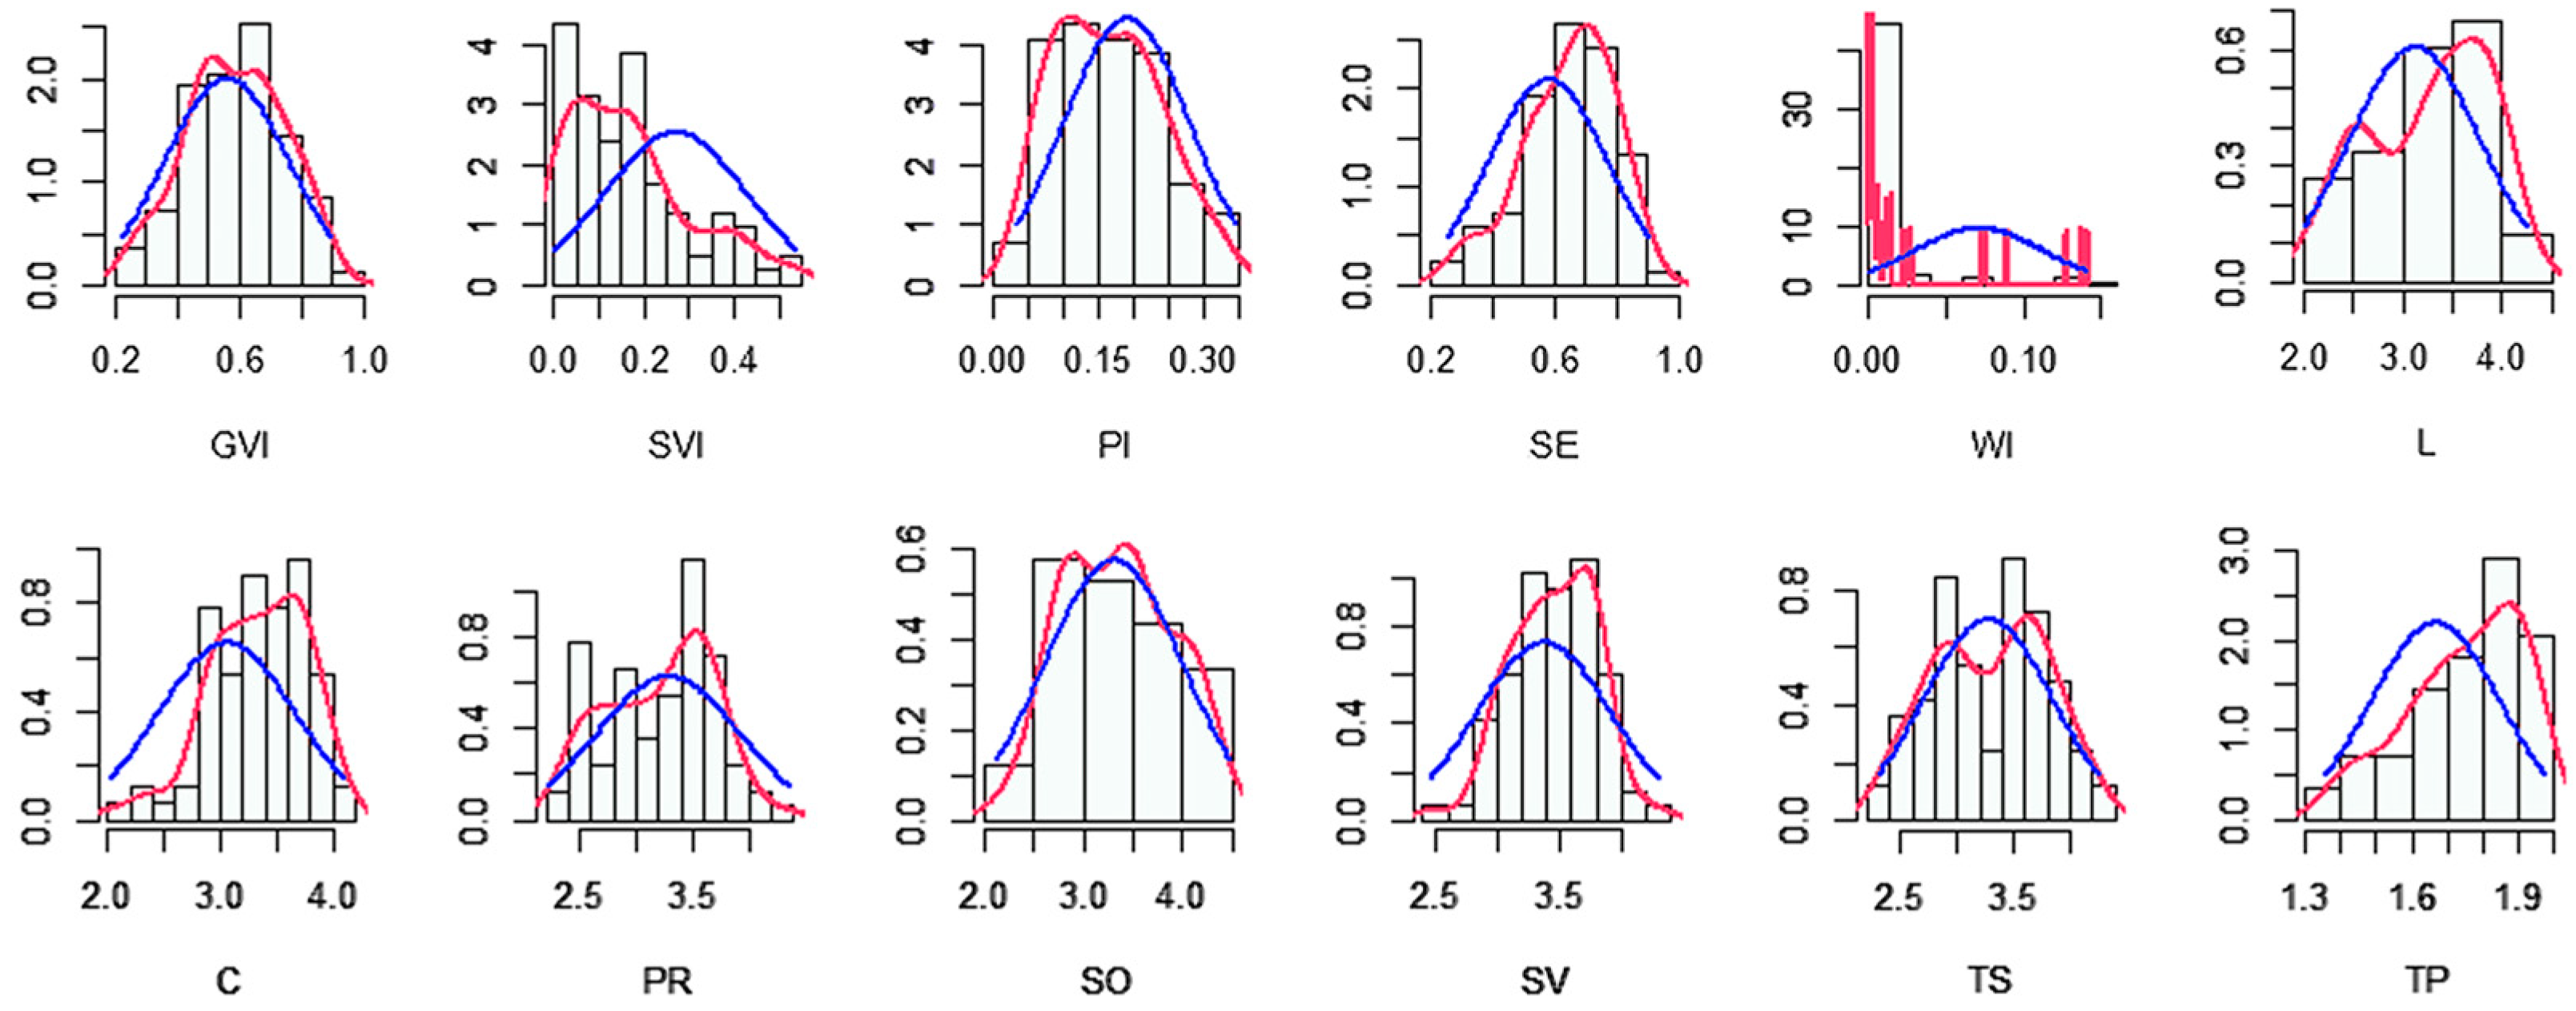
Appendix B.3. Normal Distribution of Visual Characteristics and Thermal Perception Indicators
Appendix C
Questionnaire on the Effect of Greenways’ Visual Characteristics on Thermal Perception
References
- Chen, L.; Ng, E. Outdoor Thermal Comfort and Outdoor Activities: A Review of Research in the Past Decade. Cities 2012, 29, 118–125. [Google Scholar] [CrossRef]
- Zhang, T.; Huang, R.; Yang, M.; Lin, G.; Ma, X.; Wang, X.; Huang, Q. Perceptions of the Health Risk from Hot Days and the Cooling Effect of Urban Green Spaces: A Case Study in Xi’an, China. Front. Public Health 2023, 11, 1211164. [Google Scholar] [CrossRef] [PubMed]
- Burrows, E.; O’Mahony, M.; Geraghty, D. How Urban Parks Offer Opportunities for Physical Activity in Dublin, Ireland. Int. J. Environ. Res. Public Health 2018, 15, 815. [Google Scholar] [CrossRef] [PubMed]
- Lee, Y.-C.; Kim, K.-H. Attitudes of Citizens towards Urban Parks and Green Spaces for Urban Sustainability: The Case of Gyeongsan City, Republic of Korea. Sustainability 2015, 7, 8240–8254. [Google Scholar] [CrossRef]
- Zhang, L.; Wei, D.; Hou, Y.; Du, J.; Liu, Z.; Zhang, G.; Shi, L. Outdoor Thermal Comfort of Urban Park-A Case Study. Sustainability 2020, 12, 1961. [Google Scholar] [CrossRef]
- Yang, J.; Zhao, Y.; Zou, Y.; Xia, D.; Lou, S.; Guo, T.; Zhong, Z. Improving the Thermal Comfort of an Open Space via Landscape Design: A Case Study in Hot and Humid Areas. Atmosphere 2022, 13, 1604. [Google Scholar] [CrossRef]
- Wang, W.; Li, Y.; Li, L.; Wang, R.; Wang, Y. Study on Thermal Comfort of Elderly in Community Parks: An Exploration from the Perspectives of Different Activities and Ages. Build. Environ. 2023, 246, 111001. [Google Scholar] [CrossRef]
- Liu, Y.; Fan, J.; Xie, S.; Chen, X. Study on the Spatial and Temporal Distribution of Thermal Comfort and Its Influencing Factors in Urban Parks. Atmosphere 2024, 15, 183. [Google Scholar] [CrossRef]
- Perini, K.; Chokhachian, A.; Dong, S.; Auer, T. Modeling and Simulating Urban Outdoor Comfort: Coupling ENVI-Met and TRNSYS by Grasshopper. Energy Build. 2017, 152, 373–384. [Google Scholar] [CrossRef]
- Wong, N.H.; He, Y.; Ngoc, S.N.; Raghavan, S.; Martin, M.; Hii, D.J.C.; Yu, Z.; Deng, J. An Integrated Multiscale Urban Microclimate Model for the Urban Thermal Environment. Urban Clim. 2021, 35, 100730. [Google Scholar] [CrossRef]
- Lau, K.K.-L.; Choi, C.Y. The Influence of Perceived Aesthetic and Acoustic Quality on Outdoor Thermal Comfort in Urban Environment. Build. Environ. 2021, 206, 108333. [Google Scholar] [CrossRef]
- Chen, H.; Hong, B.; Qu, H.; Geng, Y.; Su, M. Effects of Acoustic Perception on Outdoor Thermal Comfort in Campus Open Spaces in China’s Cold Region. Buildings 2022, 12, 1518. [Google Scholar] [CrossRef]
- Chang, J.; Du, M.; Hong, B.; Qu, H.; Chen, H. Effects of Thermal-Olfactory Interactions on Emotional Changes in Urban Outdoor Environments. Build. Environ. 2023, 232, 110049. [Google Scholar] [CrossRef]
- Shafavi, N.S.; Zomorodian, Z.S.; Tahsildoost, M.; Javadi, M. Occupants Visual Comfort Assessments: A Review of Field Studies and Lab Experiments. Sol. Energy 2020, 208, 249–274. [Google Scholar] [CrossRef]
- Tan, Z.; Chung, S.C.; Roberts, A.C.; Lau, K.K.-L. Design for Climate Resilience: Influence of Environmental Conditions on Thermal Sensation in Subtropical High-Density Cities. Archit. Sci. Rev. 2019, 62, 3–13. [Google Scholar] [CrossRef]
- Mayes, H.S.; Navarro, M.; Satchell, L.P.; Tipton, M.J.; Ando, S.; Costello, J.T. The Effects of Manipulating the Visual Environment on Thermal Perception: A Structured Narrative Review. J. Therm. Biol. 2023, 112, 103488. [Google Scholar] [CrossRef]
- Lam, C.K.C.; Yang, H.; Yang, X.; Liu, J.; Ou, C.; Cui, S.; Kong, X.; Hang, J. Cross-Modal Effects of Thermal and Visual Conditions on Outdoor Thermal and Visual Comfort Perception. Build. Environ. 2020, 186, 107297. [Google Scholar] [CrossRef]
- Manavvi, S.; Rajasekar, E. Assessing Thermal Comfort in Urban Squares in Humid Subtropical Climate: A Structural Equation Modelling Approach. Build. Environ. 2023, 229, 109931. [Google Scholar] [CrossRef]
- Zhang, T.; Hong, B.; Su, X.; Li, Y.; Song, L. Effects of Tree Seasonal Characteristics on Thermal-Visual Perception and Thermal Comfort. Build. Environ. 2022, 212, 108793. [Google Scholar] [CrossRef]
- Suzuki, T. Photo Science Biology Catalogue, 3rd ed.; Suken Publishing: Tokyo, Japan, 2014. [Google Scholar]
- Wang, S.; Zhu, S. Neural Mechanism of Visual Information Processing. Chin. Ophthalmic Res. 2008, 26, 717–720. [Google Scholar]
- Arnheim, R. Visual Thinking: Thinking, 2nd ed.; University of California Press: Berkeley, CA, USA, 2004. [Google Scholar]
- Seung, H.S.; Lee, D.D. The Manifold Ways of Perception. Science 2000, 290, 2268–2269. [Google Scholar] [CrossRef]
- Redies, C. Combining Universal Beauty and Cultural Context in a Unifying Model of Visual Aesthetic Experience. Front. Hum. Neurosci. 2015, 9, 218. [Google Scholar] [CrossRef] [PubMed]
- Silvia, P.J. Confusion and Interest: The Role of Knowledge Emotions in Aesthetic Experience. Psychol. Aesthet. Creat. Arts 2010, 4, 75–80. [Google Scholar] [CrossRef]
- Liu, J.; Wei, Y.; Lu, S.; Wang, R.; Chen, L.; Xu, F. The Elderly’s Preference for the Outdoor Environment in Fragrant Hills Nursing Home, Beijing: Interpreting the Visual-Behavioural Relationship. Urban For. Urban Green. 2021, 64, 127242. [Google Scholar] [CrossRef]
- Tabatabaie, S.; Litt, J.S.; Muller, B.H.F. Sidewalks, Trees and Shade Matter: A Visual Landscape Assessment Approach to Understanding People’s Preferences for Walking. Urban For. Urban Green. 2023, 84, 127931. [Google Scholar] [CrossRef]
- Li, J.; Huang, Z.; Zhu, Z.; Ding, G. Coexistence Perspectives: Exploring the Impact of Landscape Features on Aesthetic and Recreational Values in Urban Parks. Ecol. Indic. 2024, 162, 112043. [Google Scholar] [CrossRef]
- Johansson, E.; Thorsson, S.; Emmanuel, R.; Krüger, E. Instruments and Methods in Outdoor Thermal Comfort Studies—The Need for Standardization. Urban Clim. 2014, 10, 346–366. [Google Scholar] [CrossRef]
- ISSN 1041-2336-ANSI; American Society of Heating, Refrigerating, and Air-Conditioning Engineers Standard. ASHRAE Standard: Peachtree Corners, GA, USA, 2021.
- Schweiker, M.; Schakib-Ekbatan, K.; Fuchs, X.; Becker, S. A Seasonal Approach to Alliesthesia. Is There a Conflict with Thermal Adaptation? Energy Build. 2020, 212, 109745. [Google Scholar] [CrossRef]
- Rohles, F.H., Jr. Thermal Comfort and Strategies for Energy Conservation. J. Soc. Issues 1981, 37, 132–149. [Google Scholar] [CrossRef]
- Lai, D.; Lian, Z.; Liu, W.; Guo, C.; Liu, W.; Liu, K.; Chen, Q. A Comprehensive Review of Thermal Comfort Studies in Urban Open Spaces. Sci. Total Environ. 2020, 742, 140092. [Google Scholar] [CrossRef]
- Nikolopoulou, M.; Steemers, K. Thermal Comfort and Psychological Adaptation as a Guide for Designing Urban Spaces. Energy Build. 2003, 35, 95–101. [Google Scholar] [CrossRef]
- Shooshtarian, S.; Rajagopalan, P. Study of Thermal Satisfaction in an Australian Educational Precinct. Build. Environ. 2017, 123, 119–132. [Google Scholar] [CrossRef]
- Peng, Y.; Feng, T.; Timmermans, H.J.P. Heterogeneity in Outdoor Comfort Assessment in Urban Public Spaces. Sci. Total Environ. 2021, 790, 147941. [Google Scholar] [CrossRef] [PubMed]
- Lam, C.K.C.; Hang, J.; Zhang, D.; Wang, Q.; Ren, M.; Huang, C. Effects of Short-Term Physiological and Psychological Adaptation on Summer Thermal Comfort of Outdoor Exercising People in China. Build. Environ. 2021, 198, 107877. [Google Scholar] [CrossRef]
- Xie, Y.; Wang, X.; Wen, J.; Geng, Y.; Yan, L.; Liu, S.; Zhang, D.; Lin, B. Experimental Study and Theoretical Discussion of Dynamic Outdoor Thermal Comfort in Walking Spaces: Effect of Short-Term Thermal History. Build. Environ. 2022, 216, 109039. [Google Scholar] [CrossRef]
- Lam, C.K.C.; Gao, Y.; Yang, H.; Chen, T.; Zhang, Y.; Ou, C.; Hang, J. Interactive Effect between Long-Term and Short-Term Thermal History on Outdoor Thermal Comfort: Comparison between Guangzhou, Zhuhai and Melbourne. Sci. Total Environ. 2021, 760, 144141. [Google Scholar] [CrossRef]
- Naheed, S.; Shooshtarian, S. A Review of Cultural Background and Thermal Perceptions in Urban Environments. Sustainability 2021, 13, 9080. [Google Scholar] [CrossRef]
- Brychkov, D.; Garb, Y.; Pearlmutter, D. The Influence of Climatocultural Background on Outdoor Thermal Perception. Int. J. Biometeorol. 2018, 62, 1873–1886. [Google Scholar] [CrossRef]
- Aljawabra, F.; Nikolopoulou, M. Thermal Comfort in Urban Spaces: A Cross-Cultural Study in the Hot Arid Climate. Int. J. Biometeorol. 2018, 62, 1901–1909. [Google Scholar] [CrossRef]
- Lyu, K.; Brambilla, A.; Globa, A.; de Dear, R. A Socio-Cultural Perspective to Semi-Outdoor Thermal Experience and Restorative Benefits-Comparison between Chinese and Australian Cultural Groups. Build. Environ. 2023, 243, 110622. [Google Scholar] [CrossRef]
- Zhou, Z.; Jiao, R.; Dong, L. The Influence of Perceived Control on Outdoor Thermal Comfort: A Case Study in a Hot Summer and Warm Winter Climate. Build. Environ. 2023, 245, 110872. [Google Scholar] [CrossRef]
- Krueger, E.L.; Tamura, C.A.; Broede, P.; Schweiker, M.; Wagner, A. Short-and Long-Term Acclimatization in Outdoor Spaces: Exposure Time, Seasonal and Heatwave Adaptation Effects. Build. Environ. 2017, 116, 17–29. [Google Scholar] [CrossRef]
- Manavvi, S.; Rajasekar, E. Evaluating Outdoor Thermal Comfort in “Haats”—The Open Air Markets in a Humid Subtropical Region. Build. Environ. 2021, 190, 107527. [Google Scholar] [CrossRef]
- Lenzholzer, S.; Klemm, W.; Vasilikou, C. Qualitative Methods to Explore Thermo-Spatial Perception in Outdoor Urban Spaces. Urban Clim. 2018, 23, 231–249. [Google Scholar] [CrossRef]
- He, X.; An, L.; Hong, B.; Huang, B.; Cui, X. Cross-Cultural Differences in Thermal Comfort in Campus Open Spaces: A Longitudinal Field Survey in China’s Cold Region. Build. Environ. 2020, 172, 106739. [Google Scholar] [CrossRef]
- Singh, M.K.; Ooka, R.; Rijal, H.B.; Kumar, S.; de Dear, R. Adaptive Thermal Comfort in the Offices of Three Climates of North-East India. J. Build. Eng. 2023, 75, 106843. [Google Scholar] [CrossRef]
- Déjeant-Pons, M. The European Landscape Convention. Landsc. Res. 2006, 31, 363–384. [Google Scholar] [CrossRef]
- Knez, I.; Thorsson, S.; Eliasson, I.; Lindberg, F. Psychological Mechanisms in Outdoor Place and Weather Assessment: Towards a Conceptual Model. Int. J. Biometeorol. 2009, 53, 101–111. [Google Scholar] [CrossRef]
- Berson, D.M.; Dunn, F.A.; Takao, M. Phototransduction by Retinal Ganglion Cells That Set the Circadian Clock. Science 2002, 295, 1070–1073. [Google Scholar] [CrossRef]
- Vigier, T.; Moreau, G.; Siret, D. From Visual Cues to Climate Perception in Virtual Urban Environments. In Proceedings of the 2015 IEEE Virtual Reality (VR), Arles, France, 23–27 March 2015; pp. 305–306. [Google Scholar]
- Xu, A.J.; Labroo, A.A. Incandescent Affect: Turning on the Hot Emotional System with Bright Light. J. Consum. Psychol. 2014, 24, 207–216. [Google Scholar] [CrossRef]
- Lenzholzer, S.; de Vries, S. Exploring Outdoor Thermal Perception-a Revised Model. Int. J. Biometeorol. 2020, 64, 293–300. [Google Scholar] [CrossRef] [PubMed]
- Lutterschmidt, D.I.; Lutterschmidt, W.I.; Hutchison, V.H. Melatonin and Thermoregulation in Ectothermic Vertebrates: A Review. Can. J. Zool. 2003, 81, 1–13. [Google Scholar] [CrossRef]
- Egan, G.F.; Johnson, J.; Farrell, M.; McAllen, R.; Zamarripa, F.; McKinley, M.J.; Lancaster, J.; Denton, D.; Fox, P.T. Cortical, Thalamic, and Hypothalamic Responses to Cooling and Warming the Skin in Awake Humans: A Positron-Emission Tomography Study. Proc. Natl. Acad. Sci. USA 2005, 102, 5262–5267. [Google Scholar] [CrossRef] [PubMed]
- Muzik, O.; Diwadkar, V.A. Depth and Hierarchies in the Predictive Brain: From Reaction to Action. Wiley Interdiscip. Rev.-Cogn. Sci. 2023, 14, e1664. [Google Scholar] [CrossRef]
- Teoh, M.-Y.; Shinozaki, M.; Said, I. Redefining the Notion of Outdoor Thermal Comfort. SEATUC J. Sci. Eng. 2020, 1, 52–61. [Google Scholar]
- Bennett, C.A.; Rey, P. What’s So Hot about Red? Hum. Factors 1972, 14, 149–154. [Google Scholar] [CrossRef]
- Ho, H.-N.; Van Doorn, G.H.; Kawabe, T.; Watanabe, J.; Spence, C. Colour-Temperature Correspondences: When Reactions to Thermal Stimuli Are Influenced by Colour. PLoS ONE 2014, 9, e91854. [Google Scholar] [CrossRef]
- Ziat, M.; Balcer, C.A.; Shirtz, A.; Rolison, T. A Century Later, The Hue-Heat Hypothesis: Does Color Truly Affect Temperature Perception? In Haptics: Perception, Devices, Control, and Applications; Bello, F., Kajimoto, H., Visell, Y., Eds.; Springer: Cham, Switzerland, 2016; Volume 9774, pp. 273–280. [Google Scholar]
- Hettiarachchi, A.; Emmanuel, R. Colour as a Psychological Agent to Manipulate Perceived Indoor Thermal Environment for Low Energy Design; Cases Implemented in Sri Lanka. In Proceedings of the Passive Low Energy Architecture (PLEA) 2017—Design to Thrive, Edinburgh, UK, 2–5 July 2017. [Google Scholar]
- Ou, L.C.; Luo, M.R.; Woodcock, A.; Wright, A. A Study of Colour Emotion and Colour Preference. Part I: Colour Emotions for Single Colours. Color Res. Appl. 2004, 29, 232–240. [Google Scholar] [CrossRef]
- Lenzholzer, S.; van der Wulp, N.Y. Thermal Experience and Perception of the Built Environment in Dutch Urban Squares. J. Urban Des. 2010, 15, 375–401. [Google Scholar] [CrossRef]
- Ning, S.; Jing, W.; Ge, Z. Sunlight Perception and Outdoor Thermal Comfort in College Campuses: A New Perspective. Sci. Rep. 2023, 13, 16112. [Google Scholar] [CrossRef]
- Eliasson, I.; Knez, I.; Westerberg, U.; Thorsson, S.; Lindberg, F. Climate and Behaviour in a Nordic City. Landsc. Urban Plan. 2007, 82, 72–84. [Google Scholar] [CrossRef]
- Nikolopoulou, M. Outdoor Thermal Comfort. Front. Biosci. 2011, S3, 1552. [Google Scholar] [CrossRef] [PubMed]
- Mohammadzadeh, N.; Karimi, A.; Brown, R.D. The Influence of Outdoor Thermal Comfort on Acoustic Comfort of Urban Parks Based on Plant Communities. Build. Environ. 2023, 228, 109884. [Google Scholar] [CrossRef]
- Xi, T.; Zhang, X.; Jin, W.; Xu, W.; Wu, Y.; Qin, H. Primary Exploration of Leisure Path Design along Songhua River by a Small Number of Sample Experiment, Considering Several Multiple Indexes. Atmosphere 2022, 13, 1165. [Google Scholar] [CrossRef]
- Wang, X.; Chen, Z.; Ma, D.; Zhou, T.; Chen, J.; Jiang, X. Relationship between Visual and Thermal Comfort and Electrodermal Activity in Campus Blue–Green Spaces: A Case Study of Guangzhou, China. Sustainability 2023, 15, 11742. [Google Scholar] [CrossRef]
- Klemm, W.; Heusinkveld, B.G.; Lenzholzer, S.; Jacobs, M.H.; Van Hove, B. Psychological and Physical Impact of Urban Green Spaces on Outdoor Thermal Comfort during Summertime in The Netherlands. Build. Environ. 2015, 83, 120–128. [Google Scholar] [CrossRef]
- Sun, F.; Zhang, J.; Yang, R.; Liu, S.; Ma, J.; Lin, X.; Su, D.; Liu, K.; Cui, J. Study on Microclimate and Thermal Comfort in Small Urban Green Spaces in Tokyo, Japan—A Case Study of Chuo Ward. Sustainability 2023, 15, 16555. [Google Scholar] [CrossRef]
- Peng, Z.; Bardhan, R.; Ellard, C.; Steemers, K. Urban Climate Walk: A Stop-and-Go Assessment of the Dynamic Thermal Sensation and Perception in Two Waterfront Districts in Rome, Italy. Build. Environ. 2022, 221, 109267. [Google Scholar] [CrossRef]
- Thorsson, S.; Honjo, T.; Lindberg, F.; Eliasson, I.; Lim, E.-M. Thermal Comfort and Outdoor Activity in Japanese Urban Public Places. Environ. Behav. 2007, 39, 660–684. [Google Scholar] [CrossRef]
- Kim, M.; Chong, S.C.; Chun, C.; Choi, Y. Effect of Thermal Sensation on Emotional Responses as Measured through Brain Waves. Build. Environ. 2017, 118, 32–39. [Google Scholar] [CrossRef]
- Yan, T.; Jin, H.; Jin, Y. The Mediating Role of Emotion in the Effects of Landscape Elements on Thermal Comfort: A Laboratory Study. Build. Environ. 2023, 233, 110130. [Google Scholar] [CrossRef]
- Wang, H.; Liu, L. Experimental Investigation about Effect of Emotion State on People’s Thermal Comfort. Energy Build. 2020, 211, 109789. [Google Scholar] [CrossRef]
- Wang, H.; Liu, G.; Hu, S.; Liu, C. Experimental Investigation about Thermal Effect of Colour on Thermal Sensation and Comfort. Energy Build. 2018, 173, 710–718. [Google Scholar] [CrossRef]
- Lenzholzer, S.; Koh, J. Immersed in Microclimatic Space: Microclimate Experience and Perception of Spatial Configurations in Dutch Squares. Landsc. Urban Plan. 2010, 95, 1–15. [Google Scholar] [CrossRef]
- Lehnert, M.; Geletič, J.; Kopp, J.; Brabec, M.; Jurek, M.; Pánek, J. Comparison between Mental Mapping and Land Surface Temperature in Two Czech Cities: A New Perspective on Indication of Locations Prone to Heat Stress. Build. Environ. 2021, 203, 108090. [Google Scholar] [CrossRef]
- Rodiek, S.D.; Fried, J.T. Access to the Outdoors: Using Photographic Comparison to Assess Preferences of Assisted Living Residents. Landsc. Urban Plan. 2005, 73, 184–199. [Google Scholar] [CrossRef]
- Cortesão, J.; Brandão Alves, F.; Raaphorst, K. Photographic Comparison: A Method for Qualitative Outdoor Thermal Perception Surveys. Int. J. Biometeorol. 2020, 64, 173–185. [Google Scholar] [CrossRef]
- Xu, H.; Zhu, Y.H.; Zhen, T.; Li, Z.H. Survey of Image Semantic Segmentation Methods Based on Deep Neural Network. J. Front. Comput. Sci. Technol. 2021, 15, 47–59. [Google Scholar]
- Geiger, D.; Pearl, J. Logical and Algorithmic Properties of Independence and Their Application to Bayesian Networks. Ann. Math. Artif. Intell. 1990, 2, 165–178. [Google Scholar] [CrossRef]
- Lindell, M.K.; Brandt, C.J. Measuring Interrater Agreement for Ratings of a Single Target. Appl. Psychol. Meas. 1997, 21, 271–278. [Google Scholar] [CrossRef]
- Chakraborty, B. Learning Bayesian Belief Networks: An Approach Based on the MDL Principle. Comput. Intell. 1994, 10, 269–293. [Google Scholar]
- Doguc, O.; Ramirez-Marquez, J.E. A Generic Method for Estimating System Reliability Using Bayesian Networks. Reliab. Eng. Syst. Saf. 2009, 94, 542–550. [Google Scholar] [CrossRef]
- Xu, J.-G.; Zhao, Y.; Chen, J.; Han, C. A Structure Learning Algorithm for Bayesian Network Using Prior Knowledge. J. Comput. Sci. Technol. 2015, 30, 713–724. [Google Scholar] [CrossRef]
- Lee, Y.Y.; Md Din, M.F.; Iwao, K.; Lee, Y.H.; Anting, N. Impact of Thermal Behaviour of Different Environmental Conditions on Ambient Environment and Thermal Discomfort in Malaysia. Indoor Built Environ. 2021, 30, 520–534. [Google Scholar] [CrossRef]
- Syafii, N.I.; Ichinose, M.; Wong, N.H.; Kumakura, E.; Jusuf, S.K.; Chigusa, K. Experimental Study on the Influence of Urban Water Body on Thermal Environment at Outdoor Scale Model. Procedia Eng. 2016, 169, 191–198. [Google Scholar] [CrossRef]
- Luo, J.; Zhao, T.; Cao, L.; Biljecki, F. Water View Imagery: Perception and Evaluation of Urban Waterscapes Worldwide. Ecol. Indic. 2022, 145, 109615. [Google Scholar] [CrossRef]
- Chen, X.; Xue, P.; Liu, L.; Gao, L.; Liu, J. Outdoor Thermal Comfort and Adaptation in Severe Cold Area: A Longitudinal Survey in Harbin, China. Build. Environ. 2018, 148, 548–560. [Google Scholar] [CrossRef]


| Location | Site Description | Number of Points | |
|---|---|---|---|
| West Lake Greenway (A) | Section A is mainly for the West Lake Park internal lake walkway, road width 2–4 m, to stone road, wooden trestle mainly. | Measurement: 17 Reservations: 12 | |
| Fudao (B) | Section B relies on the mountain to form a panoramic walkway, with a road width of 2.4 m and a steel skeleton walkway as its main characteristics. | Measurement: 15 Reservations: 15 | |
| North Riverside Greenway (C) | Section C is located on the north bank of the Min River, with a road width of 3 m, made of gray asphalt, bluestone slabs, and wood. | Measurement: 14 Reservations: 12 | |
| Nantai Island Greenway | South Riverside Greenway (D) | Section D connects residential areas and parks, with a road width of 3 m, and the road material is mainly permeable bricks. | Measurement: 14 Reservations: 12 |
| Flora Greenway (E) | Section E of the Flora Greenway is an integral part of the levee, with a road width of 5 m and a paving material of mainly blue asphalt. | Measurement: 14 Reservations: 12 | |
| Bright Harbor Greenway (F) | Section F links residential areas and parks, with a road width of 5 m and paving materials of mainly red asphalt and bluestone slabs. | Measurement: 20 Reservations: 15 | |
| East Riverside Greenway (G) | Section G belongs to the north bank of the Min River, road width of 3 m, paving materials are mainly grey asphalt, green stone slabs. | Measurement: 15 Reservations: 14 | |
| Feifeng Mountain Greenway (H) | Section H is in the park’s internal ring of mountain greenways, road width of 6 m, paving material of gray asphalt. | Measurement: 12 Reservations: 8 | |
| Perception | Questions |
|---|---|
| Visual perception |  |
| Overall environment light (L) | 1. What do you think of the overall environment light of the right picture compared to the left picture? Much darker, darker, moderate, brighter, much brighter. |
| Overall color tone (C) | 2. What do you think of the overall color tone of the right picture compared to the left picture? Much colder, colder, moderate, warmer, much warmer. |
| Plant richness (PR) | 3. What do you think of the abundance of plants in the right picture compared to the left picture? Much more monotonous, more monotonous, moderate, richer, much richer. |
| Space openness (SO) | 4. What do you think of the openness of space in the right picture compared to the left picture? Much more closed, more closed, moderate, more open, much more open. |
| Scenic view (SV) | 5. What do you think of the scenic view in the right picture compared to the left picture? Much more common, more common, moderate, more beautiful, much more beautiful. |
| Thermal perception | |
| Thermal sensation (TS) | 6. How do you think the temperatures on the right look in the summer compared to the left graph? Much hotter, hotter, moderate, cooler, much cooler. |
| Thermal preference (TP) | 7. Which scene do you prefer for the feeling of a hot environment? Left, right. |
| Variable | Form | Percentage |
|---|---|---|
| Gender | Male | 45.8% |
| Women | 54.2% | |
| Age | 18 years and under | 5.68% |
| 19–35 years | 87.18% | |
| 36–65 years | 6.96% | |
| 66 and over | 0.18% | |
| Educational level | Primary and below | 0.4% |
| Junior high school, high school | 95.2% | |
| College, Bachelor’s Degree, Master’s Degree, Doctorate | 4.4% | |
| Careers | Teacher/Administration | 5.6% |
| Design practitioner | 4.0% | |
| Liberal profession | 3.1% | |
| Student | 70.1% | |
| Marketing/Sales/Commercial | 4.0% | |
| Other | 13.2% | |
| Salary | CNY 0–3000 | 70.3% |
| CNY 3000–5000 | 11.5% | |
| CNY 5000–10,000 | 12.3% | |
| More than CNY 10,000 | 5.9% |
| Variable | Form | Percentage |
|---|---|---|
| Climate in the living area | Cool | 0.7% |
| Mild | 17% | |
| Hot | 82.2% | |
| Life experience in Fujian | Yes | 90.5% |
| No | 9.5% | |
| Experience of using greenways in summer | Yes | 87.4% |
| No | 12.6% | |
| Duration of activities on the greenway | 0–0.5 h | 24.4% |
| 0.5–1.0 h | 42.9% | |
| 1.0–2.0 h | 26.2% | |
| 2.0 h or more | 6.6% | |
| Type of activity | Leisurely stroll | 52.7% |
| Physical exercise | 16.0% | |
| Bicycle sightseeing | 15.4% | |
| Entertainment | 11.0% | |
| Other | 5.0% |
| Thermal Sensation | Thermal Preference | |||
|---|---|---|---|---|
| Variable | Homogeneity of Variance Test 1 | p 2 | Homogeneity of Variance Test 1 | p 2 |
| Gender | 0.956 | 0.048 | 0.260 | 0.089 |
| Age | 0.387 | 0.071 | 0.275 | 0.704 |
| Educational level | 0.394 | 0.790 | 0.478 | 0.727 |
| Salary | 0.018 | 0.016 | 0.505 | 0.730 |
| Careers | 0.092 | 0.066 | 0.262 | 0.989 |
| Climate in the living area | 0.180 | 0.072 | 0.302 | 0.513 |
| Life experience in Fujian | 0.671 | 0.476 | 0.990 | 0.063 |
| Experience of using greenways in summer | 0.970 | 0.100 | 0.010 | 0.575 |
| Duration of activities on the greenway | 0.172 | 0.147 | 0.927 | 0.408 |
| (I) Salary (CNY) | (J) Salary (CNY) | Mean Value Difference (I–J) | p 1 |
|---|---|---|---|
| 0–3000 | 3000–5000 | −0.04761 | 0.453 |
| 5000–10,000 | −0.09755 | 0.002 | |
| More than 10,000 | −0.02474 | 0.995 | |
| 3000–5000 | 5000–10,000 | −0.04994 | 0.618 |
| More than 10,000 | 0.02287 | 0.998 | |
| 5000–10,000 | More than 10,000 | 0.07281 | 0.596 |
| Blacklist | Whitelist | ||
|---|---|---|---|
| From | To | From | To |
| GVI | SVI | GVI | C |
| SE | L | ||
| PI | PR | ||
| WI | SVI | C | |
| SVI | GVI | L | |
| PI | TP | ||
| SE | PI | C | |
| WI | SO | ||
| PI | GVI | SE | C |
| SVI | L | ||
| SE | PR | ||
| WI | SO | ||
| SE | GVI | TS | |
| SVI | WI | C | |
| PI | L | ||
| WI | SV | ||
| WI | GVI | TS | |
| SVI | TP | ||
| PI | L | TS | |
| SE | C | SO | |
| L | |||
| SV | |||
| PR | SO | ||
| SV | |||
| SE | C | ||
| SO | |||
| PR | |||
| TS | |||
| SV | TS | ||
| TP | |||
| Linear Equation | R-Squared | F-Statistic | p-Value 1 |
|---|---|---|---|
| (6) | 0.759 | 82.94 | 0.000 |
| (7) | 0.6805 | 41.54 | 0.000 |
| (8) | 0.6158 | 24.68 | 0.000 |
| (9) | 0.375 | 11.7 | 0.000 |
| (10) | 0.5462 | 48.15 | 0.000 |
| (11) | 0.6963 | 60.37 | 0.000 |
| L | C | PR | SO | SV | TS | TP | |
|---|---|---|---|---|---|---|---|
| Accuracy | 0.829 | 0.811 | 0.716 | 0.846 | 0.855 | 0.799 | 0.838 |
Disclaimer/Publisher’s Note: The statements, opinions and data contained in all publications are solely those of the individual author(s) and contributor(s) and not of MDPI and/or the editor(s). MDPI and/or the editor(s) disclaim responsibility for any injury to people or property resulting from any ideas, methods, instructions or products referred to in the content. |
© 2024 by the authors. Licensee MDPI, Basel, Switzerland. This article is an open access article distributed under the terms and conditions of the Creative Commons Attribution (CC BY) license (https://creativecommons.org/licenses/by/4.0/).
Share and Cite
Zheng, Y.; Lan, S.; Zhao, J.; Liu, Y.; He, S.; Liu, C. Modeling the Effect of Greenways’ Multilevel Visual Characteristics on Thermal Perception in Summer Based on Bayesian Network and Computer Vision. Land 2024, 13, 1796. https://doi.org/10.3390/land13111796
Zheng Y, Lan S, Zhao J, Liu Y, He S, Liu C. Modeling the Effect of Greenways’ Multilevel Visual Characteristics on Thermal Perception in Summer Based on Bayesian Network and Computer Vision. Land. 2024; 13(11):1796. https://doi.org/10.3390/land13111796
Chicago/Turabian StyleZheng, Yongrong, Siren Lan, Jiayi Zhao, Yuhan Liu, Songjun He, and Chang Liu. 2024. "Modeling the Effect of Greenways’ Multilevel Visual Characteristics on Thermal Perception in Summer Based on Bayesian Network and Computer Vision" Land 13, no. 11: 1796. https://doi.org/10.3390/land13111796
APA StyleZheng, Y., Lan, S., Zhao, J., Liu, Y., He, S., & Liu, C. (2024). Modeling the Effect of Greenways’ Multilevel Visual Characteristics on Thermal Perception in Summer Based on Bayesian Network and Computer Vision. Land, 13(11), 1796. https://doi.org/10.3390/land13111796