Article

Coupling Coordination Relationships Between Ecosystems and Economic Development in Qinghai and Tibet

1
Key Laboratory of Land Surface Pattern and Simulation, Institute of Geographic Sciences and Natural Resources Research, Chinese Academy of Sciences, Beijing 100101, China
2
College of Resources and Environment, Chinese Academy of Sciences, Beijing 100049, China
*
Authors to whom correspondence should be addressed.
Land 2024, 13(11), 1766; https://doi.org/10.3390/land13111766
Submission received: 10 September 2024 / Revised: 13 October 2024 / Accepted: 21 October 2024 / Published: 28 October 2024

Abstract

:
The coordinated development of ecological protection and socioeconomics in the Tibetan Plateau is of great significance. This study examines the coupling coordination of urban ecosystems and economic development across 15 municipal administrative units in Qinghai Province and the Tibet Autonomous Region, the core areas of the Tibetan Plateau. The findings reveal that a larger proportion of the Qinghai and Tibet ecosystems are classified above the medium vulnerability level, primarily due to inherent natural geographic conditions. Additionally, the area of the two provinces and regions below the medium development level is larger, which is mainly influenced by indicators of economic strength and industrial structure. The degree of coupling coordination between the ecosystem and economic system in Qinghai and Tibet is predominantly driven by economic factors. Given the existing natural environmental conditions, the eastern regions of Qinghai and Tibet still possess certain development potential, while the economic development in the western areas is somewhat constrained by the natural environment. Based on this, further policy recommendations have been proposed to adjust and upgrade the industrial structure, aligning ecological protection with economic development in the Qinghai–Tibet Plateau. These recommendations aim to facilitate the formulation of strategies and policies for sustainable urban construction and social development in such high-ecological-value regions as the Tibetan Plateau.

1. Introduction

Sustainable development refers to “meeting the needs of the present without compromising the ability of future generations to meet their own needs” and embodies the human aspiration for development in harmony with natural systems [1]. The concept of human–land coupling highlights the connection between people and their environment, elucidating the organic integration of natural processes with human activities [2,3]. An understanding of this relationship is a primary focus of geographic research. Therefore, how to understand the complex interactions between socioeconomic systems and natural ecosystems scientifically urgently needs to be addressed in the context of human–land coupling theory and sustainable development [4]. However, in recent decades, as the scope of human activities has expanded and the intensity of regional construction has increased, the impact of human socioeconomic activities on natural ecosystems has become increasingly profound [5,6,7], significantly changing the structure and function of terrestrial surface ecosystems and increasingly highlighting the vulnerability of these ecosystems [8,9]. Multiple ecological issues, which continue to surface, are threatening the sustainable development of natural ecosystems and human societies.
The theories of sustainable development and human–land coupling provide a basis for a comprehensive analysis of ecosystems and economic systems [10]. Such analyses can facilitate a better understanding of the relationships of these systems and thus are important for ecosystem restoration, environmental governance, and policy regulation [11]. The coupling coordination degree (CCD) model is a concept derived from physics that can be used to describe the degree of interdependence and mutual constraints between different systems or elements, making it well-suited for exploring the interactions among two or more subsystems. [12,13]. It relies on the mutual influences of elements at temporal and spatial scales to reveal the characteristics and patterns that lead to the evolution of systems [14]. Each system evolves from disorder to order to facilitate its coordinated development. The coupling coordination model was used to explore correlations between environmental performance and human well-being in each province of China; the findings show that a low CCD is distributed mainly in the central and western regions of China [15]. The logical coupling framework for ecosystem services and human well-being in Guangzhou constructed by a coupling coordination model reveals a coercive relationship between ecosystem services and human well-being [16]. There are complex interactions between ecosystems and economic systems, and the coupled coordination model is a widely used method for exploring the relationship between them. Current research in this field is focused primarily on densely populated areas, regions with relatively developed social economies, and important river basins [17,18]. However, for regions endowed with high ecological value, the coordination of ecological and economic development merits equal attention. Most of the studies aim at revealing the spatiotemporal variation characteristics among multiple systems, while the important driving and acting factors behind their characteristics still need to be explored in depth. In addition, numerous methods are utilized for selecting indicators. For example, Zhang et al. evaluated the natural environment in terms of ecosystem service value when conducting a human-centric inquiry into the coupled relationship between the environment and the economy [19]. Zhang et al. integrated a diverse array of ecological and environmental variables, encompassing environmental pollution, governance, and protection [20]. They combined these with socioeconomic development indicators to investigate the synergistic development within the Yangtze River Economic Belt, a region experiencing rapid urbanization.
Further exploration is needed for the study of unique alpine climate regions, particularly those like Qinghai and Tibet that are predominantly focused on ecosystem protection [21,22]. The Tibetan Plateau holds significant ecological and economic value and has a significant impact on the ecological stability and security of China and even the Asian region [23,24]. Because it is an important ecological security barrier in China, maintaining its stability and sustainability is crucial for future sustainable development [25]. Qinghai Province and the Tibet Autonomous Region are situated in the center of the Tibetan Plateau, one of the most extensive and highest-elevation areas in the region. Their natural environments are extremely fragile and sensitive, with characteristics typical of the Tibetan Plateau in terms of altitude, climatic conditions, and natural surroundings [26,27,28]. Due to the uniqueness of their natural environments, China’s development policy for them emphasizes the coexistence of conservation and development, with cautious economic development. Therefore, it is essential to explore the interplay and interdependence between ecosystems and economic systems in various cities within Qinghai Province and the Tibet autonomous region to determine their future developmental directions.
This study aimed to reveal the interdependence between the ecological system and the socioeconomic system in high-altitude cold climate cities and their development patterns. The year 2020 was chosen as the period, and 15 municipal-level administrative units in the most representative areas in Qinghai Province and the Tibet Autonomous Region on the Tibetan Plateau were selected as the study locations. In this study, the vulnerability of ecosystems was chosen as a key metric to evaluate natural ecosystems, reflecting their inherent attributes [29]. Ecological vulnerability refers to the degree to which ecosystems are susceptible to the adverse effects of external disturbances and diagnoses the state of regional ecosystems [30,31]. The socioeconomic system is also a diverse and complex integrated system. The level of economic development, which refers to the scale, speed, and standards achieved in regional development, can intuitively reflect the overall development strength of a region [32]. The economic development level evaluation system was employed to assess the socioeconomic conditions of Qinghai and Tibet, providing an intuitive reflection of their overall development strength. Exploring the coupling and coordination relationship between the two offers a scientific foundation for ecological protection and high-quality development on the Tibetan Plateau. Furthermore, it serves as a valuable reference for the social and economic advancement of other ecologically crucial global areas.

2. Materials and Methods

2.1. Study Area

The study area is Qinghai Province and the Tibet Autonomous Region, two provincial-level administrative units that account for the majority of the Tibetan Plateau and thus can reflect its overall situation. The Tibetan Plateau, situated in southwestern China, is the cradle of numerous major rivers in Asia. Spanning approximately 2.5 million square kilometers, it constitutes about a quarter of China’s total land area. Qinghai Province and the Tibet Autonomous Region are pivotal administrative regions on the Tibetan Plateau, covering most of its expanse. These regions are central to the Plateau and largely represent its overall condition. This area comprises a total of 15 municipal administrative units, as shown in Table 1, including 8 in Qinghai Province and 7 in the Tibet Autonomous Region (Figure 1).

2.2. Data Sources

The geospatial data employed in this research included meteorological, topographic, vegetation, land use, and soil data from Qinghai Province and the Tibet Autonomous Region in 2020. The specific data and sources are detailed in Table 2. The socioeconomic data for Qinghai Province and the Tibet Autonomous Region in 2020 were derived from the Statistical Yearbooks [33,34] and the Bulletin of National Economic and Social Development Statistics [35,36] of Qinghai and Tibet in 2021, respectively.

2.3. Research Methodology

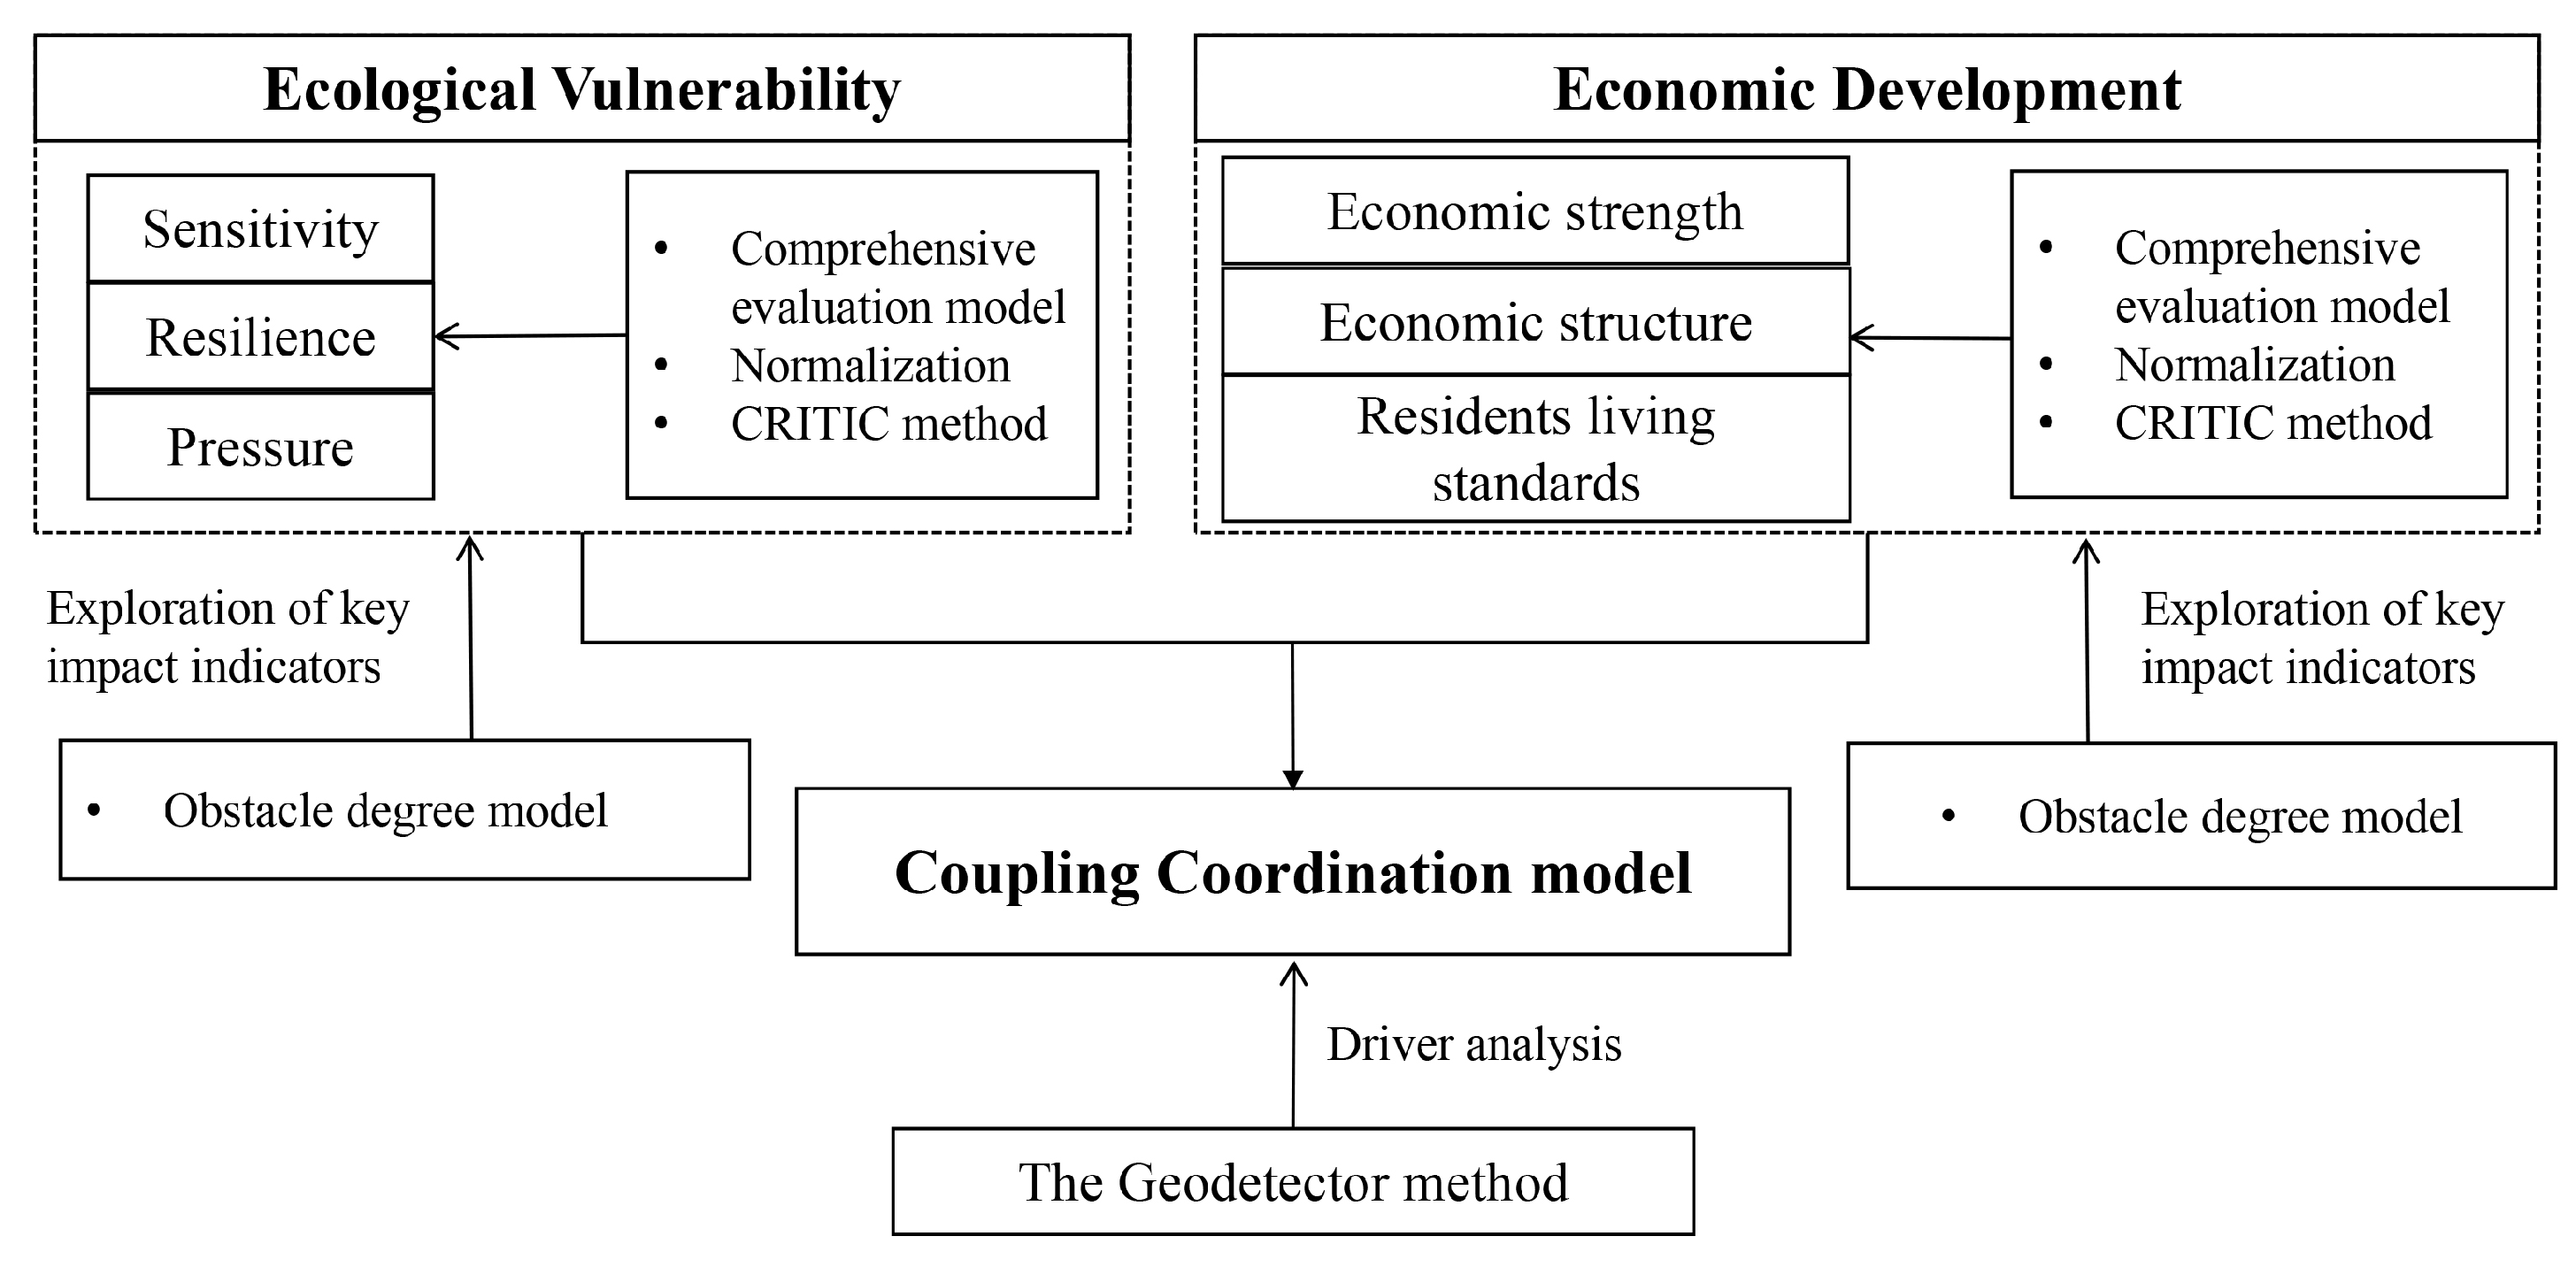
This study first constructed an ecological vulnerability evaluation index system for Qinghai–Tibet based on the criteria of sensitivity, resilience, and pressure, and an economic development level evaluation index system based on the criteria of economic strength, living standards, and economic structure. The normalized indicators and weights obtained via the CRITIC method were used in a comprehensive evaluation model to calculate the evaluation results. The obstacle degree model was then utilized to explore the most influential factors in the index system. Subsequently, the coupling coordination degree model was employed to investigate the relationship between ecological vulnerability and economic development level in Qinghai and Tibet. The geographic detector was used to reveal the driving factors behind the spatial distribution characteristics of the coupling coordination degree between the two systems. The methodological framework of the study is shown in Figure 2.

2.3.1. Indicators of Ecological Vulnerability

Combining relevant research with data accessibility, an ecological vulnerability evaluation index system for Qinghai Tibet based on the basic concept of vulnerability was constructed [46,47]. The factors chosen include sensitivity, resilience, and pressure at the element level. Sensitivity refers to the degree of sensitivity of an ecosystem to disturbances, reflecting its ability to resist disturbances; in this study, climate and topography-related indicators that can reflect the natural geographic conditions of the region itself were selected. Resilience is the capacity of an ecosystem to self-regulate and recover when it is subjected to disturbances and stresses; in this study, the composition structure, and habitat quality of the ecosystem were considered primarily from a vegetation perspective. Pressure refers to the pressures that human society imposes on an ecosystem and is commonly considered in soil and land use studies. Based on the meanings of the aforementioned factor layers, 12 indicators across 6 aspects, including climate, topography, vegetation, habitat, soil, and land use, were introduced to evaluate ecological vulnerability (Table 3).

2.3.2. Evaluation Index System of Economic Development Level

The focus of this study was the scientific validity and representativeness of the selected indicators and the availability of data. The economic development of Qinghai and Tibet is measured mainly by criteria layers such as economic strength, economic structure, and residents’ living standards [48,49]. The final selection comprises 11 indicators to construct the assessment system for economic development (Table 4). Economic strength primarily considers GDP, fixed asset investment, and fiscal revenue. The economic structure reflects the status of industrial composition. Residents’ living standards are mainly reflected in urbanization and consumption levels.

2.3.3. CRITIC Method

The CRITIC (Criteria Importance Through Intercriteria Correlation) method was chosen to determine the weights of the indicators within the 2 evaluation systems. This objective weighting technique relies on the comparative intensity and conflict among the evaluation indicators, as delineated by Diakoulaki et al. [50]. The comparative intensity reflects the magnitude of the value discrepancies across different evaluation schemes for a given indicator, typically quantified by the standard deviation. A higher standard deviation signifies greater variability and, consequently, a larger weight. Conflict, on the other hand, is derived from the correlation among indicators; a stronger correlation implies less conflict and, thus, a smaller weight. Because there may be duplication between indicators in the process of evaluating ecological vulnerability and economic development, this method can reduce the impact of duplication to a certain extent, thereby reducing the uncertainty in the assessment. The method’s computational formula is presented as follows:
P j = S j i = 1 n ( 1 r i j ) ,
W j = P j j = 1 n P j ,
where P j denotes the amount of information of the j th index in the index assessment system, S j denotes the standard deviation of the j th index, and r i j represents the correlation coefficient between the i th index and the j th index. Equation (2) is the weight expression and W j represents the objective weight value assigned to the j th index.

2.3.4. Obstacle Degree Model

Further exploration of the factors that have the greatest impact on the regional assessment system among the indices, the obstacle degree model was introduced [51]. The computational formula is delineated as follows:
O i j = I i j w i j j = 1 n I i j w i j ,
where O i j is the factor contribution, and w i j is the contribution of a certain factor to the overall goal, usually expressed in terms of the weight of the factor. I i j is the degree of deviation, which represents the discrepancy between the actual value and the optimal value of each indicator.

2.3.5. Coupling Coordination Model

In this study, the model is applied to reflect the level of coordinated development and dynamic equilibrium relationship between ecosystems and economic systems. Coupling coordination can be employed to assess the interactions and mutual influences among two or more systems [52,53] and measure the equilibrium state of components both within these systems or among them during the development process, focusing on benign interactions. The formula is presented as follows:
D = C × T ,
T = α f ( x ) + β g ( y ) ,
C = f ( x ) × g ( y ) f ( x ) + g ( y ) 2 1 2 ,
f ( x ) = i + 1 n ω i X i ,   g ( y ) = j + 1 m ω j Y j ,
where f ( x ) and g ( y ) are the assessment function of ecological vulnerability and economic development, ω i and ω j are the weights of the i -th and j -th indicators, n and m are the number of indicators, and X i and Y j are the normalized index values of the i -th and j -th indicators; T is the integrated valuation of the two major systems of ecological and economic; α and β are the coefficients to be determined, which indicate the importance of the interaction between the two systems, and the value is α = β = 0.5 ; T and C represent the coordination index and coupling index, respectively; and D is the coupling coordination index. The higher the CCD is, the stronger the system effect between the ecosystem and the economic system. Additionally, drawing on existing research results, coupled coordination mechanisms are categorized according to the relationships between ecosystems and economic systems Table 5.

2.3.6. The Geodetector Method

Geodetector is a novel statistical tool that can deeply analyze the spatial differentiation characteristics of geographic elements and reveal the potential driving factors behind them [54]. In this study, the factor detector and interaction detector were used to analyze the contributions of typical ecological and economic factors to the coupling coordination level of two systems. The factor detector can detect the extent of the impact of different explanatory factors on the target variable, thereby revealing the driving factors behind the coupling coordination level to some extent [55]. The q value, which ranges from 0 to 1, is used to measure this impact, with values closer to 1 indicating greater spatial differentiation and stronger explanatory power of the factors for the coupling coordination degree. The interaction detector is used to measure the interaction between pairs of characteristic elements, i.e., the strength of the combined effect of two factors compared to the effect of each factor.

3. Analysis of Results

3.1. Characteristics of the Spatial Distribution of Ecological Vulnerability in Qinghai and Tibet

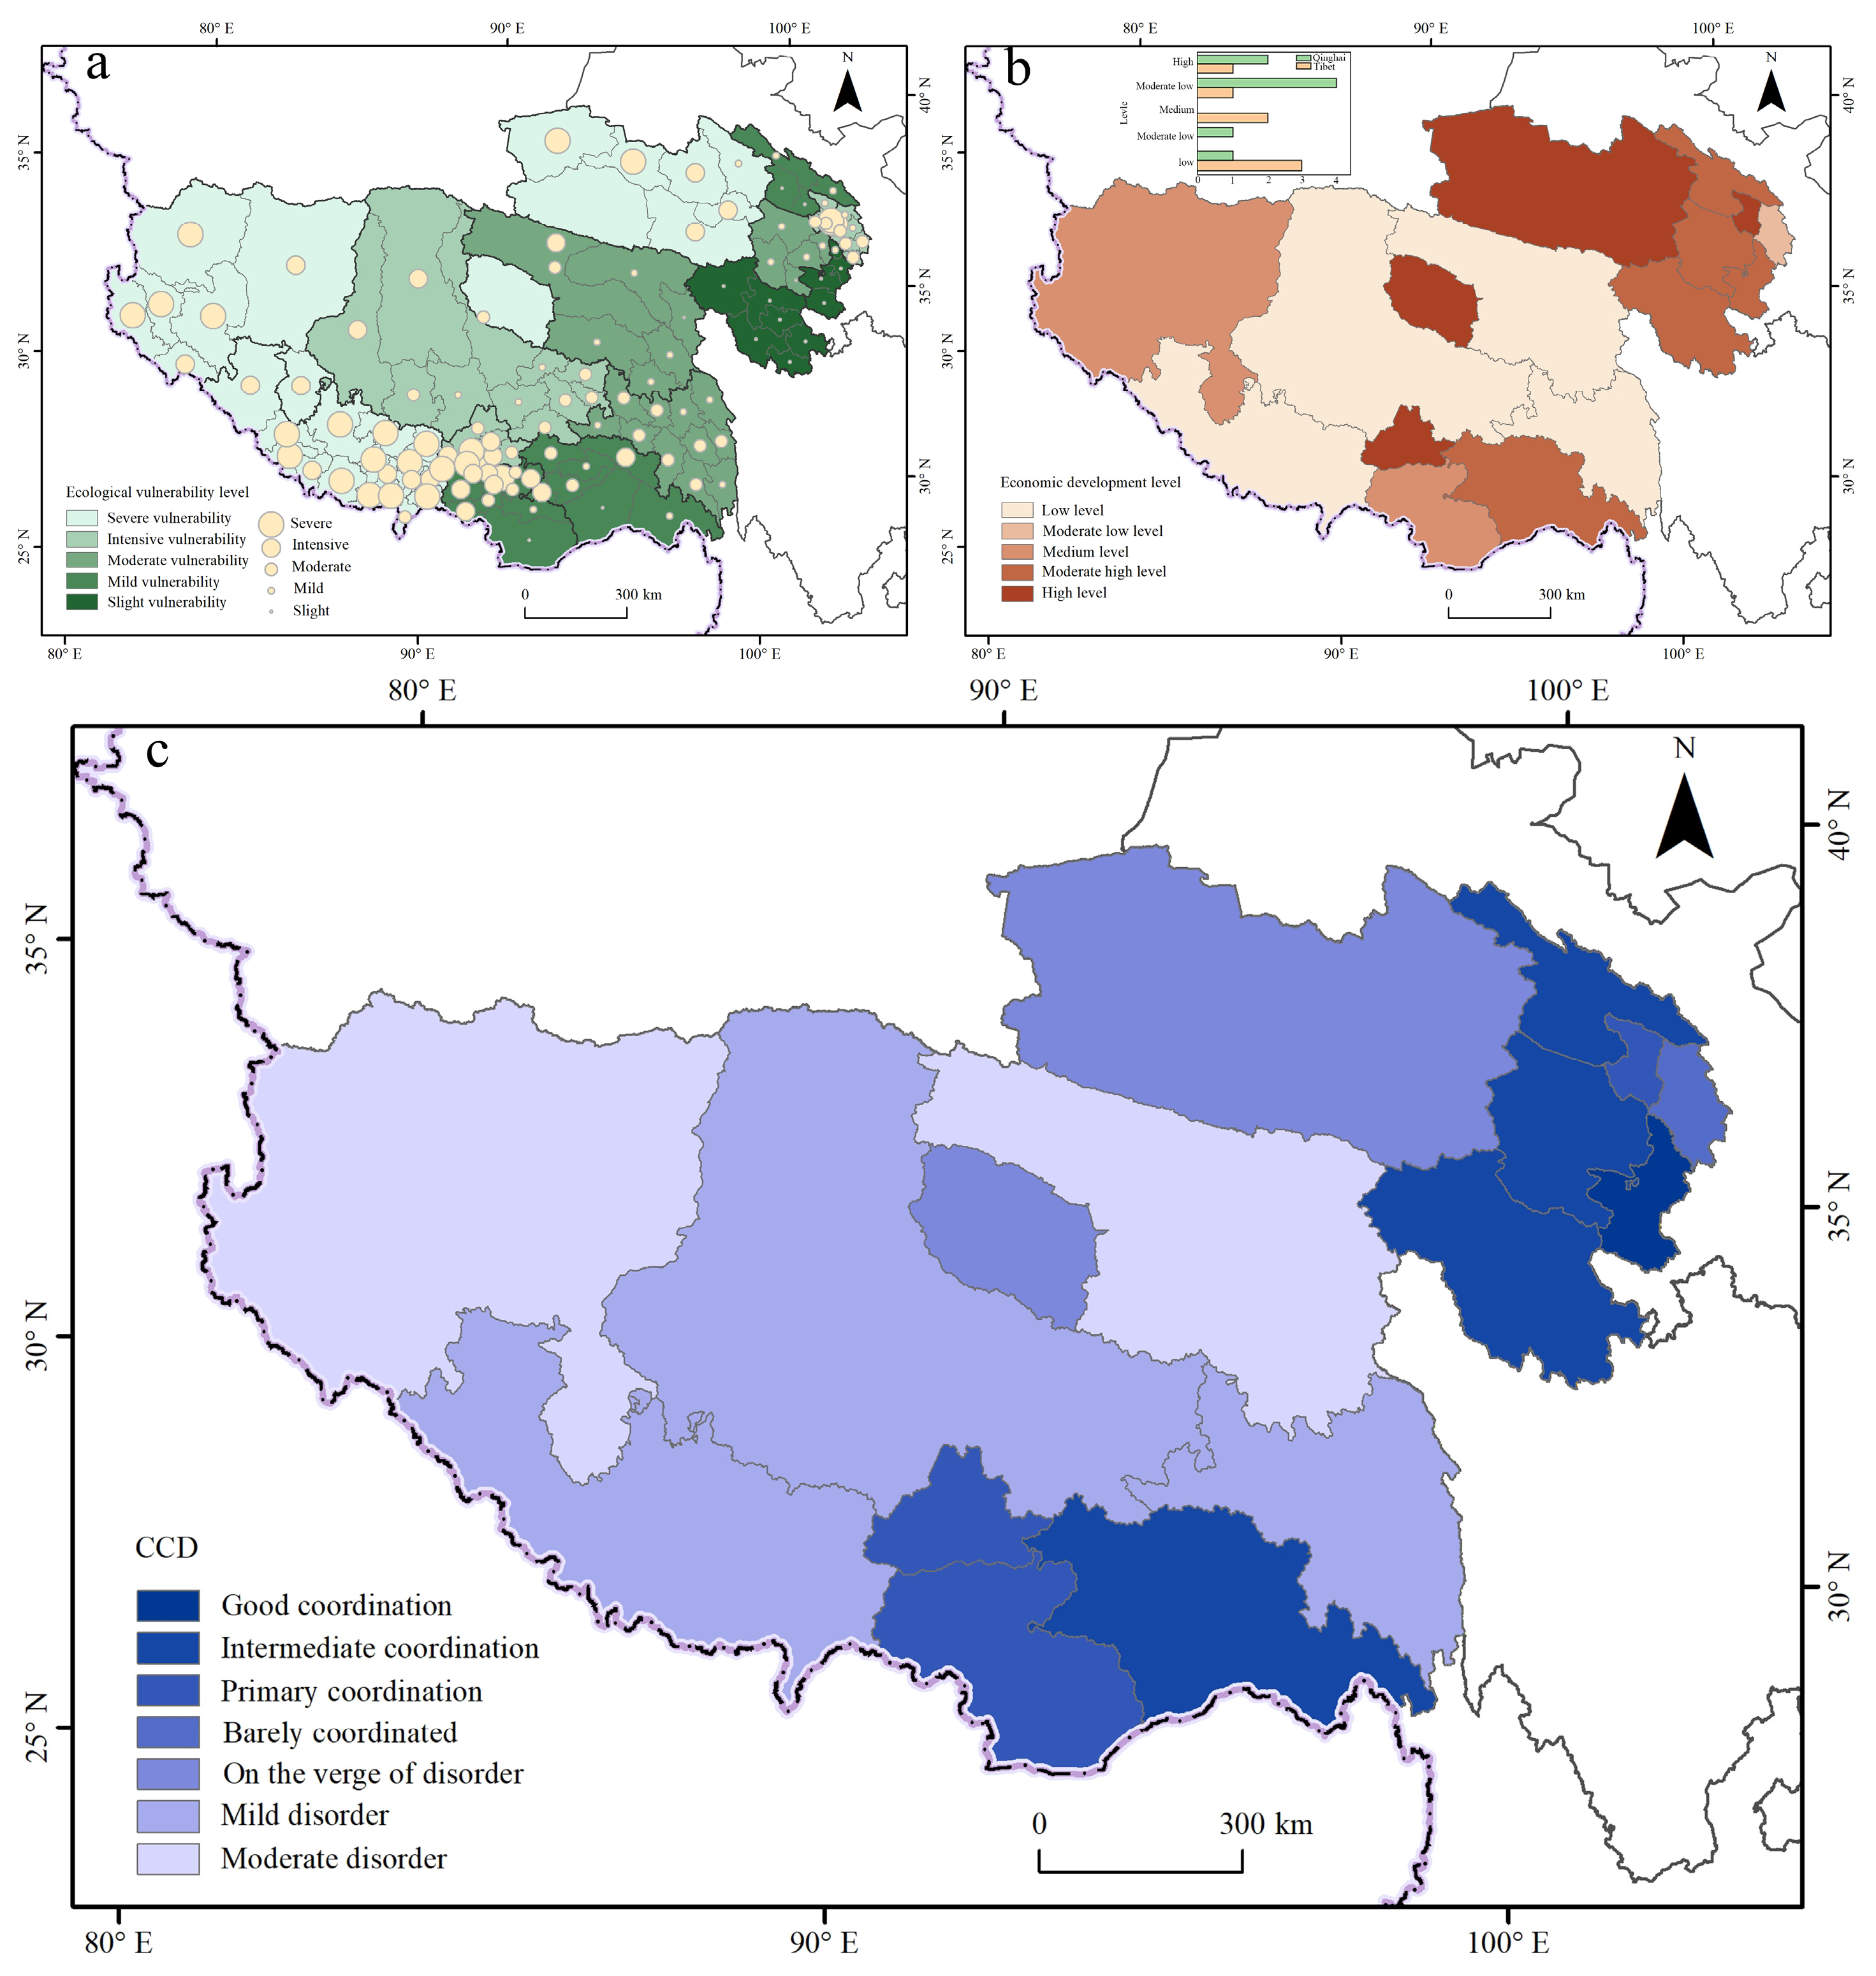
The results of the ecological vulnerability assessment in Qinghai and Tibet are shown in Figure 3a, indicating that the spatial distribution of ecological vulnerability is higher in the northern, western, and southwestern regions and lower in the central, eastern, and southeastern regions. Areas of severe vulnerability are concentrated mainly in the western part of Ngari, the northwestern part of Haixi, the southern part of Lhasa, and most of Shigatse. The slightly vulnerable areas are distributed mainly in Golog and Huangnan and the southern part of Shannan and Nyingchi. At the county administrative district level, 79 counties are at the moderately ecologically vulnerable and above levels, accounting for 66.4% of the total. Among them, the number of counties with moderate levels of ecological vulnerability is the largest, at 28, accounting for 23.5% of the total. Twenty-five counties exhibit severe levels of ecological vulnerability, accounting for 21.0% of the total. Finally, only 15 counties have slightly ecologically vulnerable levels, accounting for 12.6% of the total.
Among the 15 prefecture-level city administrative units, only 2 cities/prefectures in Qinghai Province, Golog and Huangnan, have slightly vulnerable ecosystems. There are 10 cities/prefectures with moderate levels or above of ecological vulnerability, accounting for 33.3% of the total; Xining and Haidong have intensive levels of ecological vulnerability; and the ecosystems of Haixi, Ngari, and Shigatse have severe levels of ecological vulnerability. These indicate that the area with ecosystem vulnerability levels above medium is relatively large, and the ecosystems of Qinghai and Tibet are susceptible to changes due to disturbances from external factors.
According to the selection method of the indicator system in Section 2.3.1, an obstacle factor analysis of results of the ecological vulnerability assessment at the city/prefecture level was carried out for the three target layers of sensitivity, resilience, pressure, and the 13 index layers. The results show that 9 of the 15 cities/prefectures have the highest degree of sensitivity barrier, and 6 cities/prefectures have the highest degree of resilience barrier, indicating that sensitivity has the most severe influence on the ecological vulnerability of each city/prefecture, followed by resilience. Sensitivity includes factors such as temperature, precipitation, evapotranspiration, altitude, and slope, while resilience is related to vegetation and habitat quality.
The ecological vulnerability levels of Qinghai and Tibet are affected mainly by natural and geographical conditions. Among the 13 indicators, the human disturbance index has the highest degree of effect on the ecological vulnerability of Lhoka, Lhasa, Shigatse, Qamdo, Nyingchi, Golog, Ngari, and Huangnan; the slope factor has the most substantial effect on the ecological vulnerability of Hainan, Xining, and Nagqu; and the potential evapotranspiration factor has the most critical impact on the ecological vulnerability of Haibei and Yushu. In addition, the ecological vulnerability of Haidong is affected mainly by two topographic factors: elevation and slope. Haixi is strongly affected by the human disturbance index and slope. The ecological vulnerability of Nagqu is predominantly determined by the slope and human disturbance index.

3.2. Spatial Distribution Characteristics of Economic Development in Qinghai and Tibet

As expressed in Figure 3b, the spatial distribution of the economic development level in Qinghai and Tibet indicates that Xining and Lhasa are at the centers of high economic development areas and have the highest levels of economic development, which radiates outward; the levels gradually decrease with distance. The results show that only three cities/prefectures, Haixi, Xining, and Lhasa, in Qinghai and Tibet have high economic development levels, while Yushu, Qamdo, Shigatse, and Nagqu have the lowest economic development levels. There are five cities/prefectures below the medium economic development level, accounting for 33.3% of the total. Further analysis of their situations revealed that six of the eight cities/prefectures in Qinghai Province are at a moderately high level of economic development and above, and two are at a moderately low level of economic development and below, whereas only two of the seven cities/regions in the Tibet Autonomous Region are at a moderately high level of economic development and above, and five are at a moderately low level of economic development and below; thus, the overall level of economic development in Tibet is lower than that in Qinghai. Therefore, the economic development level of Tibet as a whole is lower than that of Qinghai.
According to the selection method of the indicator system in Section 2.3.2, the obstacle factor analysis was carried out using the three criterion layers of economic strength, economic structure, and residents’ living standard and eleven index layers of the economic development level in Qinghai and Tibet. The results showed that 10 of the 15 cities/prefectures have the highest degree of barriers to economic strength, 4 cities/prefectures have the highest degree of barriers to economic structure, and 1 city/prefecture has the highest degree of barriers to residents’ living standards.
Among the 11 indicators, the fixed asset investment growth rate index has the greatest obstacle to Haidong, Haixi, and Xining. The per capita fiscal income index has the greatest impact on the economic development levels of Shannan, Shigatse, Qamdo, and Nyingchi. The proportion of tertiary industry to GDP has the greatest impact on Hainan and Yushu. Total tourism revenue has the most severe influence on the level of economic development in Golog, Haibei, and Huangnan. In addition, the economic development level of Haibei is affected by two main factors: the proportion of secondary industry to GDP and total tourism revenue. Haixi is greatly affected by two factors: the fixed asset investment growth rate and the proportion of tertiary industry to GDP. The level of economic development in Lhasa is determined mainly by the growth rate of per capita fiscal income and fixed asset investment.

3.3. Coupling and Coordination Relationships and Driving Factors Between Ecological Vulnerability and Economic Development Level

3.3.1. Analysis of the Coupling Coordination Results

The Tibetan Plateau is an important ecological security barrier in China, and its ecosystems are susceptible to change due to external disturbances, making them typical ecologically fragile and sensitive areas. Due to its vital ecological functions and the fragility and sensitivity of the natural environment, its social and economic development is restricted to a certain extent. To further explore the relationship between the ecosystem and the economic system of Qinghai and Tibet, the results of the ecological vulnerability assessment and socioeconomic level assessment of the municipal administrative units were calculated and analyzed using the CCD. Among them, ecological vulnerability is a negative indicator of natural ecological status, and economic development is a positive indicator. The greater the CCD is, the stronger the benign mutual promotion relationship between regional ecosystems and economic systems.
Figure 3c shows the CCD between the ecosystem and economic system in 15 cities/prefectures in Qinghai and Tibet. The overall distribution pattern shows a higher CCD in eastern Qinghai and southeastern Tibet and a lower CCD in southwestern Qinghai and western Tibet. Six cities/prefectures in the two provinces and regions of Qinghai and Tibet are in a state of dislocation, accounting for 40.0% of the total. Among them, the ecosystem and economic systems of Ngari and Yushu are in a state of moderate disorder; Nagqu, Shigatse, and Qamdo are mildly disordered; and Haixi is verging on disorder. The other nine cities/prefectures are in a state of coordination, accounting for 60.0% of the total, of which Haidong is barely coordinated. Three cities/prefectures have primary coordination: Lhasa, Shannan, and Xining. The other five cities/prefectures have intermediate and good coordination, representing a higher level of coordination, and account for 33.3% of the total; Huangnan has the highest level of coordination—i.e., good coordination.

3.3.2. Driving Factor Analysis

The Geodetector method was introduced to explore the driving force of the CCD between ecosystems and economic systems in Qinghai and Tibet. The driving factors included the four factors of elevation, annual average temperature, annual average precipitation, and NDVI in the natural environment, as well as the economic factors such as per capita GDP, urbanization rate, the proportion of primary industry, and the proportion of secondary industry (Table 6). Before using Geodetector, the natural breakpoint method was used to process the eight independent variables in a hierarchical manner, and the data were sampled via sampling points established using the fishnet tool in ArcGIS 10.6, which ultimately yielded 1184 sets of valid data.
The results show that (Table 7) all eight influencing factors passed the significance test and influenced the spatial distribution pattern of the coupled coordination results. Among them, the proportion of primary industry to GDP is the dominant factor affecting the coupling coordination results, with an explanatory power of 83.3%. The natural factors of elevation (X1), annual average precipitation (X2), and the economic factors of per capita GDP (X5), and urbanization rate (X6) are the next highest, exceeding 30%; the order of explanatory power is as follows: urbanization rate > per capita GDP > annual average precipitation to GDP > elevation. The explanatory power of the other influencing factors is ranked as follows: NDVI > proportion of secondary industry to GDP > annual average temperature.
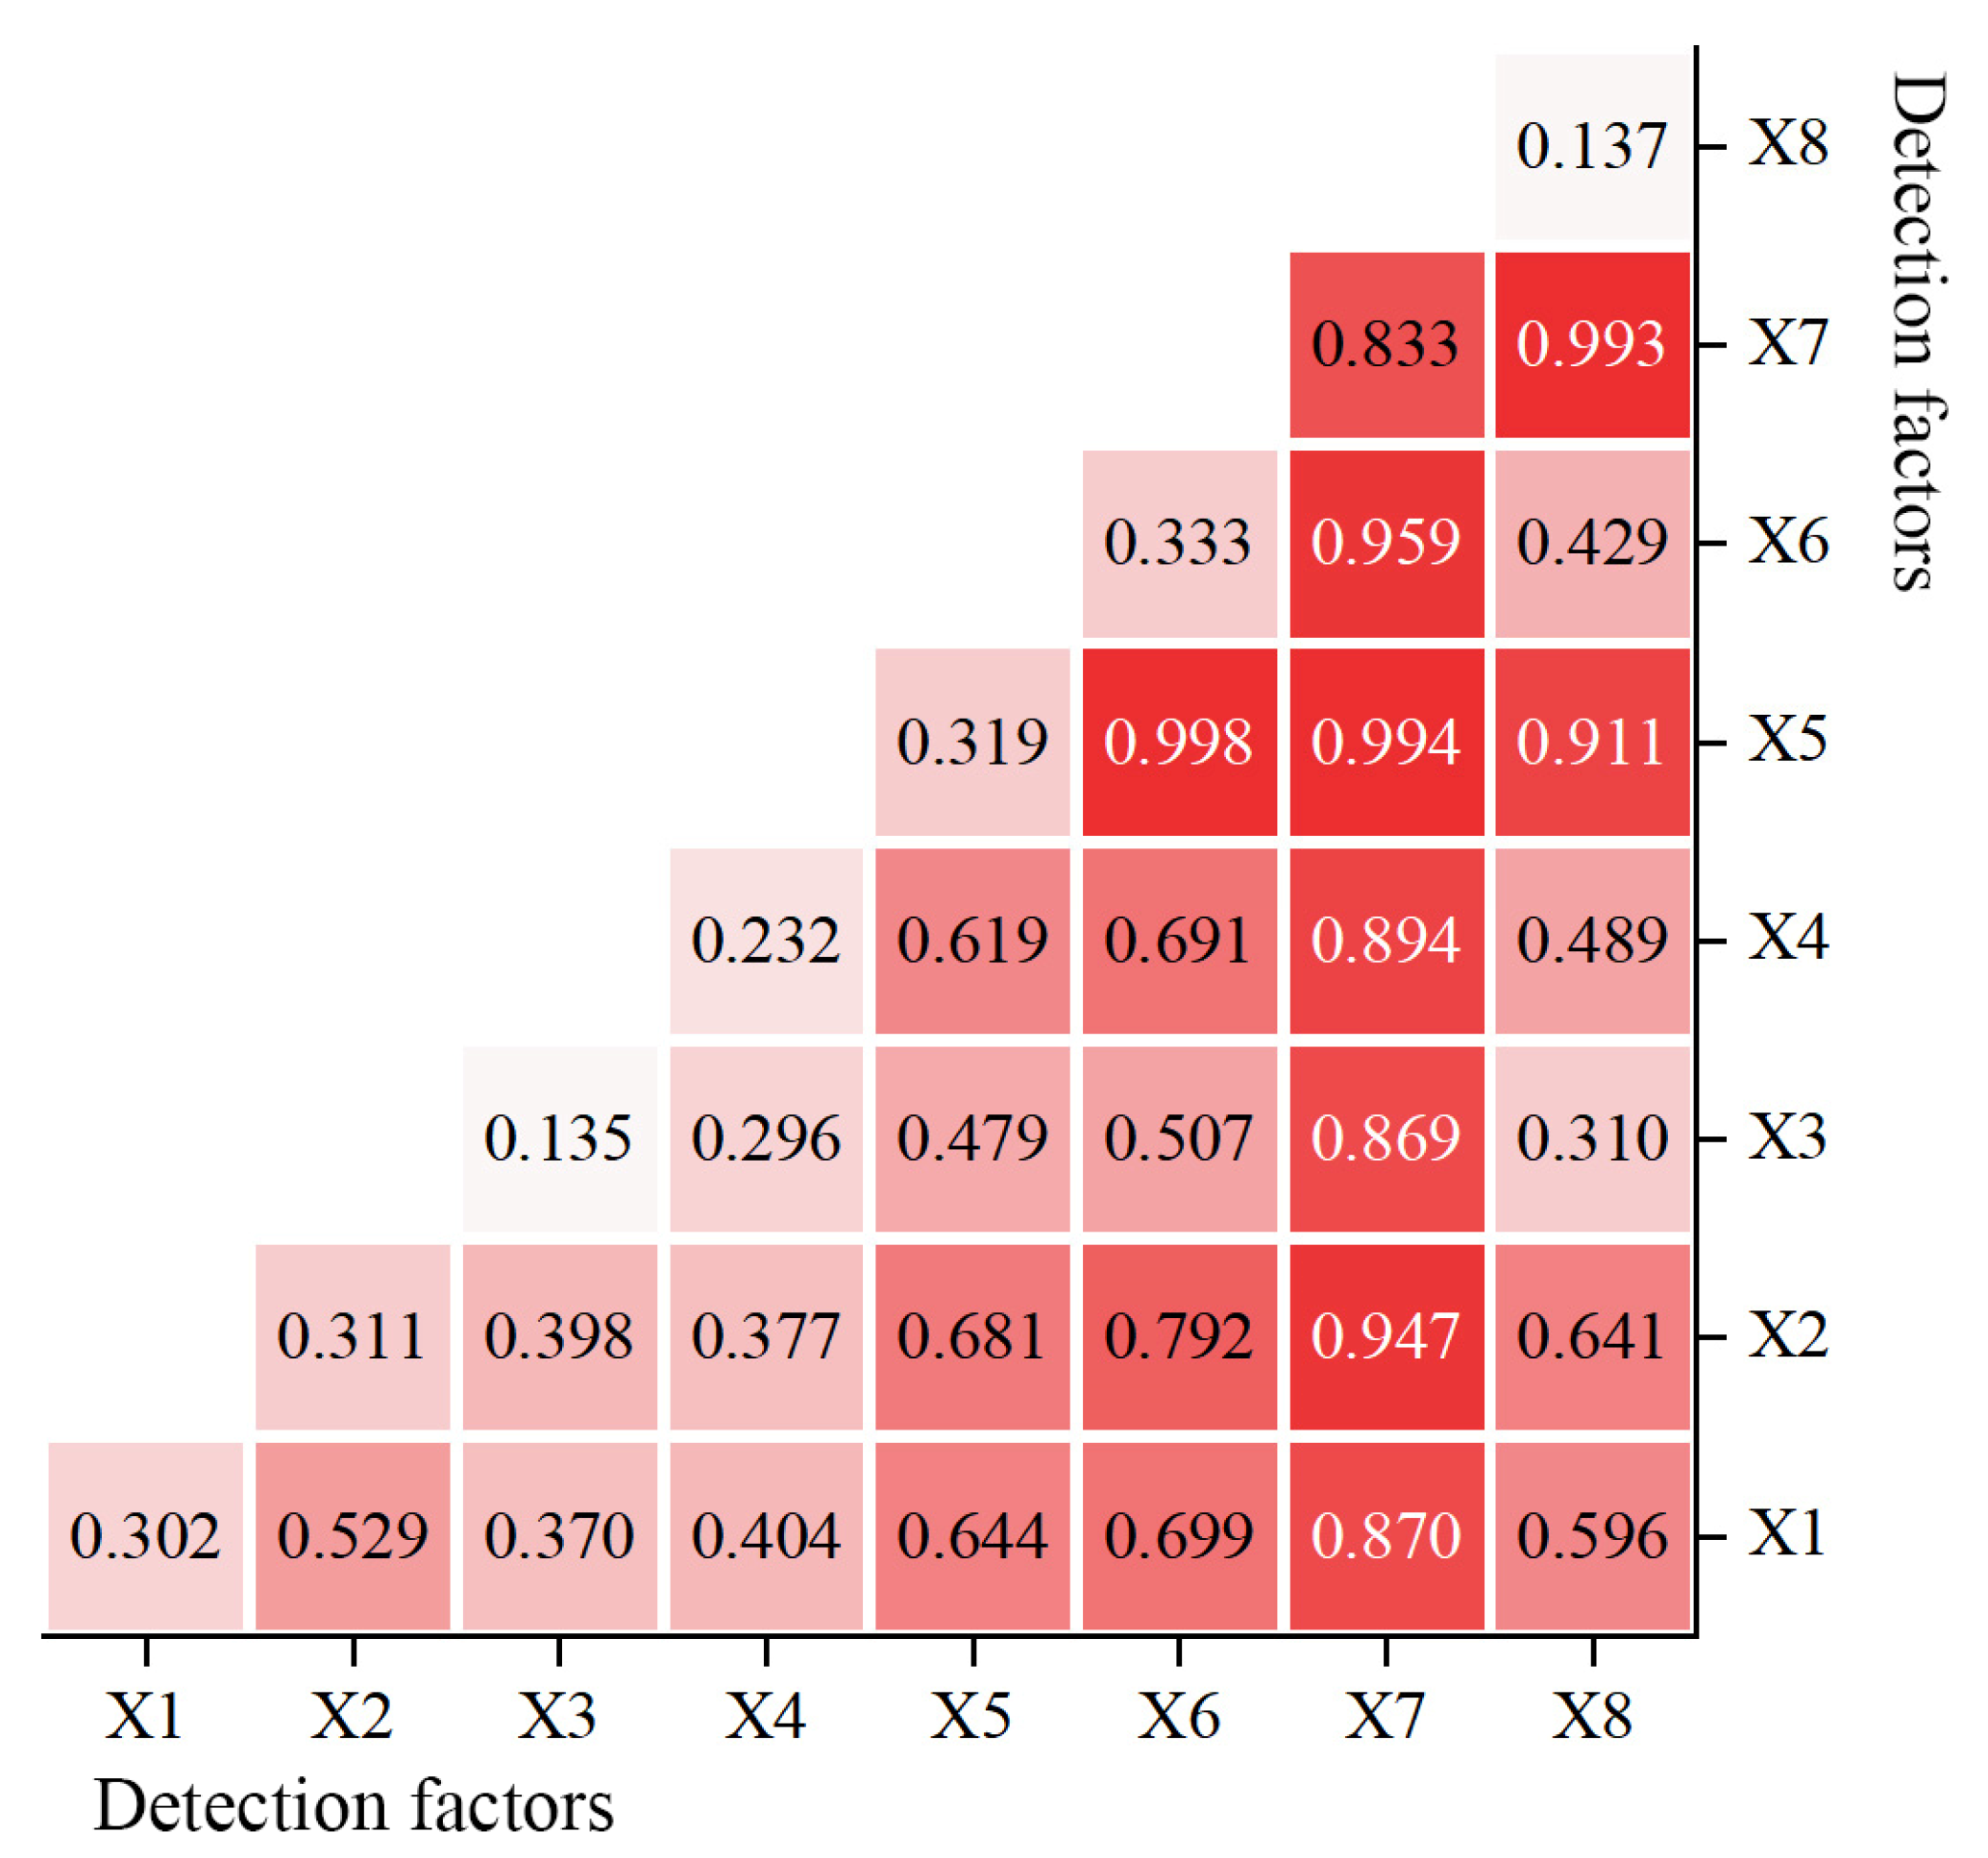
The results of the interaction detector (Figure 4) show that the two-factor interaction further enhances the explanatory power of the coupling coordination results, with a nonlinear enhancement between them. The interaction of X7 with the other seven factors is significantly greater than that of the other factors; in particular, the interaction of X5 and X6 have the most significant effect on the results of the coupled coordination, and its q value reaches 0.998. In addition, the explanatory power of the two-factor combination of X5 and X6, and X5 and X8, are the most significant, ranging from approximately 0.3 for the single factor to over 0.9 for the two-factor combination. Through the detection of driving factors, we found that the CCD between ecosystems and economic systems in Qinghai and Tibet is determined mainly by economic factors, but to a certain extent, it is also influenced by natural environmental factors such as altitude and temperature.
By further analyzing the two-factor interaction between natural and socioeconomic factors, it can be seen that the interaction between the proportion of the primary industry in GDP and various natural ecological factors is the strongest. The average annual temperature interacts most strongly with various socioeconomic factors, followed by elevation and NDVI. Since the proportion of the primary industry is a negative indicator in the evaluation system of economic development level, more attention should be paid to the transformation and upgrading of the primary industry in the future economic development of the Qinghai–Tibet region.

3.4. Models and Strategies of Development

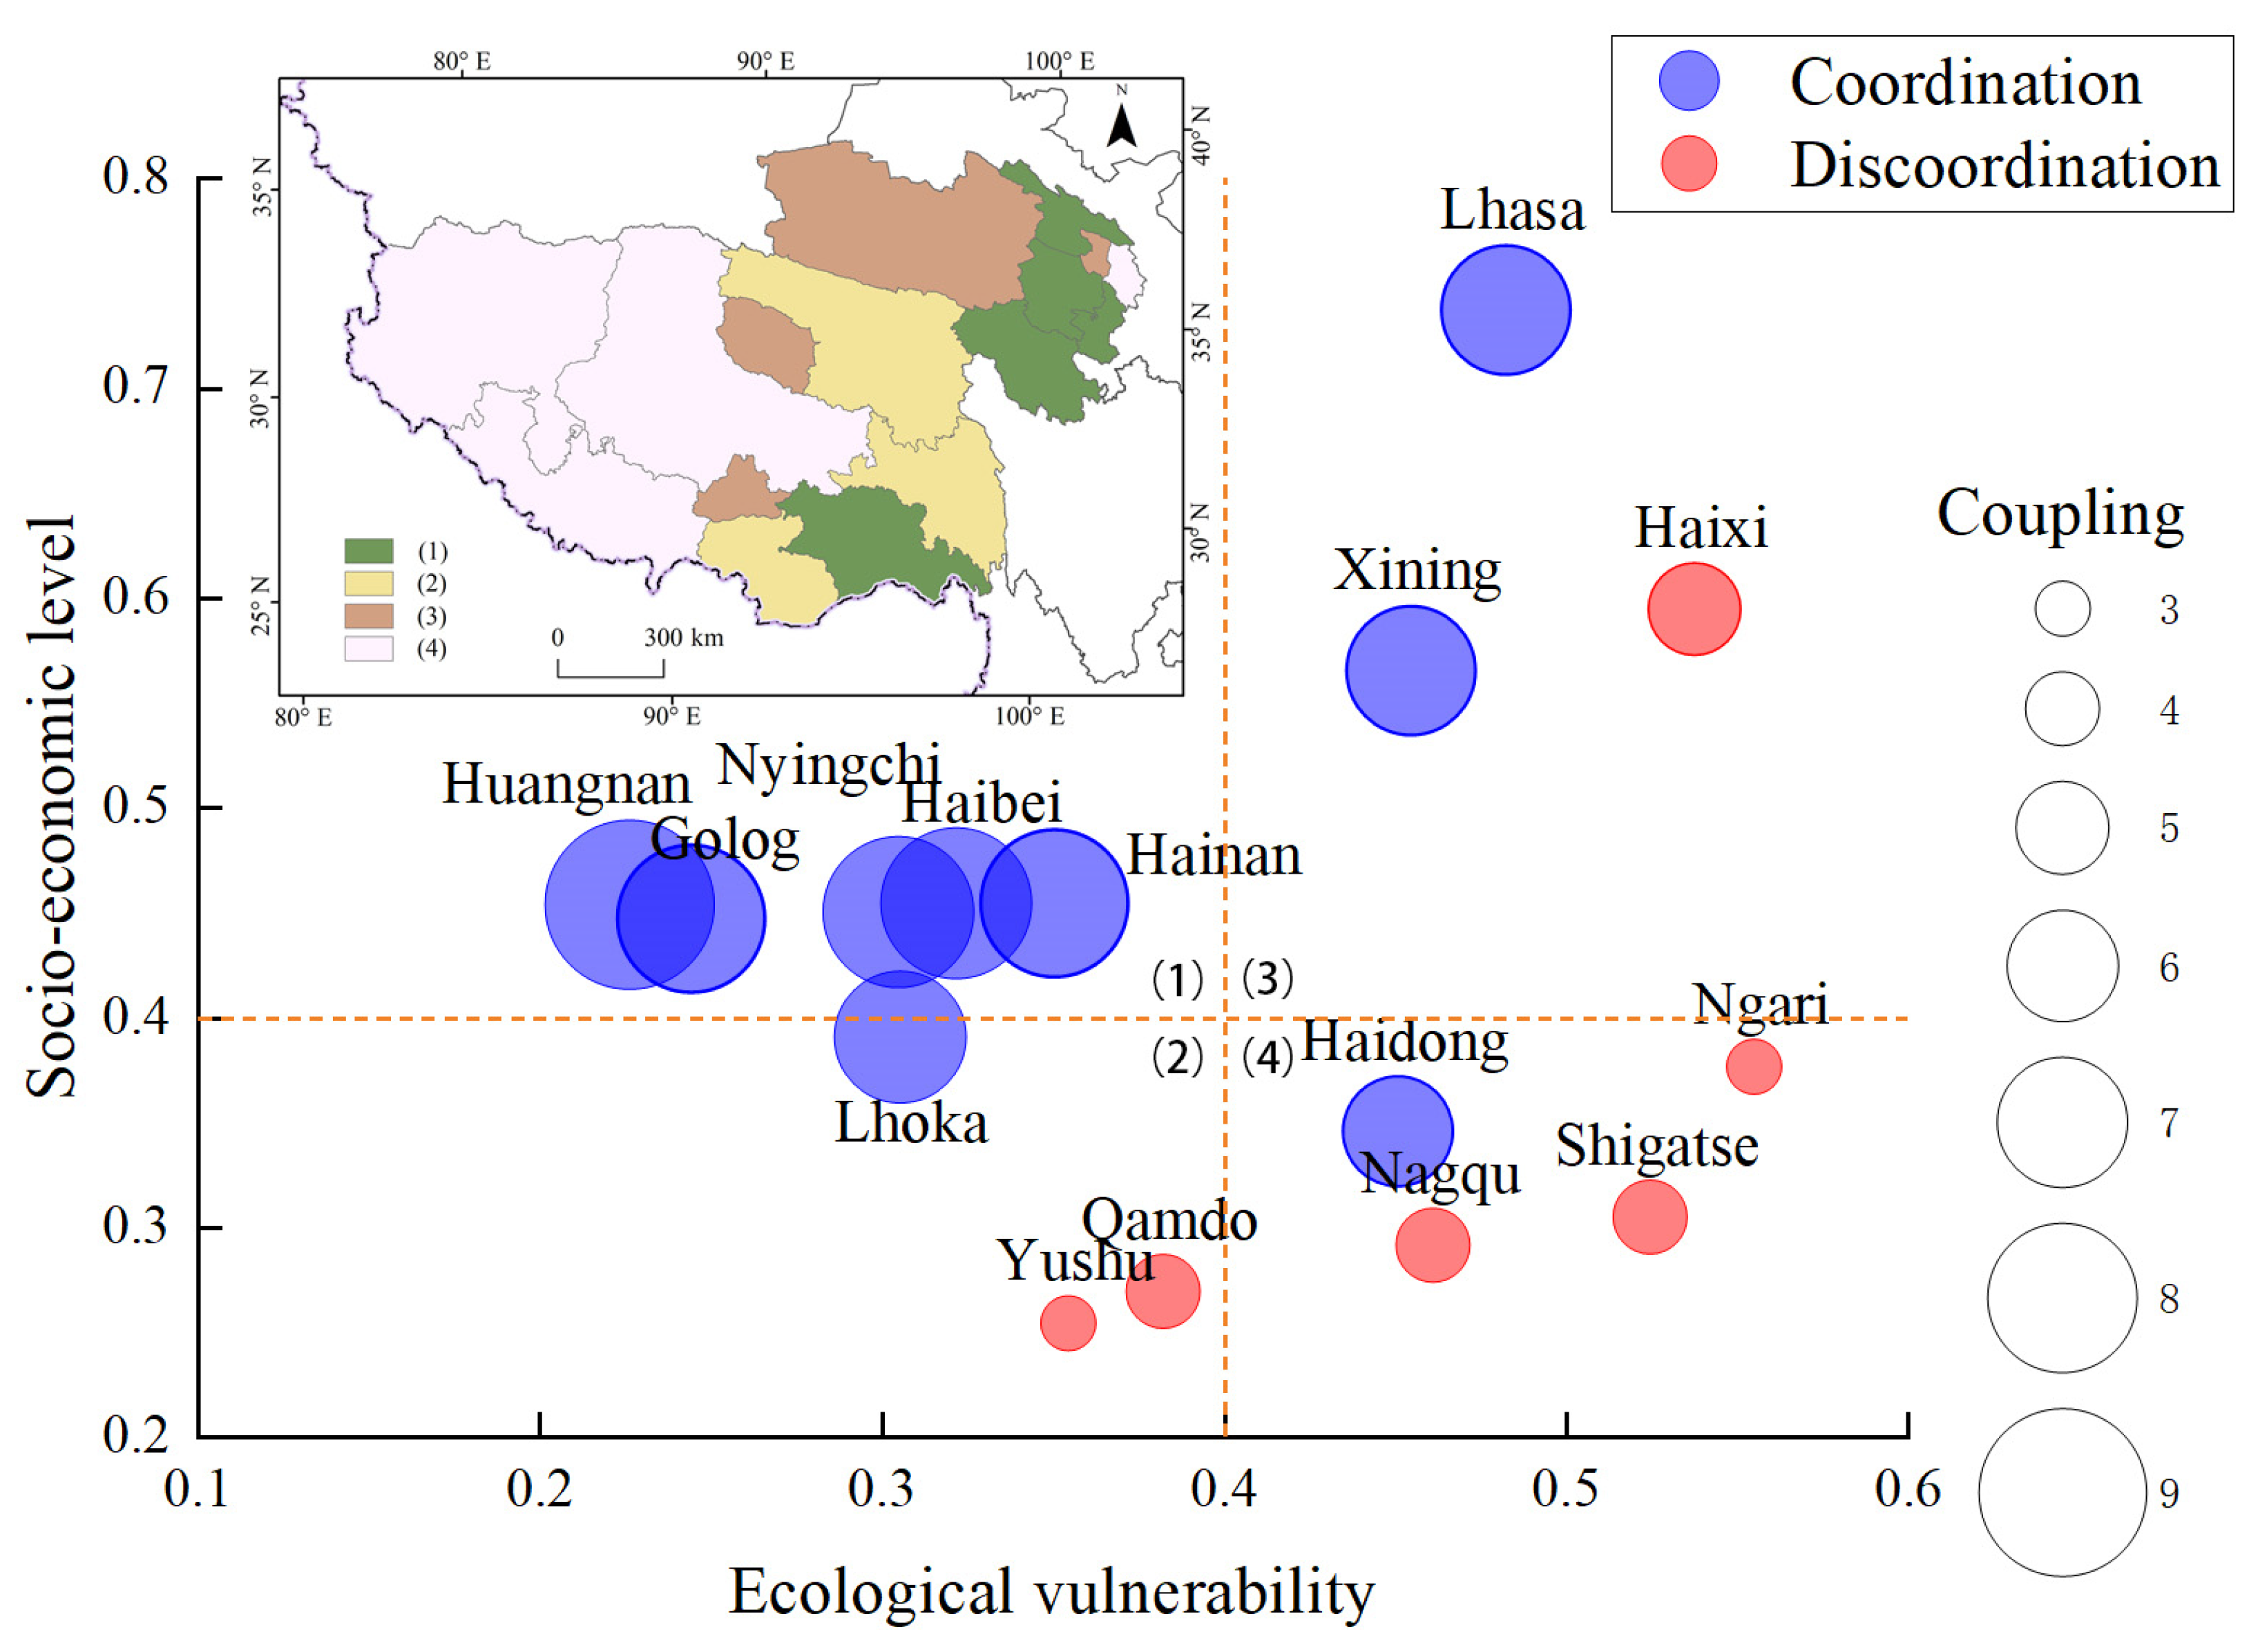
To further explore the relationships among ecosystems, economic systems, and coupled coordination among each city/prefecture in Qinghai and Tibet, bubble diagrams were used to illustrate their three-dimensional relationships (Figure 5). Overall, the parallel approach of ecosystem protection and socioeconomic development practiced in Qinghai and Tibet in recent years has been highly effective.
According to the results of ecological vulnerability, the 15 cities/prefectures in Qinghai and Tibet were divided into two categories, low ecological vulnerability and high ecological vulnerability; furthermore, they were also divided into two categories, economically underdeveloped and economically developed, with an evaluation value of 0.4 for medium and high development levels. Therefore, the 15 cities/prefectures in Qinghai and Tibet can be divided into four types: low ecological vulnerability and economically developed type, low ecological vulnerability and economically underdeveloped type, high ecological vulnerability and economically developed type, and high ecological vulnerability and economically underdeveloped type.
(1) Low ecological vulnerability and economically developed type: As many as 5 of the 15 cities/prefectures have low ecological vulnerability and a high level of economic development, with a high CCD between the two, accounting for 33.3% of the total, indicating that the ecological and economic systems of these 5 cities/prefectures have a benign relationship between coordinated development and mutual promotion. This development type is the best for all cities/prefectures, and its past development paths and patterns can be modeled for other cities/prefectures. Moreover, in future development, it is crucial to avoid the environmental degradation that may result from rapid socioeconomic growth. By comparing the average economic indicators of Type (3), it is evident that it significantly surpasses Type (1) in terms of per capita retail sales of consumer goods, urbanization rate, and tourism revenue. The increase in these indicators might impact the regional natural environment to some extent. Therefore, the five cities/states of Type (1) should mitigate these impacts on the natural environment during their development. They should maintain the current environmental health while continuously improving their industrial structure, focusing on promoting green economic growth, and fostering the harmonious and sustainable development of both ecological and economic systems.
(2) Low ecological vulnerability and economically underdeveloped type: Three cities/prefectures have low ecological vulnerability and economic development levels, accounting for 20% of the total. The interdependence between the economic system and the ecosystem in Shannan is high, while the dependence between Yushu and Qamdo is low. However, the overall economic development levels of the three cities/prefectures still have room for development and improvement under the current ecosystem conditions. Further comparison of economic indicators for cities in low ecological vulnerability areas shows that compared to the average levels of Type (1) cities, Type (2) cities with lower coupling coordination have generally lower economic indicators. Specifically, their per capita GDP, investment growth rate, and tourism revenue are significantly lower than the average of Type (1) cities, although their primary industry proportion is higher. Therefore, this type of city/prefecture needs to continue to increase its industrial and economic strength in future development and further improve the level of social and economic development to maintain its ecological quality and the health and stability of the ecosystem.
(3) High ecological vulnerability and economically developed type: There are three cities/prefectures with low economic development levels but high ecological vulnerability levels; compared with what is required for a good social and economic development status, the degree of ecological environmental protection and attention is slightly insufficient. Among them, the higher degree of dependence between Lhasa and Xining indicates that the socioeconomic development of these two cities/prefectures may have somewhat affected the ecosystem, while the lower CCD in Haixi indicates that more attention should be given to the ecosystems when carrying out socioeconomic development. Furthermore, more attention should be given to increasing the resilience and adaptability of the ecosystem to minimize the continuous consumption of resources and increase the benign interaction between the two systems.
(4) High ecological vulnerability and economically underdeveloped type: The other four cities/prefectures have high ecological vulnerability and low levels of economic development; this type needs to be the focus of future development processes. Among them, the dependence between the two systems in Haidong is greater, probably because ecosystem vulnerability constrains its socioeconomic development. The dependence between the two systems in Nagqu, Shigatse, and Ngari is smaller. In the future, more attention should be given to their socioeconomic development. Comparing Type (4) with Type (1), most socioeconomic indicators of Type (4) are similar to those of Type (1). However, the investment growth rate and urbanization rate in Type (4) are significantly lower than in Type (1), and there is also a notable gap in tourism revenue. Considering that most cities in Type (4) are located in the western regions of Qinghai and Tibet, the socioeconomic development of these areas is constrained by regional natural conditions. Its future requires more financial support from the State and the Government, while prioritizing the development of the ecotourism industry based on the protection of the natural environment. In the process of increasing the urbanization rate, it is essential to maintain a balance with ecological conservation.

4. Discussion

The protection and development of the Tibetan Plateau, a crucial ecological security barrier in China, has received ongoing scientific attention in academic circles. Currently, the degree of ecological and economic coupling and coordination in Qinghai and Tibet is generally at a barely coordinated stage. The ability to coordinate ecological and economic systems needs to be further improved, especially in the western and northern regions. In terms of natural ecosystems, the unique alpine climate of the Tibetan Plateau increases the fragility and sensitivity of the environment; furthermore, this climate, coupled with complex topography and inconvenient transportation, somewhat restricts human social and economic activities. Factor detection results show the strongest interactions between mean annual temperature and economic factors, which is partly attributed to global warming. In recent years, due to the intensification of climate change, the overall climate of the Tibetan Plateau has become warmer and more humid; furthermore, the vegetation coverage of the Tibetan Plateau has increased, according to recent studies [56]. For instance, the vegetation has become greener [57], and the overall ecological risk has decreased [58]. The report “Scientific Assessment of the Impact of Human Activities on the Ecological Environment of the Tibetan Plateau (2022)” also noted that the ecological environment of the Tibetan Plateau is generally improving, the consequence of human activities on the ecological environment is limited, and the results of ecological construction are gradually emerging.
In terms of the socioeconomic system, the research shows that the proportion of the primary industry in GDP affects the economic development level of Qinghai and Tibet to a large extent. The primary industry in the Tibetan Plateau is mainly focused on agriculture and animal husbandry, which is a direct intervention by humans in the ecosystem. This situation directly alters the structure of the ecosystem, and the factors that are unfavorable for the ecological environment are typically greater. Therefore, more attention should be given to adjusting and upgrading the industrial structure in the process of future economic development; furthermore, a focus on developing the tertiary industry, such as ecotourism, is necessary. Second, the latest data from the National Bureau of Statistics of China for 2023 show that the urbanization rate of Qinghai Province is 61.43%, and the urbanization rate of the Tibet Autonomous Region is only 37.36%. The urbanization rate needs to be further improved. Because the Tibetan Plateau region is an indispensable and essential component of the spatial pattern of new urbanization in China, acceleration of green development during plateau urbanization is needed [59].
Due to the need to consider socioeconomic factors and the fact that most socioeconomic data are delineated by administrative units, this study could not cover all areas of the Tibetan Plateau. Instead, it selected the two most representative provinces of the Tibetan Plateau as the study area. In future research, relevant county-level administrative unit data should be collected to narrow the scale of the research units. In addition, the data can be further spatialized and downscaled, and their accuracy is capable of being improved through the integration of machine learning techniques like random forests and neural networks to refine the research results and spatial distribution. This process can enable future policy formulation to be better targeted. In the future, the focus will be on addressing how to balance urban economic development with ecological vulnerability and exploring the underlying mechanisms of the interaction between natural and economic factors in the two systems. Specifically, the research will investigate which key factors in economic development may impact the ecosystem and, similarly, which factors in the ecosystem are critical constraints on economic development. Additionally, there are complex influences and mutual feedback mechanisms between the ecological environment and the socioeconomy; each system is undergoing dynamic changes, and climate change is impacting these systems. Thus, the coupling situation between the systems is in a dynamic state of development. The ecological environment and natural resources have a finite carrying capacity, indicating the existence of a tipping point in the development of regional socioeconomic levels. However, with advancements in science and technology, the capacity for ecological protection and restoration will gradually increase, and its threshold will also increase. This situation will also mean that the coordinated development of the two systems is likely to fluctuate within an evolutionary interval in the future, for which more in-depth research is needed. Additionally, considering the unique characteristics of the study area, the research model used in this study can be applied to similar research in other regions. However, due to differences in natural geographical conditions and socioeconomic factors, the selection of relevant indicators for the model may need to be more tailored to the specific conditions of each area.

5. Conclusions

This study takes Qinghai Province and the Tibet Autonomous Region on the Tibetan Plateau as examples. It systematically assesses the ecological vulnerability and economic development levels of these two regions and explores the spatial characteristics and main influencing factors of the coupling coordination relationships between their ecosystem and economic system developments. The results show the following: (1) Ecological vulnerability in Qinghai and Tibet is characterized by higher levels in the southwest and north (Ngari\Shigatse\Haixi\Nagqu), while the southeast experiences lower levels (Golog\Haibei\Haidong\Nyingchi\Lhoka), the area with ecological vulnerability levels above medium is larger, and ecological vulnerability is affected mainly by natural geographical conditions. The spatial distribution of the economic development level in Qinghai and Tibet is high in the northeast (Haixi\Haibei\Xining\Golog\Hainan\Huangnan) and south (Lhasa\Nyingchi\Lhoka) and low in the middle (Shigatse\Nagqu\Yushu\Qamdo), and the area below the middle level of economic development is large; the development level is mainly affected by the economic strength and industrial structure indicators. (2) The CCD is high in eastern Qinghai (Golog\Huangnan\Hainan\Haibei\Xining), high in southeastern Tibet (Lhasa\Lhoka\Nyingchi), low in southwestern Qinghai (Yushu), and low in western Tibet (Ngari), and the CCD of the ecosystem and economic system is low in six cities. According to the geographic detector, the CCD between the ecosystem and the economic system in Qinghai and Tibet is determined mainly by economic factors. Altitude and annual average precipitation, two natural factors, and the proportion of the primary industry in GDP are the main factors leading to the CCD between the ecology and economy in Qinghai and Tibet. The proportion of the primary industry in GDP shows the strongest interaction with various natural ecological factors, while the annual average temperature exhibits the strongest interaction with various socioeconomic factors. (3) Qinghai and Tibet account for 1/3 of the total number of ecologically sound and economically developed cities/prefectures. Under the current natural environmental conditions, there is still potential for development in the eastern regions of Qinghai and Tibet. In the western regions of Qinghai and Tibet, economic development is constrained by the limitations of the natural ecosystem. Development in these areas requires financial support from the state and government. In the future, priority should be given to developing the ecotourism industry, with a strong emphasis on preserving the natural environment. Therefore, adjusting the industrial structure and promoting the transformation of the primary sector should be the focus of the region’s future socioeconomic development.

Author Contributions

Conceptualization, J.W.; data curation, J.W.; formal analysis, L.L., R.Y. and S.Z.; funding acquisition, S.W.; methodology, J.W. and R.Y.; resources, L.L.; software, J.W. and S.Z.; supervision, S.W. and L.L.; writing—original draft, J.W.; writing—review and editing, S.W. and L.L. All authors have read and agreed to the published version of the manuscript.

Funding

This work was supported by the Second Tibetan Plateau Scientific Expedition and Research Program of China (Grant number 2019QZKK0403).

Data Availability Statement

The original data presented in the study are openly available on the public website. The data and specific acquisition addresses are shown in the references in Section 2.2.

Conflicts of Interest

The authors declare no conflicts of interest.

References

  1. Mayer, A.L.; Donovan, R.P.; Pawlowski, C.W. Information and entropy theory for the sustainability of coupled human and natural systems. Ecol. Soc. 2014, 19, 11. [Google Scholar] [CrossRef]
  2. Liu, J.; Mooney, H.; Hull, V.; Davis, S.J.; Gaskell, J.; Hertel, T.; Lubchenco, J.; Seto, K.C.; Gleick, P.; Kremen, C.; et al. Systems integration for global sustainability. Science 2015, 347, 1258832. [Google Scholar] [CrossRef] [PubMed]
  3. Verburg, P.H.; Crossman, N.; Ellis, E.C.; Heinimann, A.; Hostert, P.; Mertz, O.; Nagendra, H.; Sikor, T.; Erb, K.-H.; Golubiewski, N.; et al. Land system science and sustainable development of the earth system: A global land project perspective. Anthropocene 2015, 12, 29–41. [Google Scholar] [CrossRef]
  4. Hull, V.; Tuanmu, M.; Liu, J. Synthesis of human-nature feedbacks. Ecol. Soc. 2015, 20, 17. [Google Scholar] [CrossRef]
  5. Noh, J.K.; Echeverria, C.; Gaona, G.; Kleemann, J.; Koo, H.; Fuerst, C.; Cuenca, P. Forest Ecosystem Fragmentation in Ecuador: Challenges for Sustainable Land Use in the Tropical Andean. Land 2022, 11, 287. [Google Scholar] [CrossRef]
  6. Krsnik, G.; Reyes-Paecke, S.; Reynolds, K.M.; Garcia-Gonzalo, J.; Olabarria, J.R.G. Assessing Relativeness in the Provision of Urban Ecosystem Services: Better Comparison Methods for Improved Well-Being. Land 2023, 12, 88. [Google Scholar] [CrossRef]
  7. Kubalíková, L. Cultural Ecosystem Services of Geodiversity: A Case Study from Stranska skala (Brno, Czech Republic). Land 2020, 9, 105. [Google Scholar] [CrossRef]
  8. Varis, O.; Taka, M.; Kummu, M. The planet’s stressed river basins: Too much pressure or too little adaptive capacity? Earth’s Future 2019, 7, 1118–1135. [Google Scholar] [CrossRef]
  9. Winkler, K.; Fuchs, R.; Rounsevell, M.; Herold, M. Global land use changes are four times greater than previously estimated. Nat. Commun. 2021, 12, 2501. [Google Scholar] [CrossRef]
  10. Fu, B. Coupling human and natural systems for sustainable development. Natl. Sci. Rev. 2023, 10, nwad086. [Google Scholar] [CrossRef]
  11. Fan, Y.; Fang, C.; Zhang, Q. Coupling coordinated development between social economy and ecological environment in Chinese provincial capital cities-assessment and policy implications. J. Clean. Prod. 2019, 229, 289–298. [Google Scholar] [CrossRef]
  12. Tomal, M. Evaluation of coupling coordination degree and convergence behaviour of local development: A spatiotemporal analysis of all Polish municipalities over the period 2003–2019. Sustain. Cities Soc. 2021, 71, 102992. [Google Scholar] [CrossRef]
  13. Ariken, M.; Zhang, F.; Chan, N.w.; Kung, H.-t. Coupling coordination analysis and spatio-temporal heterogeneity between urbanization and eco-environment along the Silk Road Economic Belt in China. Ecol. Indic. 2021, 121, 107014. [Google Scholar] [CrossRef]
  14. Mondal, K.; Chatterjee, C.; Singh, R. Examining the coupling and coordination of water-energy-food nexus at a sub-national scale in India—Insights from the perspective of Sustainable Development Goals. Sustain. Prod. Consum. 2023, 43, 140–154. [Google Scholar] [CrossRef]
  15. Han, D.; Yu, D.; Qiu, J. Assessing coupling interactions in a safe and just operating space for regional sustainability. Nat. Commun. 2023, 14, 1369. [Google Scholar] [CrossRef]
  16. Qiu, J.; Liu, Y.; Chen, C.; Huang, Q. Spatial structure and driving pathways of the coupling between ecosystem services and human well-beings: A case study of Guangzhou. J. Nat. Resour. 2023, 38, 760–778. [Google Scholar] [CrossRef]
  17. Li, L.; Fan, Z.; Feng, W.; Yuxin, C.; Keyu, Q. Coupling coordination degree spatial analysis and driving factor between socio-economic and eco-environment in northern China. Ecol. Indic. 2022, 135, 108555. [Google Scholar] [CrossRef]
  18. Tu, D.; Cai, Y.; Liu, M. Coupling coordination analysis and spatiotemporal heterogeneity between ecosystem services and new-type urbanization: A case study of the Yangtze River Economic Belt in China. Ecol. Indic. 2023, 154, 110535. [Google Scholar] [CrossRef]
  19. Zhang, H.; Wang, Y.; Wang, C.; Yang, J.; Yang, S. Coupling analysis of environment and economy based on the changes of ecosystem service value. Ecol. Indic. 2022, 144, 109524. [Google Scholar] [CrossRef]
  20. Zhang, K.; Jin, Y.; Li, D.; Wang, S.; Liu, W. Spatiotemporal variation and evolutionary analysis of the coupling coordination between urban social-economic development and ecological environments in the Yangtze River Delta cities. Sustain. Cities Soc. 2024, 111, 105561. [Google Scholar] [CrossRef]
  21. Liu, J.Y.; Qin, K.Y.; Xie, G.D.; Xiao, Y.; Huang, M.D.; Gan, S. Is the ‘water tower’ reassuring? Viewing water security of Qinghai-Tibet Plateau from the perspective of ecosystem services ‘supply-flow-demand’. Environ. Res. Lett. 2022, 17, 094043. [Google Scholar] [CrossRef]
  22. Wu, J.H.; Wang, G.Z.; Chen, W.X.; Pan, S.P.; Zeng, J. Terrain gradient variations in the ecosystem services value of the Qinghai-Tibet Plateau, China. Glob. Ecol. Conserv. 2022, 34, e02008. [Google Scholar] [CrossRef]
  23. Pan, Y.; Zhu, J.; Zhang, Y.J.; Li, Z.N.; Wu, J.X. Poverty eradication and ecological resource security in development of the Tibetan Plateau. Resour. Conserv. Recycl. 2022, 186, 106552. [Google Scholar] [CrossRef]
  24. Xu, P.; Yan, D.H.; Weng, B.S.; Bian, J.M.; Wu, C.; Wang, H. Evolution trends and driving factors of groundwater storage, recharge, and discharge in the Qinghai-Tibet Plateau: Study progress and challenges. J. Hydrol. 2024, 631, 130815. [Google Scholar] [CrossRef]
  25. Zhao, H.; Wei, D.; Wang, X.D.; Hong, J.T.; Wu, J.B.; Xiong, D.H.; Liang, Y.L.; Yuan, Z.R.; Qi, Y.H.; Huang, L. Three decadal large-scale ecological restoration projects across the Tibetan Plateau. Land Degrad. Dev. 2024, 35, 22–32. [Google Scholar] [CrossRef]
  26. Anniwaer, N.; Li, X.Y.; Wang, K.; Xu, H.; Hong, S.B. Shifts in the trends of vegetation greenness and photosynthesis in different parts of Tibetan Plateau over the past two decades. Agric. For. Meteorol. 2024, 345, 109851. [Google Scholar] [CrossRef]
  27. Bafitlhile, T.M.; Liu, Y.B. Temperature contributes more than precipitation to the greening of the Tibetan Plateau during 1982-2019. Theor. Appl. Climatol. 2022, 147, 1471–1488. [Google Scholar] [CrossRef]
  28. An, R.; Wang, H.L.; Feng, X.Z.; Wu, H.; Wang, Z.; Wang, Y.; Shen, X.J.; Lu, C.H.; Quaye-Ballard, J.A.; Chen, Y.H.; et al. Monitoring rangeland degradation using a novel local NPP scaling based scheme over the “Three-River Headwaters” region, hinterland of the Qinghai-Tibetan Plateau. Quat. Int. 2017, 444, 97–114. [Google Scholar] [CrossRef]
  29. Beroya-Eitner, M.A. Ecological vulnerability indicators. Ecol. Indic. 2016, 60, 329–334. [Google Scholar] [CrossRef]
  30. Christer, N.; Gunnell, G. The Fragility of Ecosystems: A Review. J. Appl. Ecol. 1995, 32, 677–692. [Google Scholar] [CrossRef]
  31. Gonzalez, P.; Neilson, R.P.; Lenihan, J.M.; Drapek, R.J. Global patterns in the vulnerability of ecosystems to vegetation shifts due to climate change. Glob. Ecol. Biogeogr. 2010, 19, 755–768. [Google Scholar] [CrossRef]
  32. Panth, P. Economic development: Definition, scope, and measurement. In No Poverty; Springer: Berlin/Heidelberg, Germany, 2021; pp. 231–243. [Google Scholar]
  33. Qinghai Province Bureau of Statistics. Qinghai Statistical Yearbook; China Statistics Press: Beijing, China, 2021. [Google Scholar]
  34. Tibet Autonomous Region Bureau of Statistics. Tibet Statistical Yearbook; China Statistics Press: Beijing, China, 2021. [Google Scholar]
  35. Qinghai Province Bureau of Statistics. The Bulletin of National Economic and Social Development Statistics of Qinghai; China Statistics Press: Beijing, China, 2021. [Google Scholar]
  36. Tibet Autonomous Region Bureau of Statistics. The Bulletin of National Economic and Social Development Statistics of Tibet; China Statistics Press: Beijing, China, 2021. [Google Scholar]
  37. Peng, S. 1-km Monthly Mean Temperature Dataset for China (1901–2021). 2019. Available online: https://data.tpdc.ac.cn/en/data/71ab4677-b66c-4fd1-a004-b2a541c4d5bf/ (accessed on 16 May 2023).
  38. Peng, S. 1-km Monthly Precipitation Dataset for China (1901–2021). 2020. Available online: https://zenodo.org/records/3185722 (accessed on 16 May 2023).
  39. Peng, S. 1-km Monthly Potential Evapotranspiration Dataset for China (1901–2023). 2024. Available online: http://loess.geodata.cn/data/datadetails.html?dataguid=34595274939620&docid=74 (accessed on 16 May 2023).
  40. Resource and Environmental Science Data Platform. National DEM 1km, 500m and 250m Data (SRTM 90m). Available online: https://www.resdc.cn/data.aspx?DATAID=123 (accessed on 15 May 2023).
  41. Gao, J.; Shi, Y.; Zhang, H.; Zhang, W.; Chen, X.; Shen, W.; Xiao, T.; Zhang, Y. China Regional 250m Fractional Vegetation Cover Data Set (2000–2023). 2024. Available online: https://data.tpdc.ac.cn/en/data/f3bae344-9d4b-4df6-82a0-81499c0f90f7 (accessed on 8 June 2023).
  42. Gao, J.; Shi, Y.; Zhang, H.; Zhang, W.; Chen, X.; Shen, W.; Xiao, T.; Zhang, Y. China Regional 250m Normalized Difference Vegetation Index Data Set (2000–2023). 2024. Available online: https://data.tpdc.ac.cn/en/data/10535b0b-8502-4465-bc53-78bcf24387b3 (accessed on 8 June 2023).
  43. United States National Aeronautics and Space Administration (NASA) Earth Science Data and Information System (ESDIS). MOD17A3HGF v061. Available online: https://lpdaac.usgs.gov/products/mod17a3hgfv061/ (accessed on 26 June 2023).
  44. Resource and Environmental Science Data Platform. Spatial Distribution of Soil Erosion Types and Degrees in China. Available online: https://www.resdc.cn/data.aspx?DATAID=259 (accessed on 15 June 2023).
  45. Xu, X.; Liu, J.; Zhang, S.; Li, R.; Yan, C.; Wu, S. Multi-period land use remote sensing monitoring dataset in China (CNLUCC). 2018. Available online: https://www.resdc.cn/DOI/doi.aspx?DOIid=54 (accessed on 28 June 2023). [CrossRef]
  46. Ghosh, S.; Dinda, S.; Chatterjee, N.D.; Bera, D. Linking ecological vulnerability and ecosystem service value in a fast-growing metropolitan area of eastern India: A scenario-based sustainability approach. Environ. Dev. Sustain. 2023, 1–31. [Google Scholar] [CrossRef]
  47. Guo, B.; Zang, W.; Luo, W. Spatial-temporal shifts of ecological vulnerability of Karst Mountain ecosystem-impacts of global change and anthropogenic interference. Sci. Total Environ. 2020, 741, 140256. [Google Scholar] [CrossRef] [PubMed]
  48. Li, B.; Zhang, W.; Yu, J.; Liu, Q. Spatial pattern evolution of municipal economic development in energy-rich areas: A case study of Shanxi-Shaanxi-Inner Mongolia-Gansu-Ningxia region. J. Nat. Resour. 2020, 35, 668–682. [Google Scholar] [CrossRef]
  49. Wang, K.; Zhang, Y.; Lin, H.; Zhang, L. Research on the Influence of Economic Development Level on Tourism Efficiency of the Yangtze River Economic Belt. Geogr. Geo-Inf. Sci. 2021, 37, 137–142. [Google Scholar] [CrossRef]
  50. Diakoulaki, D.; Mavrotas, G.; Papayannakis, L. Determining objective weights in multiple criteria problems: The critic method. Comput. Oper. Res. 1995, 22, 763–770. [Google Scholar] [CrossRef]
  51. Wang, D.; Li, Y.; Yang, X.; Zhang, Z.; Gao, S.; Zhou, Q.; Zhuo, Y.; Wen, X.; Guo, Z. Evaluating urban ecological civilization and its obstacle factors based on integrated model of PSR-EVW-TOPSIS: A case study of 13 cities in Jiangsu Province, China. Ecol. Indic. 2021, 133, 108431. [Google Scholar] [CrossRef]
  52. Wang, S.; Kong, W.; Ren, L.; Zhi, D. Research on misuses and modification of coupling coordination degree model in China. J. Nat. Resour. 2021, 36, 793–810. [Google Scholar] [CrossRef]
  53. Naikoo, M.W.; Shahfahad; Talukdar, S.; Ishtiaq, M.; Rahman, A. Modelling built-up land expansion probability using the integrated fuzzy logic and coupling coordination degree model. J. Environ. Manag. 2023, 325, 116441. [Google Scholar] [CrossRef]
  54. Wang, J.; Xu, C. Geodetector: Principle and prospective. Acta Geogr. Sin. 2017, 72, 19. [Google Scholar] [CrossRef]
  55. Shrestha, A.; Luo, W. An assessment of groundwater contamination in Central Valley aquifer, California using geodetector method. Ann. GIS 2017, 23, 149–166. [Google Scholar] [CrossRef]
  56. Lu, Q.; Wu, S.; Zhao, D. Variations in Alpine Grassland Cover and Its Correlation with Climate Variables on the Qinghai-Tibet Plateau in 1982–2013. Sci. Geogr. Sin. 2017, 37, 292–300. [Google Scholar] [CrossRef]
  57. Zhang, Y.; Li, L.; Ding, M.; Zheng, D. Greening of the Tibetan Plateau and its drivers since 2000. Chin. J. Nat. 2017, 39, 173–178. [Google Scholar] [CrossRef]
  58. Wang, J.; Bai, W.; Tian, G. Spatiotemporal characteristics of landscape ecological risks on the Tibetan Plateau. J. Nat. Resour. 2020, 42, 11. [Google Scholar] [CrossRef]
  59. Fang, C. Special thinking and green development path of urbanization in Qinghai-Tibet Plateau. Acta Geogr. Sin. 2023, 77, 1907–1919. [Google Scholar] [CrossRef]
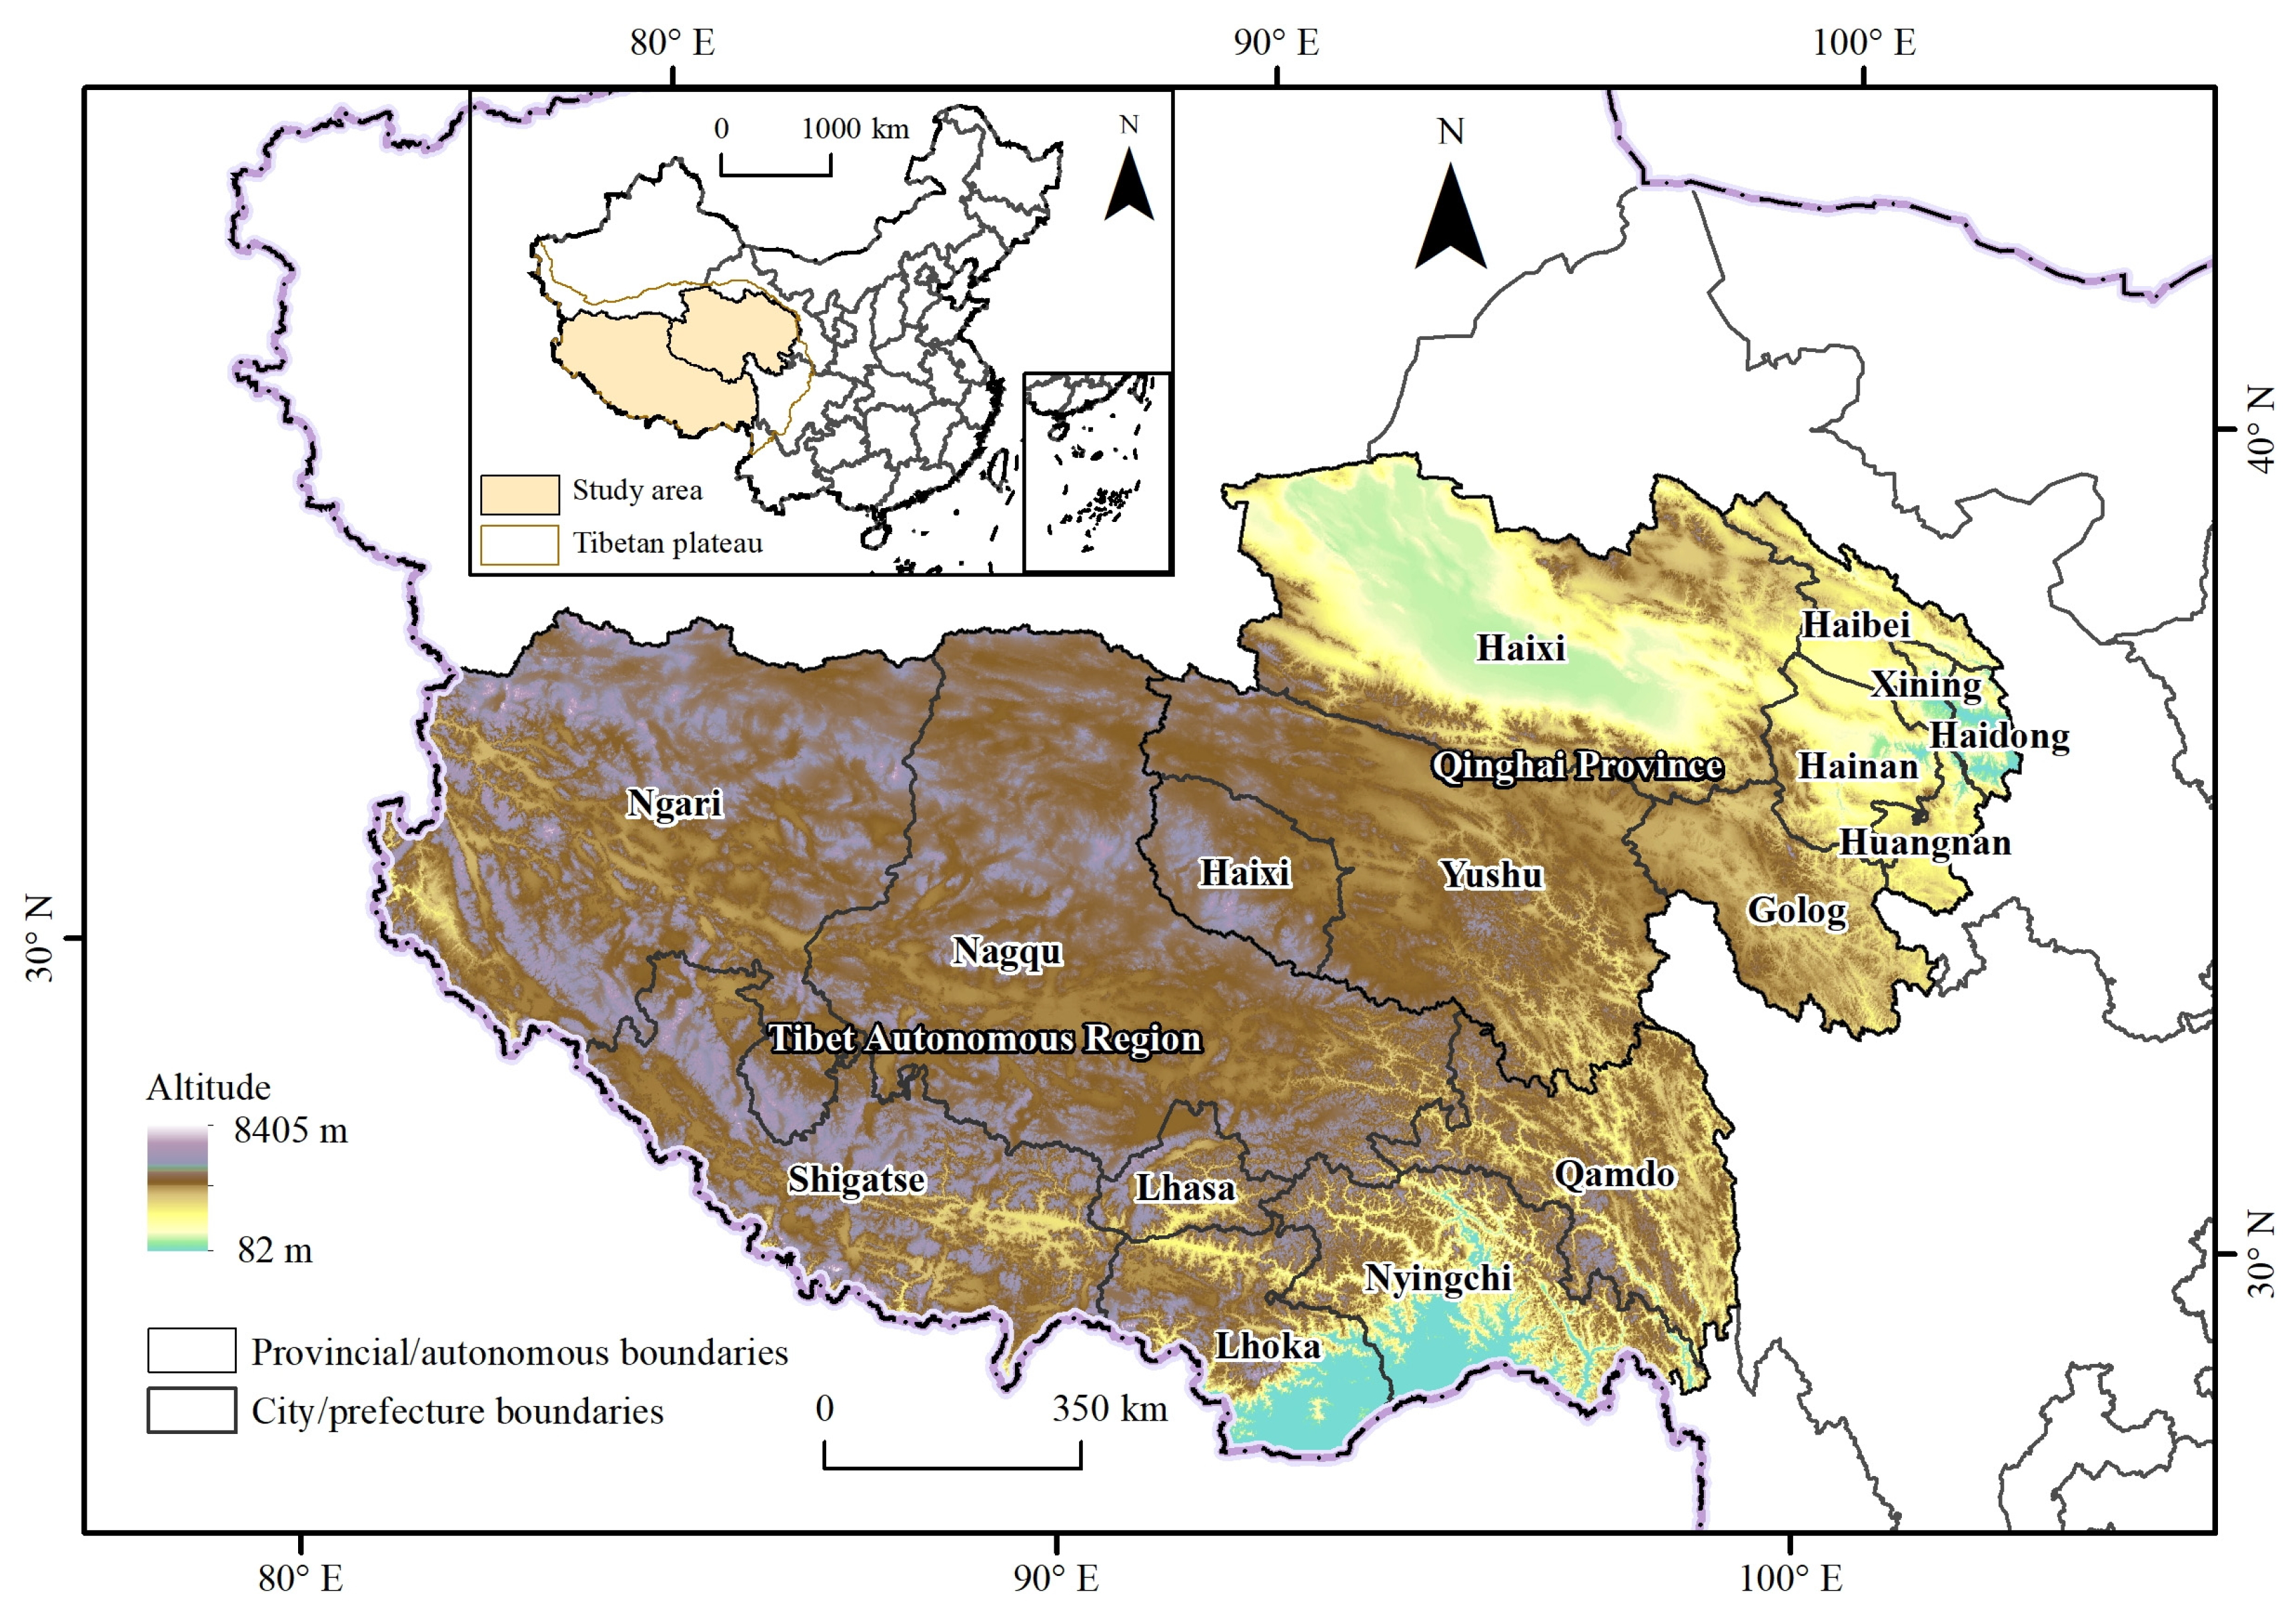
Figure 1. Study area scope.
Land 13 01766 g001
Figure 2. The methodological framework of the study.
Land 13 01766 g002
Figure 3. (a) Spatial distribution of ecological vulnerability in Qinghai and Tibet; (b) spatial distribution of economic development levels in Qinghai and Tibet; (c) CCD between ecosystems and economic systems in Qinghai and Tibet.
Land 13 01766 g003
Figure 4. Factors interaction detection results.
Land 13 01766 g004
Figure 5. Bubble map and spatial distribution of the relationship between ecological vulnerability, economic levels, and CCD of the municipalities in Qinghai and Tibet, 2020. (The two orange auxiliary lines are the grading lines for medium and higher levels of assessment results, respectively).
Land 13 01766 g005
Table 1. Cities in the study area and their abbreviations.
Serial NumberCityAbbreviation
1Xining cityXining
2Haidong cityHaidong
3Haibei Tibetan Autonomous PrefectureHaibei
4Huangnan Tibetan Autonomous PrefectureHuangnan
5Golog Tibetan Autonomous PrefectureGolog
6Hainan Tibetan Autonomous PrefectureHainan
7Yushu Tibetan Autonomous PrefectureYushu
8Haixi Mongol and TibetanHaixi
9Lhasa cityLhasa
10Shigatse cityShigatse
11Qamdo cityQamdo
12Nyingchi cityNyingchi
13Lhoka cityLhoka
14Nagqu cityNagqu
15Ngari PrefectureNgari
Table 2. Sources of geospatial data.
Specific DataResolutionSource
Temperature [37]1 kmA Big Earth Data Platform for Three Poles
Precipitation [38]1 kmA Big Earth Data Platform for Three Poles
Evapotranspiration [39]1 kmNational Tibetan Plateau Data Center
Digital elevation model (DEM) [40]1 kmResource and Environment Science and Data Center
Fractional vegetation cover (FVC) [41]250 mNational Tibetan Plateau Data Center
Normalized difference vegetation index (NDVI) [42]250 mNational Tibetan Plateau Data Center
Net primary productivity of vegetation (NPP) [43]1 kmNational Aeronautics and Space Administration (NASA)
Spatial distribution of soil erosion [44]1 kmResource and Environment Science and Data Center
Land use/cover change (LUCC) [45]1 kmResource and Environment Science and Data Center
Table 3. Assessment indicator system for ecological vulnerability.
Serial NumberCriterionIndicatorCalculation FormulaRemarks
1SensitivityAnnual average temperature μ = i = 1 n x i n
Where x i is the value of the i th pixel, n is the number of pixels in the region, and μ is the regional average.
2Annual average precipitation
3Potential evapotranspiration
4Elevation
5Slope
6ResilienceFractional vegetation cover (FVC)
7Normalized difference vegetation index (NDVI)
8Net Primary Productivity (NPP)
9Habitat qualityCalculated using the InVEST 3.13.0 model.
10Habitat degradation
11PressureSoil erosion degreeSoil erosion degree levels: slight 0.2, mild 0.4, moderate 0.6, severe 0.8, extreme 1.
12Land use and land coverExpert scoring method values: water bodies 0.2, forest land 0.4, grassland 0.6, arable land 0.8, construction land/permanent glaciers/bare land 1.
13Human disturbance index(Cultivated land area + Construction land)/Total area of the study region
Table 4. Assessment indicator system for economic development.
Serial NumberCriterionIndicator
1Economic strengthPer capita GDP (CNY)
2Per capita total retail sales of consumer goods (CNY)
3Fixed asset investment growth rate (%)
4Per capita fiscal income (CNY)
5Economic structureProportion of the primary industry to GDP (%)
6Proportion of the secondary industry to GDP (%)
7Proportion of the tertiary industry to GDP (%)
8Total tourism revenue (CNY)
9Residents living standardsUrbanization rate (%)
10Per capita disposable income of residents (CNY)
11Per capita household consumption expenditure (CNY)
Table 5. Classification of CCD.
Serial NumberType of DegreeValue of Coupled Coordination
1Extreme disorder0.0 ≤ D ≤ 0.1
2Severe disorder0.1 < D ≤ 0.2
3Moderate disorder0.2 < D ≤ 0.3
4Mild disorder0.3 < D ≤ 0.4
5Verging on disorder0.4 < D ≤ 0.5
6Barely coordinated0.5 < D ≤ 0.6
7Primary coordination0.6 < D ≤ 0.7
8Intermediate coordination0.7 < D ≤ 0.8
9Good coordination0.8 < D ≤ 0.9
10High-quality coordination0.9 < D ≤ 1.0
Table 6. The name of the detection factor.
Serial NumberFactor NameDetection Factor
1ElevationX1
2Annual average temperatureX2
3Annual average precipitationX3
4NDVIX4
5Per capita GDPX5
6Urbanization rateX6
7PrimaryX7
8SecondaryX8
Table 7. Detection of factors influencing the coupled coordination of ecosystems and economic systems in Qinghai and Tibet.
Detection FactorsX1X2X3X4X5X6X7X8
q statistic0.300.310.140.230.320.330.830.14
p value0.000.000.000.000.000.000.000.00
Disclaimer/Publisher’s Note: The statements, opinions and data contained in all publications are solely those of the individual author(s) and contributor(s) and not of MDPI and/or the editor(s). MDPI and/or the editor(s) disclaim responsibility for any injury to people or property resulting from any ideas, methods, instructions or products referred to in the content.