Article

Identification and Spatiotemporal Evolution Analysis of the Urban–Rural Fringe in Polycentric Cities Based on K-Means Clustering and Multi-Source Data: A Case Study of Chengdu City

by
Dan Ji
,
Jian Tian
*,
Jiahao Zhang
,
Jian Zeng
and
Aihemaiti Namaiti
*
School of Architecture, Tianjin University, Tianjin 300072, China
*
Authors to whom correspondence should be addressed.
Land 2024, 13(11), 1727; https://doi.org/10.3390/land13111727
Submission received: 16 August 2024 / Revised: 14 October 2024 / Accepted: 17 October 2024 / Published: 22 October 2024

Abstract

:
Urban fringe areas, serving as transitional zones between urban and rural landscapes, are characterized by their transitional nature, high dynamics, and spatial heterogeneity. Identifying the extent of an urban–rural fringe (URF) and analyzing its evolutionary characteristics are crucial for urban planning and development. However, limited research exists regarding the identification of a URF and the analysis of its spatiotemporal evolution in polycentric cities. Using Chengdu as a case study, this research employed the K-means clustering method to identify the spatial extent and evolution patterns of the URF in Chengdu from 2010 to 2020 based on the spatiotemporal characteristics of multi-source data. The results indicate that (1) the K-means clustering method can reasonably and efficiently identify URF in polycentric cities; (2) Chengdu exhibited a polycentric urban structure with a “main center-subcenter” pattern, where the URF was adjacent to the main and subcenters, assuming an overall annular wedge shape; (3) there was a significant expansion of the URF in the northeast–southwest direction from 2010 to 2020, accompanied by substantial land use changes. The evolution of the URF was driven by the dual mechanisms of urban suburbanization and rural urbanization, exhibiting characteristics such as singular urban functions, dispersed and chaotic land use, fragmented landscapes, and increasing complexity. This study extended the research on URFs, aiding in the understanding of urban spatial growth patterns and providing decision support for the integrated development of urban and rural areas.

1. Introduction

Peri-urbanization is an emerging phenomenon within contemporary urban trends, affecting cities of varying sizes and geographies [1,2]. Amidst global urbanization [3], China has experienced unprecedented urban growth, leading to the decline of rural areas surrounding cities in terms of economy, society, and environment [4]. Such regions, accompanied by a series of dynamic, complex, and multidimensional processes [5], have developed into transitional spaces in terms of land use, societal, and demographic characteristics [6], becoming spaces that can no longer be clearly distinguished as ‘urban’ or ‘rural’ [7]. In this case, the traditional urban–rural binary is insufficient for accurately depicting the structural and functional features of cities’ regional compositions [8], especially in urban–rural transition areas. The concept of an “urban fringe area”, introduced by the German geographer Herbert Louis (H. Louts) in 1936, was designed to describe rural areas that were being progressively occupied by urban development [9]. Since then, many scholars have discussed the concept and characteristics of urban–rural fringe (URF), and an extensive amount of the literature analyzes this urban–rural interaction [10,11], including analyzing the social structure and population mobility from the sociological perspective; analyzing the economic development model and industrial structure transformation from the economic perspective; analyzing land use change, driving factors, and spatial layout from the geographic perspective; and analyzing environmental impact assessment and the ecological system from the ecological perspective [10,12,13,14]. A URF is considered the key region in promoting urban development in these studies [15]. Given its role as the connecting hub between urban and rural areas, the URF is the frontier of urban expansion with intensive land use change, complex population composition, and unbalanced economic development, and it is characterized as being transitional, highly dynamic, and spatially heterogeneous [16,17]. The area is a ‘messy’ yet opportunistic space in policy and decision making processes [6], but planning policies tend to overlook this specific peri-environment [18], resulting in the gradual development of an unhealthy urban form [19]. As a result, many problems have arisen in urban fringe areas, including shortage of resources, chaotic spatial layout, deterioration of the ecological environment, and waste of land resources [20,21]. In order to improve the current situation, the study needs to understand the expansion pattern of URF areas and take corresponding measures to effectively address the actual problems within urban planning and management practices [19]. The first key step is the identification of its extent. The identification and spatiotemporal evolution analysis of a URF is conducive to clarifying the driving factors of urban expansion and understanding the transformation of urban spatial morphology [22]. Consequently, it is necessary to quantitatively identify the urban–rural interface, which is important for the sustainable development of cities.
On the other hand, the form and function of urban spatial structures have changed [23]. Some megacities have transitioned from an initial monocentric urban spatial structure to a polycentric urban spatial structure [24]. Related studies have proposed that promoting polycentric development policies is an effective means of alleviating the excessive concentration of urban economy, population, transportation, and functions [25]. The main center is often the most densely populated area of a city, including the central business district (CBD), which serves as the core of a city. Subcenters are areas at a certain distance from the main center, including county-level cities, satellite cities, and new airport cities, where urban activities are relatively more intensive compared to the surrounding areas [23]. Therefore, as a prerequisite to further research, the URF of polycentric cities must be rapidly and accurately identified.
In recent years, spurred by improvements in spatial information technology and statistical methodologies, the identification of a URF has changed from a process involving a qualitative description to a process involving a quantitative analysis [26,27,28]. These methods can be categorized into the urban–rural gradient view, threshold method, mutation identification, spatial clustering method, gravity model, and others [8,29,30,31,32,33]. The threshold method [34], as an option, identifies the URF by utilizing a threshold range of indicators, such as the distance from the built-up area [35], population density [36], information entropy [37], and impervious surface mapping [38]. However, this approach relies on artificially set thresholds and requires repeated experimentation, which can be inefficient, subjective, and lacking in universal applicability [39]. Thus, several scholars have suggested the mutation point method, which calculates the mutation values of single or comprehensive indexes [16], to identify the URF. However, this method is often compromised by two main issues. Firstly, most studies visually examine mutation points on maps and connect them manually, which can lead to inaccuracies and insufficient objectivity [40]. Secondly, the method has specific requirements regarding urban morphology and cannot be applied to polycentric cities [41]. K-means clustering imposes no special requirements on urban morphology and processes large datasets quickly and efficiently [42,43]. Due to its objectivity and convenience, it has a broader scope of application.
Nonetheless, using primarily single data in existing K-means clustering studies may not adequately reflect the extensive heterogeneity of the morphological and functional characteristics of a URF [44]. Its identification can be more accurate when based on multi-source data and indicative elements [43].
Because of the gradient changes in socio-economic status and population density between urban and rural areas, scholars can intuitively identify the URF using statistical data. However, statistical data are usually collected and released as an administrative unit, making it difficult to reflect the specific differences within administrative areas [45]. Remote sensing data can compensate for these disadvantages [46]. With its advantage of characterizing spatial patterns at fine resolutions, spatial data obtained from remote sensing images can not only break through the statistical limitations imposed by administrative boundaries but also overcome the issue of poor data continuity [47].
Considering the scarcity of existing research that leverages K-means clustering to identify polycentric cities’ URFs, this study aims to explore a method for identifying and analyzing the spatiotemporal evolution of the URF in polycentric cities based on multi-source data and the K-means clustering approach.
Chengdu, as a key player in the Chengdu–Chongqing Urban Agglomeration and a significant national central city in western China, exemplifies the overarching characteristic of China’s urban development: increasing metropolitanization [5]. The city has experienced rapid urbanization, significant regional development disparities, and prominent urban–rural conflicts in the URF areas. As part of the first national-level pilot regions for urban–rural integration in China and the National Urban–rural Integration Development Experimental Zones in western China, Chengdu’s research outcomes are highly representative. Thus, selecting Chengdu as a case study for exploration has significant practical implications for urban–rural integration and rural revitalization. It also holds profound theoretical significance, enriching the innovation of urbanization theory and advancing the development of regional economic theory. Using the typical polycentric city of Chengdu as an example, and leveraging multi-source data to represent the city’s diverse characteristics, this study employs the K-means clustering method to identify the scope and evolutionary patterns of the URF in Chengdu from 2010 to 2020. This research aims to extend previous studies by providing theoretical references and practical guidance for accurately assessing the boundaries and developmental conditions of the URF.

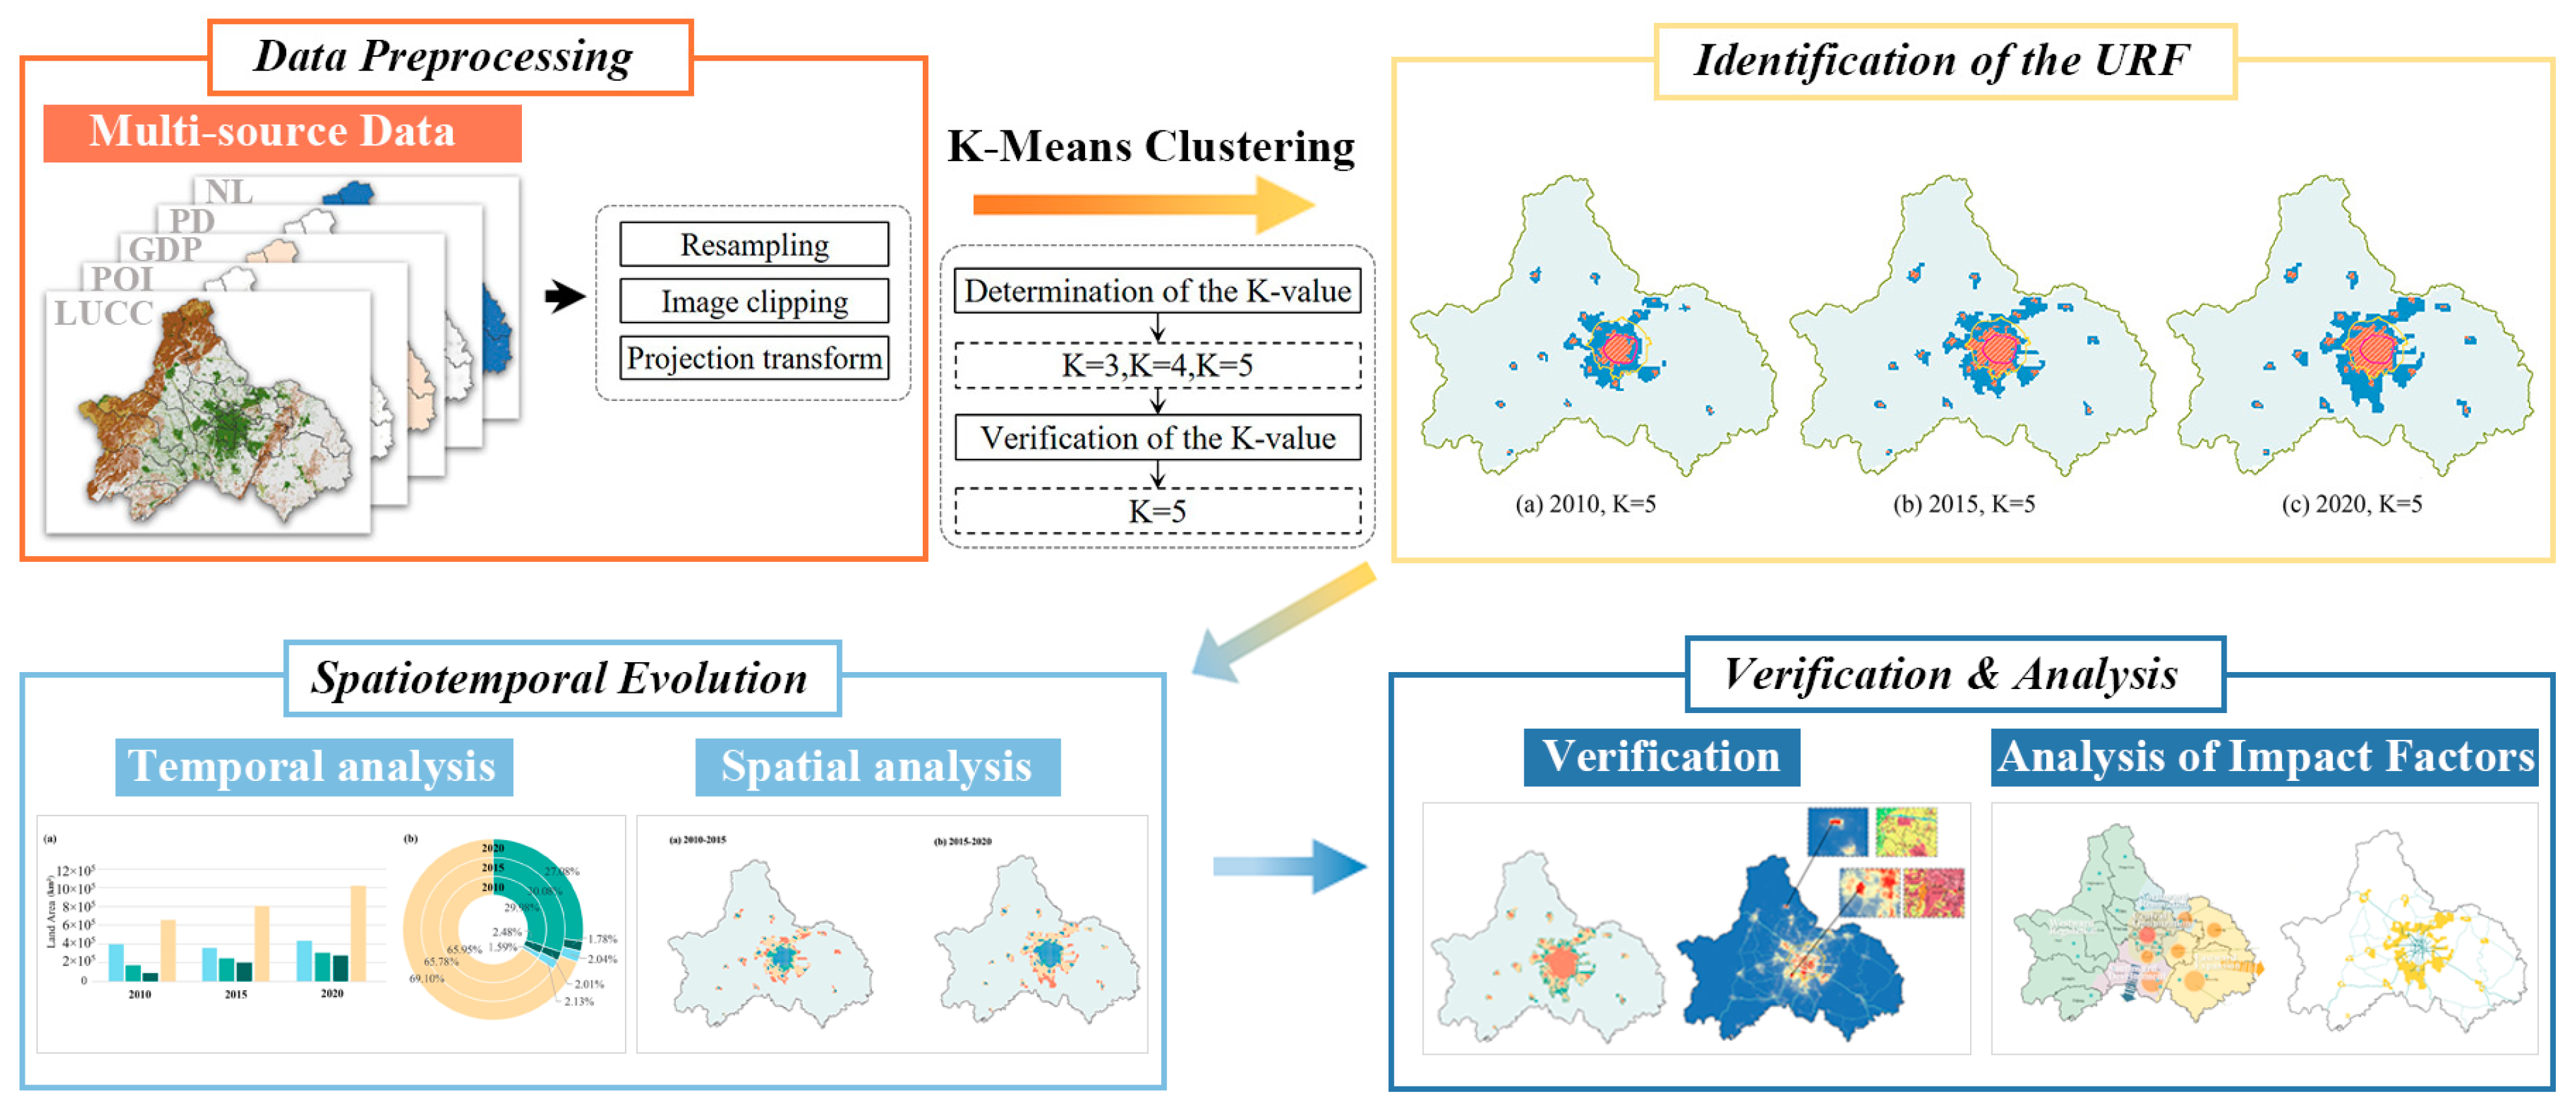
2. Materials and Methods
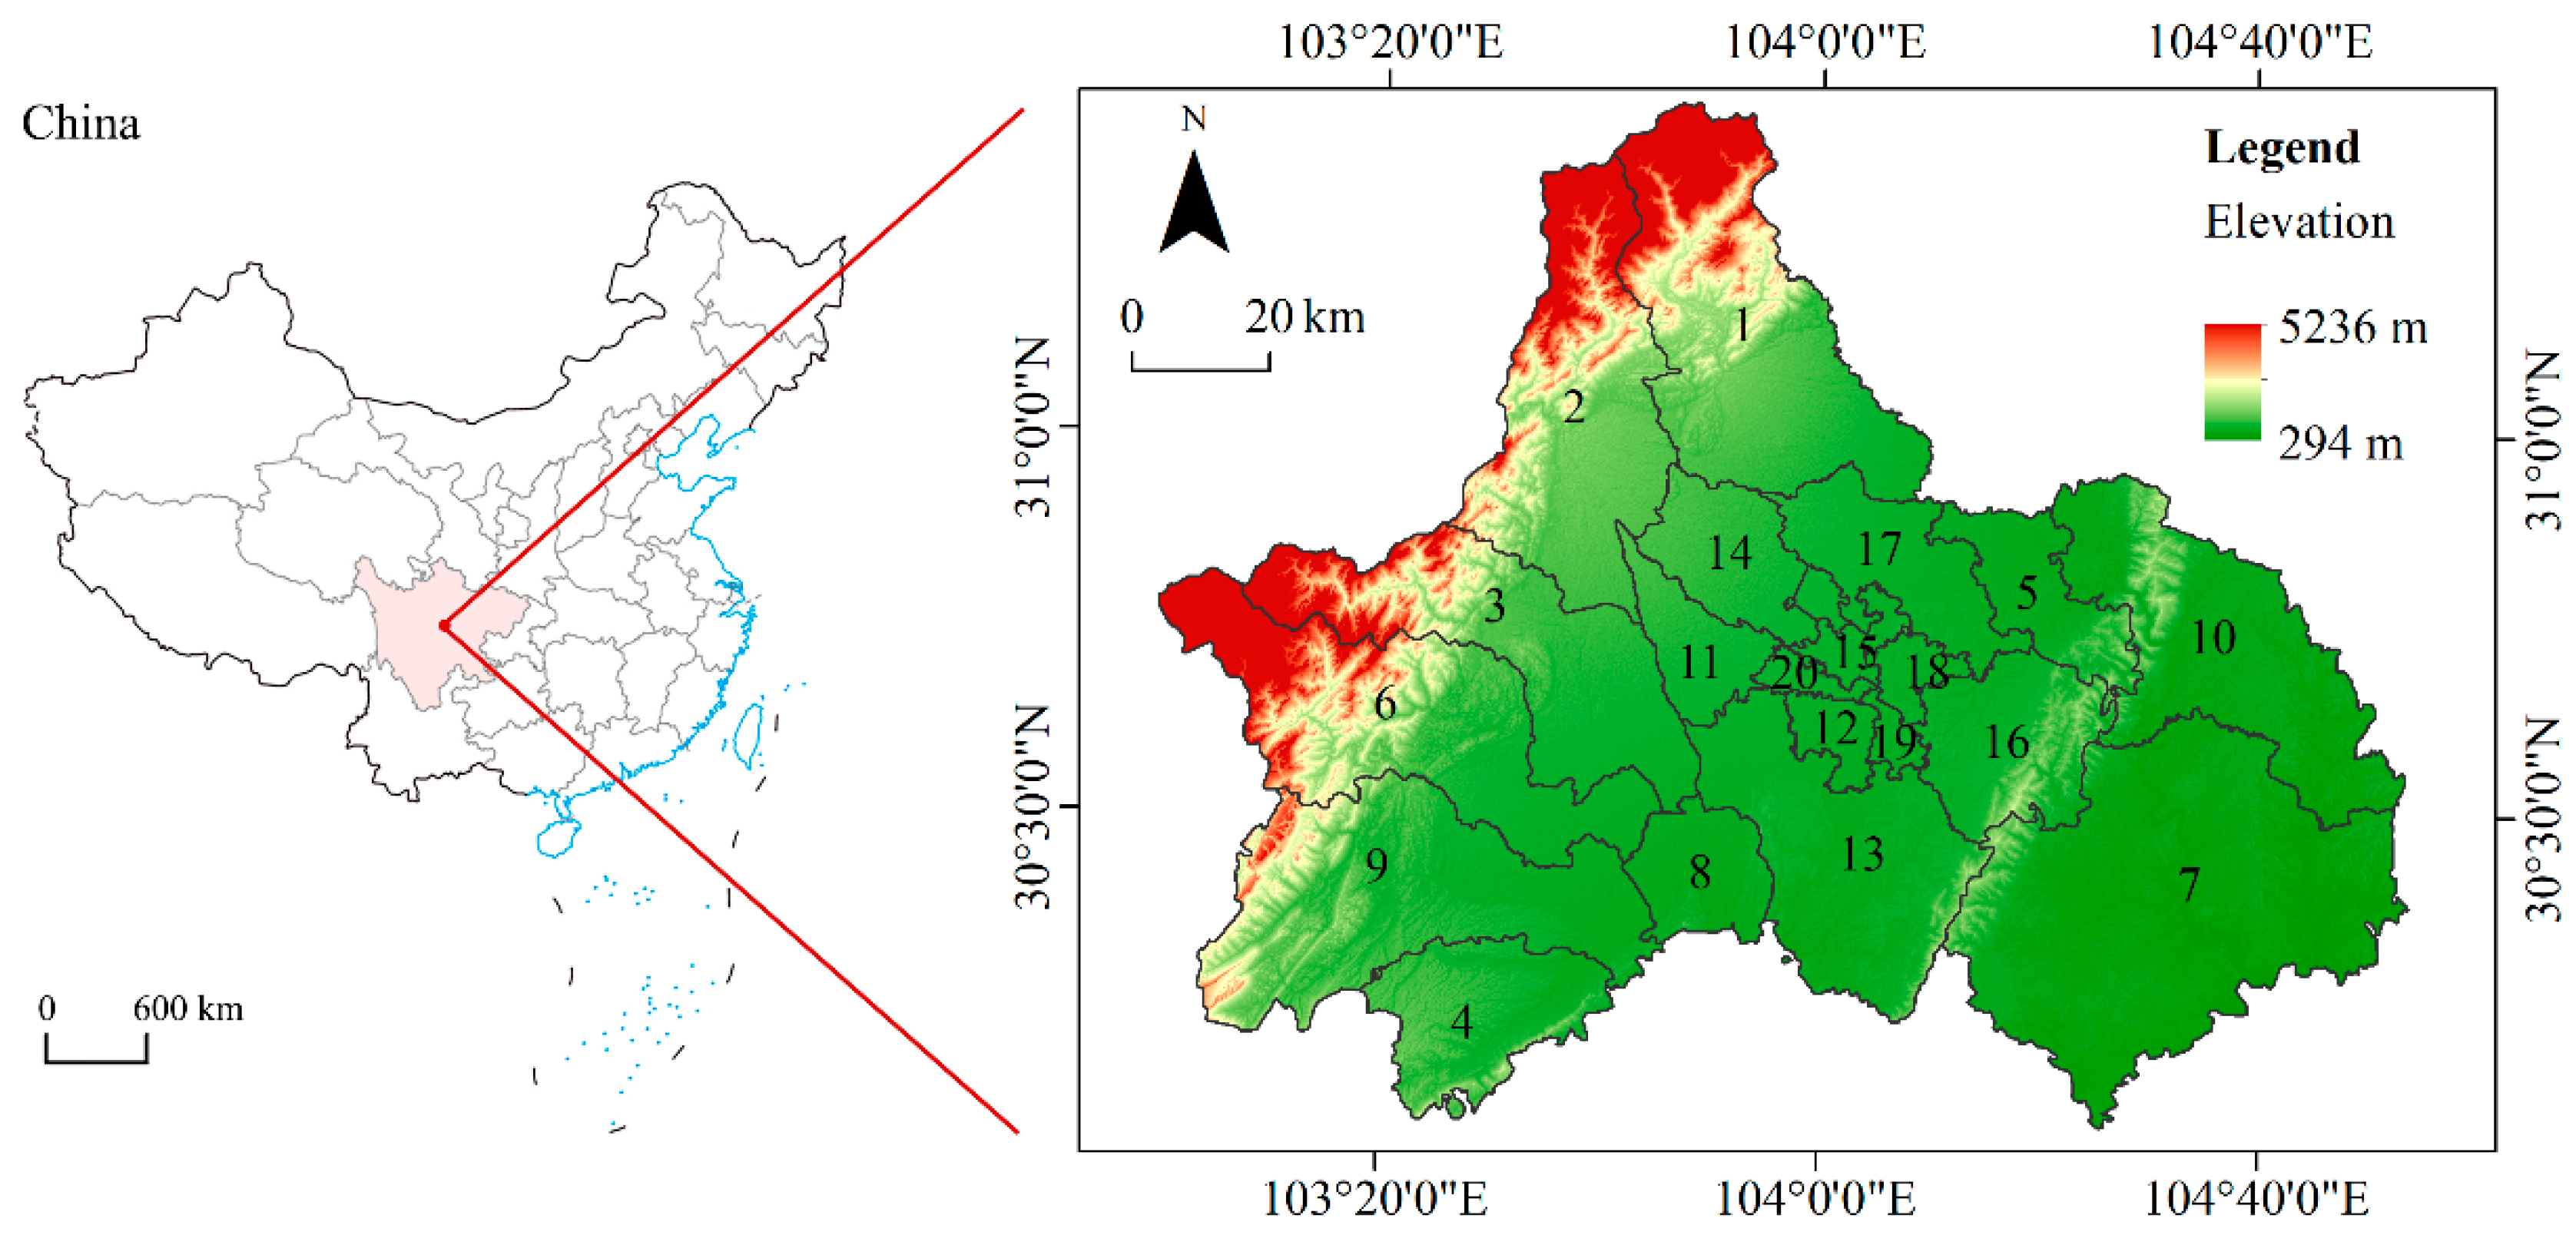
This study established a research framework for the identification and spatiotemporal evolution analysis of URF that comprised two main components (Figure 1). Firstly, based on multidimensional urbanization elements such as Point of Interest (POI), Gross Domestic Product (GDP), Population Density (PD), Land Use/Land Cover Change (LUCC), and Night-time Lights (NL) data, this paper conducted K-means clustering to identify the URF of Chengdu City from 2010 to 2020 and verify the results by comparing them with the current land use status. Secondly, it analyzed the spatiotemporal changes and land use transfers within the URF from 2010 to 2020. Data such as the growth area and Average Annual Growth Rate of the URF in Chengdu City were calculated, thereby examining the patterns and causes of URF evolution.

2.1. Study Area

Chengdu City (30°40′ N, 104°06′ E–104°47′ E), located in the central part of Sichuan Province, China (Figure 2), is characterized predominantly by plains surrounded by mountains and features numerous rivers. These geographical features provide favorable conditions for agricultural development, urban construction, and ecological sustainability [48]. Chengdu is strategically positioned in regard to national development as a national central city and a Livable Park City, playing a leading and radiating role in the western region to promote coordinated regional development and the implementation of the country’s overall strategy [49,50].
Chengdu, the provincial capital of Sichuan Province and the second-largest city in western China (after Chongqing), is one of the regions that initiated integrated urban–rural development at an early stage. For over a decade, it has remained a primary city for research on urban–rural integration. In 2007, Chengdu was designated as a national pilot zone for comprehensive urban–rural integrated reform. As a key national central city in western China and a principal driver in the construction of the Chengdu–Chongqing urban agglomeration, it carries out the significant task of exploring urban–rural reform and development strategies and advancing the development of a new type of urbanization. With the continuous deepening of the urbanization process, the urban–rural relationship in Chengdu has gradually shifted from a city-led approach to urban–rural integration. Therefore, research findings on its peripheral areas are typical and serve as a reference for similar studies.
According to the results of the seventh national census, as of 1 November 2020, the permanent population of Chengdu City has reached 20.95 million people. Starting from 14.05 million in 2010, the Average Annual Growth Rate over nearly 10 years has been about 4%, making it one of the typical megacities in China [51]. Since the 1990s, Chengdu has entered a process of rapid urban expansion, with the built-up area of the city increasing dramatically and gradually expanding into the rural areas surrounding the city [52]. The spatial agglomeration effect of urban elements has continuously strengthened and the spatial structure of the city has gradually evolved, with several satellite cities emerging around the city center, shifting from an initial “single-center” configuration to a “multi-center” urban structure [53,54]. In the process of adapting to this change, peripheral rural areas have experienced some developmental lags and disconnects that have exacerbated the differences between the urban and rural areas. As a pioneer area of integrated urban–rural development, the problem of urban–rural conflict in URF areas needs to be urgently resolved.
Chengdu utilizes ring roads to plan and regulate urban development, delineating the urban area into the First Ring Road, Second Ring Road, Third Ring Road, and the Fourth Ring Road (also known as the bypass expressway) [55]. Initially, the Third Ring Road was designated as the boundary for the Central City Planning and Control Area, signifying the boundary of Chengdu’s central urban area at that time. Completed in 2002, the Third Ring Road has evolved into a vital arterial road for the central urban area due to rapid urban expansion. By 2015, in accordance with the “Chengdu City Master Plan (2011–2020)”, the Central City Planning and Control Area was redefined, taking the Fourth Ring Road (bypass expressway) as the reference, covering a total area of approximately 630 km2. This planning Control Area is an administrative planning unit delineated by the Chengdu Municipal Planning Bureau in accordance with the needs and strategic positioning of the city’s development, with the aim of planning the management and control of construction activities in the central urban area.
On the other hand, the actual built-up area of Chengdu City increased from 456 km2 in 2010 to 977 km2 in 2020, with an average annual growth of approximately 52 km2. This significant increase indicates that the decade from 2010 to 2020 was the most remarkable period of built-up area expansion in Chengdu City since the reform and opening-up policy was implemented [54]. Consequently, this paper selected this period as a representative timeframe for the study, aiming to reveal the developmental characteristics of the URF in the process of rapid urbanization.

2.2. Data Sources and Data Preprocessing

2.2.1. Selection of Key Urban Feature Parameters for Identifying URF and Data Sources

Identifying key urban characteristic parameters is crucial for delineating the extent and analyzing the spatiotemporal evolution of a URF [56]. Spatial indicators, such as population migration, land use change, intensification of human activities, variations in built-up areas, and alterations in the distribution density of service facilities, are the primary characteristics of urban development in China. Moreover, compared to single data sources, multi-source data can more accurately delineate urban features, thereby enhancing the precision of identification. Therefore, this study integrated domestic and international research perspectives on URF and identified key datasets that are essential for URF identification, including Gross Domestic Product (GDP), population density (PD), Land Use/Land Cover Change (LUCC), Night-time Lights (NL), and Point of Interest (POI) data; the sources of these data are detailed in Table 1.
The extended time-series NPP-VIIRS nighttime light data is a global 500 m resolution dataset covering the period from 2010 to 2020, processed using a cross-sensor correction scheme based on a self-encoder. The data have undergone a masking process, where the water body areas in the night-time light data have been excluded. Population density data refers to the number of people per unit area of land, sourced from the WorldPop dataset, with a spatial resolution of 100 m. The POI data comprise geographical objects that can be abstracted as points, especially geographical entities closely related to people’s lives [25]. In this study, the POI map data were divided into 13 service categories: automobile services, motorcycle services, accommodation services, government agencies, health care, sports and leisure, life services, business and residential, science and education, finance and insurance, transportation facilities, shopping services, and scenic spots. Given that road ancillary facilities and place names usually represent non-substantive information, such as road section identification, administrative place names, natural place names, and traffic place names, they were not selected. Due to the lack of 2010 data for the same source POI, 2012 data were used as a substitute. GDP is one of the critical indicators for socio-economic development, regional planning, and the protection of natural resources and the environment. The GDP spatial distribution grid dataset used in this paper is sourced from the Resource and Environmental Science Data Registration and Publishing System and features a spatial resolution of 1 km. Due to the absence of data for the year 2020 in the dataset, 2019 data are used as a substitute. China’s National Land Use and Cover Change Remote Sensing Monitoring Dataset (CNLUCC), established by the Chinese Academy of Sciences based on the National Resource and Environment Database, has primarily utilized the Landsat remote sensing imagery data from the United States as the main source of information. Through visual interpretation, a national-scale remote sensing monitoring database with a scale of 1:100,000 and a spatial resolution of 30 m has been created. The remote interpretation for the 2010 data mainly employed Landsat-TM/ETM remote sensing imagery, while the land use/cover data updates for 2015 and 2020 primarily used Landsat 8 imagery. The database adopts a three-level classification system (Table 2): the first level is divided into six categories, mainly based on land resources and their utilization attributes, including arable land, forest land, grassland, water bodies, construction land, and unused land; the second level is primarily based on the natural attributes of land resources divided into 25 types.

2.2.2. Data Preprocessing

Since varying grid sizes may influence the understanding and interpretation of urban spatial characteristics [15], determining an appropriate grid scale is an essential step in the study. By conducting sampling through the division of grid cells in the study area and integrating the actual conditions of Chengdu City with references from the relevant literature, it was found that adopting a 1 km × 1 km grid size as the standard sampling unit ensures a balance between spatial information extraction and the maintenance of analytical stability. Therefore, a 1 km × 1 km grid size was ultimately selected as the basic unit.
Simultaneously, in the ArcGIS 10.8 (ESRI, Redlands, CA, USA), preprocessing was conducted on the relevant data for the years 2010, 2015, and 2020. This included (1) transforming all geographic coordinate data to the WGS 1984 coordinate system and projecting it onto the UTM_Zone_48N coordinate system; (2) extracting the administrative boundaries of Chengdu City and constructing a 1 km × 1 km grid system within this area, which resulted in a total of 13,828 sampling areas; (3) gridding the POI data within the scope of Chengdu City, counting the number of POI within each grid. Concurrently, resampling the PD, GDP, NL, and LUCC data at a 1 km × 1 km resolution to ensure spatial consistency of the data. (4) Reclassifying the LUCC data and calculating the area and proportion occupied by each primary and secondary category.

2.3. K-Means Clustering of GeoDa

K-means clustering, as an unsupervised classification algorithm, can directly identify regional types at the pixel scale, requiring no special urban morphology conditions [57]. Compared with other methods, such as the threshold method and mutation point detection method, this method has a broader scope of application and can more delicately recognize the details of the URF transition zone with less uncertainty in the identification results [58]. It also addressed issues of insufficient objectivity reported in previous studies, making it particularly suitable for identifying the URF of polycentric cities. Therefore, this study employed K-means clustering within GeoDa 1.18 (GeoDa Center for Geospatial Analysis and Computation, Tempe, AZ, USA) software as a method for identifying the extent of the URF.
This study aims to identify the extent and evolution patterns of the URF in Chengdu from 2010 to 2020 using the spatiotemporal dynamics characteristics of PD, GDP, NL, LUCC, and POI data. The introduction of the K-means clustering method was based on the assumption that URF areas would exhibit distinct differences from urban areas and rural areas in terms of population density, distribution of GDP, the proportion of land used for construction, the intensity of human activities, and the distribution density of service facilities, thereby extracting the URF through gradient classification [59]. Therefore, effective extraction of the URF required the aforementioned accurate comprehensive local data, confirmation of the k-value in the K-means clustering, and calculation of the accuracy of the clustering results.
Subsequently, a K-means clustering analysis was performed on these data using the default algorithm K-means++ with initialization re-runs set to 150 and a maximum of 1000 iterations [60]. The clustering results corresponding to each K-value in different years were visually presented.

2.3.1. The Elbow Method

One useful approach is to plot the objective function against increasing values of k using the Elbow method. The goal of the elbow plot is to find a kink in the progression of the objective function against the value of k. From this elbow value, the sum of squares (inertia) begins to decrease linearly and is therefore considered optimal. This study imported the preprocessed multi-year data into the GeoDa 1.18 software and plotted the objective function based on the annual increment of k to draw the elbow plot and determine the optimal number of clusters in the K-means clustering analysis.

2.3.2. Selection of Normalization Method

Since the objective function for K-means clustering is sensitive to the scale at which the variables are expressed, using Median Absolute Deviation (MAD) normalization instead of Z-score normalization can mitigate this impact. MAD is suitable for non-normally distributed data, making it a potentially more appropriate choice in such cases [61]. For example, validation through experimentation with 2010 data indicated that the clustering results using the MAD normalization method were superior to those obtained with Z-score normalization (Table 3).
Therefore, the data were used to construct a spatial weight matrix in the GeoDa 1.18 software and were normalized using the MAD method.

2.3.3. The Method for Evaluating Clustering Results

Since the total sum of squared errors (SSE) equals the sum of the within-group SSE and the total between-group SSE, a common criterion is to assess the ratio of the total between-group sum of squares (BSS) to the total sum of squares (TSS), i.e., BSS/TSS.
Total Sum of Squares (TSS): The sum of the squares of the distances of each data point from the center of the entire dataset, which is the mean of all data points. TSS reflects the total variability of the dataset.
T S S = i = 1 n x i x ¯ 2
In the equation, x i represents each individual data point and x ¯ denotes the mean of all data points.
Between-Cluster Sum of Squares (BSS): The sum of squared distances between the centroids of all clusters and the center of the entire dataset (the mean of all data points). The BSS reflects the degree of separation between different clusters.
B S S = j = 1 k n j c ¯ j x ¯ 2
In this context, k represents the number of clusters, n j denotes the number of samples in the j -th cluster, and c ¯ j signifies the centroid of the j -th cluster.
B S S / T S S = B S S T S S  
The quality of clustering is assessed by the ratio of the BSS to the TSS. A higher BSS/TSS ratio indicates a higher degree of separation between clusters and a lower degree of compactness within clusters, which usually suggests a better clustering effect.

3. Results

3.1. Determination of the Optimal Number of Clusters

3.1.1. Determination of the K-Value

Figure 3 presents the elbow plot results for the years 2010, 2015, and 2020. Taking into account the spatial patterns under different urban–rural gradients, and in conjunction with the objectives of the paper, the k-value was preliminarily set between 3 and 5 for further discussion.

3.1.2. Verification of the K-Value

K-values of 3, 4, and 5 were selected for clustering, and the clustering results corresponding to each k-value in different years were visualized as shown in Figure 4. Additionally, the BSS/TSS values for the clustering diagrams of different years under each k-value were calculated.
As shown in Table 4, the BSS/TSS ratios are all greater than 0.60 and gradually increase with the addition of K values. When K = 5, the BSS/TSS values are all higher than 70%. Moreover, the instances where the BSS/TSS values are below 70% are mostly obtained when K = 3 and K = 4. The higher the ratio, the better the separation of the clusters. After K = 5, the variation in the BSS/TSS significantly improved. Therefore, five was chosen as the optimal number of clusters.
Finally, the identification results were compared with remote sensing imagery base maps, and, after eliminating some discrete patches, the spatial scope of the URF for each year was delineated (Figure 4).

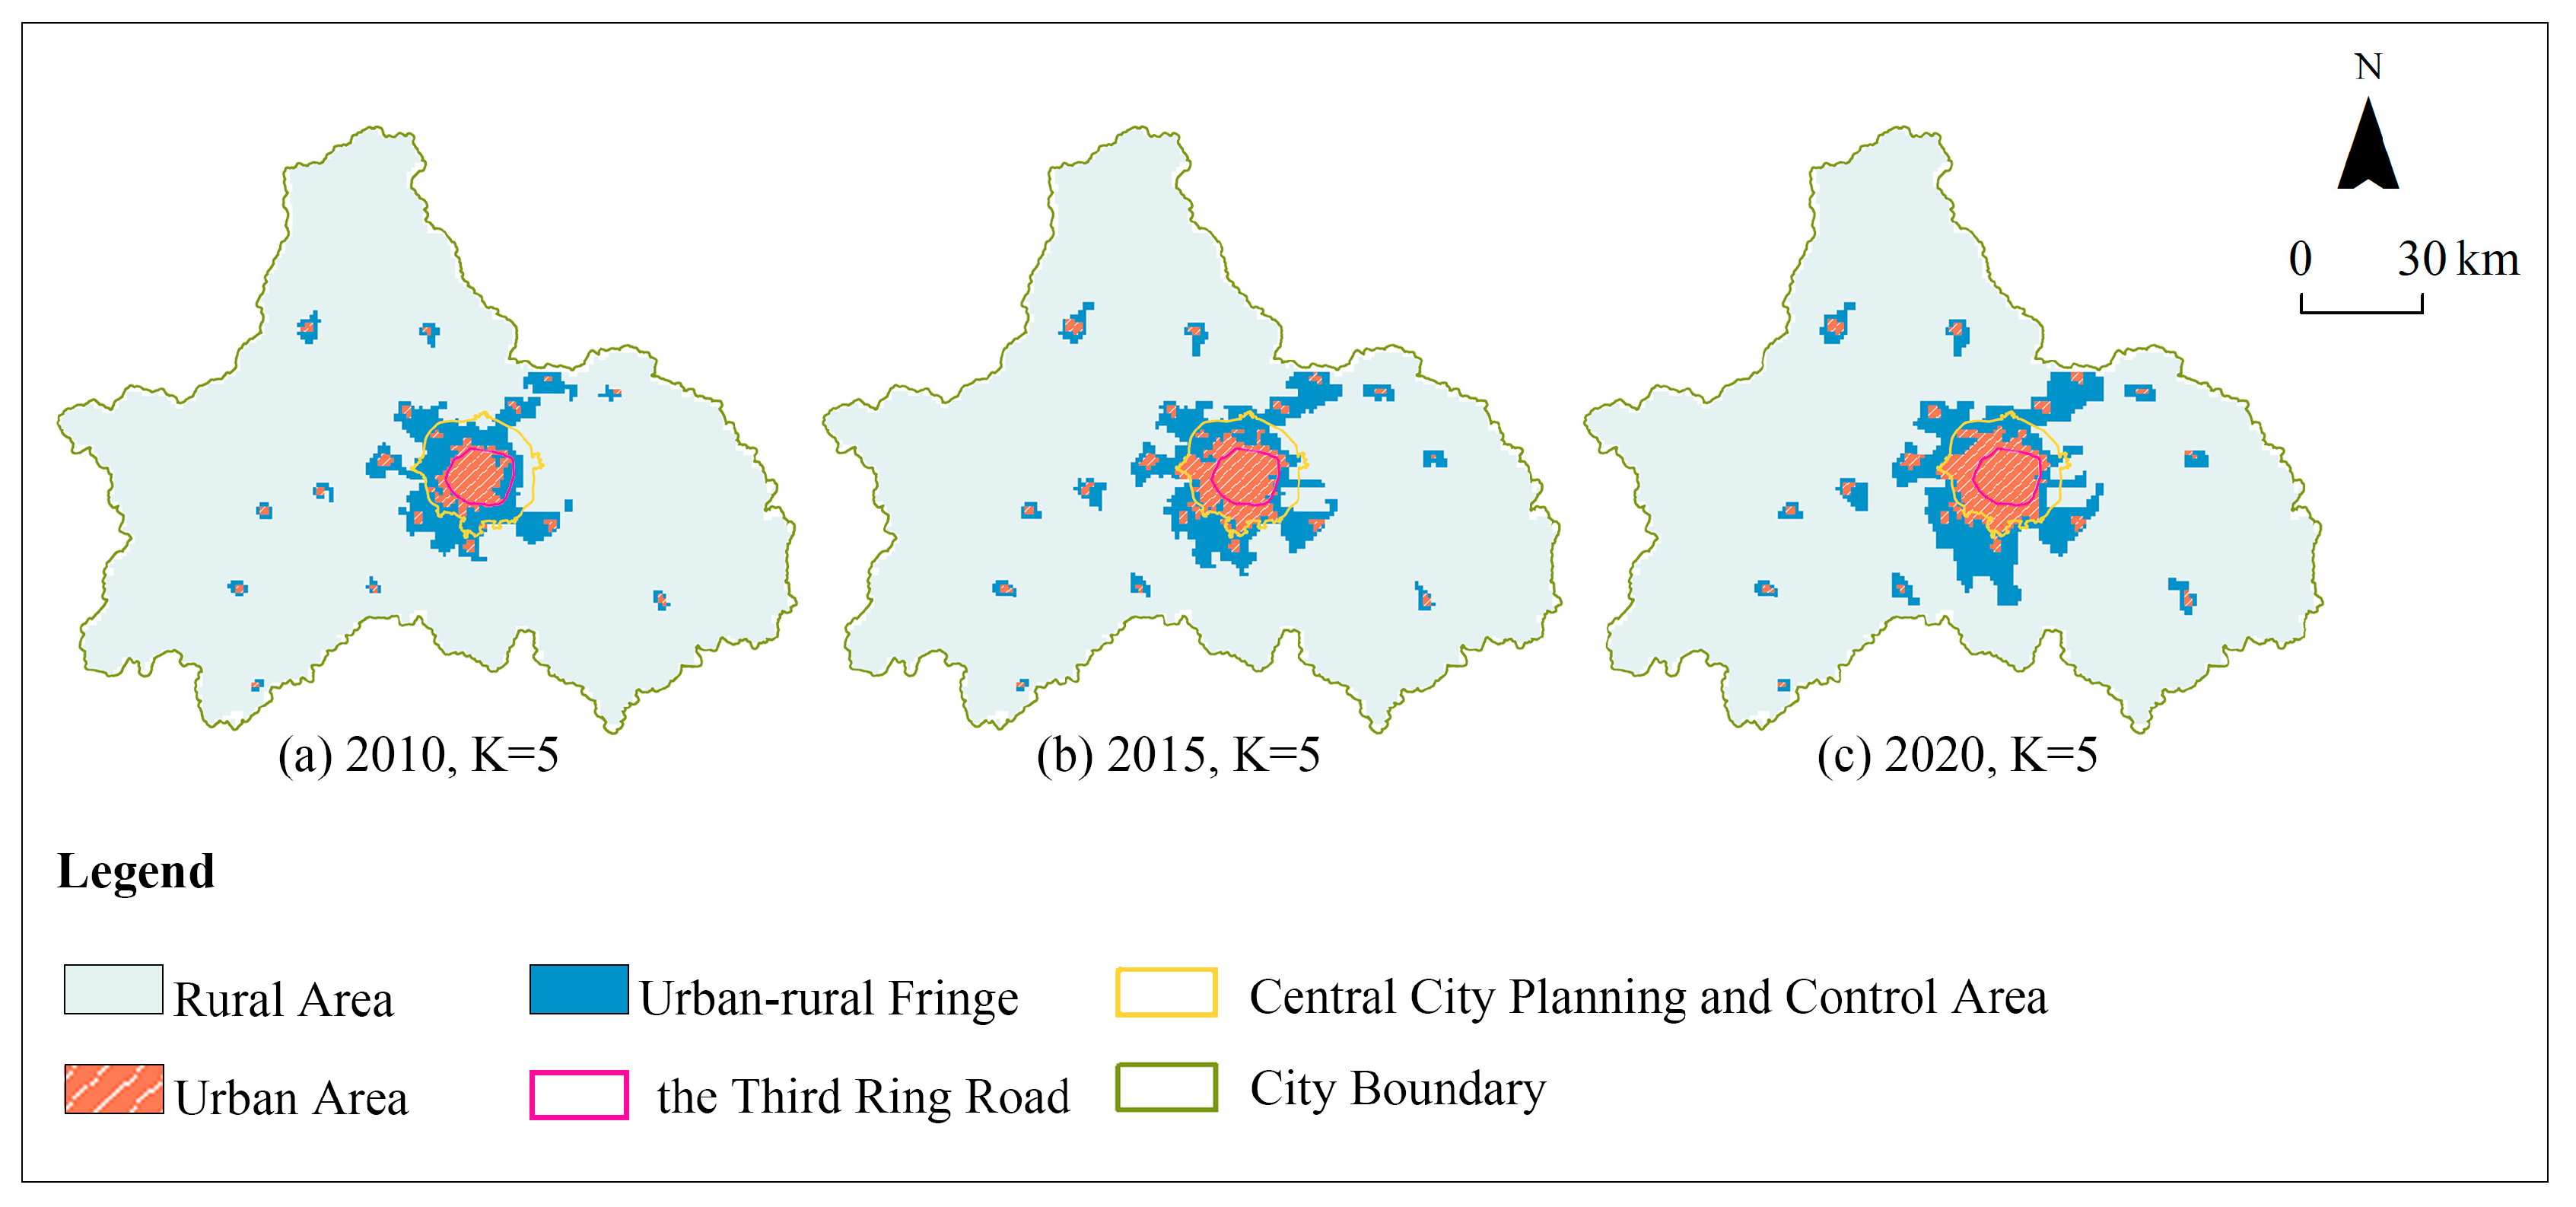
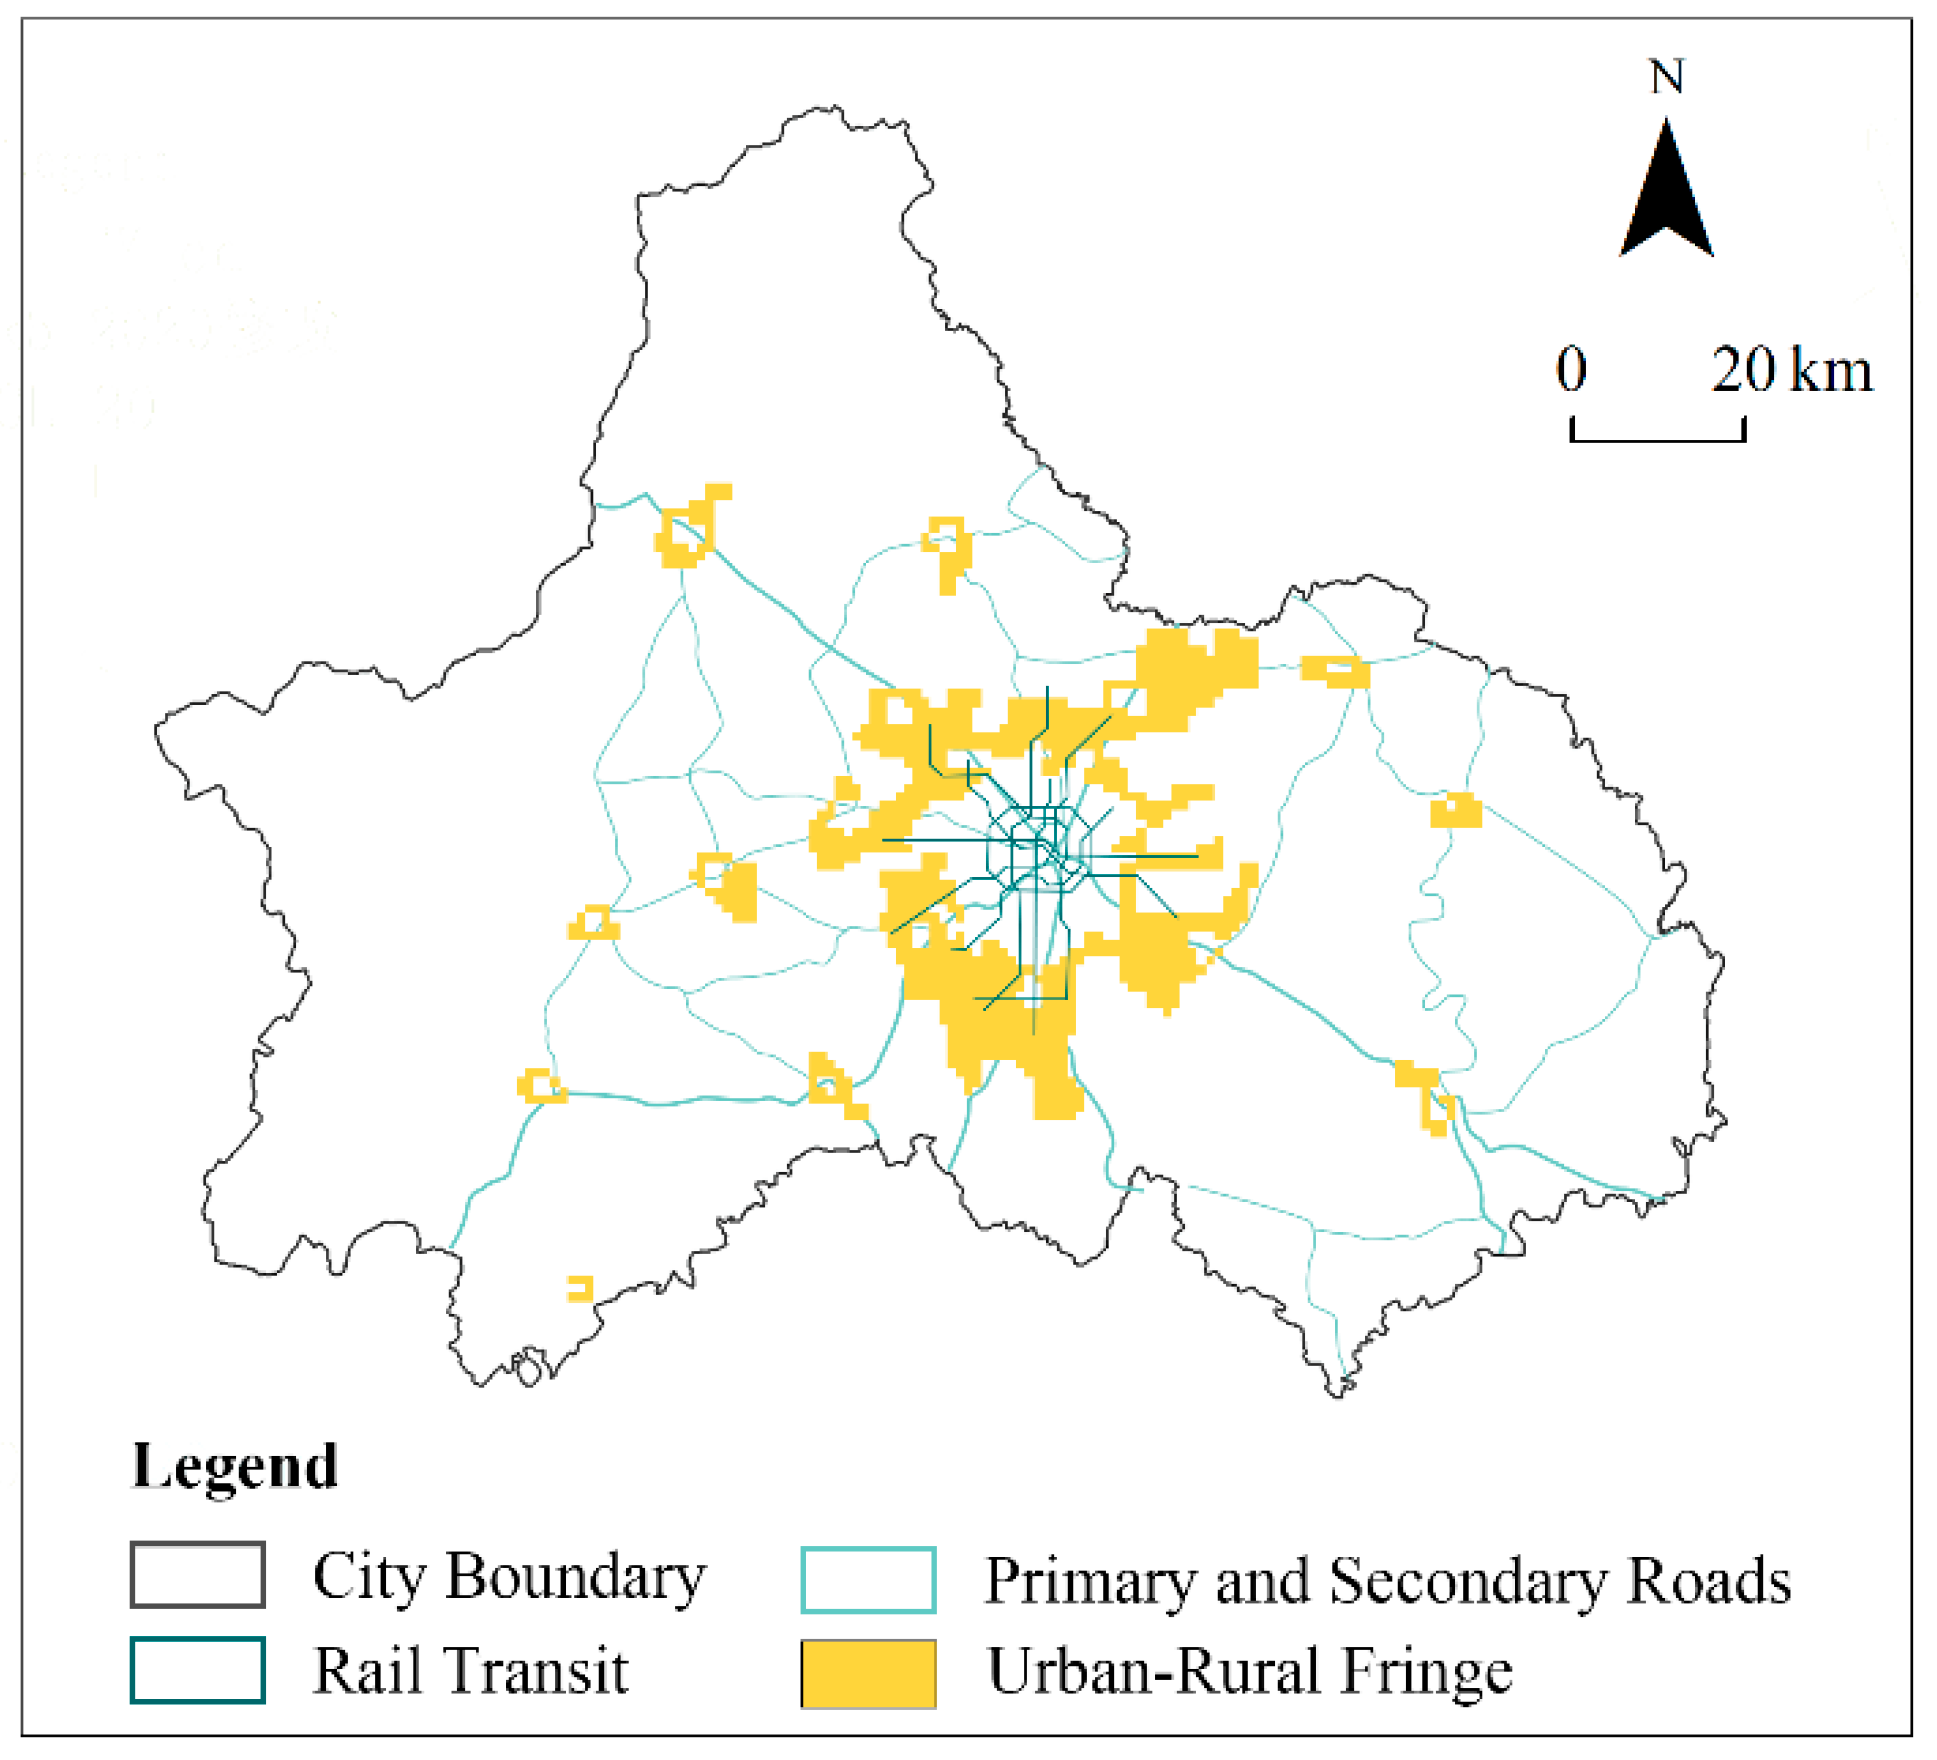
3.2. Identification of the URF by K-Means Clustering

The study identified and delineated the URF areas for the years 2010, 2015, and 2020 using the K-means clustering method. The area of the URF has consistently shown a growth trend, increasing from 868 km2 (accounting for 6.28%) in 2010 to 1000 km2 (7.23%) in 2015, to 1199 km2 (8.67%) in 2020 (Table 5).
Spatially, the K-means clustering method precisely divided Chengdu City into the main center and subcenters, the URF, and the rural hinterland. As seen in Figure 5, the city has a polycentric spatial structure of “main center-subcenters”. The identified URF mainly consists of two parts: one part of the URF is closely adjacent to the main center and suburban subcenters, distributed in a belt-like wedge shape around the centers, connected in patches, and interspersed with rural areas; the other part is scattered around exurban subcenters, exhibiting a more fragmented distribution.
In 2010, the URF was mainly concentrated in three areas. The first area was the periphery of the main center, where the URF was distributed between the Third Ring Road and the Central City Planning and Control Area. The second area was the periphery of the suburban subcenters, where the suburban URF was connected to the periphery of the main center, encircling the main center with a western width greater than the eastern width, exhibiting spatial heterogeneity. The third area was the peripheral region of the exurban core, which is relatively small in scale.
In 2015, the city center area experienced a noticeable expansion, with the western and southern urban areas extending beyond the Third Ring Road, approaching the Central City Planning and Control Area Line. The URF also expanded in response to urban growth; the expansion of the URF in the suburban areas was particularly evident in the southern and northeastern growth areas. As a result, the URF was mainly concentrated on the periphery of the southern and northern suburban core areas and was connected to the URF around the main center. Additionally, the URF expansion in the exurban areas was significant, gradually forming a certain scale around the exurban core areas.
In 2020, the expansion of the city center area slowed down overall and was basically controlled within the Central City Planning and Control Area Line. However, the URF experienced a significant large-area expansion to the south, and a small part expanded to the east and the periphery of the exurban core areas. As a result, the URF was mainly concentrated on the periphery of the suburban core areas to the south and was connected to the main center and suburban core areas in a ring shape.
From an overall development perspective, between 2010 and 2020, there was noticeable urban expansion in the northeast–southwest direction. The development of the URF had been synchronized with the expansion of urban areas, also showing a trend in expansion to the peripheries, causing the scattered URF to gradually expand and connect to form clusters. This shift indicates that the overall urban development has transitioned from a local cluster development model to a polycentric synchronous development model [62].

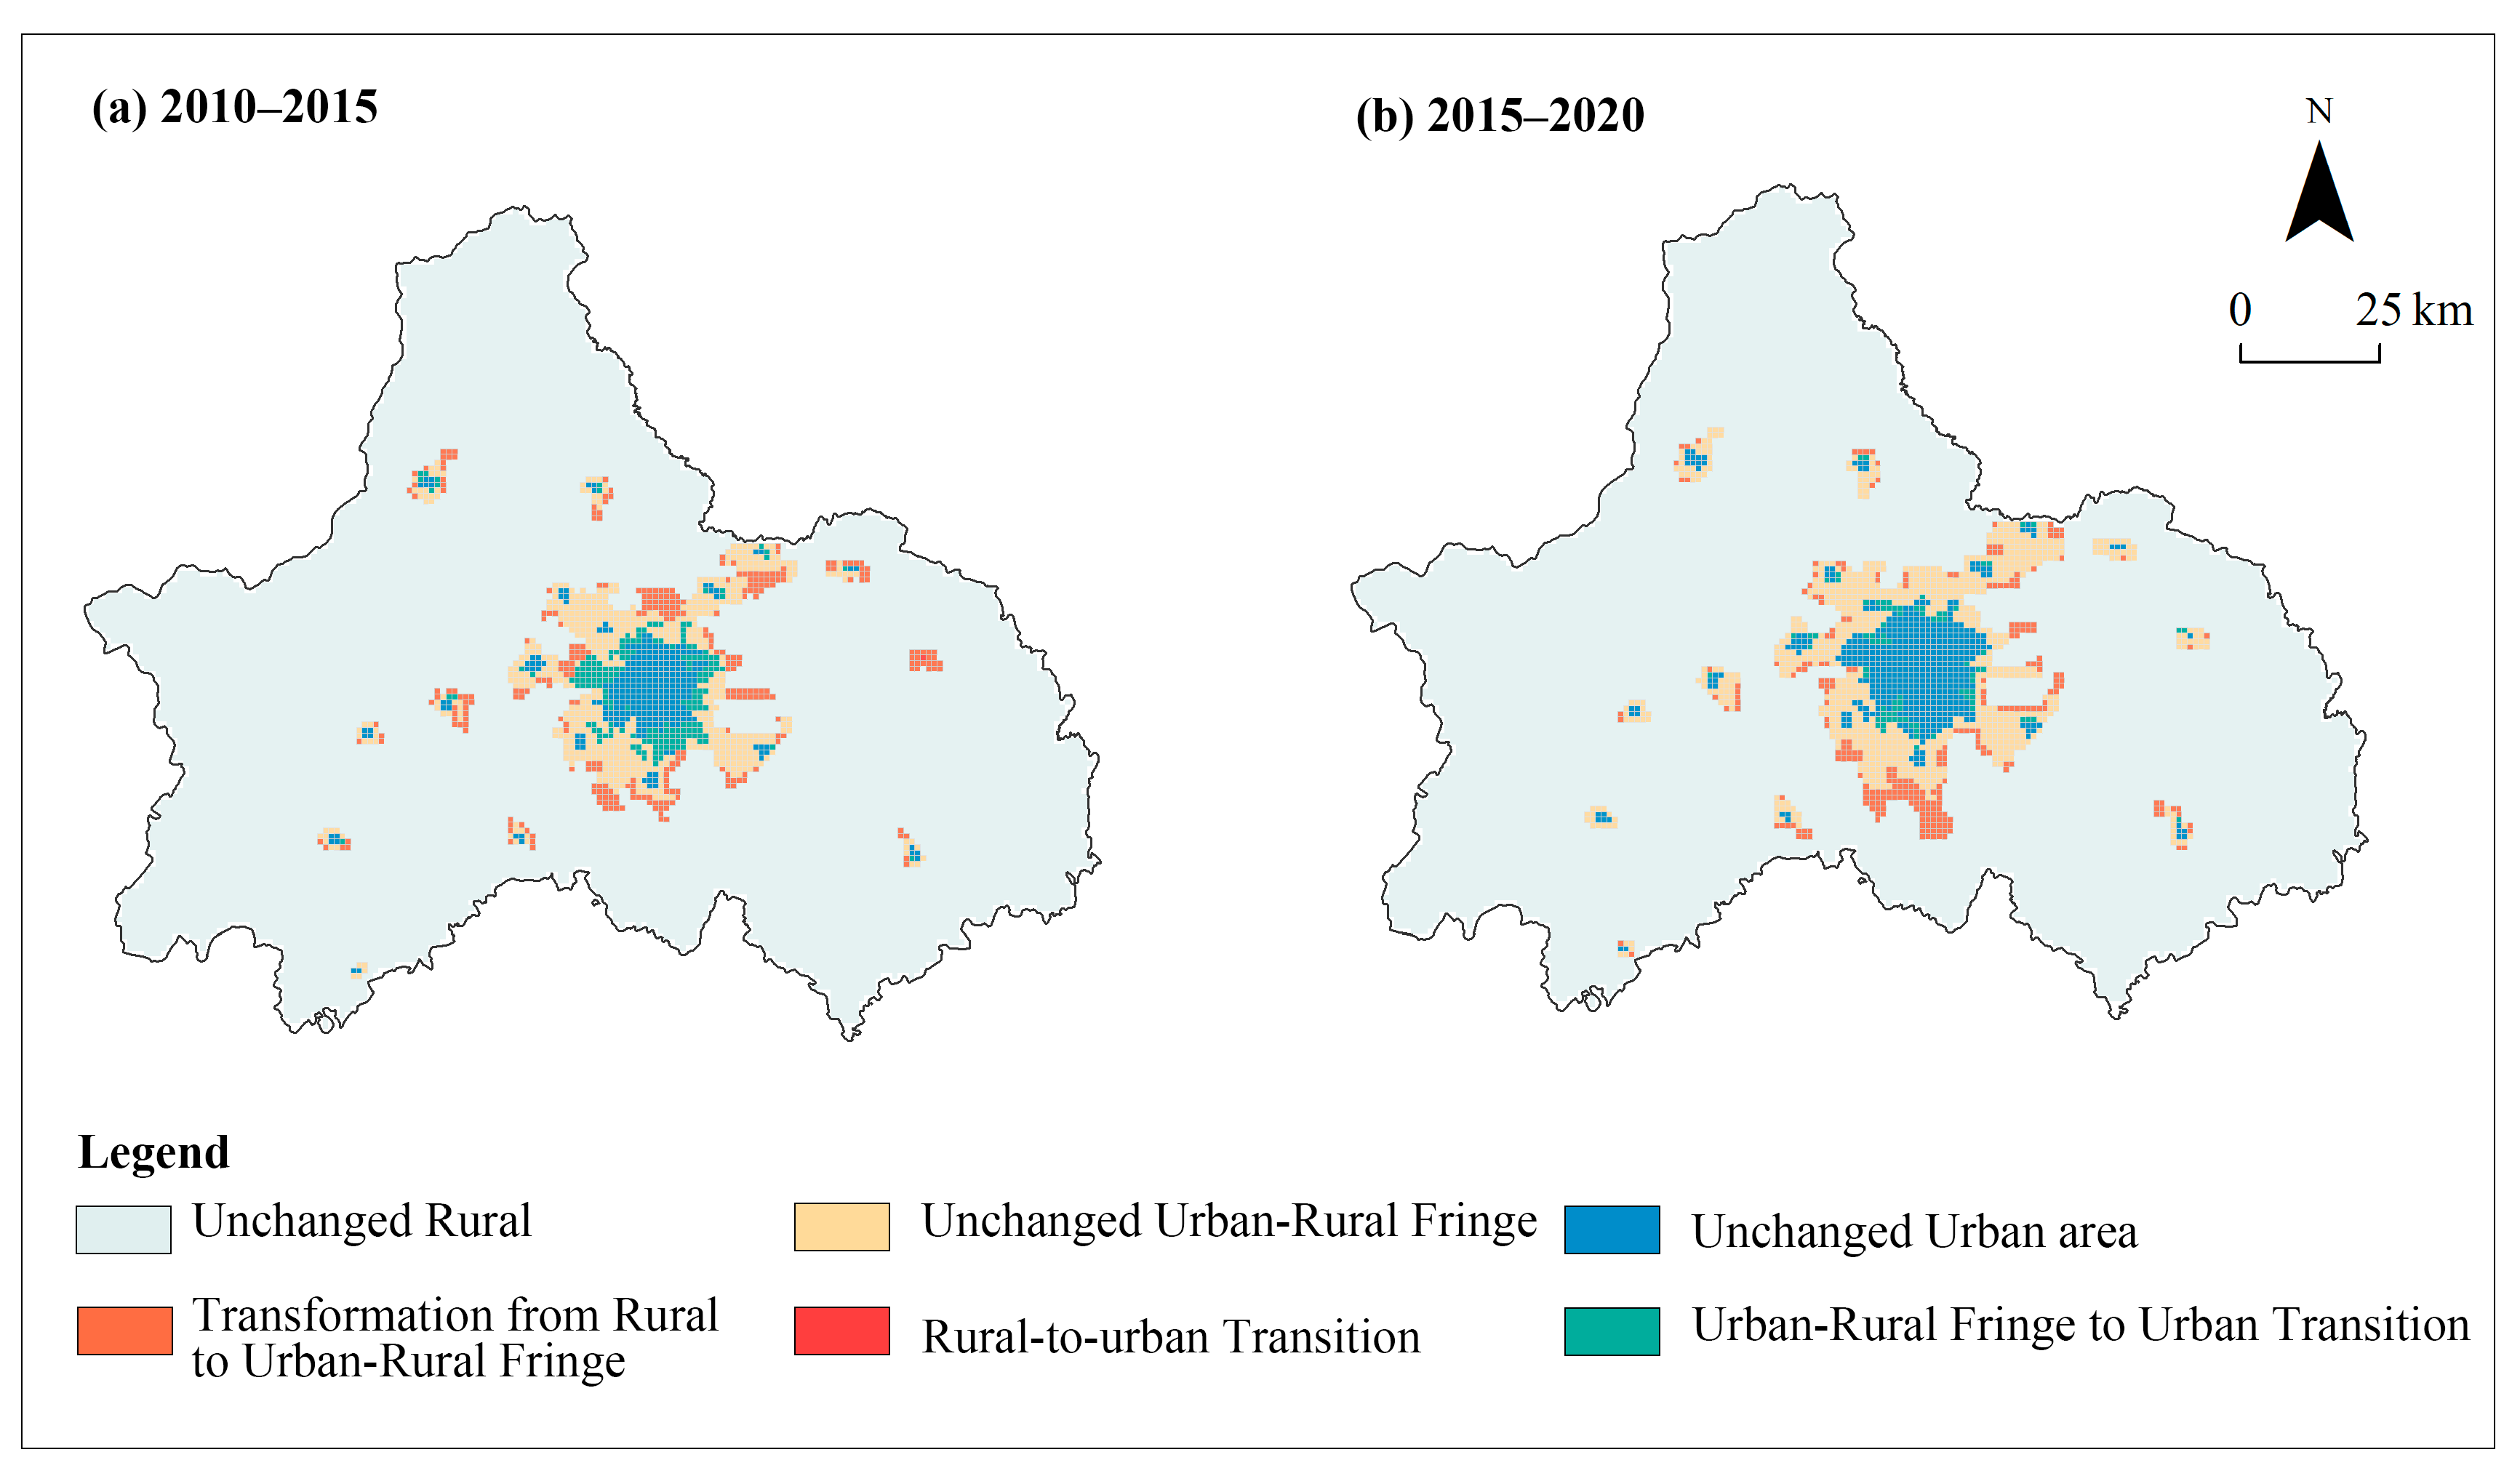
3.3. Analysis of the Spatiotemporal Evolution of URF and Its Land Use

3.3.1. The Spatiotemporal Evolution of URF

By calculating the growth area (GA) and Average Annual Growth Rate (AAGR) for urban, rural, and URF areas, respectively (Table 6), it can be observed that, with Chengdu City’s spatial expansion, the area of the URF increased by a total of 331 km2 from 2010 to 2020. Using 2015 as a boundary, Chengdu City’s urbanization showed an accelerated expansion from 2010 to 2015, with an AAGR of 10.76%. From 2015 to 2020, urban areas exhibited a decelerated expansion model, with the AAGR dropping to 3.35%. The URF areas consistently maintained a relatively stable GA and AAGR during the two time periods, which were 132 km2 (2.87%) and 199 km2 (3.70%), respectively.
It can be inferred that, during the rapid urbanization phase, various factors heavily invested in land as a factor of production, leading to low-density development and numerous semi-urban phenomena, causing the URF space to expand rapidly. In the later period, as the marginal benefits of urban expansion converged and spatial capital was optimized and restructured, the layout of factors began to develop in an orderly manner. However, due to the external spillover of housing demand, improvement of transportation infrastructure, industrial transfer, policy drives, urban planning inertia, and market forces, the URF continued to expand.
The Average Annual Growth Rate (AAGR) measures the mean rate of growth of a certain value over a period. The formula for calculating the AAGR is:
A A G R = v f v i 1 n 1
In the formula, v f represents the final value, v i represents the initial value, and n is the number of years.
Significant land use transfers occurred between urban areas, the URF, and rural areas from 2010 to 2020. Spatial distribution maps of the URF transitions in Chengdu City (Figure 6) indicate that, from 2010 to 2015, a large area of the URF transformed into urban areas, totaling 191 km2 and accounting for 39.79% of the total urban area, primarily concentrated around the city center. The increased URF area, amounting to 323 km2 or 32.30% of the total URF area, resulted mainly from the transformation of rural areas, predominantly in the northeastern and peripheral areas of the existing URF in subcenters.
From 2015 to 2020, the transformation of URF into urban areas decreased to 86 km2, representing 15.19% of the total area. The added URF areas primarily resulted from rural areas transitioning into URF areas, mostly in the southern regions, totaling 285 km2 and constituting 23.80% of the total area. Analysis of the URF area structure at various stages revealed the URF areas transitioning into urban areas and the rural areas transitioning into the URF showed an initial increase followed by a decrease. Additionally, the newly added URF areas were mostly in the northeastern and southern regions and exhibited a patchy growth pattern.
From an evolutionary perspective, on one hand, rural areas surrounding the URF have been transitioning into a semi-urbanized state and have been evolving into new peripheries of the URF. On the other hand, regions within the URF that have become highly urbanized are progressively separating from the URF and transforming into urban areas. This indicates a dual mechanism of urban sprawl and rural urbanization that is driving the spatial shift and structural evolution of the URF. This trend in evolution aligns closely with the national policies of “Urban-Rural Integration” and “Rural Revitalization”, as well as the urban policy direction of “Eastward Expansion and Southward Development” in Chengdu [48].
The 13th Party Congress of Chengdu proposed the urban spatial development strategy of “Eastward Expansion, Southward Development, Westward Control, Northward Renovation, and Central Optimization” (Figure 7). Among these, “Eastward Expansion” and “Southward Development” are key planning initiatives aimed at achieving strategic positioning as a national central city, a livable and beautiful park city, an international gateway hub, and a world-renowned cultural city [63].
The Eastern New Area focuses on advanced manufacturing, such as aviation manufacturing and smart energy, building a modern logistics and intelligent manufacturing industry system with an aviation economy at its core. It also develops the sports industry to create an internationally renowned city for hosting major sports events. Meanwhile, the High-Tech Zone in southern Chengdu focuses on the development of financial business, scientific and technological research and development, software outsourcing, e-commerce, and high-end service industries [64]. This zone promotes emerging industry clusters such as the internet, big data, and artificial intelligence.
On the other hand, driven by policy support, transportation development has also significantly contributed to the rapid growth of the URF [32]. From 2010 to 2020, Chengdu’s rail transit network developed rapidly. As illustrated in the overlay map of Chengdu’s rail transit and the URF range in 2020 (Figure 8), both the rail network and the URF exhibit a ring-shaped and radial structure, with the URF expanding into rural areas along major transportation axes. The URF has gradually connected these initially independent wedges, with the ring part of the URF in the main center and the suburban areas becoming wider compared to 2010. The ring part of the URF in exurban areas also gradually widened. Moreover, most of the newly added URF areas were located in the Chengdu High-Tech Zone and the Chengdu Economic and Technological Development Zone.
Most transitional areas have experienced successive urban expansion or development at the urban fringe, initially transitioning from rural areas to the URF and gradually transforming into urban areas. Overall, the URF has shown a trend in changing from a dispersed, multi-zone distribution area to an interconnected and concentrated whole.. URF areas that remain unchanged are primarily located in the suburbs and exurbs, where they are distant from subcenters, sparsely distributed, and smaller in size. These types of URF have rarely transformed into urban areas, exhibiting only minor incremental changes. Rural urbanization has significantly driven these isolated URF areas, yet it has been insufficient in substantially converting the rural landscape into densely built-up areas [58]. Furthermore, only a minimal area of undeveloped rural regions has directly transformed into urban areas through a spatial leapfrog pattern.

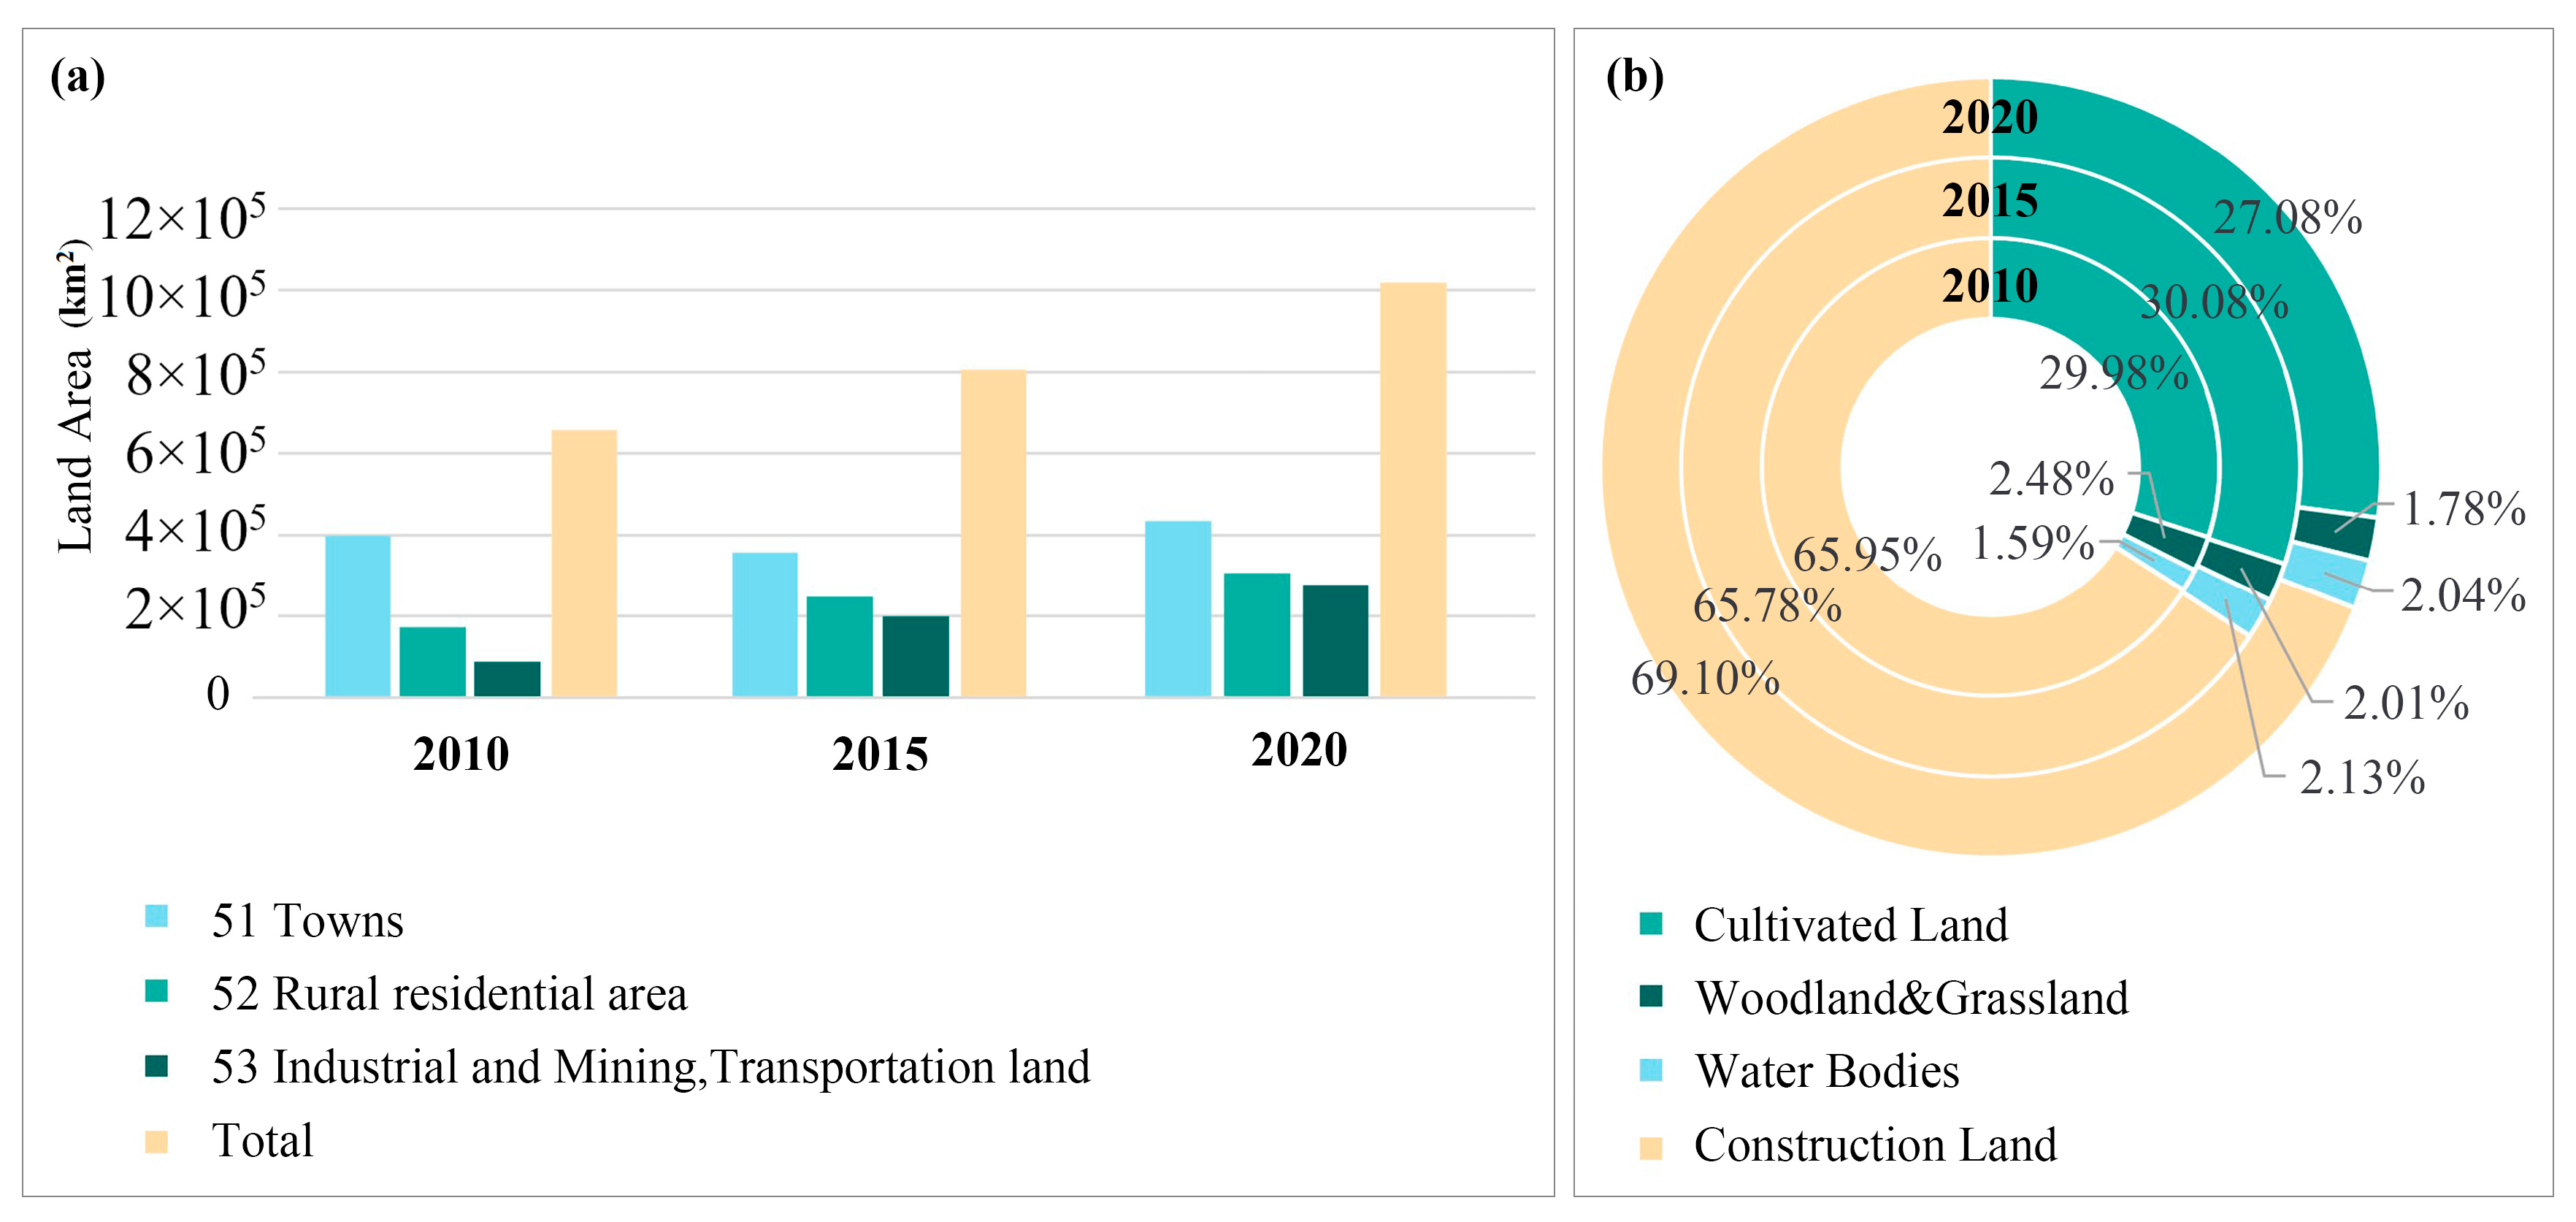
3.3.2. The Spatiotemporal Evolution of Land Use in URF

Observing land use changes in construction land (Figure 9), it can be seen that from 2010 to 2015, the proportion of land used for 51 Town construction in Chengdu’s URF decreased, while the proportions of 52 Rural Settlement and 53 Land for Industrial and Commercial Construction (I and C Land), particularly the latter, increased significantly. This substantial increase in 53 I and C Land can be attributed to the rapid expansion of the URF in conjunction with the urbanization process, where the original URF areas gradually transformed into urban areas. Although the absolute area of 51 Town land use increased, the proportion declined. Concurrently, the policy for urban–rural integration encouraged the improvement of infrastructure, enhancement of living environments, development of industrial parks, and expansion of urban transportation networks, resulting in a continuous increase in the absolute areas of 52 Rural Settlement and 53 I and C Land. However, the rise in economic activities exerted certain pressures on the ecological environment, leading to a decline in the proportion of forest and grassland areas. From 2015 to 2020, due to the development hotspots of emerging industries and the service sector, the total area of the URF continued to grow, but the growth of land use proportions for 51 Town, 52 Rural Settlement, and 53 I and C Land slowed down. This deceleration can be attributed to a slowdown in economic growth and land resource tension, leading to reduced land supply and a slower pace and scale of land development. Policies have gradually emphasized land use multifunctionality [65].
Simultaneously, observations from the charts (Figure 9) indicate that, from 2010 to 2020, the most significant changes in the URF were in construction land and cultivated land areas. The overall trend in land transfer involved the conversion of cultivated land, woodland, and water bodies to construction land, with cultivated land seeing the highest rate of conversion. This trend was attributed to the rapid urbanization process experienced by the URF during the period, accompanied by urban space expansion and the enhancement of urban functions [66]. Notable land use changes have included transforming cultivated and unused lands into construction land to meet the demands of population growth and urban expansion.
It is important to note that, although the proportion of cultivated land remained stable at around 30%, this was primarily due to the external supplementation of cultivated land from URF expansion. The land structure did not achieve a true balance, and similar issues existed for woodland and water bodies. This reveals that, during the urbanization process, the conversion of natural vegetation lands, such as cultivated land and woodland, into construction land led to ecological issues in the URF, including ecosystem degradation and a reduction in biodiversity, which are becoming increasingly apparent. This trend is expected to intensify in the future, necessitating immediate attention [67].
Overall, the URF of Chengdu has experienced continuous expansion from 2010 to 2020, evolving from a local cluster development model to a polycentric synchronous development model and achieving a significant scale. This evolution has been fundamentally influenced by a complex interplay of economic, policy, social, and environmental factors. Economically, the URF serves as a direct catalyst for growth. The pace, intensity, and structure of economic development have been pivotal in shaping the URF’s scale, spatial distribution, and land use functions. These factors have been instrumental in driving the growth of industries and transportation infrastructure within the URF [68]. In terms of policy, the promotion of urban–rural integration has resulted in a progressive spillover of urban functions into the URF. In particular, new district plans in the eastern and southern regions focusing on financial services, economic and technological development, and emerging industrial clusters have played a guiding role in the URF’s developmental trajectory [69]. Socially, the steady increase in Chengdu’s population has generated urban demands for spatial expansion in the URF for various sectors, including industry, commerce, residential areas, and transportation. Concurrently, there has been a notable improvement in infrastructure and public services, with an increasing emphasis on the quality and efficacy of urbanization. This focus has forged a more intricate and robust connection between the URF and the city center [70]. Environmental considerations also play a significant role. Chengdu’s flat topography offers advantageous conditions for urban fringe development. The flat terrain alleviates the engineering challenges and costs associated with infrastructure and land development. It facilitates the construction of vital transportation networks, such as roads, railways, and airports, thereby enhancing the region’s accessibility and mobility. Moreover, the topography supports diverse land use practices, including residential, commercial, industrial, and agricultural development, further fueling the URF’s growth [71]. In conclusion, the URF of Chengdu has demonstrated steady development, shaped by a confluence of economic vitality, strategic policy initiatives, societal needs, and favorable environmental conditions.

4. Discussion

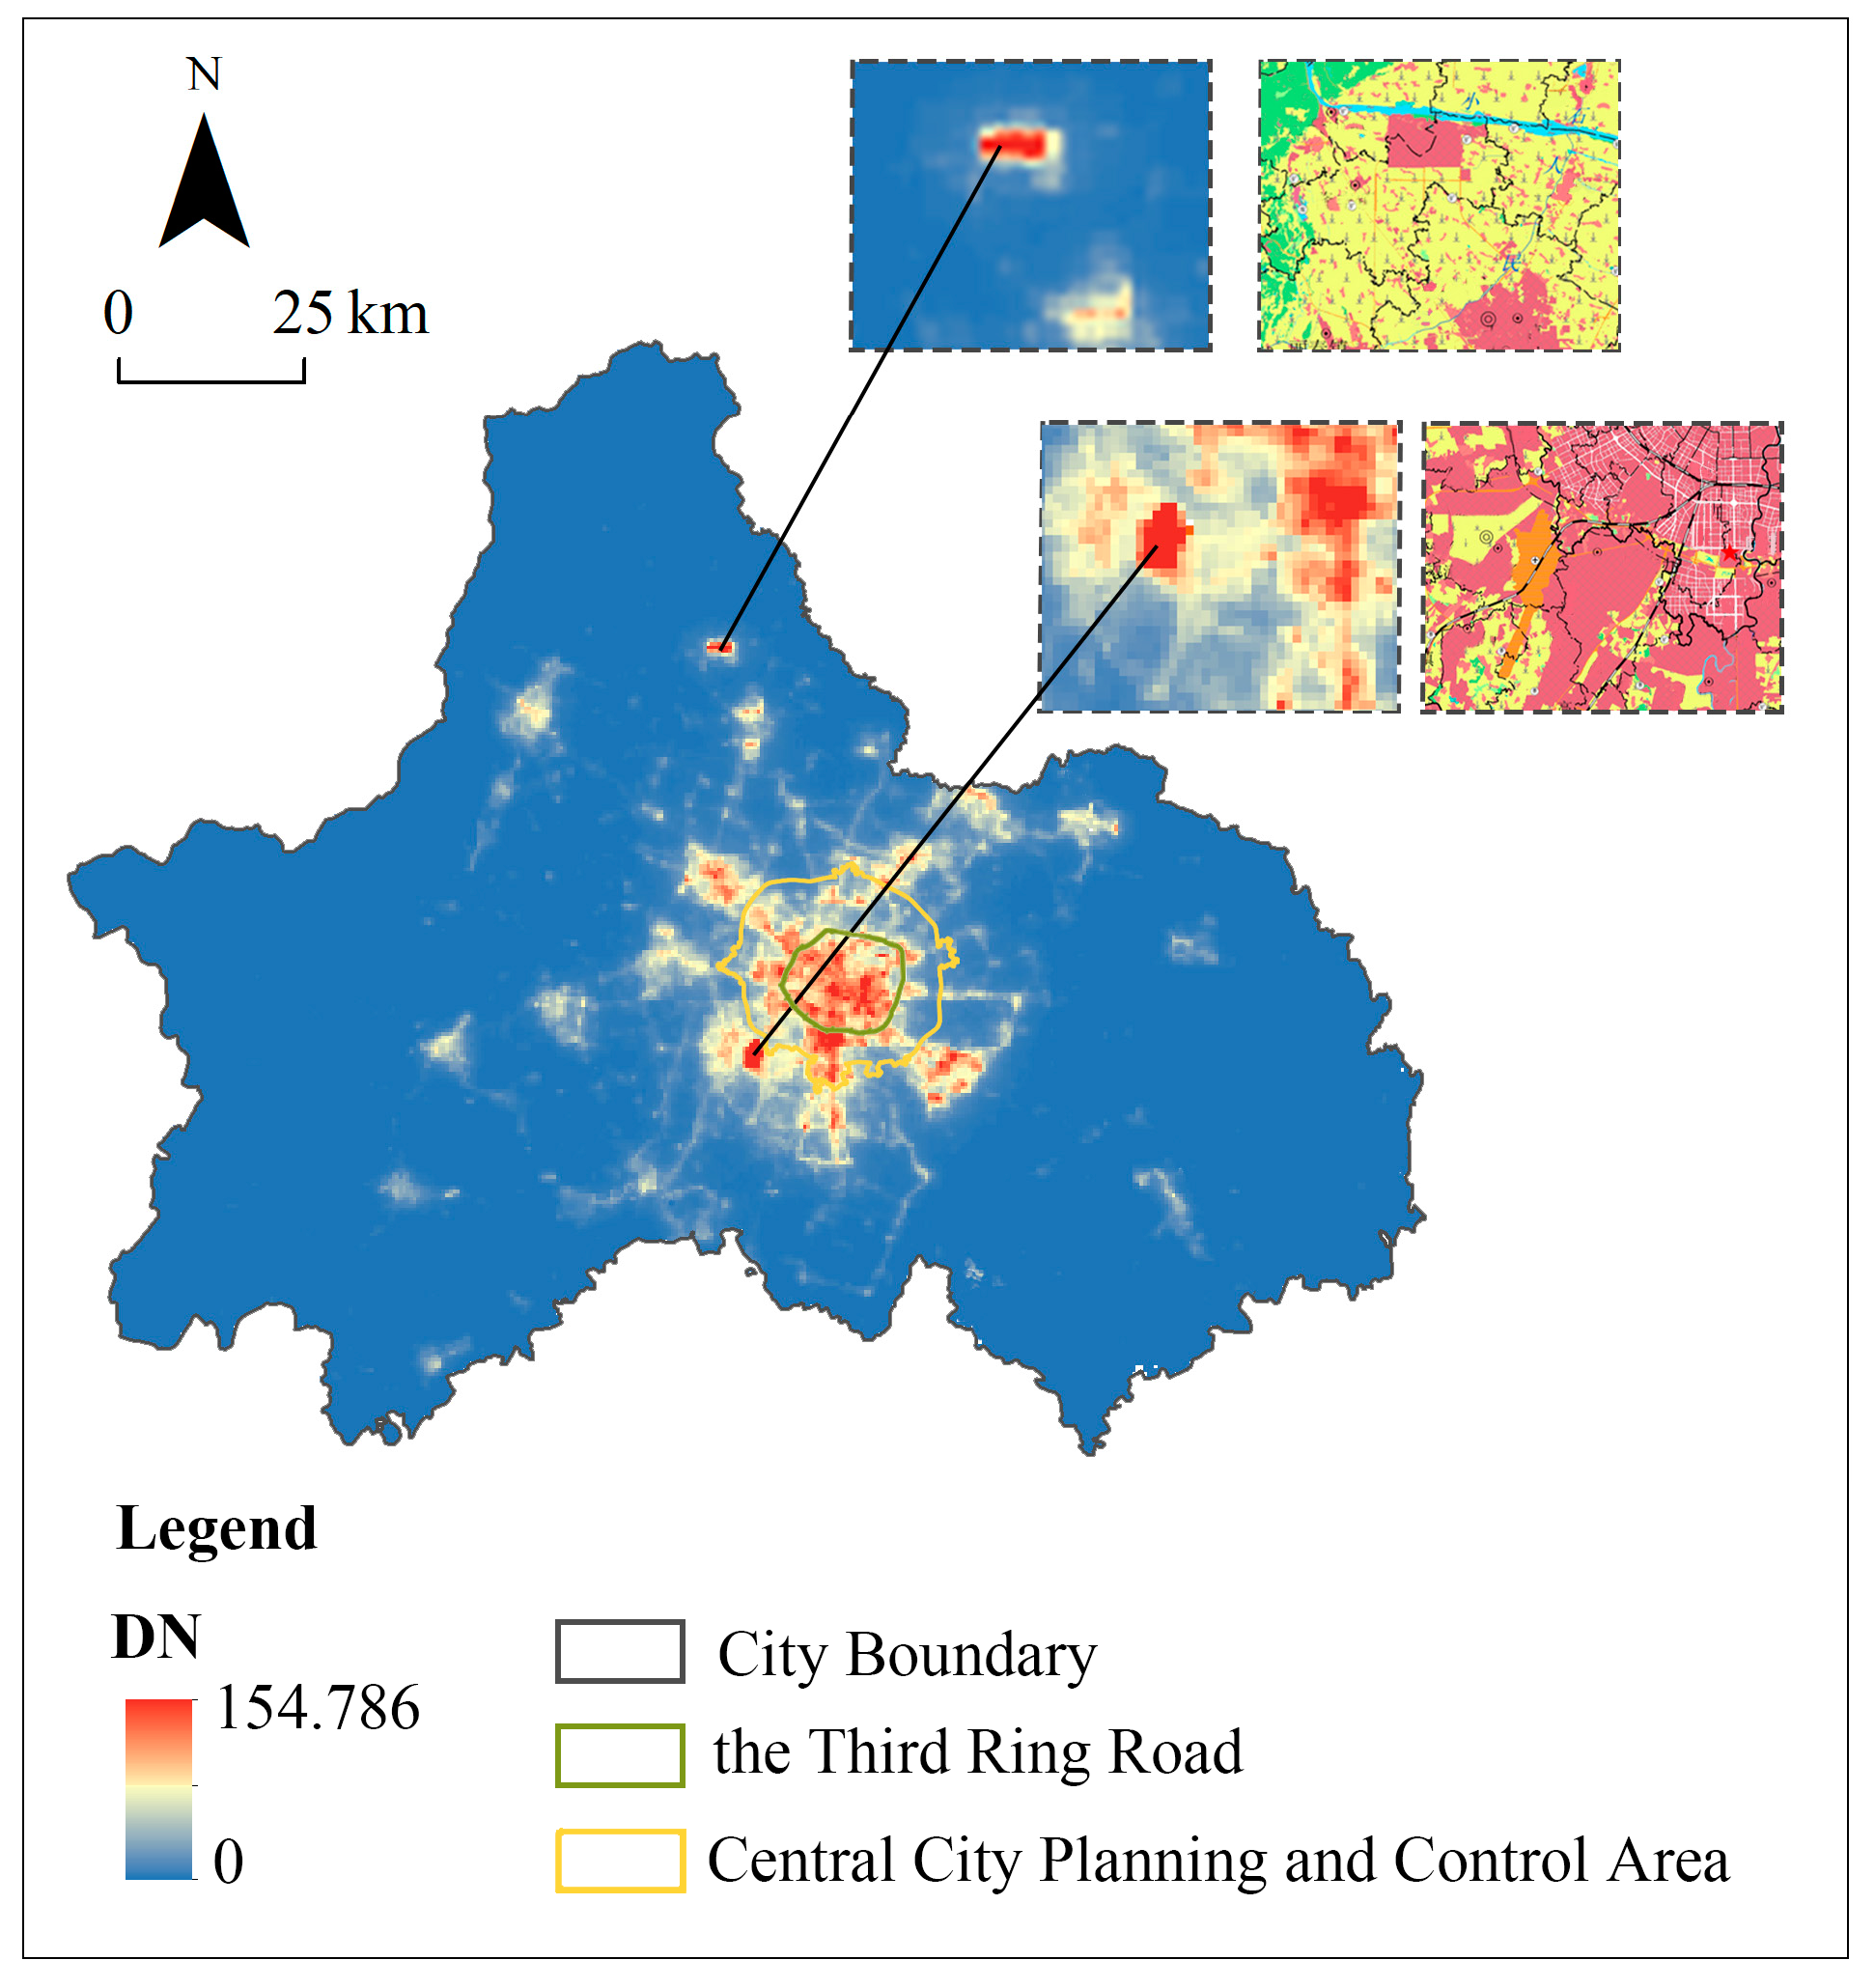
4.1. Verification of the URF Identification

The 2020 URF identification range (K = 5) was superimposed on the 2020 land use status map to verify the identification results. As depicted in Figure 10, the URF area was predominantly characterized by construction land (accounting for 69.10%) interspersed with small amounts of cultivated land (27.08%), woodland and grassland (a combined 1.78%), and water bodies (2.04%). The distribution of land use types was fragmented, with a notable patch fragmentation, and some construction lands were dispersed and discontinuous, exhibiting a relatively low proportion of service industry land.
Most of the URF was located on the periphery of the city center and subcenters, such as the Pidu District, Wenjiang District, Xindu District, and Longquanyi District, forming a ring-like distribution around the city center. Some parts were situated in new urban development zones, such as the High-Tech Zone, and some URF areas were distributed in the peripheral areas of satellite cities, such as Jintang County, Dayi County, Xinjin District, Dujiangyan City, and Jianyang City. These areas had a higher level of urbanization compared to the surrounding rural areas and were typical semi-urbanized areas, exhibiting the characteristics of single urban functions, scattered and disordered distribution of land use types, landscape fragmentation, and complexity, which are consistent with the characteristics of the URF.
In summary, the K-means clustering demonstrated good performance and convenience advantages in identifying the complex and diverse features of the URF in polycentric cities.

4.2. Advantages of K-Means Clustering and Multi-Source Data

This study demonstrates the effectiveness and feasibility of using multi-source data combined with the K-means clustering method for the identifying the URF in polycentric cities. On the one hand, the advancements in data acquisition methods allow for the use of multi-source data in URF identification, compensating for the limitations of single data types in recognizing diverse urban characteristics. On the other hand, the K-means clustering method, known for its high computational efficiency and broad applicability, is well suited for processing large-scale and polycentric urban datasets, addressing issues of insufficient objectivity or low computational efficiency in existing research [22]. Consequently, this research proposes a viable method for the identification and analysis of the URF in polycentric cities, which holds guiding significance for optimizing urban structures and developing strategies for the URF in future polycentric cities.

4.2.1. Resolving Mono-Source Limitations with Multi-Source Data

Night-time light data are often used as the primary metric for depicting different regions or categories in cluster analysis. Although the use of night-time light as a diagnostic feature has simplified the identification process of URF, a potential issue is that it may overlook other significant factors, such as land use types, which can impact the accuracy of clustering results [3]. Since clustering algorithms are sensitive to the quality of input data, even minor deviations can lead to drastically different clustering outcomes. Also, night-time lights identify the city center by the night-time light value of the area, which may be inaccurate to a certain extent. For example, areas with high night-time light values, such as airports, ports, and power plants, are not urban cores [23]. Therefore, over-reliance on night-time light data could introduce misleading classifications, thereby affecting the overall precision of the analysis.
Using Chengdu’s night-time light data from 2015 as an example, as depicted in Figure 11, a distinctly bright patch is visible in the southwest and north, typically interpreted as an area of high population and economic concentration. However, by overlaying the current land use map, this southwest area corresponds to the location of Chengdu Shuangliu International Airport, which has a high concentration of lights due to airport operations. This northern area is a suburban area of China National Petroleum Corporation land, which has increased lighting demands due to the daily operations of the plant and the company. These transport and industrial areas are located on the periphery, exhibiting high night light intensity and fluctuation rates [59]. When night-time light data are used as the sole source for clustering analysis, such areas can be misidentified as urban cores with dense populations.
Due to the diverse morphology and functionality of the URF, relying solely on night-time luminosity as a data source can significantly impact the accuracy of data clustering and edge area identification [32]. Therefore, integrating additional data with night-time light data can help correct the brightness of certain areas. For instance, POI data can represent trends in urban infrastructure distribution [72]. However, both night-time light data and POI data focus on static spatial and fragmented structures [23]. There is also a dynamic spatial connection between urban, rural, and URF areas involving the mutual flow of population, information, and materials. Thus, the static urban space represented by night-time light data and POI data does not fully reflect these dynamic connections [3]. A more relevant indicator system, considering aspects such as population density, economic structure, and land use, can better describe the spatial characteristics and dynamic trends in these areas. Consequently, this study employs multi-source data, integrating night-time light, remote sensing, economic, and demographic data for clustering to enhance the accuracy of identification results.

4.2.2. Advantages of K-Means Clustering

The K-means algorithm offers numerous advantages for identifying the URF of polycentric cities. It can process multidimensional data, simultaneously considering urbanization-related characteristics, such as population density, night-time light intensity, land use types, GDP per capita, and the distribution density of POIs, to comprehensively reflect the complexity of urban–rural transitional zones. As an unsupervised learning method, it does not require pre-labeled training data or prior knowledge, making it particularly effective for processing the structure of polycentric cities [43]. Moreover, K-means clustering allows for adjusting the number of clusters based on data characteristics and research objectives, providing flexibility to adapt to the conditions of polycentric cities and the URF.
Compared to K-means clustering, other identification methods have limitations. Mutation Detection Methods have specific requirements for urban morphology, rely on remote sensing image processing, and involve more subjective boundary determinations [31]. Spatial Continuous Wavelet Transform (SCWT) can identify urbanization breakpoints but may need to be combined with other methods to improve accuracy in polycentric cities [40]. Threshold methods are limited by the chosen threshold, with minor threshold changes potentially leading to significant result differences, and the selection of thresholds is somewhat subjective [73]. Deep Learning Approaches require a large amount of labeled data and computational resources, which may be constrained by resources and data volume in the identification of URF areas in polycentric cities [74]. Geographically Weighted Regression (GWR) can handle spatial heterogeneity but may require model adjustments to adapt different urban centers in polycentric city structures [75].
In summary, the K-means clustering method has distinct advantages in identifying URF in polycentric cities, is suitable for processing large-scale, multidimensional spatial data, and can provide intuitive and objective analytical results. It can also be applied to time-series data for dynamic monitoring of changes in URF areas. However, it also has limitations, such as dependence on the selection of initial cluster centers and sensitivity to outliers, which need to be addressed and improved in practical applications [22].

4.3. Urban–Rural Conflict in URF and Its Formation Mechanisms

A URF is distinct from both rural and urban areas, possessing a unique dynamic spatial structure and a diverse culture. As a transition zone between urban and rural areas, a URF is the result of the interaction between urban and rural tensions, and conflicts and compromises are inevitable in this process [76,77].
Firstly, urban–rural conflicts in a URF are manifested in the transformation of land use patterns [78]. As urbanization advances, the demand for land for urban expansion increases, leading to the conversion of agricultural land in the URF areas into urban construction land [79]. This transition is often accompanied by an intensification of urban–rural conflicts, typically characterized by the contradiction between the encroachment of urban sprawl on arable land and the sustainable development of agriculture [80,81].
Secondly, the dynamism of the URF leads to conflicts in management. Its spatiotemporal evolution demonstrates the continuous expansion and sprawl of boundaries, absorbing surrounding areas and creating new frontiers. This results in the intermingling of agricultural and non-agricultural production activities, leading to the intertwining or vacuum of management boundaries. Under such complex dynamics, land use policies and plans based on fixed administrative boundaries can sometimes be too rigid [6], also contributing to urban–rural conflicts.
Furthermore, the growth of the URF is often accompanied by a series of multidimensional urban transformation processes. The transitions in economic production, population structure, socio-cultural aspects, spatial configuration, and driving mechanisms differ from those occurring within urban areas. Non-targeted strategies are bound to lead to urban–rural conflicts and imbalances [82].
For instance, the “paid withdrawal of rural homesteads” system in China is essentially aimed at promoting urban–rural integration, yet it is also necessary to remain vigilant about potential urban–rural conflicts. Rural homesteads often face significant idleness and waste due to the rural exodus and labor migration of farmers.. The paid withdrawal system can facilitate the rational flow and optimized allocation of these land resources [83], especially in the URF areas, which can help alleviate the tension of urban construction land and promote the balanced development of urban and rural land resources. It can also promote the concentration and optimization of rural settlements, improving the rural living environment. Farmers can also, under the premise of housing security, revitalize “dead assets” and obtain certain economic compensations [84,85].
However, it should be noted that land use regulation is not always the most effective way to promote economic development or meet the needs of communities in the URF [18]. Planning proposals may overlook the current land use of homesteads and the expectations of residents [86]. With economic development, residents in URF areas have higher demands in terms of quality of life, and their expectations for land use also change. This may lead to dissatisfaction with the planned land use patterns, thus generating conflicts. For example, residents may oppose the transformation of agricultural land into industrial land because it may affect their quality of life and environment. Therefore, planning for homesteads needs to be conducted cautiously, and different regions should develop governance structures adapted to local resource endowments, human and living conditions, cultural atmospheres, and institutional climates [87]. In URF areas in particular, which are the most concentrated areas of urban–rural conflicts, if the rational use of planning and the management of rural homestead land resources is not emphasized, and if the wishes and needs of residents are not taken into account, it may lead to low land use efficiency, uncoordinated human-land relationships, and thus exacerbate urban–rural conflicts [88,89].

4.4. The Application Potential of URF Identification and Spatiotemporal Evolution Analysis

The evolution of the URF in Chengdu is influenced by a variety of socio-economic factors, land use patterns, transportation infrastructure, and more. The spatiotemporal evolution analysis presented in this paper effectively reflects the representative characteristics of URF evolution over the past decade, characterized by rapid expansion into suburban areas in a pattern that combines point-axis development with clustered distribution.
From the evolutionary diagrams, it is evident that the expansion of some URF areas has directly transcended the boundaries of Central City Planning and Control Areas. In an effort to curb the contiguous sprawl and unregulated development of the city, a ring-city ecological park and seven large parks, shaped like wedge-shaped plots, have been constructed on both sides of the boundary, each extending 500 m into the surrounding areas. However, the convenient transportation and excellent greening conditions have paradoxically led to high-density development in some peri-urban regions and a “leapfrog development” along the ring-city park belt [90]. This phenomenon arises because most traditional urban containment policies are not tailored to the mixed land use characteristics of the URF [18]. Consequently, there is a need for the policies regarding the URF to be refined to better address its unique land use and social development requirements. The URF is a flexible strategic opportunity space, but too-rigid planning structures can reduce this flexibility.
A novel approach to addressing URF areas may involve considering them as fluid spaces without fixed boundaries, defined by their functions and activities rather than by geographic location or spatial distance. Urban scholars and planning practitioners need to regard the URF as an emerging urban form and develop more effective planning frameworks. This involves understanding the socio-cultural dynamics, economic activities, demographic characteristics, spatial evolution patterns, and the driving forces behind the development and changes within URF spaces.
In addition, the spatiotemporal evolution of URF areas and the urban–rural conflicts therein are a dynamic process. Continuous attention and research can help policymakers to more comprehensively understand the trends and challenges of urban development before developing the URF, take proactive land use management and planning actions, effectively mitigate conflicts of interest among different stakeholders, and provide more space for the flexibility and multifunctionality of the URF [58], as well as provide theoretical support and practical guidance for the integrated development of urban and rural areas [91]. The New Urban Agenda (Habitat III) also proposes that administrative boundaries should be transcended to give play to the respective advantages of urban and rural areas [92]. Through balanced and sustainable urban–rural integrated construction, the antagonistic problems between urban and rural areas can be avoided [58]. Additionally, Chengdu should improve the construction mechanism of urban-rural integration. This should lead to the development of an urban-rural integration system that includes several key components. Firstly, there should be an emphasis on enhancing social governance and self-organization abilities. Secondly, establishing multi-subject co-governance mechanisms is essential. Lastly, ensuring a balanced allocation of public service resources is crucial. Furthermore, Chengdu must also focus on ecological governance, which involves land and space use control. It is important to cultivate ecological economic kinetic energy. In terms of industrial development, several strategies should be considered. These include improving industrial subject development abilities, promoting spatial synergy, and ensuring the precise allocation of elements.
Moreover, related studies propose that promoting polycentric development policies effectively alleviates the over-concentration of urban economy, population, traffic, and functions [93]. Many county-level cities have also clearly defined plans for the development of subcenters in their overall planning [94]. As a megacity, Chengdu has distinct new subcenters with clear boundaries, which effectively alleviates the pressure on the city center. Therefore, the URF, as an important venue for promoting the development of polycentric cities, should receive attention for its spatiotemporal evolution.

4.5. Limitations and Prospects

By incorporating cluster algorithms and various remote sensing and spatial data, the proposed methodology offers an effective and time-saving approach for URF identification at the macro level, especially for polycentric cities. Additionally, a 10-year spatiotemporal evolution analysis of URF has been conducted, which is significant for studies related to long-term urban expansion. However, due to the limited availability of the selected datasets, this study only covered a 10-year period. There are some gaps in the datasets, and data from nearby years were used as substitutes, which may introduce errors. Therefore, future research should cover more extensive temporal spans and employ more accurate data analyses. Furthermore, the K-means clustering algorithm is sensitive to the selection of initial cluster centers. Improper selection may lead the algorithm to converge with the local optima, affecting the final clustering outcomes [95]. Although this study employed the K-means++ algorithm to enhance clustering effectiveness and algorithmic stability [60], there is a desire for more advanced methods to reduce errors in the selection of initial centers for K-means clustering, thereby enhancing the robustness of the algorithm and leading to better handling of complex datasets. Additionally, as data mining technology continues to evolve and related fields persistently advance, it is anticipated that effective measurement and integration of some intractable URF characteristics will be feasible in the future. This would further augment the dimensionality of data features, improving the accuracy of K-means clustering results. This would provide new possibilities for more precise identification of URF in polycentric cities, facilitating a deeper understanding of URFs.
Moreover, although the current identification results had been preliminarily verified against local development plans and the current state of land use, this verification is relatively simple and lacks a precise and detailed assessment. Therefore, subsequent work should enhance uncertainty assessment or conduct detailed comparisons with other methods. Additionally, due to the experimental purpose and data reasons, we selected a 1 km × 1 km grid. We recognize that the evolution of the URF is highly scale-dependent, with different processes occurring at different frequencies and spatial scales and their cyclic patterns and dynamic characteristics varying across cities [22]. Therefore, future research on the identification of URF should adopt spatial grids of different sizes as identification units and consider different time intervals to explore the similarities and differences in spatial identification results and spatiotemporal dynamics based on the identification objectives and urban differences. Simultaneously, the study has identified the range of URF, and it is necessary to further study the internal structure of URF to accurately understand its current state of development, including verification aspects such as land use efficiency and hierarchical element agglomeration differences. This will be the direction for our further research in the future. Simultaneously, this study emphasized the necessity of balancing economic development and ecological environment protection in the urbanization process, offering a new perspective on the sustainable development of the URF.
On the other hand, the study of urban–rural integration within the URF is also a noteworthy aspect. The construction mechanism of urban–rural integration encompasses various domains, including planning, industry, market systems, infrastructure, public services, management systems, and the reform of rural property rights systems such as homestead land, as well as innovative mechanisms for rural governance. How to leverage the respective strengths of urban and rural areas in these aspects and construct a URF in a targeted manner to achieve balanced and sustainable urban–rural integration strategies is also a question that planners should contemplate.

5. Conclusions

This study conducted an identification and spatiotemporal evolution analysis of the URF in Chengdu from 2010 to 2020 using the K-means clustering method and multi-source data. The main conclusions are as follows:
  • The proposed method in this study can reasonably and efficiently identify the URF in polycentric cities.
  • Chengdu exhibited a polycentric urban structure with a “main center-subcenter” pattern, with URF areas being closely adjacent to the main center and subcenters, forming an overall ring-shaped wedge pattern.
  • Under the influence of multiple factors, including economy, policy, society, and the environment, the URF has developed rapidly and reached a certain scale. The URF in Chengdu has expanded significantly in the northeast–southwest direction from 2010 to 2020. Both the area in the URF transitioning into urban areas and the area of rural areas transitioning into the URF show an increasing and then decreasing trend. Initially dispersed URF areas gradually expanded and connected in clusters. Moreover, there was a significant change in land use within the URF, with cultivated land, woodland, and water bodies being converted into construction land. These changes exhibit characteristics such as a single urban function, scattered distribution of land use types, landscape fragmentation, and complexity.
The scope identification and spatial-temporal evolution analysis of the polycentric cities’ URF area in this paper help us to understand the growth patterns of urban spatial form, providing a theoretical and practical basis for URF-related research and urban development decision making, which is conducive to the development of urban–rural integration.

Author Contributions

Conceptualization, D.J. and J.T.; methodology, D.J. and A.N.; software, D.J. and J.Z. (Jiahao Zhang); validation, D.J.; formal analysis, D.J.; investigation, D.J.; resources, D.J. and J.Z. (Jiahao Zhang); data curation, D.J.; writing—original draft preparation, D.J.; writing—review and editing, A.N. and J.T.; visualization, D.J.; supervision, J.T. and J.Z. (Jian Zeng); project administration, J.T. and J.Z. (Jian Zeng); funding acquisition, J.T. and J.Z. (Jian Zeng). All authors have read and agreed to the published version of the manuscript.

Funding

This research was funded by the National Natural Science Foundation of China (grant No. 52378065) and the Tianjin Graduate Scientific Research and Innovation Project (grant No. 2022BKY073).

Data Availability Statement

No new data were created or analyzed in this study. Data sharing is not applicable to this article.

Conflicts of Interest

The authors declare no conflicts of interest.

References

  1. Monteros, K.; Dall’Orto, V.; Cempini, C. The Formation of the Urban-Rural Fringe Space in the San Cayetano Area: The Transformation of a Peripheral Urban Landscape in Ecuador. Land 2024, 13, 494. [Google Scholar] [CrossRef]
  2. Le Bivic, C.; Melot, R. Scheduling Urbanization in Rural Municipalities: Local Practices in Land-Use Planning on the Fringes of the Paris Region. Land Use Policy 2020, 99, 105040. [Google Scholar] [CrossRef]
  3. Xue, X.; Yu, Z.; Zhu, S.; Zheng, Q.; Weston, M.; Wang, K.; Gan, M.; Xu, H. Delineating Urban Boundaries Using Landsat 8 Multispectral Data and VIIRS Nighttime Light Data. Remote Sens. 2018, 10, 799. [Google Scholar] [CrossRef]
  4. Un Habitat. State of the World’s Cities 2012/2013: Prosperity of Cities; Routledge: London, UK, 2013; ISBN 978-0-203-75617-1. [Google Scholar]
  5. da Cruz, N.F.; Oh, D.Y.; Choumar, N.B. The Metropolitan Scale. Cities 2020, 100, 102644. [Google Scholar] [CrossRef]
  6. Scott, A.J.; Carter, C.; Reed, M.R.; Larkham, P.; Adams, D.; Morton, N.; Waters, R.; Collier, D.; Crean, C.; Curzon, R.; et al. Disintegrated Development at the Rural–Urban Fringe: Re-Connecting Spatial Planning Theory and Practice. Prog. Plan. 2013, 83, 1–52. [Google Scholar] [CrossRef]
  7. Grabowska, W.; Kukulska-Kozieł, A.; Noszczyk, T. Insight into the Spatial Nature of the Urban Sprawl Phenomenon in European Capitals. Land Degrad. Dev. 2024, 35, 4330–4342. [Google Scholar] [CrossRef]
  8. Peng, J.; Liu, Q.; Blaschke, T.; Zhang, Z.; Liu, Y.; Hu, Y.; Wang, M.; Xu, Z.; Wu, J. Integrating Land Development Size, Pattern, and Density to Identify Urban-Rural Fringe in a Metropolitan Region. Landsc. Ecol. 2020, 35, 2045–2059. [Google Scholar] [CrossRef]
  9. Wang, Y.; Zhu, X. Research on the concept and characteristics of urban fringe areas. J. Qiqihar Teach. Coll. 1996, 4, 72–74. [Google Scholar]
  10. Geneletti, D.; La Rosa, D.; Spyra, M.; Cortinovis, C. A Review of Approaches and Challenges for Sustainable Planning in Urban Peripheries. Landsc. Urban Plan. 2017, 165, 231–243. [Google Scholar] [CrossRef]
  11. Pryor, R.J. Defining the Rural. Urban Fringe. Soc. Forces 1968, 47, 202. [Google Scholar] [CrossRef]
  12. Banzhaf, E.; Anderson, S.; Grandin, G.; Hardiman, R.; Jensen, A.; Jones, L.; Knopp, J.; Levin, G.; Russel, D.; Wu, W.; et al. Urban-Rural Dependencies and Opportunities to Design Nature-Based Solutions for Resilience in Europe and China. Land 2022, 11, 480. [Google Scholar] [CrossRef]
  13. Kim, M.-J.; Woo, Y.S. Fringe Belts and Urban Morphogenesis in Pittsburgh, Pennsylvania, USA. J. Korean Urban Geogr. Soc. 2013, 39, 135–152. [Google Scholar]
  14. McDonnell, M.J.; Hahs, A.K. The Use of Gradient Analysis Studies in Advancing Our Understanding of the Ecology of Urbanizing Landscapes: Current Status and Future Directions. Landsc. Ecol 2008, 23, 1143–1155. [Google Scholar] [CrossRef]
  15. Yang, J.; Dong, J.; Sun, Y.; Zhu, J.; Huang, Y.; Yang, S. A Constraint-Based Approach for Identifying the Urban-Rural Fringe of Polycentric Cities Using Multi-Sourced Data. Int. J. Geogr. Inf. Sci. 2022, 36, 114–136. [Google Scholar] [CrossRef]
  16. Zhu, J.; Lang, Z.; Yang, J.; Wang, M.; Zheng, J.; Na, J. Integrating Spatial Heterogeneity to Identify the Urban Fringe Area Based on NPP/VIIRS Nighttime Light Data and Dual Spatial Clustering. Remote Sens. 2022, 14, 6126. [Google Scholar] [CrossRef]
  17. Schneider, A.; Woodcock, C.E. Compact, Dispersed, Fragmented, Extensive? A Comparison of Urban Growth in Twenty-Five Global Cities Using Remotely Sensed Data, Pattern Metrics and Census Information. Urban Stud. 2008, 45, 659–692. [Google Scholar] [CrossRef]
  18. Altes, W.K.K.; van Rij, E. Planning the Horticultural Sector Managing Greenhouse Sprawl in the Netherlands. Land Use Policy 2013, 31, 486–497. [Google Scholar] [CrossRef]
  19. Tan, J.; Zheng, Y. Reconsidering the Peri-urban: Perspectives of Planetary Urbanisation and Postsuburbia. Urban Probl. 2022, 29, 74–81. [Google Scholar] [CrossRef]
  20. Irwin, E.G.; Bockstael, N.E. The Evolution of Urban Sprawl: Evidence of Spatial Heterogeneity and Increasing Land Fragmentation. Proc. Natl. Acad. Sci. USA 2007, 104, 20672–20677. [Google Scholar] [CrossRef]
  21. Ahani, S.; Dadashpoor, H. A Review of Domains, Approaches, Methods and Indicators in Peri-Urbanization Literature. Habitat Int. 2021, 114, 102387. [Google Scholar] [CrossRef]
  22. Zeng, T.; Jin, H.; Geng, Z.; Kang, Z.; Zhang, Z. Urban-Rural Fringe Long-Term Sequence Monitoring Based on a Comparative Study on DMSP-OLS and NPP-VIIRS Nighttime Light Data: A Case Study of Shenyang, China. Int. J. Environ. Res. Public Health 2022, 19, 11835. [Google Scholar] [CrossRef] [PubMed]
  23. Zhou, Y.; He, X.; Zhu, Y. Identification and Evaluation of the Polycentric Urban Structure: An Empirical Analysis Based on Multi-Source Big Data Fusion. Remote Sens. 2022, 14, 2705. [Google Scholar] [CrossRef]
  24. Lv, Y.; Zheng, X.; Zhou, L.; Zhang, L. Decentralization and Polycentricity: Spatial Changes of Employment in Beijing Metropolitan Area, China. Sustainability 2017, 9, 1880. [Google Scholar] [CrossRef]
  25. Deng, Y.; Liu, J.; Liu, Y.; Luo, A. Detecting Urban Polycentric Structure from POI Data. ISPRS Int. J. Geo-Inf. 2019, 8, 283. [Google Scholar] [CrossRef]
  26. Peng, J.; Ma, J.; Yuan, Y. Research Progress and Prospect on the Identification of Urban Fringe. Prog. Geogr. 2014, 33, 1068–1077. [Google Scholar]
  27. Haase, D.; Nuissl, H. The Urban-to-Rural Gradient of Land Use Change and Impervious Cover: A Long-Term Trajectory for the City of Leipzig. J. Land Use Sci. 2010, 5, 123–141. [Google Scholar] [CrossRef]
  28. Myers, R.R.; Beegle, J.A. Delineation and Analysis of the Rural-Urban Fringe. Appl. Anthropol. 1947, 6, 14–22. [Google Scholar] [CrossRef]
  29. Vizzari, M.; Sigura, M. Landscape Sequences along the Urban-Rural-Natural Gradient: A Novel Geospatial Approach for Identification and Analysis. Landsc. Urban Plan. 2015, 140, 42–55. [Google Scholar] [CrossRef]
  30. Zhang, L.; She, J.; Li, R.; Chen, D. Study on Demarcation of Urban-Rural Fringe Based on Gravity Model. J. Cent. South Univ. For. Technol. 2017, 37, 99–104. [Google Scholar]
  31. Chang, S.; Jiang, Q.; Wang, Z.; Xu, S.; Jia, M. Extraction and Spatial-Temporal Evolution of Urban Fringes: A Case Study of Changchun in Jilin Province, China. ISPRS Int. J. Geo-Inf. 2018, 7, 241. [Google Scholar] [CrossRef]
  32. Wan, Y.; Deng, C.; Wu, T.; Jin, R.; Chen, P.; Kou, R. Quantifying the Spatial Integration Patterns of Urban Agglomerations along an Inter-City Gradient. Sustainability 2019, 11, 5000. [Google Scholar] [CrossRef]
  33. Li, X.; Gong, P.; Zhou, Y.; Wang, J.; Bai, Y.; Chen, B.; Hu, T.; Xiao, Y.; Xu, B.; Yang, J.; et al. Mapping Global Urban Boundaries from the Global Artificial Impervious Area (GAIA) Data. Environ. Res. Lett. 2020, 15, 094044. [Google Scholar] [CrossRef]
  34. Hu, X.; Qian, Y.; Pickett, S.T.A.; Zhou, W. Urban Mapping Needs Up-to-Date Approaches to Provide Diverse Perspectives of Current Urbanization: A Novel Attempt to Map Urban Areas with Nighttime Light Data. Landsc. Urban Plan. 2020, 195, 103709. [Google Scholar] [CrossRef]
  35. Ding, W.; Chen, H. Urban-Rural Fringe Identification and Spatial Form Transformation during Rapid Urbanization: A Case Study in Wuhan, China. Build. Environ. 2022, 226, 109697. [Google Scholar] [CrossRef]
  36. Li, J.; Peng, B.; Liu, S.; Ye, H.; Zhang, Z.; Nie, X. An Accurate Fringe Extraction Model of Small- and Medium-Sized Urban Areas Using Multi-Source Data. Front. Environ. Sci. 2023, 11, 1118953. [Google Scholar] [CrossRef]
  37. Pénzes, J.; Hegedűs, L.D.; Makhanov, K.; Túri, Z. Changes in the Patterns of Population Distribution and Built-Up Areas of the Rural–Urban Fringe in Post-Socialist Context—A Central European Case Study. Land 2023, 12, 1682. [Google Scholar] [CrossRef]
  38. Imhoff, M.L.; Zhang, P.; Wolfe, R.E.; Bounoua, L. Remote Sensing of the Urban Heat Island Effect across Biomes in the Continental USA. Remote Sens. Environ. 2010, 114, 504–513. [Google Scholar] [CrossRef]
  39. Zhou, Y.; Smith, S.J.; Elvidge, C.D.; Zhao, K.; Thomson, A.; Imhoff, M. A Cluster-Based Method to Map Urban Area from DMSP/OLS Nightlights. Remote Sens. Environ. 2014, 147, 173–185. [Google Scholar] [CrossRef]
  40. Peng, J.; Zhao, S.; Liu, Y.; Tian, L. Identifying the Urban-Rural Fringe Using Wavelet Transform and Kernel Density Estimation: A Case Study in Beijing City, China. Environ. Model. Softw. 2016, 83, 286–302. [Google Scholar] [CrossRef]
  41. Yang, Y.; Ma, M.; Tan, C.; Li, W. Spatial Recognition of the Urban-Rural Fringe of Beijing Using DMSP/OLS Nighttime Light Data. Remote Sens. 2017, 9, 1141. [Google Scholar] [CrossRef]
  42. Zhang, G.; Zhang, C.; Zhang, H. Improved K-Means Algorithm Based on Density Canopy. Knowl.-Based Syst. 2018, 145, 289–297. [Google Scholar] [CrossRef]
  43. Feng, Z.; Peng, J.; Wu, J. Using DMSP/OLS Nighttime Light Data and K-Means Method to Identify Urban-Rural Fringe of Megacities. Habitat Int. 2020, 103, 102227. [Google Scholar] [CrossRef]
  44. Liang, C.; Zeng, J.; Zhang, R.-C.; Wang, Q.-W. Connecting Urban Area with Rural Hinterland: A Stepwise Ecological Security Network Construction Approach in the Urban-Rural Fringe. Ecol. Indic. 2022, 138, 108794. [Google Scholar] [CrossRef]
  45. Song, X.-P.; Sexton, J.O.; Huang, C.; Channan, S.; Townshend, J.R. Characterizing the Magnitude, Timing and Duration of Urban Growth from Time Series of Landsat-Based Estimates of Impervious Cover. Remote Sens. Environ. 2016, 175, 1–13. [Google Scholar] [CrossRef]
  46. Chen, Z.; Yu, B.; Song, W.; Liu, H.; Wu, Q.; Shi, K.; Wu, J. A New Approach for Detecting Urban Centers and Their Spatial Structure With Nighttime Light Remote Sensing. IEEE Trans. Geosci. Remote Sens. 2017, 55, 6305–6319. [Google Scholar] [CrossRef]
  47. Sun, C.; Wu, Z.; Lv, Z.; Yao, N.; Wei, J. Quantifying Different Types of Urban Growth and the Change Dynamic in Guangzhou Using Multi-Temporal Remote Sensing Data. Int. J. Appl. Earth Obs. Geoinf. 2013, 21, 409–417. [Google Scholar] [CrossRef]
  48. Qin, B. City Profile: Chengdu. Cities 2015, 43, 18–27. [Google Scholar] [CrossRef]
  49. Zhang, M.; Wen, T. The Rise of Chengdu between Geopolitics and Geo-Economics: City-Regional Development under the Belt and Road Initiative and Beyond. Trans. Inst. Br. Geogr. 2022, 47, 971–989. [Google Scholar] [CrossRef]
  50. Gu, C.; Chen, L.; Ding, R.; Li, Z.; Dai, M. Globalization and Restructuring China’s National Urban Systems. Sci. Geogr. Sin. 2005, 25, 641–654. [Google Scholar]
  51. Chen, C.; LeGates, R.; Fang, C. From Coordinated to Integrated Urban and Rural Development in China’s Megacity Regions. J. Urban Aff. 2019, 41, 150–169. [Google Scholar] [CrossRef]
  52. Liu, Y.; He, L.; Wang, J.; Zhang, Y.; Yang, Q. Deep Learning Analysis of Urban Growth Boundaries: An Evaluation of Effectiveness in Mitigating Urban Sprawl in China. J. Urban Plan. Dev. 2024, 150, 04023058. [Google Scholar] [CrossRef]
  53. Sun, Y.; Fan, H.; Li, M.; Zipf, A. Identifying the City Center Using Human Travel Flows Generated from Location-Based Social Networking Data. Environ. Plan. B-Plan. Des. 2016, 43, 480–498. [Google Scholar] [CrossRef]
  54. Chen, J.; Zhang, L.; Zhao, S.; Zong, H. Assessing Land-Use Conflict Potential and Its Correlation with LULC Based on the Perspective of Multi-Functionality and Landscape Complexity: The Case of Chengdu, China. Land 2023, 12, 742. [Google Scholar] [CrossRef]
  55. Ros-Tonen, M.; Pouw, N.; Bavinck, M. Governing Beyond Cities: The Urban-Rural Interface. In Geographies of Urban Governance: Advanced Theories, Methods and Practices; Gupta, J., Pfeffer, K., Verrest, H., Ros-Tonen, M., Eds.; Springer International Publishing: Cham, Switerland, 2015; pp. 85–105. ISBN 978-3-319-21272-2. [Google Scholar]
  56. Mustak, S.; Baghmar, N.K.; Srivastava, P.K.; Singh, S.K.; Binolakar, R. Delineation and Classification of Rural-Urban Fringe Using Geospatial Technique and Onboard DMSP-Operational Linescan System. Geocarto Int. 2018, 33, 375–396. [Google Scholar] [CrossRef]
  57. Cao, Y.; Li, G.; Cao, Y.; Wang, J.; Fang, X.; Zhou, L.; Liu, Y. Distinct Types of Restructuring Scenarios for Rural Settlements in a Heterogeneous Rural Landscape: Application of a Clustering Approach and Ecological Niche Modeling. Habitat Int. 2020, 104, 102248. [Google Scholar] [CrossRef]
  58. Li, G.; Cao, Y.; He, Z.; He, J.; Cao, Y.; Wang, J.; Fang, X. Understanding the Diversity of Urban–Rural Fringe Development in a Fast Urbanizing Region of China. Remote Sens. 2021, 13, 2373. [Google Scholar] [CrossRef]
  59. Sun, X.; Liu, X.; Zhou, Y. Delineating Peri-Urban Areas Using Multi-Source Geo-Data: A Neural Network Approach and SHAP Explanation. Remote Sens. 2023, 15, 4106. [Google Scholar] [CrossRef]
  60. Arthur, D.; Vassilvitskii, S. K-Means plus plus: The Advantages of Careful Seeding. In Proceedings of the Eighteenth Annual Acm-Siam Symposium on Discrete Algorithms, New Orleans, LA, USA, 7–9 January 2007; Siam: Philadelphia, PA, USA, 2007; pp. 1027–1035. [Google Scholar]
  61. Everitt, B.S.; Landau, S.; Leese, M.; Stahl, D. An Introduction to Classification and Clustering; John Wiley & Sons, Ltd.: Hoboken, NJ, USA, 2011. [Google Scholar]
  62. Xie, Z.; Ye, X.; Zheng, Z.; Li, D.; Sun, L.; Li, R.; Benya, S. Modeling Polycentric Urbanization Using Multisource Big Geospatial Data. Remote Sens. 2019, 11, 310. [Google Scholar] [CrossRef]
  63. Miao, J.T. Planning Particularities: Reinterpreting Urban Planning in China with the Case of Chengdu. Plan. Theory Pract. 2019, 20, 512–536. [Google Scholar] [CrossRef]
  64. Wu, Z.; Zheng, X.; Chen, Y.; Huang, S.; Duan, C.; Hu, W. Regional Differences and Dynamic Evolution of High-Quality Development in Service Industry: A Case Study of the Chengdu-Chongqing Economic Circle. PLoS ONE 2024, 19, e0297755. [Google Scholar] [CrossRef]
  65. Li, W.; Kang, J.; Wang, Y. The Dynamic Impact of Landscape Urbanization on Ecosystem Service Multifunctionality in the Chengdu–Chongqing Urban Agglomeration: A Panel VAR Approach. Land Degrad. Dev. 2023, 34, 5207–5223. [Google Scholar] [CrossRef]
  66. Dadashpoor, H.; Azizi, P.; Moghadasi, M. Land Use Change, Urbanization, and Change in Landscape Pattern in a Metropolitan Area. Sci. Total Environ. 2019, 655, 707–719. [Google Scholar] [CrossRef] [PubMed]
  67. Li, J.; Dong, S.; Li, Y.; Wang, Y.; Li, Z.; Li, F. Effects of Land Use Change on Ecosystem Services in the China–Mongolia–Russia Economic Corridor. J. Clean. Prod. 2022, 360, 132175. [Google Scholar] [CrossRef]
  68. Bagheri, B.; Tousi, S.N. An Explanation of Urban Sprawl Phenomenon in Shiraz Metropolitan Area (SMA). Cities 2018, 73, 71–90. [Google Scholar] [CrossRef]
  69. Ye, Y.; LeGates, R.; Qin, B. Coordinated Urban-Rural Development Planning in China The Chengdu Model. J. Am. Plann. Assoc. 2013, 79, 125–137. [Google Scholar] [CrossRef]
  70. Cox, K.R. The Problem of Metropolitan Governance and the Politics of Scale. Reg. Stud. 2010, 44, 215–227. [Google Scholar] [CrossRef]
  71. Long, Y.; Liu, X.; Luo, S.; Luo, T.; Hu, S.; Zheng, Y.; Shao, J.; Liu, X. Evolution and Prediction of Urban Fringe Areas Based on Logistic-CA-Markov Models: The Case of Wuhan City. Land 2023, 12, 1874. [Google Scholar] [CrossRef]
  72. Zikirya, B.; He, X.; Li, M.; Zhou, C. Urban Food Takeaway Vitality: A New Technique to Assess Urban Vitality. Int. J. Environ. Res. Public Health 2021, 18, 3578. [Google Scholar] [CrossRef]
  73. Peng, J.; Hu, Y.; Liu, Y.; Ma, J.; Zhao, S. A New Approach for Urban-Rural Fringe Identification: Integrating Impervious Surface Area and Spatial Continuous Wavelet Transform. Landsc. Urban Plan. 2018, 175, 72–79. [Google Scholar] [CrossRef]
  74. Cao, H.; Jiang, W.; Chen, J.; Chen, C.; He, J.; Liu, C. Multi-Dimensional Identification and Feature Analysis of Nanjing’s Urban-Rural Fringe. J. Nat. Resour. 2023, 38, 795–807. [Google Scholar] [CrossRef]
  75. Liu, J.; Wang, H.; Hui, L.; Tang, B.; Zhang, L.; Jiao, L. Identifying the Coupling Coordination Relationship between Urbanization and Ecosystem Services Supply–Demand and Its Driving Forces: Case Study in Shaanxi Province, China. Remote Sens. 2024, 16, 2383. [Google Scholar] [CrossRef]
  76. Zasada, I. Multifunctional Peri-Urban Agriculture-A Review of Societal Demands and the Provision of Goods and Services by Farming. Land Use Policy 2011, 28, 639–648. [Google Scholar] [CrossRef]
  77. Zhu, J.; Lang, Z.; Wang, S.; Zhu, M.; Na, J.; Zheng, J. Using Dual Spatial Clustering Models for Urban Fringe Areas Extraction Based on Night-Time Light Data: Comparison of NPP/VIIRS, Luojia 1-01, and NASA’s Black Marble. ISPRS Int. J. Geo-Inf. 2023, 12, 408. [Google Scholar] [CrossRef]
  78. Popescu, C. The Economy of a Regional Metropolis. Case-Study: Iasi, Romania. Transylv. Rev. Adm. Sci. 2011, 7, 255–276. [Google Scholar]
  79. Gomes, E.; Banos, A.; Abrantes, P.; Rocha, J.; Kristensen, S.B.P.; Busck, A. Agricultural Land Fragmentation Analysis in a Peri-Urban Context: From the Past into the Future. Ecol. Indic. 2019, 97, 380–388. [Google Scholar] [CrossRef]
  80. Oueslati, W.; Salanié, J.; Wu, J. Urbanization and Agricultural Productivity: Some Lessons from European Cities. J. Econ. Geogr. 2019, 19, 225–249. [Google Scholar] [CrossRef]
  81. Pirro, C.; Anguelovski, I. Farming the Urban Fringes of Barcelona: Competing Visions of Nature and the Contestation of a Partial Sustainability Fix. Geoforum 2017, 82, 53–65. [Google Scholar] [CrossRef]
  82. Paasi, A. Regional Planning and the Mobilization of ‘Regional Identity’: From Bounded Spaces to Relational Complexity. Reg. Stud. 2013, 47, 1206–1219. [Google Scholar] [CrossRef]
  83. Liu, Y.; Fang, F.; Li, Y. Key Issues of Land Use in China and Implications for Policy Making. Land Use Policy 2014, 40, 6–12. [Google Scholar] [CrossRef]
  84. Chen, Y.; Ni, X.; Liang, Y. The Influence of External Environment Factors on Farmers’ Willingness to Withdraw from Rural Homesteads: Evidence from Wuhan and Suizhou City in Central China. Land 2022, 11, 1602. [Google Scholar] [CrossRef]
  85. Liu, Y.; Liu, Q.; Jiao, F. Rural Homestead Reform in China: Unveiling Urbanization Dynamics and Lessons for Sustainable Development. Front. Sustain. 2024, 5, 1391612. [Google Scholar] [CrossRef]
  86. Gallent, N.; Shaw, D. Spatial Planning, Area Action Plans and the Rural-Urban Fringe. J. Environ. Plan. Manag. 2007, 50, 617–638. [Google Scholar] [CrossRef]
  87. Wu, Y.; Mo, Z.; Peng, Y.; Skitmore, M. Market-Driven Land Nationalization in China: A New System for the Capitalization of Rural Homesteads. Land Use Policy 2018, 70, 559–569. [Google Scholar] [CrossRef]
  88. Peng, C. Analysis of the Influence of Peasants’ Social Stratum on Their Choice of Monetary Compensation Model for Leaving Their Rural Homestead: Based on Survey Data of Farmers in Anhui Province. Comp. Econ. Soc. Syst 2013, 6, 133–146. [Google Scholar]
  89. Gao, J.; Song, G.; Liu, S. Factors Influencing Farmers’ Willingness and Behavior Choices to Withdraw from Rural Homesteads in China. Growth Chang. 2022, 53, 112–131. [Google Scholar] [CrossRef]
  90. van Rensburg, J.D.J.; Campbell, M.M. The Management of Urban Sprawl by Applying an Urban Edge Strategy. Urban Forum 2012, 23, 61–72. [Google Scholar] [CrossRef]
  91. Shi, W.; Tian, J.; Namaiti, A.; Xing, X. Spatial-Temporal Evolution and Driving Factors of the Coupling Coordination between Urbanization and Urban Resilience: A Case Study of the 167 Counties in Hebei Province. Int. J. Environ. Res. Public. Health 2022, 19, 13128. [Google Scholar] [CrossRef]
  92. Salet, W.; Vermeulen, R.; Savini, F.; Dembski, S. Planning for the New European Metropolis: Functions, Politics, and Symbols. Plan. Theory Pract. 2015, 16, 251–254. [Google Scholar] [CrossRef]
  93. Liu, Z.; Liu, S. Polycentric Development and the Role of Urban Polycentric Planning in China’s Mega Cities: An Examination of Beijing’s Metropolitan Area. Sustainability 2018, 10, 1588. [Google Scholar] [CrossRef]
  94. Ning, X.; Zhang, X.; Zhang, X.; Wang, H.; Zhang, W. A Method for Assessing Urban Ecological Resilience and Identifying Its Critical Distance Belt Based on the “Source-Sink” Theory: A Case Study of Beijing. Remote Sens. 2023, 15, 2502. [Google Scholar] [CrossRef]
  95. Ni, L.; Li, J.; Namaiti, A. Classification and Planning Strategies of Multidimensional Resilience Units for Urban Waterlogging: A Case Study of the Old City District in Shijiazhuang, China. Sustainability 2024, 16, 2717. [Google Scholar] [CrossRef]
Figure 1. Flowchart depicting the identification and spatiotemporal evolution analysis for URFs in polycentric cities.
Land 13 01727 g001
Figure 2. Location of Chengdu, Sichuan province in China. Note:1 Pengzhou; 2 Dujiangyan; 3 Chongzhou; 4 Pujiang; 5 Qingbaijiang; 6 Dayi; 7 Jianyang; 8 Xinjin; 9 Qionglai; 10 Jintang; 11 Wenjiang; 12 Wuhou; 13 Shuangliu; 14 Pidu; 15 Jinniu; 16 Longquanyi; 17 Xindu; 18 Chenghua; 19 Jinjiang; 20 Qingyang.
Land 13 01727 g002
Figure 3. Elbow method plot for determining the optimal number of clusters in (a) 2010, (b) 2015, (c) 2020.
Land 13 01727 g003
Figure 4. K-means clustering results for different k-values over 10 years (ai).
Land 13 01727 g004
Figure 5. The K-means clustering results with K = 5 in (a) 2010, (b) 2015, (c) 2020.
Land 13 01727 g005
Figure 6. Land transfer spatial distribution map for the period of (a) 2010–2015 and (b) 2015–2020.
Land 13 01727 g006
Figure 7. Industrial planning and development strategy spatial distribution map for Chengdu.
Land 13 01727 g007
Figure 8. Rail transit and primary–secondary road conditions in Chengdu.
Land 13 01727 g008
Figure 9. Statistical analysis of land use change in URF from 2010 to 2020. (a) Changes in construction land; (b) changes in various types of land use.
Land 13 01727 g009
Figure 10. Land use status of URF in 2020.
Land 13 01727 g010
Figure 11. Comparison of night-time light data and land use.
Land 13 01727 g011
Table 1. Description of the data sources in this study.
Data TypeDateResolution/mData Sources
CNLUCC data2010–202030http://www.resdc.cn, accessed on 15 October 2023
POI data2012–2020-http://lbs.amap.com, accessed on 15 October 2023
Population density2010–2020100https://www.worldpop.org/, accessed on 15 October 2023
NPP-VIIRS Night-time light data2010–2020500https://www.earth-system-science-data.net/, accessed on 15 October 2023
GDP2010–20191000https://www.resdc.cn/, accessed on 15 October 2023
Administrative boundary2023-https://www.ngcc.cn/, accessed on 15 October 2023
Table 2. Three-level classification system for CNLUCC data.
First-Level Classification and DefinitionSecond-Level ClassificationThird-Level Definition
1 Cultivated land: Refers to the land where crops are grown, including mature cultivated land, newly opened wasteland, fallow land, rotational land, and grassland rotation land; agricultural fruits, mulberry, and agricultural forestry land mainly planted with crops; flats and tidal flats cultivated for more than three years.11 Paddy Fields
12 Drylands
-
2 Woodland: Refers to land used for forestry purposes, including areas where trees, shrubs, bamboo, and coastal mangroves are grown.21 Woodland
22 Shrubland
23 Sparse Woodland
24 Other Woodland
-
3 Grassland: Refers to areas dominated by herbaceous vegetation with a coverage of more than 5%, including shrub grasslands primarily used for grazing and woodland grasslands with a canopy density of less than 10%.31 High-coverage Grassland
32 Medium-Coverage Grassland
33 Low Coverage Grassland
-
4 Water Bodies: Refers to natural inland water areas and land used for water conservancy facilities.41 Canals and Ditches
42 Lakes
43 Reservoirs and Ponds
44 Glaciers and Permanent Snow
45 Tidal Flats
46 Beaches
-
5 Construction Land (urban and rural areas, industrial and mining areas, residential land): Refers to land used for industrial, mining, transportation, and other purposes outside of urban and rural residential areas.51 Town
52 Rural Settlement
53 Land for Industrial and Commercial Construction
51: Land used for built-up areas of large, medium, and small cities, as well as towns and counties above the county level.
52: Rural residential points that are independent of urban and town areas.
53: Land used for factories, mines, large industrial parks, oil fields, salt fields, quarries, transportation roads, airports, and special purpose areas.
6 Unused Land: Land that is not currently utilized, including land that is difficult to utilize.61 Sandy Land
62 Gobi
63 Saline-Alkali Land
64 Swamps
65 Bare Land
66 Rocky and Gravel Land
67 Other Unused Land
-
Table 3. Different normalization methods of 2010.
K-ValueBSS/TSS of Z-Score
Normalization
BSS/TSS of Median Absolute
Deviation
30.620.66
40.700.71
50.730.74
Table 4. The BSS/TSS values of clustering diagrams at different k-values over 10 years.
K-ValueBSS/TSS
201020152020
30.660.610.63
40.710.680.70
50.740.730.74
Table 5. Area and proportion of different land types over 10 years.
K = 5201020152020
Area (km2)Area Ratio (%)Area (km2)Area Ratio (%)Area (km2)Area Ratio (%)
Urban–Rural8686.28%10007.23%11998.67%
Urban2882.08%4803.47%5664.09%
Rural12,67291.64%12,34889.30%12,06387.24%
Table 6. Growth Area and Average Annual Growth Rate of each land type for the period of 2010–2015 and 2015–2020.
Stage2010–20152015–2020
RegionGA (km2)AAGR (%)GA (km2)AAGR (%)
Urban19210.76%863.35%
Urban–rural1322.87%1993.70%
Rural−324−0.51%−285−0.47%
Note: GA = growth area, AAGR = Average Annual Growth Rate.
Disclaimer/Publisher’s Note: The statements, opinions and data contained in all publications are solely those of the individual author(s) and contributor(s) and not of MDPI and/or the editor(s). MDPI and/or the editor(s) disclaim responsibility for any injury to people or property resulting from any ideas, methods, instructions or products referred to in the content.

