
Quantification of Carbon Flux Patterns in Ecosystems: A Case Study of Prince Edward Island

 ,
,  ,
,  ,
,  , and
, and
Abstract
1. Introduction
2. Data and Methods
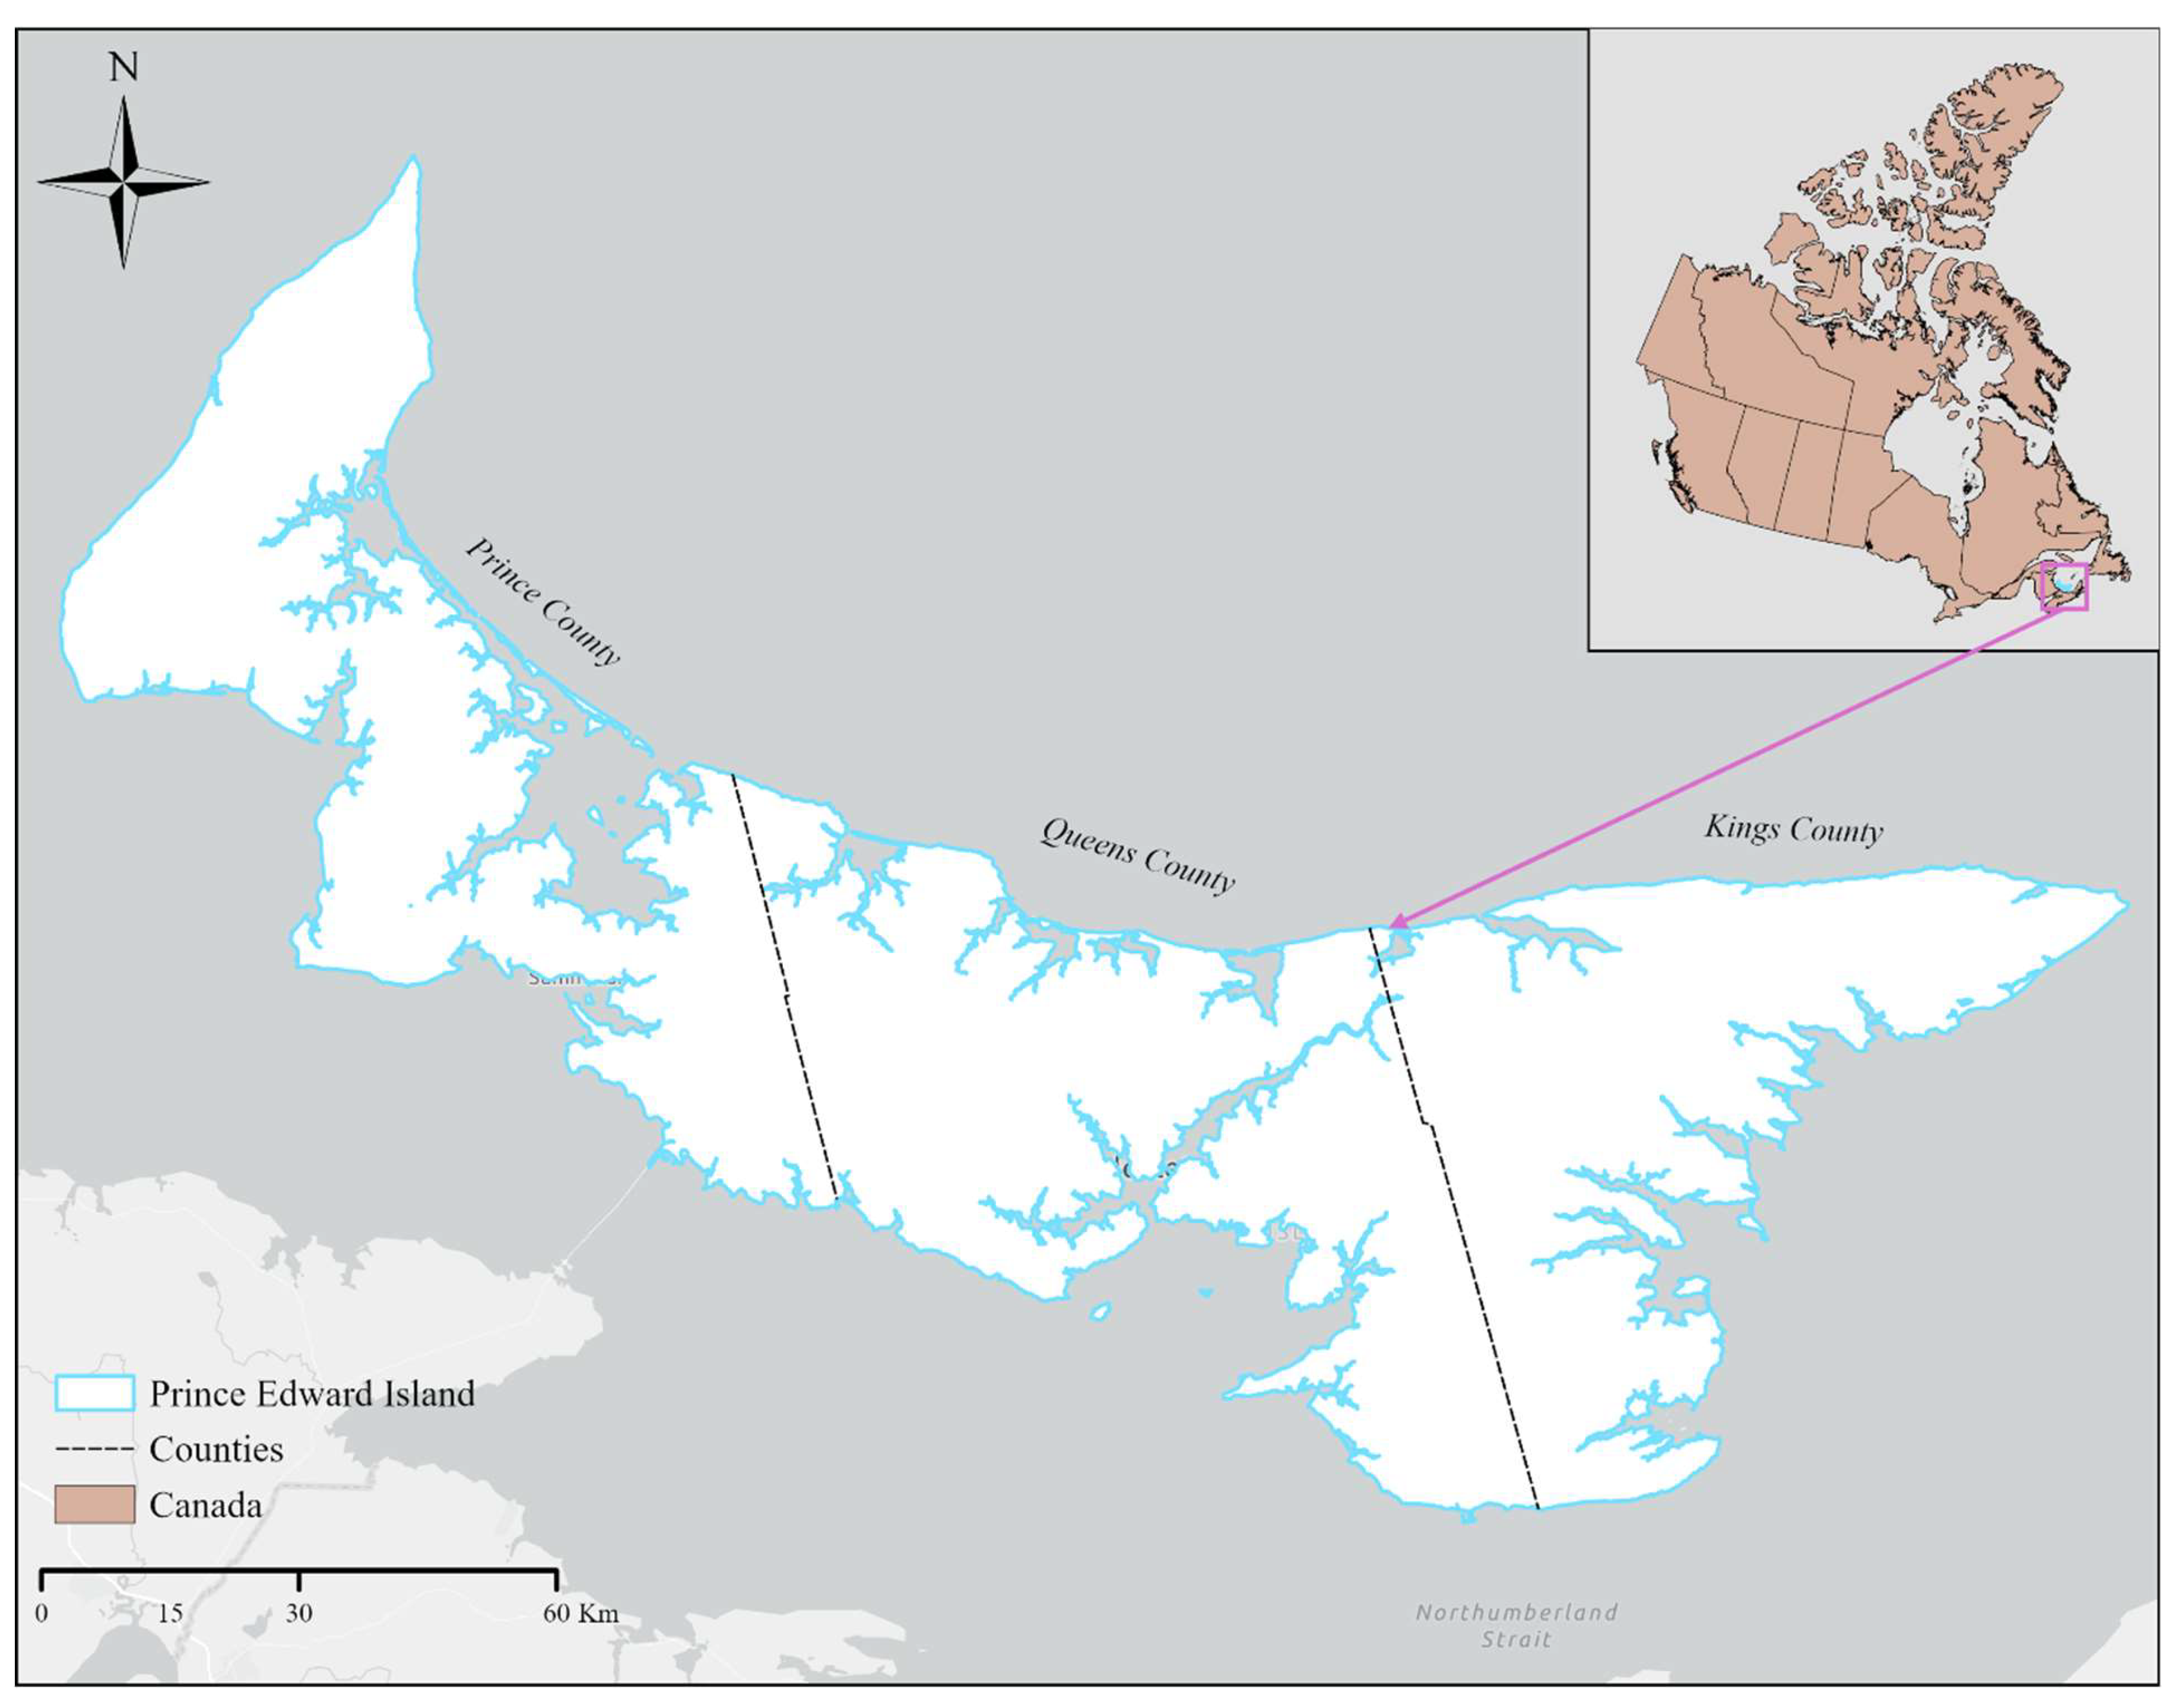
2.1. Study Area
2.2. Data Sources
2.3. Emission and Removal Factors
2.4. Forest
2.5. Sand Dunes
2.6. Seasonally Flooded Flat
2.7. Meadows
2.8. Brackish Marsh
2.9. Salt Marsh
2.10. Deep Marsh
2.11. Wooded Swamp
2.12. Shrub Swamp
2.13. Bog
2.14. Grass
2.15. Shrubs
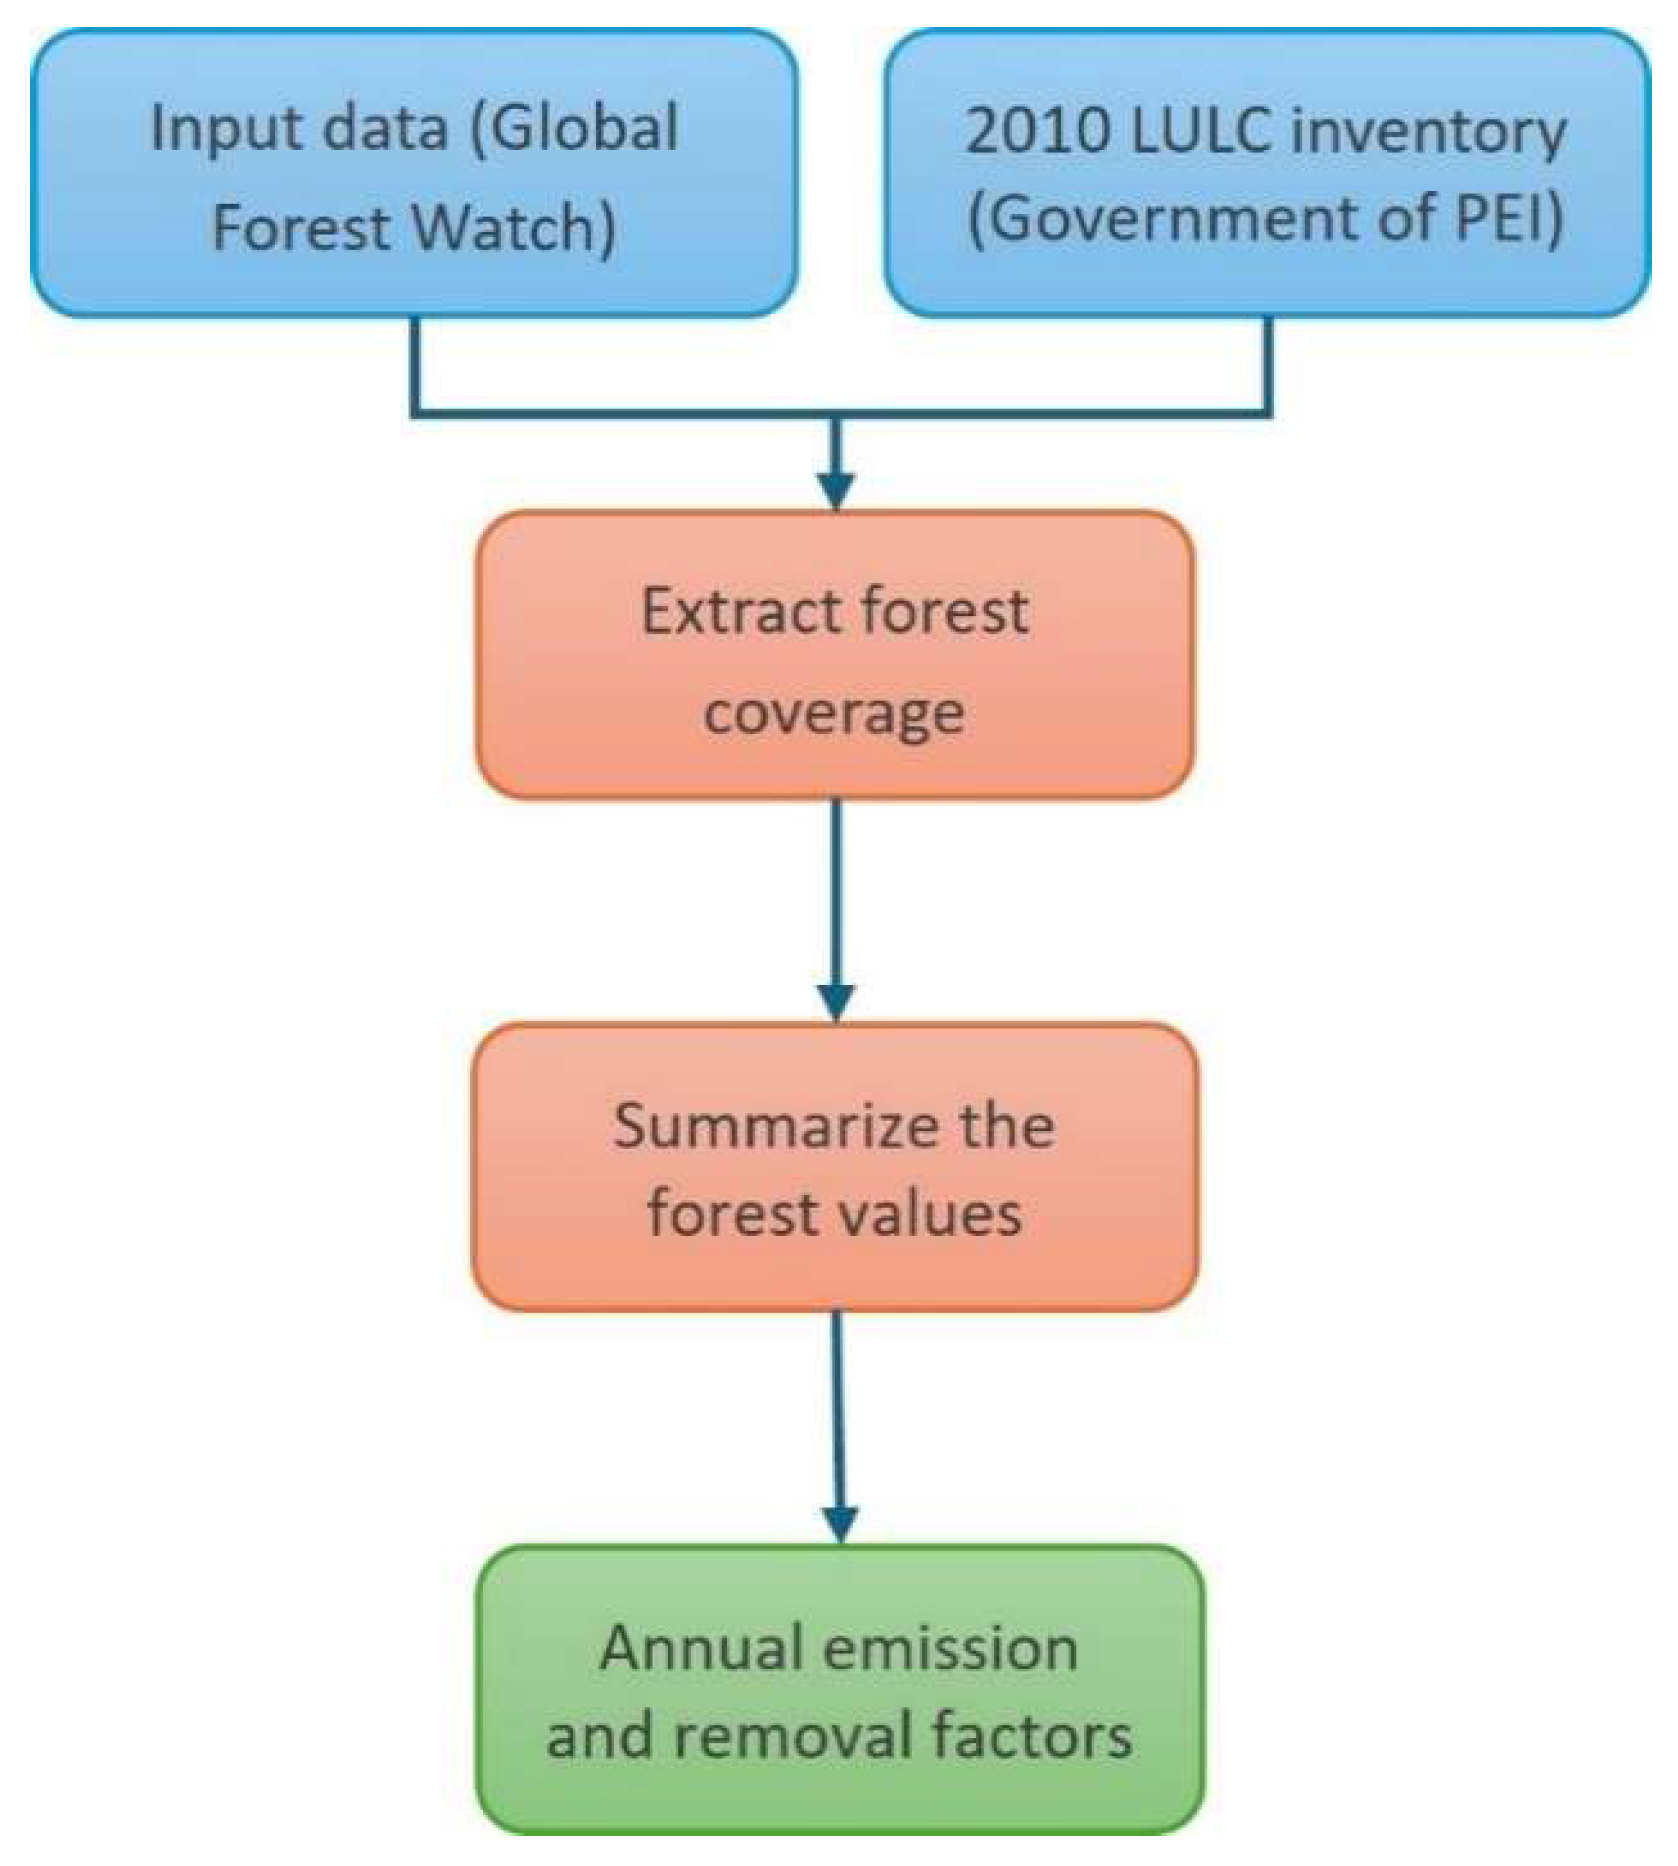
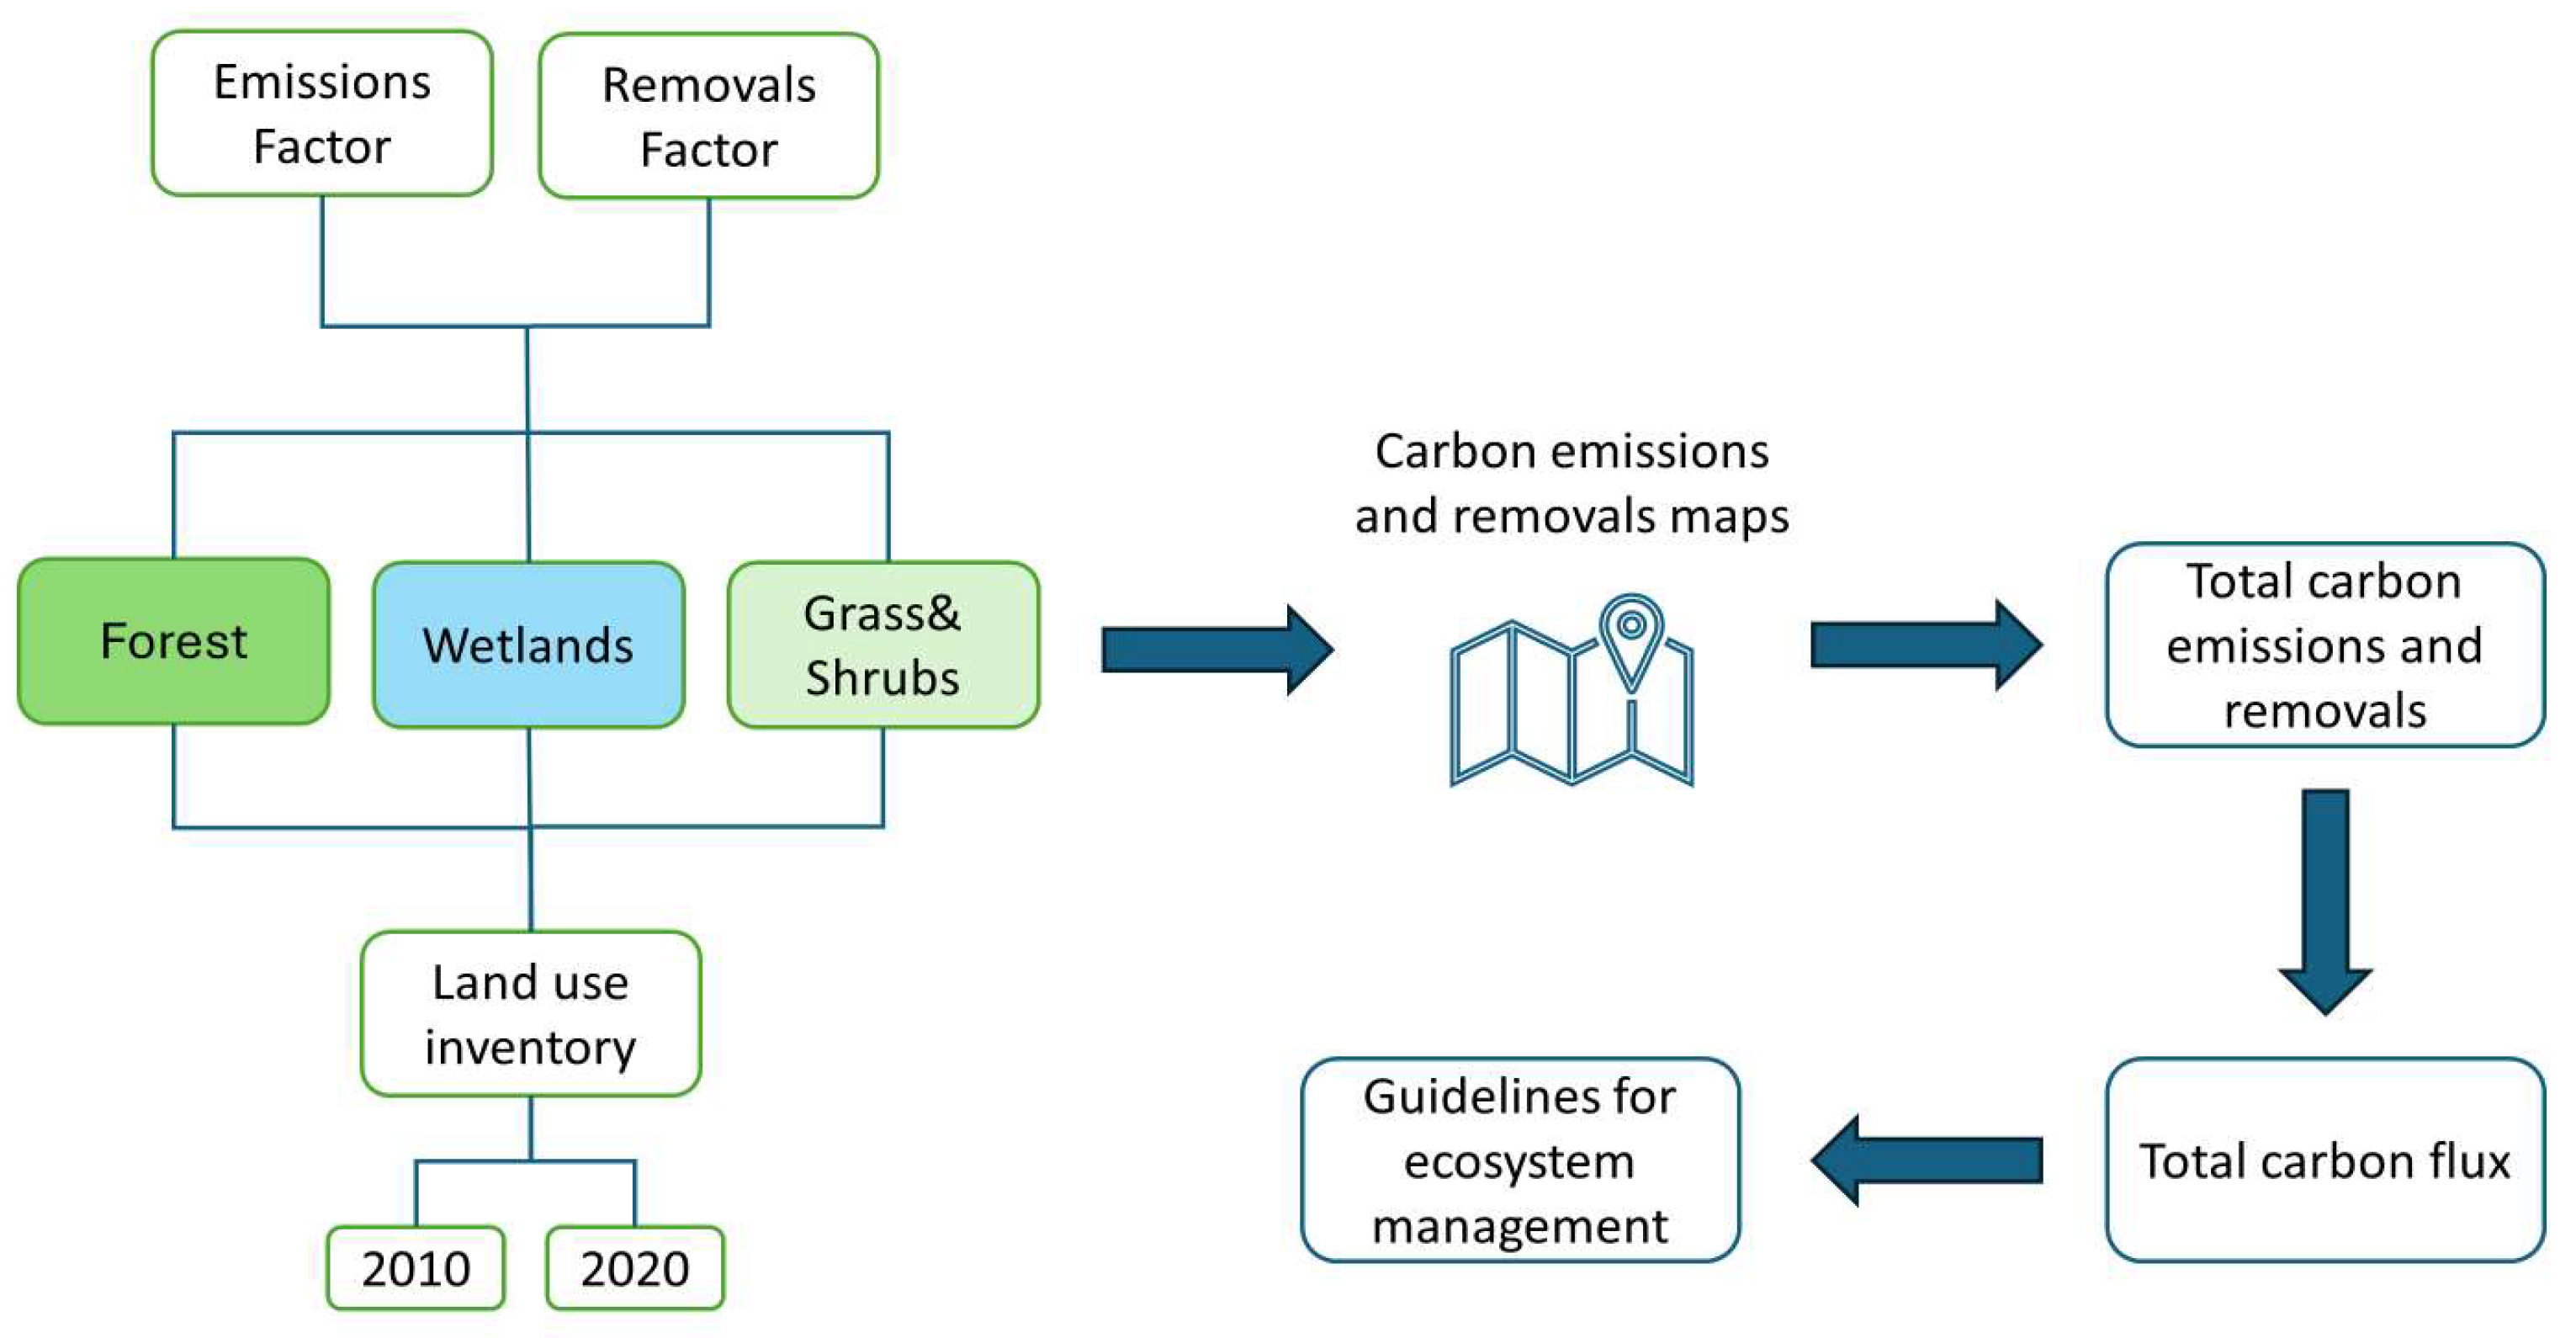
2.16. Data Processing
3. Results and Discussions
3.1. Quantification of Forest Carbon Flux in PEI Ecosystem
3.2. Quantification of Wetland Carbon Flux in PEI Ecosystem
3.3. Quantification of Grass and Shrubs’ Carbon Flux in PEI’s Ecosystem
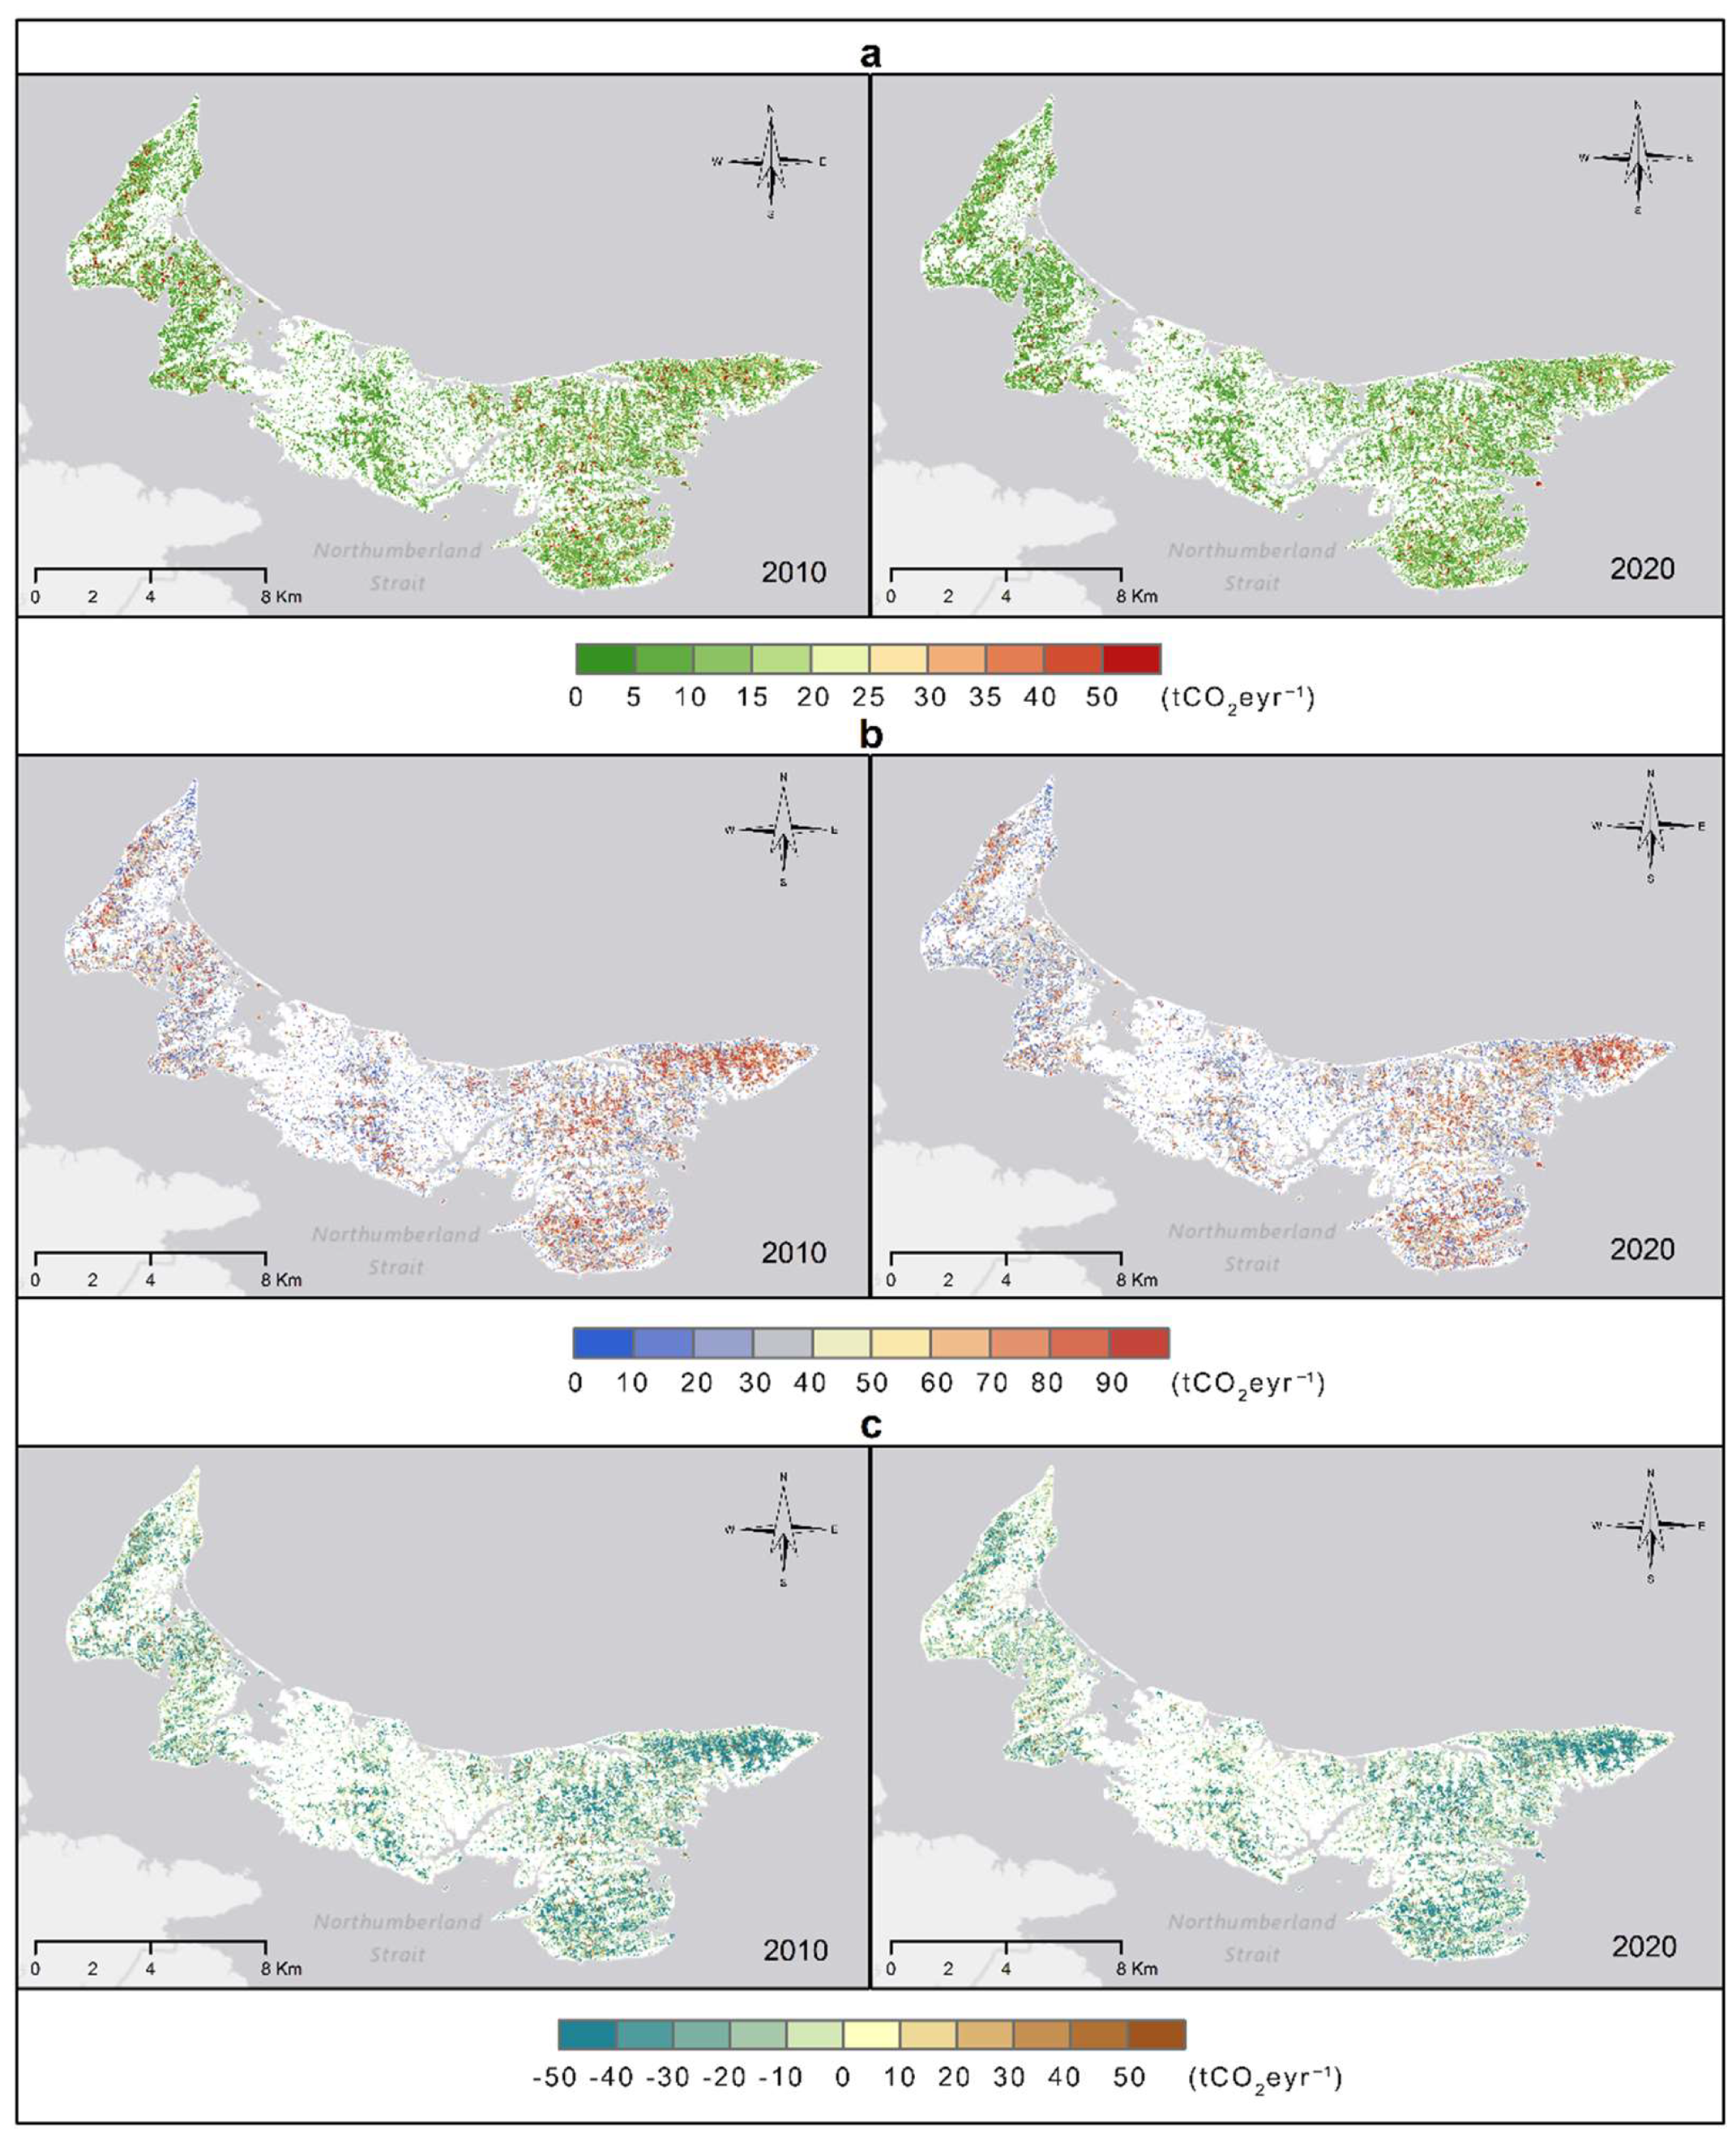
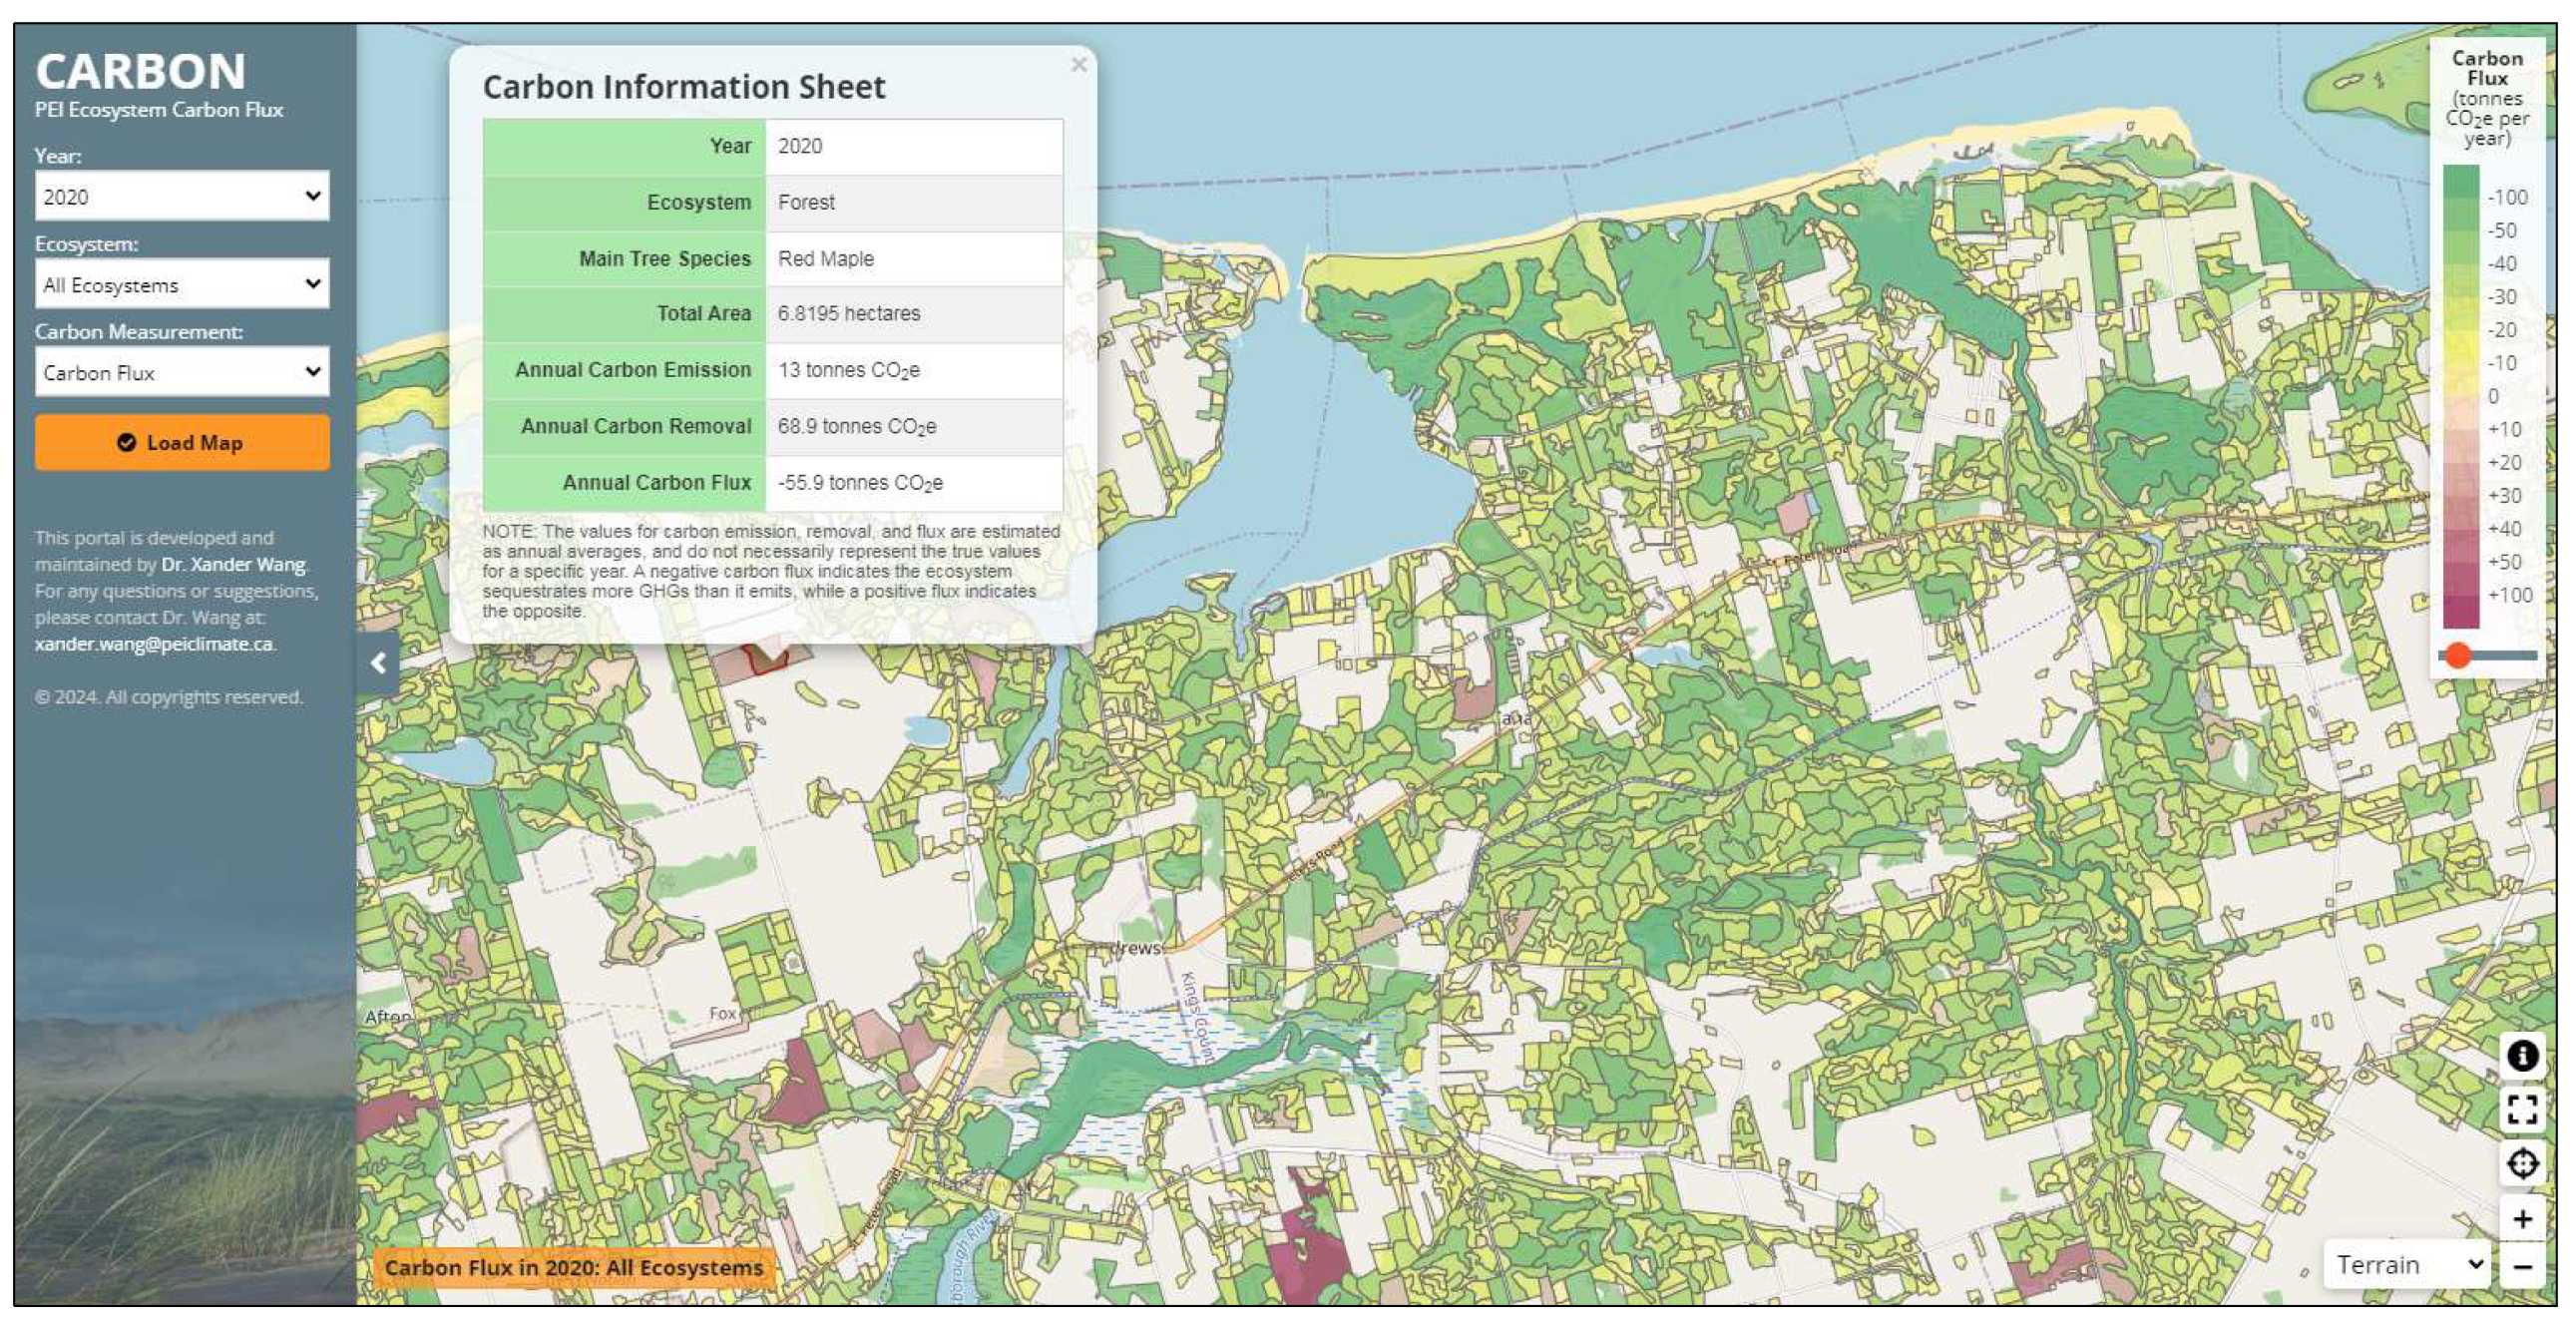
3.4. Carbon Flux Mapping
4. Ecosystem Management and Planning
5. Conclusions
Author Contributions
Funding
Data Availability Statement
Conflicts of Interest
References
- Masson-Delmotte, V.; Pörtner, H.; Skea, J.; Buendía, E.; Zhai, P.; Roberts, D. Climate Change and Land; Cambridge University Press: Cambridge, UK, 2019. [Google Scholar]
- Sahoo, S.; Pan, S. Assessing of LULC and Climate Change in Kolkata Urban Agglomeration Using MOLUSCE Model. In Geospatial Practices in Natural Resources Management; Springer: Berlin/Heidelberg, Germany, 2024; pp. 19–30. [Google Scholar]
- Li, G.; Nazir, M.M.; Zulfiqar, F.; Siddique, K.H.; Iqbal, B.; Du, D. Harnessing soil carbon sequestration to address climate change challenges in agriculture. Soil Tillage Res. 2023, 237, 105959. [Google Scholar]
- Walker, A.P.; De Kauwe, M.G.; Bastos, A.; Belmecheri, S.; Georgiou, K.; Keeling, R.F.; McMahon, S.M.; Medlyn, B.E.; Moore, D.J.P.; Norby, R.J.; et al. Integrating the evidence for a terrestrial carbon sink caused by increasing atmospheric CO2. New Phytol. 2021, 229, 2413–2445. [Google Scholar] [CrossRef] [PubMed]
- Shao, Y.; Li, J.; Zhou, Z.; Hu, Z.; Zhang, F.; Cui, Y.; Chen, H. The effects of vertical farming on indoor carbon dioxide concentration and fresh air energy consumption in office buildings. Build. Environ. 2021, 195, 107766. [Google Scholar] [CrossRef]
- Tubiello, F.N.; Pekkarinen, A.; Marklund, L.; Wanner, N.; Conchedda, G.; Federici, S.; Rossi, S.; Grassi, G. Carbon Emissions and Removals by Forests: New Estimates 1990. Sci. Data Discuss. 2020, in press. [Google Scholar]
- UNFCCC. Adoption of the Paris Agreement FCCC/CP/2015/L. 9/Rev. 1. In Proceedings of the United Nations Framework Convention on Climate Change, Warsaw, Poland, 11–23 November 2013; United Nations Framework Convention on Climate Change: Paris, France, 2015. [Google Scholar]
- Yadav, V.S.; Yadav, S.S.; Gupta, S.R.; Meena, R.S.; Lal, R.; Sheoran, N.S.; Jhariya, M.K. Carbon sequestration potential and CO2 fluxes in a tropical forest ecosystem. Ecol. Eng. 2022, 176, 106541. [Google Scholar] [CrossRef]
- Were, D.; Kansiime, F.; Fetahi, T.; Hein, T. Carbon Dioxide and Methane Fluxes from Various Vegetation Communities of a Natural Tropical Freshwater Wetland in Different Seasons. Environ. Process. 2021, 8, 553–571. [Google Scholar] [CrossRef]
- Yu, G.; Song, X.; Wang, Q.; Liu, Y.; Guan, D.; Yan, J.; Sun, X.; Zhang, L.; Wen, X. Water-use efficiency of forest ecosystems in eastern China and its relations to climatic variables. New Phytol. 2008, 177, 927–937. [Google Scholar] [CrossRef]
- Zhao, M.; Yang, J.; Zhao, N.; Liu, Y.; Wang, Y.; Wilson, J.P.; Yue, T. Estimation of China’s forest stand biomass carbon sequestration based on the continuous biomass expansion factor model and seven forest inventories from 1977 to 2013. For. Ecol. Manag. 2019, 448, 528–534. [Google Scholar] [CrossRef]
- Valach, A.C.; Kasak, K.; Hemes, K.S.; Anthony, T.L.; Dronova, I.; Taddeo, S.; Silver, W.L.; Szutu, D.; Verfaillie, J.; Baldocchi, D.D. Productive wetlands restored for carbon sequestration quickly become net CO2 sinks with site-level factors driving uptake variability. PLoS ONE 2021, 16, e0248398. [Google Scholar] [CrossRef]
- Zhu, Z.; Piao, S.; Myneni, R.B.; Huang, M.; Zeng, Z.; Canadell, J.G.; Ciais, P.; Sitch, S.; Friedlingstein, P.; Arneth, A.; et al. Greening of the Earth and its drivers. Nat. Clim. Change 2016, 6, 791–795. [Google Scholar] [CrossRef]
- Romeiro, J.M.N.; Eid, T.; Antón-Fernández, C.; Kangas, A.; Trømborg, E. Natural disturbances risks in European Boreal and Temperate forests and their links to climate change—A review of modelling approaches. For. Ecol. Manag. 2022, 509, 120071. [Google Scholar] [CrossRef]
- O’connor, J.J.; Fest, B.J.; Sievers, M.; Swearer, S.E. Impacts of land management practices on blue carbon stocks and greenhouse gas fluxes in coastal ecosystems—A meta-analysis. Glob. Change Biol. 2020, 26, 1354–1366. [Google Scholar] [CrossRef] [PubMed]
- Zheng, J.; Shi, Y.; Gilbert, K. LULC change and CO2 emissions in Shangai 2000–2020. Intercont. Geoinf. Days 2023, 7, 53–56. [Google Scholar]
- Ray, D.K.; West, P.C.; Clark, M.; Gerber, J.S.; Prishchepov, A.V.; Chatterjee, S. Climate change has likely already affected global food production. PLoS ONE 2019, 14, e0217148. [Google Scholar] [CrossRef]
- Rossi, F.S.; Santos, G.A.d.A.; Maria, L.d.S.; Lourençoni, T.; Pelissari, T.D.; Della-Silva, J.L.; Júnior, J.W.O.; Silva, A.d.A.e.; Lima, M.; Teodoro, P.E.; et al. Carbon dioxide spatial variability and dynamics for contrasting land uses in central Brazil agricultural frontier from remote sensing data. J. South Am. Earth Sci. 2022, 116, 103809. [Google Scholar] [CrossRef]
- Messori, G.; Brocchieri, F.; Morello, E.; Ozgen, S.; Caserini, S. A climate mitigation action index at the local scale: Methodology and case study. J. Environ. Manag. 2020, 260, 110024. [Google Scholar] [CrossRef]
- Tang, K.H.D.; Hadibarata, T. Seagrass meadows under the changing climate: A review of the impacts of climate stressors. Res. Ecol. 2022, 4, 27–36. [Google Scholar] [CrossRef]
- Shine, C. Invasive species in an international context: IPPC, CBD, European Strategy on Invasive Alien Species and other legal instruments. EPPO Bull. 2007, 37, 103–113. [Google Scholar] [CrossRef]
- Xia, C.; Li, Y.; Xu, T.; Chen, Q.; Ye, Y.; Shi, Z.; Liu, J.; Ding, Q.; Li, X. Analyzing spatial patterns of urban carbon metabolism and its response to change of urban size: A case of the Yangtze River Delta, China. Ecol. Indic. 2019, 104, 615–625. [Google Scholar] [CrossRef]
- 2000/02 PRINCE EDWARD ISLAND Corporate Land Use Inventory Forest Summary. Available online: https://www.princeedwardisland.ca/sites/default/files/publications/2002_corporate_land_use_inventory._forest_summary.pdf (accessed on 6 September 2024).
- Zhang, M.; Liu, G. Mapping contiguous XCO2 by machine learning and analyzing the spatio-temporal variation in China from 2003 to 2019. Sci. Total Environ. 2023, 858, 159588. [Google Scholar] [CrossRef]
- Basheer, S.; Wang, X.; Farooque, A.A.; Nawaz, R.A.; Liu, K.; Adekanmbi, T.; Liu, S. Comparison of Land Use Land Cover Classifiers Using Different Satellite Imagery and Machine Learning Techniques. Remote. Sens. 2022, 14, 4978. [Google Scholar] [CrossRef]
- Van Dau, Q.; Wang, X.; Shah, M.A.R.; Kinay, P.; Basheer, S. Assessing the Potential Impacts of Climate Change on Current Coastal Ecosystems—A Canadian Case Study. Remote. Sens. 2023, 15, 4742. [Google Scholar]
- Nawaz, R.A.; Wang, X.; Basheer, S.; Sonier, K.; Pang, T.; Adekanmbi, T. Spatiotemporal trends in temperature and precipitation for Prince Edward Island over 1971–2020. Can. J. Civ. Eng. 2023, 50, 892–910. [Google Scholar] [CrossRef]
- Nyiraneza, J.; Thompson, B.; Geng, X.; He, J.; Jiang, Y.; Fillmore, S.; Stiles, K. Changes in soil organic matter over 18 yr in Prince Edward Island, Canada. Can. J. Soil Sci. 2017, 97, 745–756. [Google Scholar]
- Harris, N.L.; Gibbs, D.A.; Baccini, A.; Birdsey, R.A.; de Bruin, S.; Farina, M.; Fatoyinbo, L.; Hansen, M.C.; Herold, M.; Houghton, R.A.; et al. Global maps of twenty-first century forest carbon fluxes. Nat. Clim. Change 2021, 11, 234–240. [Google Scholar] [CrossRef]
- Wilson, D.; Dixon, S.D.; Artz, R.R.E.; Smith, T.E.L.; Evans, C.D.; Owen, H.J.F.; Archer, E.; Renou-Wilson, F. Derivation of greenhouse gas emission factors for peatlands managed for extraction in the Republic of Ireland and the United Kingdom. Biogeosciences 2015, 12, 5291–5308. [Google Scholar] [CrossRef]
- Lunt, P.H.; Fyfe, R.M.; Tappin, A.D. Role of recent climate change on carbon sequestration in peatland systems. Sci. Total. Environ. 2019, 667, 348–358. [Google Scholar] [CrossRef]
- Holm, G.O.; Perez, B.C.; McWhorter, D.E.; Krauss, K.W.; Johnson, D.J.; Raynie, R.C.; Killebrew, C.J. Ecosystem Level Methane Fluxes from Tidal Freshwater and Brackish Marshes of the Mississippi River Delta: Implications for Coastal Wetland Carbon Projects. Wetlands 2016, 36, 401–413. [Google Scholar] [CrossRef]
- Phillips, R.; Beeri, O. The role of hydropedologic vegetation zones in greenhouse gas emissions for agricultural wetland landscapes. CATENA 2008, 72, 386–394. [Google Scholar] [CrossRef]
- Chen, J.; Wang, D.; Li, Y.; Yu, Z.; Chen, S.; Hou, X.; White, J.R.; Chen, Z. The Carbon Stock and Sequestration Rate in Tidal Flats from Coastal China. Glob. Biogeochem. Cycles 2020, 34, e2020GB006772. [Google Scholar] [CrossRef]
- Lovelock, C.E.; Adame, M.F.; Bradley, J.; Dittmann, S.; Hagger, V.; Hickey, S.M.; Hutley, L.B.; Jones, A.; Kelleway, J.J.; Lavery, P.S.; et al. An Australian blue carbon method to estimate climate change mitigation benefits of coastal wetland restoration. Restor. Ecol. 2023, 31, 13739. [Google Scholar] [CrossRef]
- Novak, A.B.; Pelletier, M.C.; Colarusso, P.; Simpson, J.; Gutierrez, M.N.; Arias-Ortiz, A.; Charpentier, M.; Masque, P.; Vella, P. Factors Influencing Carbon Stocks and Accumulation Rates in Eelgrass Meadows Across New England, USA. Estuaries Coasts 2020, 43, 2076–2091. [Google Scholar] [CrossRef] [PubMed]
- Chmura, G.L.; Kellman, L.; Van Ardenne, L.; Guntenspergen, G.R.J.P.o. Greenhouse gas fluxes from salt marshes exposed to chronic nutrient enrichment. PLoS ONE 2016, 11, e0149937. [Google Scholar] [CrossRef]
- Beaumont, N.; Jones, L.; Garbutt, A.; Hansom, J.; Toberman, M. The value of carbon sequestration and storage in coastal habitats. Estuar. Coast. Shelf Sci. 2014, 137, 32–40. [Google Scholar] [CrossRef]
- Drius, M.; Carranza, M.L.; Stanisci, A.; Jones, L. The role of Italian coastal dunes as carbon sinks and diversity sources. A multi-service perspective. Appl. Geogr. 2016, 75, 127–136. [Google Scholar] [CrossRef]
- Dalva, M.; Moore, T.R.; Arp, P.; Clair, T.A. Methane and soil and plant community respiration from wetlands, Kejimkujik National Park, Nova Scotia: Measurements, predictions, and climatic change. J. Geophys. Res. Atmos. 2001, 106, 2955–2962. [Google Scholar] [CrossRef]
- Kendall, R.A.; Harper, K.A.; Burton, D.; Hamdan, K. The role of temperate treed swamps as a carbon sink in southwestern Nova Scotia. Can. J. For. Res. 2021, 51, 78–88. [Google Scholar] [CrossRef]
- Inisheva, L.I.; Golovchenko, A.V. Monitoring of Greenhouse Gas Production on the Landscape Profile of the Vasyugan Swamp. Eurasian Soil Sci. 2022, 55, 1222–1234. [Google Scholar] [CrossRef]
- Artz, R.R.E.; Coyle, M.; Donaldson-Selby, G.; Morrison, R. Net carbon dioxide emissions from an eroding Atlantic blanket bog. Biogeochemistry 2022, 159, 233–250. [Google Scholar] [CrossRef]
- Pasalodos-Tato, M.; Ruiz-Peinado, R.; del Río, M.; Montero, G. Shrub biomass accumulation and growth rate models to quantify carbon stocks and fluxes for the Mediterranean region. Eur. J. For. Res. 2015, 134, 537–553. [Google Scholar] [CrossRef]
- Bernal, B.; Mitsch, W.J. Comparing carbon sequestration in temperate freshwater wetland communities. Glob. Change Biol. 2012, 18, 1636–1647. [Google Scholar] [CrossRef]
- Vestin, P.; Mölder, M.; Kljun, N.; Cai, Z.; Hasan, A.; Holst, J.; Klemedtsson, L.; Lindroth, A. Impacts of Clear-Cutting of a Boreal Forest on Carbon Dioxide, Methane and Nitrous Oxide Fluxes. Forests 2020, 11, 961. [Google Scholar] [CrossRef]
- Korkiakoski, M.; Tuovinen, J.-P.; Penttilä, T.; Sarkkola, S.; Ojanen, P.; Minkkinen, K.; Rainne, J.; Laurila, T.; Lohila, A. Greenhouse gas and energy fluxes in a boreal peatland forest after clear-cutting. Biogeosciences 2018, 16, 3703–3723. [Google Scholar] [CrossRef]
- Li, Z.; Ratliff, E.A.; Sharkey, T.D. Effect of Temperature on Postillumination Isoprene Emission in Oak and Poplar. Plant Physiol. 2011, 155, 1037–1046. [Google Scholar] [CrossRef] [PubMed]
- Jones, M.L.M.; Sowerby, A.; Williams, D.L.; Jones, R.E. Factors controlling soil development in sand dunes: Evidence from a coastal dune soil chronosequence. Plant Soil 2008, 307, 219–234. [Google Scholar] [CrossRef]
- Del Vecchio, S.; Rova, S.; Fantinato, E.; Pranovi, F.; Buffa, G. Disturbance affects the contribution of coastal dune vegetation to carbon storage and carbon sequestration rate. Plant Sociol. 2022, 59, 37–48. [Google Scholar] [CrossRef]
- Abril, G.; Borges, A.V. Carbon dioxide and methane emissions from estuaries. In Greenhouse Gas Emissions—Fluxes and Processes: Hydroelectric Reservoirs and Natural Environments; Springer: Berlin/Heidelberg, Germany, 2005; pp. 187–207. [Google Scholar]
- Dang, N.Y.T.; Park, H.-S.; Mir, K.A.; Kim, C.-G.; Kim, S. Greenhouse Gas Emission Model for Tidal Flats in the Republic of Korea. J. Mar. Sci. Eng. 2021, 9, 1181. [Google Scholar] [CrossRef]
- Environment and Climate Change Canada. Eelgrass in Canada. 2022. Available online: https://www.canada.ca/en/environment-climate-change/services/environmental-indicators/eelgrass-canada.html (accessed on 6 September 2024).
- Lovelock, C.E.; Fourqurean, J.W.; Morris, J.T. Modeled CO2 Emissions from Coastal Wetland Transitions to Other Land Uses: Tidal Marshes, Mangrove Forests, and Seagrass Beds. Front. Mar. Sci. 2017, 4, 24635. [Google Scholar] [CrossRef]
- Knox, S.H.; Windham-Myers, L.; Anderson, F.; Sturtevant, C.; Bergamaschi, B. Direct and Indirect Effects of Tides on Ecosystem-Scale CO2 Exchange in a Brackish Tidal Marsh in Northern California. J. Geophys. Res. Biogeosci. 2018, 123, 787–806. [Google Scholar] [CrossRef]
- Shiau, Y.-J.; Burchell, M.R.; Krauss, K.W.; Birgand, F.; Broome, S.W. Greenhouse Gas Emissions from a Created Brackish Marsh in Eastern North Carolina. Wetlands 2016, 36, 1009–1024. [Google Scholar] [CrossRef]
- Costanza, R.; d’Arge, R.; De Groot, R.; Farber, S.; Grasso, M.; Hannon, B.; Limburg, K.; Naeem, S.; O’neill, R.V.; Paruelo, J. The value of the world’s ecosystem services and natural capital. Nature 1997, 387, 253–260. [Google Scholar] [CrossRef]
- McKee, K.; Rogers, K.; Saintilan, N. Response of salt marsh and mangrove wetlands to changes in atmospheric CO2, climate, and sea level. In Global Change and the Function and Distribution of Wetlands; Springer: Berlin/Heidelberg, Germany, 2012; pp. 63–96. [Google Scholar]
- Roughan, B.L.; Kellman, L.; Smith, E.; Chmura, G.L. Nitrous oxide emissions could reduce the blue carbon value of marshes on eutrophic estuaries. Environ. Res. Lett. 2018, 13, 044034. [Google Scholar] [CrossRef]
- Carnell, P.E.; Windecker, S.M.; Brenker, M.; Baldock, J.; Masque, P.; Brunt, K.; Macreadie, P.I. Carbon stocks, sequestration, and emissions of wetlands in south eastern Australia. Glob. Change Biol. 2018, 24, 4173–4184. [Google Scholar] [CrossRef]
- Chico, G.; Clewer, T.; Midgley, N.G.; Gallego-Anex, P.; Ramil-Rego, P.; Ferreiro, J.; Whayman, E.; Goeckeritz, S.; Stanton, T. The extent of windfarm infrastructures on recognised European blanket bogs. Sci. Rep. 2023, 13, 3919. [Google Scholar] [CrossRef] [PubMed]
- Morison, J.; Matthews, R.; Miller, G.; Perks, M.; Randle, T.; Vanguelova, E.; White, M.; Yamulki, S. Understanding the Carbon and Greenhouse Gas Balance of Forests in Britain. 2012. Available online: https://www.cabidigitallibrary.org/doi/full/10.5555/20123346717 (accessed on 6 September 2024).
- Rees, R.; Bingham, I.; Baddeley, J.; Watson, C. The role of plants and land management in sequestering soil carbon in temperate arable and grassland ecosystems. Geoderma 2005, 128, 130–154. [Google Scholar] [CrossRef]
- Goldstein, A.; Turner, W.R.; Spawn, S.A.; Anderson-Teixeira, K.J.; Cook-Patton, S.; Fargione, J.; Gibbs, H.K.; Griscom, B.; Howard, J.F.; Ledezma, J.C.; et al. Protecting irrecoverable carbon in Earth’s ecosystems. Nat. Clim. Change 2020, 10, 287–295. [Google Scholar] [CrossRef]
- Griffiths, H.M.; Eggleton, P.; Hemming-Schroeder, N.; Swinfield, T.; Woon, J.S.; Allison, S.D.; Parr, C.L. Carbon flux and forest dynamics: Increased deadwood decomposition in tropical rainforest tree-fall canopy gaps. Glob. Change Biol. 2021, 27, 1601–1613. [Google Scholar] [CrossRef]
- Bond-Lamberty, B.; Christianson, D.S.; Malhotra, A.; Pennington, S.C.; Sihi, D.; AghaKouchak, A.; Anjileli, H.; Arain, M.A.; Armesto, J.J.; Ashraf, S.; et al. COSORE: A community database for continuous soil respiration and other soil-atmosphere greenhouse gas flux data. Glob. Change Biol. 2020, 26, 7268–7283. [Google Scholar] [CrossRef]


| Land Cover | Emission Factor (tCO2eha−1yr−1) | Removal Factor (tCO2eha−1yr−1) |
|---|---|---|
| Forest [29] | ||
| Alder | 1.01 | 10.05 |
| Austrian Pine | 4.35 | 7.17 |
| Aspen Provenance | 0.00 | 11.14 |
| Black Ash | 1.09 | 10.18 |
| Beech | 0.79 | 10.89 |
| Balsam Fir | 2.32 | 10.10 |
| Black Spruce | 2.51 | 9.82 |
| Clear Cut | 8.55 | 5.65 |
| Cedar | 4.22 | 8.68 |
| Corsican Pine | 0.61 | 3.67 |
| Douglas Fir | 4.38 | 8.67 |
| Dead Tree | 15.39 | 3.85 |
| European Birch | 0.00 | 11.23 |
| European Larch | 0.69 | 7.12 |
| Elm | 0.65 | 10.83 |
| Grey Birch | 1.13 | 8.16 |
| Hemlock | 1.98 | 10.50 |
| Hybrid Poplar | 0.00 | 10.05 |
| Hybrid Spruce | 3.75 | 8.23 |
| Japanese Larch | 1.06 | 7.14 |
| Jack Pine | 2.75 | 10.52 |
| Eastern Larch | 2.64 | 9.46 |
| Linden | 0.00 | 9.09 |
| Lodgepole Pine | 3.62 | 10.45 |
| Larch Provenance | 0.00 | 6.72 |
| Apple | 0.71 | 10.78 |
| Norway Spruce | 1.70 | 6.08 |
| Others | 0.78 | 6.35 |
| Pin Cherry | 3.09 | 7.27 |
| Poplar | 1.93 | 9.90 |
| Red Maple | 1.91 | 10.08 |
| Red Oak | 8.87 | 6.31 |
| Red Pine | 2.69 | 8.32 |
| Red Spruce | 3.65 | 9.85 |
| Sugar Maple | 1.11 | 10.71 |
| Scots Pine | 3.62 | 10.45 |
| White Ash | 2.84 | 8.84 |
| White Birch | 2.31 | 9.05 |
| Willow | 0.00 | 10.88 |
| White Pine | 3.47 | 7.65 |
| White Spruce | 3.27 | 9.61 |
| Yellow Birch | 2.13 | 10.33 |
| Yugoslavian Pine | 5.48 | 6.73 |
| Wetlands [30,31,32,33,34,35,36,37,38,39,40,41,42] | ||
| Bog | 1.67 | 11.70 |
| Brackish Marsh | 4.10 | 7.30 |
| Deep Marsh | 0.06 | 5.87 |
| Seasonally Flooded Flat | 4.01 | 4.76 |
| Meadows | 1.22 | 2.59 |
| Salt Marsh | 3.48 | 5.19 |
| Sand Dunes | 0.00 | 0.23 |
| Wooded Swamp | 15.16 | 14.97 |
| Shrub Swamp | 1.89 | 7.40 |
| Grass and Shrubs [43,44,45] | ||
| Grass | 13.09 | 20.62 |
| Shrubs | 5.75 | 6.70 |
| Cover Name | 2010 | 2020 | ||||
|---|---|---|---|---|---|---|
| Emissions (tCO2e) | Removals (tCO2e) | Flux (tCO2e) | Emissions (tCO2e) | Removals (tCO2e) | Flux (tCO2e) | |
| Alder | 11,759.66 | 117,596.57 | −105,836.91 | 7281.42 | 73,542.36 | −66,260.94 |
| Apple | 3.62 | 55.80 | −52.19 | 7.72 | 119.08 | −111.36 |
| Aspen Provenance | 0.00 | 2.97 | −2.97 | 0.00 | 0.00 | 0.00 |
| Austrian Pine | 130.60 | 218.67 | −88.08 | 83.29 | 139.47 | −56.17 |
| Balsam Fir | 24,140.96 | 106,010.30 | −81,869.34 | 34,061.32 | 149,573.62 | −115,512.30 |
| Beech | 141.31 | 1925.37 | −1784.06 | 126.50 | 1723.59 | −1597.09 |
| Black Ash | 8.83 | 81.86 | −73.03 | 0.74 | 6.86 | −6.12 |
| Black Spruce | 57,788.58 | 226,531.24 | −168,742.66 | 57,065.73 | 223,697.65 | −166,631.92 |
| Cedar | 551.39 | 1142.16 | −590.77 | 2386.07 | 4942.56 | −2556.50 |
| Clear Cut | 161,544.08 | 105,191.49 | 56,352.58 | 113,877.88 | 74,153.03 | 39,724.84 |
| Corsican Pine | 0.72 | 4.45 | −3.73 | 0.72 | 4.45 | −3.73 |
| Dead Tree | 4570.00 | 1157.34 | 3412.66 | 2036.14 | 515.65 | 1520.50 |
| Douglas Fir | 54.65 | 108.05 | −53.41 | 65.70 | 129.91 | −64.21 |
| Eastern Larch | 19,723.61 | 72,067.04 | −52,343.43 | 24,335.14 | 88,916.86 | −64,581.72 |
| Elm | 0.66 | 10.15 | −9.50 | 6.27 | 96.73 | −90.46 |
| European Birch | 0.00 | 12.50 | −12.50 | 0.00 | 42.39 | −42.39 |
| European Larch | 35.77 | 362.83 | −327.06 | 72.94 | 739.81 | −666.87 |
| Grey Birch | 150.72 | 1123.51 | −972.80 | 3650.58 | 27,213.39 | −23,562.82 |
| Hemlock | 86.28 | 452.98 | −366.70 | 99.28 | 521.23 | −421.95 |
| Hybrid Poplar | 0.00 | 89.02 | −89.02 | 0.00 | 100.93 | −100.93 |
| Hybrid Spruce | 15.64 | 34.65 | −19.02 | 14.57 | 32.28 | −17.72 |
| Jack Pine | 355.36 | 1381.97 | −1026.61 | 220.60 | 857.90 | −637.30 |
| Japanese Larch | 436.21 | 2815.56 | −2379.35 | 414.12 | 2672.98 | −2258.86 |
| Larch Provenance | 0.00 | 50.79 | −50.79 | 0.00 | 49.81 | −49.81 |
| Linden | 0.00 | 9.69 | −9.69 | 0.00 | 5.41 | −5.41 |
| Lodgepole Pine | 11.22 | 32.42 | −21.20 | 0.00 | 0.00 | 0.00 |
| Norway Spruce | 1493.49 | 5358.98 | −3865.49 | 1427.48 | 5122.12 | −3694.64 |
| Others | 39.40 | 310.28 | −270.88 | 0.00 | 0.00 | 0.00 |
| Pin Cherry | 1950.24 | 4592.50 | −2642.26 | 1024.81 | 2413.26 | −1388.45 |
| Poplar | 40,885.27 | 213,033.77 | −17,2148.50 | 35,160.36 | 183,203.98 | −148,043.62 |
| Red Maple | 155,462.11 | 826,403.85 | −670,941.74 | 165,619.36 | 880,397.64 | −714,778.28 |
| Red Oak | 314.16 | 222.38 | 91.78 | 349.51 | 247.40 | 102.10 |
| Red Pine | 6361.62 | 19,556.09 | −13,194.47 | 5887.49 | 18,098.57 | −12,211.08 |
| Red Spruce | 11,311.81 | 29,961.02 | −18,649.21 | 6147.09 | 16,281.49 | −10,134.40 |
| Scots Pine | 231.76 | 669.53 | −437.77 | 220.20 | 636.13 | −415.93 |
| Sugar Maple | 13,173.50 | 128,142.25 | −114,968.75 | 11,807.18 | 114,851.62 | −103,044.44 |
| White Ash | 28.13 | 88.42 | −60.29 | 33.92 | 106.62 | −72.69 |
| White Birch | 22,314.46 | 87,317.47 | −65,003.00 | 24,313.58 | 95,140.08 | −70,826.50 |
| White Pine | 6412.29 | 14,107.05 | −7694.75 | 6703.62 | 14,747.97 | −8044.35 |
| White Spruce | 141,020.64 | 410,241.86 | −269,221.22 | 128,046.70 | 372,499.49 | −244,452.79 |
| Willow | 0.00 | 36.11 | −36.11 | 0.00 | 247.22 | −247.22 |
| Yellow Birch | 641.99 | 3148.80 | −2506.81 | 1377.28 | 6755.21 | −5377.93 |
| Yugoslavian Pine | 2.80 | 3.41 | −0.61 | 8.75 | 10.66 | −1.91 |
| Cover Name | 2010 | 2020 | ||||
|---|---|---|---|---|---|---|
| Emissions (tCO2e) | Removals (tCO2e) | Flux (tCO2e) | Emissions (tCO2e) | Removals (tCO2e) | Flux (tCO2e) | |
| Bog | 10,111 | 73,941 | −63,829 | 9300 | 68,007 | −58,707 |
| Brackish Marsh | 5109 | 9097 | −3988 | 4703 | 8375 | −3617 |
| Deep Marsh | 234 | 6263 | −6028 | 154 | 4115 | −3961 |
| Seasonally Flooded Flat | 49 | 58 | −12 | 63 | 75 | −15 |
| Meadows | 2788 | 5913 | −3125 | 5178 | 10,982 | −5804 |
| Salt Marsh | 22,471 | 35,513 | 11,041 | 22,957 | 34,238 | 11,280 |
| Sand Dunes | 0 | 772 | −772 | 0 | 682 | −682 |
| Wooded Swamp | 87,788 | 86,688 | 1302 | 103,927 | 102,65 | 1100 |
| Shrub Swamp | 11,437 | 44,778 | −33,341 | 12,918 | 50,576 | −37,658 |
| Cover Name | 2010 | 2020 | ||||
|---|---|---|---|---|---|---|
| Emissions (tCO2e) | Removals (tCO2e) | Flux (tCO2e) | Emissions (tCO2e) | Removals (tCO2e) | Flux (tCO2e) | |
| Grass | 580,147 | 913,857 | −333,728 | 602,217 | 948,642 | −346,424 |
| Shrubs | 10,367 | 12,080 | −1712 | 9665 | 11,262 | −1596 |
Disclaimer/Publisher’s Note: The statements, opinions and data contained in all publications are solely those of the individual author(s) and contributor(s) and not of MDPI and/or the editor(s). MDPI and/or the editor(s) disclaim responsibility for any injury to people or property resulting from any ideas, methods, instructions or products referred to in the content. |
© 2024 by the authors. Licensee MDPI, Basel, Switzerland. This article is an open access article distributed under the terms and conditions of the Creative Commons Attribution (CC BY) license (https://creativecommons.org/licenses/by/4.0/).
Share and Cite
Basheer, S.; Wang, X.; Van Dau, Q.; Awais, M.; Kinay, P.; Pang, T.; Mahmood, M.Q. Quantification of Carbon Flux Patterns in Ecosystems: A Case Study of Prince Edward Island. Land 2024, 13, 1692. https://doi.org/10.3390/land13101692
Basheer S, Wang X, Van Dau Q, Awais M, Kinay P, Pang T, Mahmood MQ. Quantification of Carbon Flux Patterns in Ecosystems: A Case Study of Prince Edward Island. Land. 2024; 13(10):1692. https://doi.org/10.3390/land13101692
Chicago/Turabian StyleBasheer, Sana, Xiuquan Wang, Quan Van Dau, Muhammad Awais, Pelin Kinay, Tianze Pang, and Muhammad Qasim Mahmood. 2024. "Quantification of Carbon Flux Patterns in Ecosystems: A Case Study of Prince Edward Island" Land 13, no. 10: 1692. https://doi.org/10.3390/land13101692
APA StyleBasheer, S., Wang, X., Van Dau, Q., Awais, M., Kinay, P., Pang, T., & Mahmood, M. Q. (2024). Quantification of Carbon Flux Patterns in Ecosystems: A Case Study of Prince Edward Island. Land, 13(10), 1692. https://doi.org/10.3390/land13101692