Abstract
In the context of the coordinated development of Beijing–Tianjin–Hebei, examining the spatial connections and network structure characteristics of the tourism economy holds substantial theoretical and practical significance. This study constructs a tourism economic quality evaluation index system from four dimensions and optimizes the tourism economic gravity model by incorporating time distance and weight factors to dynamically simulate the intensity of tourism economic spatial connection (ITESC). Based on the new perspective of relational data, social network analysis is employed to investigate the spatial correlation network characteristics and group structure changes in the tourism economy within the Beijing–Tianjin–Hebei urban agglomeration (BTHUA). The results demonstrate a significant improvement in overall tourism economic quality from 2013 to 2022, with the average quality increasing from 0.128 in 2013 to 0.157 in 2022. Tourism economic spatial connections are prevalent among cities, exhibiting heterogeneous characteristics, characterized by density in the north and relatively sparse in the south. The network cohesion of ITESC strengthens, and the network structure evolves from a highly centralized to a multi-centralized configuration, with increasingly frequent cooperation and interaction in tourism between cities. Beijing, Tianjin, and Shijiazhuang occupy central positions in the network, exhibiting strong ITESC and a high degree of connectivity, generating a significant “trickle-down effect” on peripheral cities. Consequently, strengthening ITESC between peripheral cities and core areas, as well as enhancing the bidirectional spillover of tourism development between cities, is crucial for the future sustainable and coordinated development of tourism in the BTHUA.
1. Introduction
In recent years, with the continuous development of the tertiary industry, the tourism industry has experienced accelerated growth. Especially after the COVID-19 pandemic, the global tourism market has gradually recovered and expanded. The tourism industry has become a driving force for socio-economic progress and economic recovery in many developing countries [1,2,3]. In China, the tourism industry is regarded as a crucial industry for driving regional economic growth, deepening supply-side structural reforms, and improving residents’ livelihoods [4,5,6]. At the same time, the tourism industry is a key pillar for advancing the goals of the United Nations 2030 Agenda for Sustainable Development and serves as a tool for promoting sustainable and inclusive economic growth in urban areas. Therefore, in the wave of globalization and regional economic integration, the tourism industry’s role in economic growth, cultural exchange, and integration has made its spatial connections and coordinated development mechanisms a focal point in academic research.
Tourism inherently exhibits mobility. The tourism flow that converges between cities not only facilitates the exchange of tourism resources among cities and breaks the isolated development within urban agglomerations but also influences the spatial structural evolution of these agglomerations [7,8]. Moreover, it offers a novel path for promoting the integrated development of urban agglomerations. Tourism economic connections (TEC) are formed with the emergence of inter-city tourism flows, serving as the primary manifestation of tourism flows in the transmission of resources and information between cities. It reflects the spatial structure of urban agglomerations and plays a crucial role in the evolution and development of regional structures [9]. Additionally, the spatial network structure of TEC within urban agglomerations reflects the connections between various urban tourist destinations [10,11], which is critically important for the coordinated development of the tourism industry within urban agglomerations. However, the current understanding and research on the measurement and spatial network structure of TEC in tourist destinations remains limited, lacking systematic quantitative analysis, particularly within urban agglomerations. This limitation may hinder efforts to establish a robust and efficient tourism economic network in the post-pandemic era and to effectively plan recovery and development strategies for the tourism industry.
In the early stages, scholars examined the economic connections between tourism destinations from a supply and demand perspective. Research has primarily focused on environmental governance collaboration networks [12], tourism marketing networks [13], the correlation between tourism flows and attractions [14], and the heterogeneity of tourists’ travel attributes [15]. Some scholars argue that the development of the tourism economy results in spillover and radiation effects within the urban spatial network structure [16]. In recent years, research on TEC has concentrated on the geospatial perspective at the regional level, transitioning from a static single-time scale to a dynamic analysis of the connection process. Simultaneously, studies on the impact of railways on the urban tourism economy, the network structural characteristics of TEC, and the driving mechanisms have become research hotspots [17,18]. Furthermore, TEC measurement typically employs the gravity model, the modified gravity model, and the Moran index [19,20,21]. Notably, the combination of the modified gravity model and social network analysis (SNA) has been increasingly applied to the study of tourism spatial structures. This method enhances the scientific rigor and accuracy of measurement results, serving as an exemplary paradigm for studying tourism spatial structures [22]. Employing the SNA method to analyze the spatial structure of TEC offers insights into the degree of agglomeration and diffusion from a new perspective and clarifies the role and status of each node within the overall network structure. However, most existing studies focus on the distribution of tourism resources, the development of tourism markets, and the tourism competitiveness of a single city, lacking systematic research on the tourism economy of urban agglomerations. Furthermore, most existing studies rely on qualitative analysis methods, lacking quantitative measurement and empirical analysis of regional TEC, which makes it difficult to accurately assess its actual effects and development trends.
The Beijing–Tianjin–Hebei urban agglomeration (BTHUA) serves as a crucial engine of China’s northern economy and is abundant in tourism resources. The spatial network structure of its tourism economy is not only related to the economic interaction and coordinated development among cities within the region but also holds significant importance for the layout optimization and strategic upgrading of the national tourism industry [23,24]. In 2018, the State Council mandated the adjustment of regional economic and spatial structures to promote the coordinated development of Beijing–Tianjin–Hebei [25]. Although tourism economic cooperation in the BTHUA has gradually strengthened over the past few decades, imbalanced development within the urban agglomeration persists, and interactions within the tourism economy between cities remain limited. Therefore, an in-depth exploration of the TEC and its spatial network structure from a social network perspective is crucial for revealing the underlying operational dynamics of the tourism economy in BTHUA and fostering the sustainable and coordinated development of the regional tourism industry.
In light of these considerations, this study aims to systematically and comprehensively reveal the internal connections and evolutionary characteristics of the spatial network structure of TEC in the BTHUA through quantitative measurement and spatial analysis. To achieve this, we construct a comprehensive indicator system for tourism economic quality (TEQ), considering the scale, performance, transportation conditions, and environmental resources of the tourism economy. The tourism economic gravity model is optimized using time distance and weight factors, and a TEC matrix is constructed to facilitate the dynamic evolution analysis of the intensity of tourism economic spatial connections (ITESC). Based on this framework, the structural characteristics of the TEC spatial network are empirically examined using social network analysis methods. The results contribute to a deeper understanding of the positioning and role of each city in the tourism economy, thereby providing a scientific basis and theoretical support for the coordinated development of the tourism economy in the BTHUA.
2. Materials and Methods
2.1. Study Area
The BTHUA is the largest and most economically dynamic region in northern China, covering an area of 216,000 km2 [26]. It is situated in northern China, bordered by the Bohai Sea to the east and the North China Plain to the west. The terrain is generally characterized by elevated in the northwest and lower in the southeast. The BTHUA comprises two municipalities, Beijing and Tianjin, along with 11 cities in Hebei Province: Shijiazhuang, Tangshan, Qinhuangdao, Handan, Xingtai, Baoding, Zhangjiakou, Chengde, Cangzhou, Langfang, and Hengshui (Figure 1). In 2023, the gross domestic product (GDP) of the BTHUA reached 10.4 trillion yuan, representing 8.3% of China’s total GDP and significantly contributing to the nation’s economic development. The coordinated development of the BTHUA is a critical national strategy essential for leveraging the complementary advantages of the region and facilitating the development of the northern hinterland. Additionally, the region features a diverse array of tourist attractions, including the Palace Museum, Baiyangdian, the Great Wall, and the Grand Canal, as well as other natural, cultural, and historical sites. As of July 2024, the region boasts 23 national AAAAA (5A) tourist attractions, 3 national tourist resorts, and 97 five-star hotels.
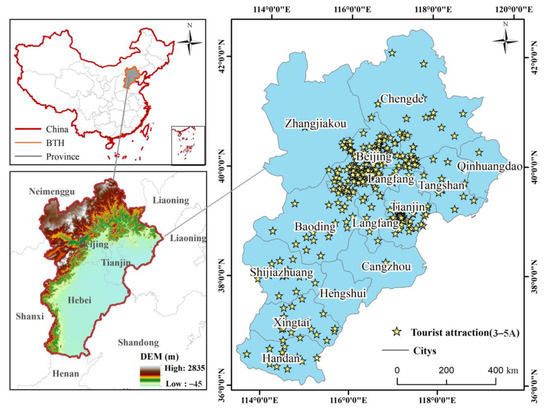
Figure 1.
Study region. Overview of the geolocation, DEM, and tourist attractions of Beijing–Tianjin–Hebei urban agglomeration (BTHUA). There are 13 cities in BTHUA, including 2 municipalities (Beijing and Tianjin) and 11 cities of Hebei Province (Shijiazhuang, Tangshan, Qinhuangdao, Handan, Xingtai, Baoding, Zhangjiakou, Chengde, Cangzhou, Langfang, and Hengshui).
2.2. Data Source and Processing
The statistical data are primarily sourced from the China Statistical Yearbook, China Culture and Tourism Yearbook, China City Statistical Yearbook, various Statistical Yearbooks of cities within the BTHUA, and the Statistical Bulletin on National Economic and Social Development, and are calculated based on these sources. Missing data points are supplemented using linear interpolation [27]. In addition, the attractions list data are obtained from the official website of the Ministry of Culture and Tourism of China (https://www.mct.gov.cn/ (accessed on 26 April 2024)).
Travel times for high-speed rail and railway transportation are primarily obtained from the official China Railway 12306 website (https://www.12306.cn/index/ (accessed on 26 April 2024)). Travel times for highway transportation are sourced from professional mapping websites and software, including Amap (V15.01) and Baidu (V20.8) Maps. For high-speed rail transportation, trains with G, D, and C prefixes are used as research samples. The shortest travel time before the introduction of high-speed rail is represented by the average running time of trains not beginning with G, D, or C, while the average running time of G, D, and C trains denotes the shortest travel time following the implementation of high-speed rail. For data that could not be queried, the driving time provided by Amap is used as the estimate for the shortest travel time prior to the introduction of high-speed rail. Additionally, road spatial distribution data for multiple periods (2013, 2018, 2022) are obtained from the Resource and Environmental Science and Data Center of the Chinese Academy of Sciences (https://www.resdc.cn/data.aspx?DATAID=237 (accessed on 10 May 2024)). Road mileage for each city is calculated and quantified using the Identity tool in ArcGIS 10.8.
Administrative boundaries, Normalized Difference Vegetation Index (NDVI), nighttime light, and land use/land cover (LULC) datasets are downloaded from the Resource and Environmental Science and Data Center of the Chinese Academy of Sciences. Nighttime light data can be used as a representation of human activities, which encompass traffic networks, residential areas, and other information closely linked to population distribution, urbanization, and related factors. Relevant studies have demonstrated that a positive correlation exists between nighttime light intensity and socio-economic factors, and this quantitative relationship is widely utilized in the estimation of socio-economic parameters [28,29]. Vegetation coverage for the study area across different years is calculated using the NDVI dataset and a pixel dichotomy model [30]. The LULC data are used to extract the per capita green space area for each city. Given the availability of data and the need to assess the impact of public health emergencies, this study sets the time spans of the research indicators to 2013, 2018, and 2023.
2.3. Methods
Figure 2 illustrates the empirical research flowchart for the spatial network structure of TEC in this study. First, using remote sensing data, tourism economic statistics, and traffic big data, a comprehensive evaluation index system for TEQ is developed to analyze the spatiotemporal distribution of TEQ in the BTHUA. Second, the tourism economic gravity model is refined using time distance and weight factors to investigate the spatiotemporal evolution characteristics of the ITESC and its spatial correlation network. Third, the SNA method is employed to comprehensively assess the coordinated development capacity of the TEC within the BTHUA. This analysis reveals the role and positioning of each city within the urban agglomeration, the linkage differences between cities, and the evolution characteristics of their cohesive subgroups.
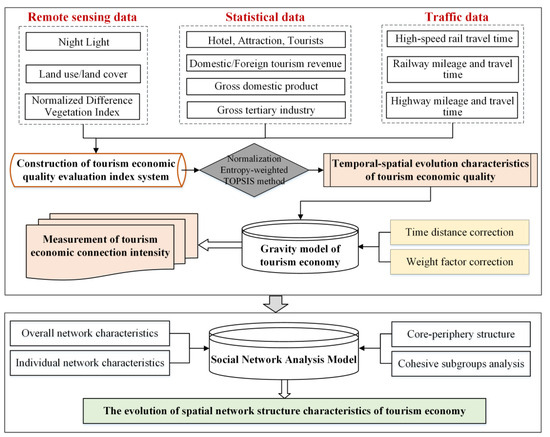
Figure 2.
Flowchart of the spatial network structure optimization for the tourism economy.
2.3.1. Measurement of Tourism Economic Connection
- Tourism economic gravity model
The gravity model in economic geography is derived from the Newtonian universal gravitation model in classical mechanics. Scholars have proposed various assumptions about the model based on the differences and particularities of the research problems, thereby gradually developing a comprehensive economic gravity theory system [31,32]. From a spatial structure perspective, the gravity model measures socio-economic connections between regions and has been successfully applied to diverse scenarios, including tourism, carbon emissions, and international trade [1,33]. Notably, the intensity of spatial connections between regions is proportional to their quality and inversely proportional to distance. The tourism economic gravity model is similar to the gravity model, where the ITESC between two tourist destinations is proportional to their TEQ and adheres to the law of distance attenuation [27]. Employing the tourism economic gravity model to construct a spatial connection matrix is crucial for analyzing the spatial network structure of the tourism economy. Additionally, the model can analyze the radiative influence of core areas on neighboring regions, reveal the spatial distribution characteristics of this influence, and enhance the understanding of interdependence and influence mechanisms between regions.
As transportation infrastructure improves and travel modes diversify, geographical and transportation distances no longer intuitively or accurately reflect regional proximity, particularly in areas with high transportation accessibility [10,34]. Furthermore, considering the directionality and complexity of spatial connections in the tourism economy between cities, this paper modifies the weight and distance factors of the gravity model, building on the research of Gan et al. [1] and Shen et al. [33]. Specifically, time distance replaces traditional spatial distance, and the weight factor is optimized using the TEQ for each city pair. The formula for the modified tourism economic gravity model is as follows:
where ITESCij is the intensity of tourism economic spatial connection between city i and city j. TEQi and TEQj represent the tourism economic quality of city i and city j, respectively. kij is the modified weight factor of the tourism economy from city i to city j. Dij represents the time distance between city i and city j, and b represents the distance decay coefficient, which is usually assigned a value of 2. Hij, Rij, and Gij are the minimum travel times for highways, railways, and high-speed rails between the two cities, respectively. n denotes the number of transportation modes between two cities. Finally, the tourism economic spatial connection matrix is established through the tourism economic gravity model modified by time distance and weight factor.
where ITESCi represents the intensity of tourism economic spatial connection between city i and the other 12 cities. In order to perform data analysis more effectively in the University of California at Irvine Network (UCINET) software (V6.661), we use the mean of each column of the tourism economic spatial connection matrix as the threshold to binarize the matrix [35]. Specifically, if the value between a certain pair of cities is greater than the mean value of the column, it is assigned to 1, which symbolizes that the tourism economic development between the cities is closely connected. On the contrary, it is assigned a value of 0, indicating that the tourism economic development between the corresponding cities has a weak interaction or no direct connection.
- 2.
- Tourism economic quality evaluation
TEQ is a complex and multidimensional system encompassing various components, each exhibiting distinct heterogeneity and diversity [1,36]. TEQ encompasses not only the scale and growth rate of the tourism economy but also emphasizes the sustainability of tourism economic development and its broader impacts on society, transportation, and the environment [37,38]. Addressing these broader impacts on the quality of the tourism economy requires the joint efforts of the government, enterprises, and the public, including the promotion of cultural exchanges and understanding, the development of convenient transportation networks, the opening of new tourist routes, and the advancement of ecotourism. Moreover, by formulating scientific and reasonable policies and strengthening supervision and evaluation, we can better achieve sustainable tourism development and benefit society. Therefore, the selection of TEQ evaluation indicators includes not only the scale and performance of the tourism economy but also aspects such as the growth of TEQ, including tourism environmental resources and transportation conditions. This approach aims to comprehensively reveal the intrinsic nature and development patterns of TEQ. In alignment with the principles of quantifiability, comparability, and availability of indicators, we construct a comprehensive TEQ indicator system encompassing four dimensions (Table 1).

Table 1.
Comprehensive evaluation index system of the tourism economic quality.
The tourism economy scale represents the “quantity” of tourism economic development and reflects the overall level of urban tourism development. It is a critical indicator for assessing the development degree and potential of the tourism industry [39]. The indicators selected in this study include the number of domestic tourists, the number of foreign tourists, the total star-rated hotels, and nighttime light brightness.
Tourism economic performance measures the efficiency and effectiveness of tourism economic activities and reflects the contribution of tourism to economic and social development [40]. These include domestic tourism revenue, foreign tourism revenue, and the percentage of total tourism revenue in GDP.
Transportation condition is a crucial infrastructure for the development of the tourism economy. Effective transportation can expand the tourism market, enhance the tourism experience, and promote the development of the tourism economy [10]. Given the relatively short distances between cities in the BTHUA, the primary modes of transportation for tourists are railways and highways. Thus, this study selects the network coverage of railway and highway transportation as specific indicators for evaluating transportation conditions.
Resources and environmental conditions are fundamental to tourism development, encompassing natural and cultural resources. A favorable resource environment can attract tourists and enhance the attractiveness and competitiveness of tourism products. The specific indicators selected in this study include per capita green space area, vegetation coverage, and the number of tourist attractions rated from 3A to 5A. Obviously, these indicators positively influence the development of the tourism economy, meaning that higher values are associated with better development of urban tourism.
- 3.
- Assessment weight
To minimize the impact of subjective judgment on indicator weighting and to better characterize the comprehensive impact of multiple influencing factors, this study employs the Entropy Weight Technique for Order Preference by Similarity to an Ideal Solution (EW-TOPSIS) model with time variables. This approach enables a comprehensive evaluation and comparison of the TEQ of the BTHUA [41,42]. The EW method is a technique for determining weights based on the principle of information entropy. It mainly uses the concept of information entropy to measure the degree of discreteness of the indicator, thereby reflecting the importance of the indicator [43]. Specifically, lower information entropy indicates greater variability of the indicator, richer information content, and consequently, a higher weight assigned to that indicator [44]. Once the weights of the indicators are determined using the EW method, the TOPSIS method is applied to rank the evaluation objects systematically. The calculation steps of the EW-TOPSIS method are as follows:
Step 1. Data standardization processing.
Since the TEQ evaluation indicators have different dimensions and properties, they cannot be directly compared [45]. To ensure the reliability and effectiveness of the evaluation results, this study adopts the range standard method to perform dimensionless processing on the original indicator data. As mentioned above, the evaluation indicators in this paper are all positive indicators, and the calculation formula is as follows:
where Xhij’ is the dimensionless value after standardization. Xhij is the j-th indicator value of city i in year h; Xmin and Xmax are the minimum and maximum values of the j-th indicator, respectively.
Step 2. Determine the weight of each indicator (EW method).
where Phij’ is the proportion of the j-th index value of city i in year h, and m is the number of city samples.
where Ej represents the information entropy of the j-th indicator, ranging from 0 to 1. k = 3, which is the total number of years. Dj represents the information utility value. The larger the value, the smaller the entropy and the greater the weight. wj represents the weight of the j-th indicator.
Step 3. Sort the evaluation objects (TOPSIS method).
The TOPSIS is a method commonly used in comprehensive evaluation and decision analysis [46]. It determines the relative order of each object by comparing the distance between each evaluation object and the positive and negative ideal solutions. This method can make full use of the original data information and accurately reflect the differences between different evaluation schemes. Due to its simplicity and efficiency, the TOPSIS method is widely used in resource evaluation, transportation planning, and production economics [47,48]. This paper conducts EW-TOPSIS method analysis based on the SPSSAU platform.
2.3.2. Social Network Analysis
The SNA model is employed to reveal the network’s integrity and hierarchy by analyzing network nodes and their interrelationships. It has been widely applied in various disciplines, including economics, management, and geography [27,49,50,51]. In this study, the 13 cities in the BTHUA are treated as nodes within the network structure. Using the binary matrix of the spatial correlation intensity of the tourism economy between cities (i.e., the connecting lines in the network), the entire correlation network is constructed to assess the tourism economy correlations between different cities. To understand the overall and individual structures of the tourism economy spatial correlation network, cohesive subgroup and core–periphery structure analyses are conducted to investigate the spatial correlation pattern and its changes, identifying the role and interaction model of each city. The SNA model and related indicators in this study are processed using UCINET software [52]. Network density, connectedness, hierarchy, and efficiency are used to measure the overall network structure characteristics of the BTHUA, while degree centrality and closeness centrality measure individual network structure characteristics. The calculation formulas and characteristics of each index are presented in Table 2.
Table 2.
Indicators and characteristics of the spatial correlation network of tourism economy in Beijing–Tianjin–Hebei urban agglomeration.
A cohesive subgroup is a subset of members characterized by relatively strong, direct, and positive relationships [53]. In an urban agglomeration network structure, it manifests as a subset or small group formed in space by interconnected cities with balanced development. Cohesive subgroup analysis in the urban agglomeration network reflects the number of cohesive subgroups and the cities involved, thereby presenting the basic state of the internal substructure of the network [54]. This approach allows for understanding the evolutionary characteristics of spatial clustering in urban agglomeration development and identifying factors influencing cooperation and mutual assistance among smaller urban groups. In this study, the convergent correlations (CONCOR) method within SNA is utilized to analyze the cohesive subgroups of the tourism economy spatial association network.
The core–periphery structure is a specific arrangement of interconnected elements featuring a closely connected center and a sparsely dispersed periphery [55]. By measuring the core degree of cities, they are categorized into two types—core area cities and peripheral area cities—to determine each city’s position in the urban agglomeration network. Core area cities have a strong capacity to attract various elements from peripheral cities, and they maintain close interconnections. They represent the highland of regional economic development and hold an active position, whereas peripheral cities are heavily dependent on core cities with weak intercity connections, placing them in a passive position [56]. This study employs the “core/periphery” module of UCINET software for measurement and analysis.
3. Results
3.1. Comprehensive Coefficient of Tourism Economic Quality
Based on the constructed comprehensive TEQ evaluation index system, this study evaluates the TEQ of 13 cities in the BTHUA. Figure 3 illustrates the spatiotemporal distribution of the proportion of total tourism revenue in GDP and the TEQ in each city. The proportion of total tourism revenue in GDP increased significantly in most cities from 2013 to 2018 (Figure 3a,b), particularly in Shijiazhuang, Handan, and Xingtai. Conversely, the proportion of tourism revenue in GDP decreased significantly in all cities from 2018 to 2022 (Figure 3b,c), indicating a relative contraction in the tourism industry during this period. This decline was mainly influenced by the negative impact of the COVID-19 pandemic. Additionally, these proportions in Beijing and Tianjin dropped from 18.75% and 24.45% in 2013 to 6.06% and 4.89% in 2022, respectively, indicating that although the TEQ in both cities remained high, its share in the overall economy has shrunk. The proportion of total tourism revenue in GDP for Zhangjiakou and Chengde peaked in 2018, reaching 66.86% and 71.20%, respectively. Although these proportions declined in 2022, they remained relatively high.
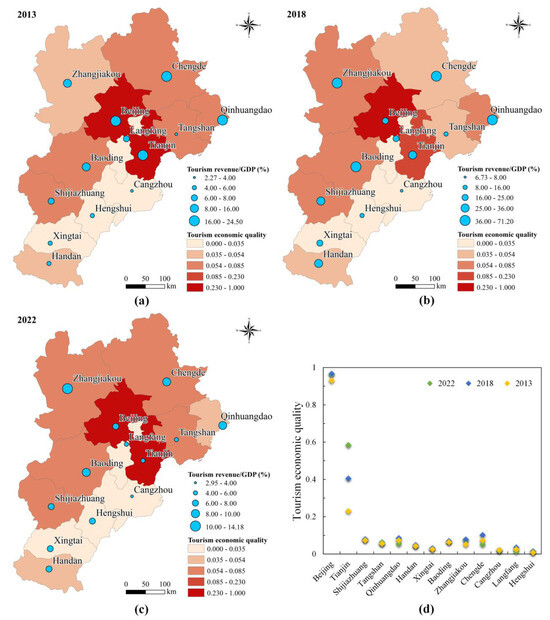
Figure 3.
Spatial distribution of tourism economic quality and the proportion of total tourism revenue in GDP in BTH for 2013 (a), 2018 (b), and 2022 (c), and the scatter diagram of tourism economic quality of 13 cities in BTH (d).
From the spatial distribution of TEQ, there is a trend of decreasing radiation toward the surrounding areas centered on Beijing and Tianjin (Figure 3a–c). From 2013 to 2022, the overall TEQ of the BTHUA improved annually, with the average TEQ rising from 0.128 in 2013 to 0.152 in 2018 and further to 0.157 in 2022. The TEQ of Beijing and Tianjin is significantly higher than that of other cities, attributed to their rich historical and cultural resources, as well as their considerable urban scale and development strength. The TEQ of Shijiazhuang increased slightly, with its ranking rising from 4th in 2013 to 3rd in 2022 (Figure 3d). Zhangjiakou’s TEQ improved significantly, ranking 4th in 2022 due to the positive impact of the 2022 Winter Olympics. Notably, Qinhuangdao and Chengde ranked high in 2018 due to their natural scenery and historical attractions, but both experienced significant declines in 2022.
Overall, the TEQ in each city improved annually, although regional differences and uneven development persist. As the centers of the tourism economy in the BTHUA, Beijing and Tianjin have maintained a strong growth trend in TEQ. Cities like Zhangjiakou and Shijiazhuang show great potential for development, whereas Qinhuangdao and Langfang need to overcome challenges to enhance their tourism appeal.
3.2. The Intensity of Tourism Economic Spatial Connections
The modified tourism economic gravity model was employed to calculate the ITESC within the BTHUA. ArcGIS 10.8 was used to generate spatial connection strength maps for cities in 2013, 2018, and 2022 (Figure 4). To enable comparison across different years, this study categorizes the ITESC of urban agglomerations into six levels based on the natural breakpoint method. Overall, tourism economic spatial connections among cities in the BTHUA are widespread and are becoming increasingly intimate. Specifically, the radiation effect centered around Beijing has significantly intensified (Figure 4a–c). Furthermore, tourism economic connections between adjacent cities are more pronounced, in accordance with the distance decay hypothesis.
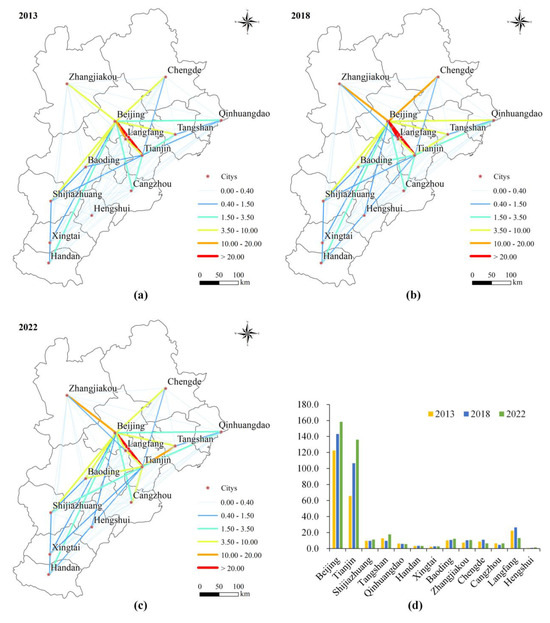
Figure 4.
Intensity of tourism economic connection in BTH for 2013 (a), 2018 (b), and 2022 (c), and the total intensity of tourism economic connection of 13 cities in BTH (d).
From 2013 to 2018, the distribution of tourism economic connections was relatively concentrated, primarily around Beijing, Tianjin, and Langfang. As the capital, Beijing’s ITESC with surrounding cities increased, and its regional scope expanded. In 2018, the ITESC between Beijing and Tianjin, Langfang, Zhangjiakou, and Chengde was greater than 10. The ITESC between Tianjin and surrounding cities (such as Tangshan, Qinhuangdao, and Baoding) also increased. Furthermore, the number of cities with an ITESC higher than 0.4 rose from 23 in 2013 to 26 in 2018. From 2018 to 2022, a balanced development trend emerged within the BTHUA, and the tourism economic connection network became increasingly complex and dense. The radiation effects of Tianjin and Shijiazhuang intensified, and the ITESC with Baoding, Cangzhou, Tangshan, and Xingtai increased.
Regarding the total ITESC, Beijing and Tianjin held a dominant position in the BTHUA. Their total ITESCs were significantly higher than those of other cities and experienced the fastest growth, rising from 122.473 and 65.628 in 2013 to 158.365 and 135.99 in 2022, respectively (Figure 4d). Furthermore, from 2013 to 2022, Shijiazhuang, Baoding, Zhangjiakou, and Hengshui demonstrated a steady growth trend. The total ITESCs for Handan and Xingtai remained relatively stable during the study period, showing a slight increase. Notably, the total ITESCs of Langfang and Chengde dropped sharply in 2022 after peaking in 2018 (26.422 and 10.918, respectively), exhibiting significant fluctuations.
In summary, as the capital city, Beijing’s role as a tourism center continues to strengthen, and its tourism economic radiation effect on surrounding cities is expanding. As significant tourism hubs, Tianjin and Shijiazhuang have progressively enhanced their tourism economic radiation capabilities and established stronger connections with other cities. The overall tourism economic connection network within the BTHUA is becoming increasingly dense, suggesting that the regional integration of tourism resources is progressing. However, the ITESC in Xingtai, Hengshui, and Handan remains suboptimal, and the coordinated and balanced development of the BTHUA continues to encounter challenges.
3.3. SNA of Tourism Economic Spatial Correlation in BTHUA
3.3.1. The Overall Network Characteristics
The overall network characteristics of the tourism economy in the BTHUA were analyzed using UCINET software, with specific indicators illustrated in Figure 5. From 2013 to 2022, it was observed that the network density and the number of relationships initially decreased and then increased, with the overall network structure remaining relatively loose (Figure 5a). In 2013, the network density was 0.179, with only 28 network relationships. In 2018, both network density and the number of relationships decreased slightly, likely influenced by the national tourism development policy. During this period, the development of the tourism industry focused on enhancing quality and efficiency while maintaining momentum, emphasizing the improvement of tourism economy quality [57]. In 2022, network density and the number of network relationships increased to 0.192 and 30, respectively, but the number of relationships remained significantly below the theoretical maximum of 870. This indicates that although the ITESC within the BTHUA is strengthening, there remains substantial potential for enhancing inter-city tourism economic cooperation.
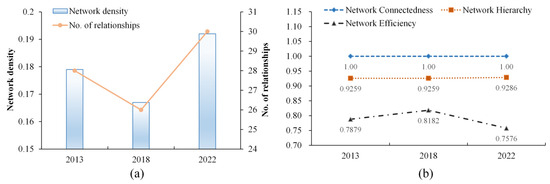
Figure 5.
The overall network structure characteristics of the tourism economy in BTH urban agglomeration. (a) The network density and the number of relationships (No. of relationships) of the city-level tourism economy in BTH for 2013, 2018, and 2022. (b) Network connectedness, network hierarchy, and network efficiency of the city-level tourism economy in BTH for 2013, 2018, and 2022.
Further exploration of the tourism economic network characteristics in the BTHUA encompasses network connectedness, network hierarchy, and network efficiency (Figure 5b). Throughout the observation period, the network connectedness of the study area was high, with a value of 1, indicating a general spatial correlation and spillover effect among the tourism economies of various cities. The network hierarchy stabilized at 0.9259 in 2013 and 2018, remaining at a high level. The slight increase in 2022 indicates a further strengthening of the dominant position of core cities such as Beijing and Tianjin within the network. Network efficiency initially increased and then decreased but generally remained above 0.75. This indicates that as the number of inter-city connections grew, the tourism economic network became more complex, exhibiting some instability.
3.3.2. The Individual Network Characteristics
To enable horizontal and vertical comparisons of the status and strength of each city within the tourism economic network, this study calculates and analyzes the evolution of individual network structure indicators (Table 3). Beijing and Tianjin, as primate cities, exhibit out-degrees significantly greater than their in-degrees, indicating that their spatial spillover effects are much stronger than their siphon effects on surrounding cities. Shijiazhuang’s out-degree is slightly higher than its in-degree. Consequently, as core growth poles in the BTHUA, Beijing and Tianjin drive Shijiazhuang to share in the tourism economic radiation effects across surrounding cities. With the exception of Handan and Xingtai, which have out-degrees of 1, the remaining cities have out-degrees of 0. This indicates a low level of tourism economic development, resulting in minimal influence on other cities and weak spillover effects from core cities.
Table 3.
The individual network characteristics of the city-level tourism economy in BTH for 2013, 2018, and 2022.
From 2013 to 2022, the mean degree centrality in the BTHUA increased from 33.33 to 35.9. The top-ranked cities—Beijing, Tianjin, Shijiazhuang, Handan, and Xingtai—demonstrate significant tourism economic connections and synergistic effects with neighboring cities. Beijing, Tianjin, and Shijiazhuang consistently ranked among the top three. By 2022, Beijing and Tianjin both had a degree centrality of 100, signifying their connection with every city in the BTHUA and establishing them in a core leadership position.
Closeness centrality remained generally stable in 2013 and 2018. Beijing and Tianjin exhibited high closeness centrality, with values of 1.00 and 0.92 in 2013 and 1.00 and 0.80 in 2018, respectively. The closeness centrality for other cities, including both in-closeness and out-closeness centrality, ranged between 0.33 and 0.43, with minimal regional variations. In 2022, there was a significant increase in the closeness centrality of each city, with mean values of out-closeness centrality and in-closeness centrality rising to 0.59 and 0.55, respectively. Moreover, the closeness centrality distribution across the 13 cities is relatively balanced, with all values reaching 0.5 or higher, indicating that establishing tourism economic connections among cities in the BTHUA is relatively straightforward.
3.3.3. Cohesive Subgroup Analysis
To reveal changes in the group structure of each city over time, this study employs the convergent correlation (Conor) method to identify cohesive subgroups within the tourism economic network of the BTHUA. The maximum segmentation depth and convergence criteria were set to 2 and 0.2, respectively [27,58]. Figure 6 illustrates the classification results. Between 2013 and 2022, the cohesive subgroup structure of the BTHUA tourism economic network underwent significant changes. Network cohesion increased, with the structure evolving from a highly centralized model to a more multi-centered one, which should foster coordinated development within the BTHUA. From a spatial distribution perspective, cities within the same subgroup generally adhered to the principle of geographical proximity. This is primarily due to the accessibility of transportation between neighboring cities and the similarity in tourism economic development models, which facilitate more frequent cooperation and interaction between cities.
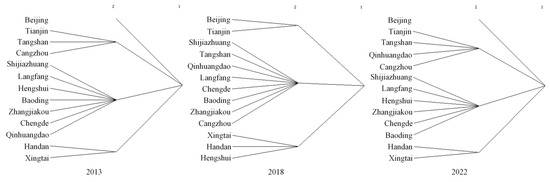
Figure 6.
Cohesive subgroup distribution of Beijing–Tianjin–Hebei urban agglomeration for 2013, 2018, and 2022.
In 2013, the 13 cities were categorized into four plates, with Beijing and Tianjin forming two core plates (Plate 1 and Plate 2). Plate 3, the largest group centered around Shijiazhuang, included Langfang, Hengshui, Baoding, Zhangjiakou, Chengde, and Qinhuangdao. Plate 4 is small in scale, consists of only two cities—Handan and Xingtai—and has relatively loose connections with the core subgroups. By 2018, the tourism economic network structure had flattened and was divided into three plates, with Beijing and Tianjin forming a clear core subgroup. Tangshan and Cangzhou’s tourism economic relationships shifted, separating from their original plate to join the one centered on Shijiazhuang.
By 2022, the overall tourism economic correlation within the network had increased further, and the group structure became more centralized. In 2013, Beijing was not classified at the second level, indicating that it has continued to enhance its tourism economic radiation on surrounding cities through its strong tourism resources. The plates containing Qinhuangdao, Tangshan, and Hengshui were reorganized. Additionally, Handan and Xingtai continue to exhibit relatively independent group structures, suggesting weak connections in tourism economic activities with other cities. This also reflects the ongoing issue of unbalanced development within the BTHUA.
3.3.4. Analysis of the Core–Periphery Structure
Core–periphery structure analysis reveals core and peripheral nodes within the tourism economic network. Therefore, this study utilizes the UCINET software tool to analyze the core–peripheral structure of the BTHUA tourism economy. The density display results reveal a gradual attenuation trend in core–core, core–periphery, and periphery–periphery densities (Table 4), indicating significant hierarchical structure characteristics within the tourism economic network of the BTHUA.
Table 4.
Core–periphery density matrix of tourism economy and city distribution in BTH for 2013, 2018, and 2022.
Between 2013 and 2022, connections among cities in the core area were the strongest, with densities of 0.667, 0.583, and 0.667, respectively. In contrast, densities in the peripheral area were 0.014, 0.000, and 0.028, respectively, indicating very weak connections among peripheral cities. The development and transformation of the tourism industry contributed to a reduction in these densities in 2018. Furthermore, the density between core and peripheral cities was 0.472, 0.500, and 0.500 in 2013, 2018, and 2022, respectively, demonstrating a clear “trickle-down effect” from core cities and a significant radiation-driven effect on peripheral cities. Overall, the core cities have maintained a relatively stable scale and number over the years. The core area consistently comprises Beijing, Tianjin, and Handan. Peripheral cities should focus on enhancing infrastructure, innovating tourism products, and boosting their attractiveness. Additionally, they should strengthen cross-regional tourism cooperation, facilitate interactions with core nodes, and expand their tourism flow scale.
4. Discussion
4.1. Optimization and Collaborative Development Path of the TEC’s Spatial Network Structure
Optimizing the spatial network structure of the TEC is essential for achieving high-quality tourism economy growth and regional coordinated development. This study develops a comprehensive evaluation framework for TEQ and utilizes a modified tourism economic gravity model along with SNA methods to investigate the ITESC and its spatiotemporal evolution within the BTHUA. This work not only enriches the research on the spatial network structure of the TEC but also provides a reliable reference for promoting high-quality, coordinated development in the BTHUA. Additionally, the methodology can be applied to various tourist destinations.
From 2013 to 2022, the TEC in the BTHUA exhibited a spatial network structure with Beijing as the center and Tianjin and Shijiazhuang as sub-centers. The TEQ values of Beijing and Tianjin consistently rank among the top two and remain at the core of the network, demonstrating their significant advantages in the regional tourism economy. The ITESC of Beijing and Tianjin has expanded rapidly, likely due to their continuously developing tourism infrastructure and supportive policies [59,60]. In contrast, other cities in Hebei Province, such as Shijiazhuang and Baoding, have not reached a level comparable to Beijing and Tianjin, despite improvements in their TEC. This reflects the current imbalance between tourism resource development and economic growth in the region. Notably, the TEC between adjacent cities, such as Beijing, Tianjin, and Langfang, is more closely connected, consistent with the law of distance attenuation [34]. Although Chengde and Qinhuangdao have high TEQ, their ITESCs are weak due to unfavorable transportation conditions, suggesting that improved transportation accessibility can actively promote ITESC.
From an overall network structure perspective, the TEC in the BTHUA is becoming increasingly interconnected. In 2022, both network density and the number of relationships reached their highest levels, indicating increased interaction frequency between cities in the region. However, network efficiency declined during this period. Despite the signing of the “Hebei Province Tourism High-Quality Development Plan” and the “Tianjin Tourism Promotion Regulations” [61,62], the overall network structure of the TEC remains relatively loose and exhibits a trend of instability. This may be because inter-city tourism economic cooperation is largely driven by government intervention and coordination rather than market mechanisms [1].
Regarding individual network characteristics, Beijing and Tianjin have consistently maintained a high degree of centrality and out-closeness centrality, demonstrating strong centrality. Shijiazhuang follows, ranking third. This structural feature aligns with the observed close TEC among Beijing, Tianjin, and Shijiazhuang. In the analysis of cohesive subgroups and core–periphery structures from 2013 to 2022, network cohesion in the BTHUA increased, with the number and composition of core–periphery cities remaining relatively stable and a clear internal hierarchy. However, the persistence of this core–periphery structure indicates that, although the TEC within the region has been strengthened, the uneven distribution of resources between core and peripheral cities remains the main constraint on regional coordinated development. Future efforts should focus on improving the TEQ of peripheral cities and enhancing the efficiency of tourism cooperation within the urban agglomeration to achieve more balanced and sustainable regional tourism economic development.
4.2. Recommendations
The results emphasize the core positions of Beijing and Tianjin as regional tourism economies and the significance of Shijiazhuang as a secondary center. This provides clear guidance for policy formulation; specifically, in future tourism economic planning, efforts should continue to strengthen the tourism infrastructure of these three cities and optimize the allocation of tourism resources to further consolidate their leading positions. For Chengde, Qinhuangdao, and other cities with rich tourism resources but unfavorable traffic conditions, the focus should be on improving transportation facilities, enhancing traffic accessibility, and accelerating the free flow of tourism economic factors such as talent, technology, and capital to strengthen their TEC with other cities.
The research reveals an imbalance in TEC within the BTHUA, particularly the uneven distribution of resources between core and peripheral cities. Therefore, strengthening tourism economic cooperation between core and peripheral areas is crucial for the coordinated development of regional tourism economies. This could include establishing tourism cooperation alliances, sharing tourism resources, jointly developing tourism routes, and overcoming administrative barriers. Establishing mechanisms for regional cooperation and resource sharing will enhance the bidirectional spillover of tourism development between cities, improving the TEQ in peripheral cities and promoting the coordinated development of tourism quality and efficiency.
In addition, this study points out that the growth of TEC is closely tied to tourism infrastructure and policy support. Therefore, promoting the upgrading of the tourism industry—such as developing smart tourism, enriching tourism products, holding regular tourism cooperation meetings, and signing tourism cooperation agreements—will enhance the tourism appeal of the BTHUA. At the same time, we should encourage and support cooperation and innovation among tourism enterprises to jointly develop new tourism markets and broaden the development space of the tourism economy.
4.3. Limitations and Future Work
Inevitably, this study has certain limitations that require further investigation. On the one hand, due to challenges and limitations in data collection at the prefecture level, there may be deviations in the selection of TEQ indicators. In the future, long-term continuous data should be employed to enhance the TEQ assessment indicator system, achieving a more accurate and comprehensive evaluation. Additionally, the TEC should incorporate multi-dimensional factors, including social, cultural, and environmental aspects, to thoroughly explore its spatial characteristics and network effects. On the other hand, while this study analyzes the ITESC and its network characteristics in the BTHUA, the influencing factors and driving mechanisms behind its complex network pattern remain unclear. Therefore, future research should investigate the key factors influencing the spatial network structure of the TEC and clarify the dynamic mechanisms governing intercity interactions.
5. Conclusions
Within the framework of social network theory, this study systematically simulates the dynamic evolution of the ITESC and its hierarchical network structure in the BTHUA from 2013 to 2022. This is achieved by constructing the TEQ evaluation index system, optimizing the tourism economic gravity model, and integrating network structure and core–periphery analyses. The results indicate that the TEQ of cities in the BTHUA has improved from 2013 to 2022, though regional disparities and uneven development persist. As centers of the tourism economy, Beijing and Tianjin have exhibited a strong growth trend in TEQ. The regional integration of tourism resources is progressing, and the tourism economic spatial connection network is becoming increasingly interconnected, particularly among neighboring cities.
Tourism development policies positively influence the coordinated development of regional tourism. From 2013 to 2022, network cohesion increased, and the network structure gradually evolved from highly centralized to multi-centralized. However, the overall network structure remains relatively loose, with a clear trend toward core–periphery polarization. This suggests that the uneven distribution of resources between core and peripheral cities remains the main constraint on regional coordinated development. Future development should prioritize improving the TEQ of peripheral cities, enhancing tourism cooperation efficiency, overcoming administrative barriers, and promoting two-way spillover effects in tourism development between cities to achieve more balanced and sustainable regional tourism economic growth.
Author Contributions
Conceptualization, X.Z. and X.H.; methodology, X.Z. and J.S.; formal analysis, visualization, data curation, writing—original draft, and funding acquisition, X.Z.; writing—review and editing, X.Z., Y.Z., and J.W.; supervision and project administration, X.H. and J.S. All authors have read and agreed to the published version of the manuscript.
Funding
This research was funded by the National Natural Science Foundation of China, grant number 42401357; the China Postdoctoral Science Foundation, grant number 2023M740159; the National Natural Science Foundation of China, grant number 72374017; and the Beijing Municipal Institutions, grant number BPHR202203055.
Data Availability Statement
Data are contained within the article.
Acknowledgments
We acknowledge the providers of all the data used in the study. And we would also like to thank the anonymous reviewers and editors.
Conflicts of Interest
The authors declare no conflicts of interest.
References
- Gan, C.; Voda, M.; Wang, K.; Chen, L.; Ye, J. Spatial network structure of the tourism economy in urban agglomeration: A social network analysis. J. Hosp. Tour. Manag. 2021, 47, 124–133. [Google Scholar] [CrossRef]
- Bao, J.; Chen, Y.; Ma, L. The process and mechanism of tourism resources evaluation:From technical evaluation to the social construction perspective. J. Nat. Resour. 2020, 35, 1556–1569. [Google Scholar] [CrossRef]
- Dogru, T.; Bulut, U. Is tourism an engine for economic recovery? Theory and empirical evidence. Tour. Manag. 2018, 67, 425–434. [Google Scholar] [CrossRef]
- Wang, J.; Huang, X.; Gong, Z.; Cao, K. Dynamic assessment of tourism carrying capacity and its impacts on tourism economic growth in urban tourism destinations in China. J. Destin. Mark. Manag. 2020, 15, 100383. [Google Scholar] [CrossRef]
- Li, S.; Liu, A.; Song, H. Does tourism support supply-side structural reform in China? Tour. Manag. 2019, 71, 305–314. [Google Scholar] [CrossRef]
- Xu, D.; Li, X.; Yan, S.; Cui, L.; Liu, X.; Zheng, Y. A Quantitative Model to Measure the Level of Culture and Tourism Integration Based on a Spatial Perspective: A Case Study of Beijing from 2000 to 2022. Sustainability 2024, 16, 4276. [Google Scholar] [CrossRef]
- Ding, C.; Gao, X.; Xie, Z. Analysing the differential impact of the COVID-19 pandemic on the resilience of the tourism economy: A case study of the Chengdu-Chongqing urban agglomeration in China. Int. J. Disaster Risk Reduct. 2024, 102, 104255. [Google Scholar] [CrossRef]
- Ruan, W.-Q.; Zhang, S.-N. Can tourism information flow enhance regional tourism economic linkages? J. Hosp. Tour. Manag. 2021, 49, 614–623. [Google Scholar] [CrossRef]
- Zhang, L.; Marzuki, A.; Liao, Z.; Zhao, K.; Huang, Z.; Chen, W. Spatial and temporal evolution of Guangdong tourism economic network structure from the perspective of social networks. Heliyon 2023, 9, e18570. [Google Scholar] [CrossRef]
- Zhang, P.; Zhao, Y.; Zhu, X.; Cai, Z.; Xu, J.; Shi, S. Spatial structure of urban agglomeration under the impact of high-speed railway construction: Based on the social network analysis. Sustain. Cities Soc. 2020, 62, 102404. [Google Scholar] [CrossRef]
- Chen, J.P.; Ma, C.; Chen, S.J. Determinant of the tourism economy in Chinese cities: From an urban centrality perspective. Tour. Econ. 2024, 30, 44–66. [Google Scholar] [CrossRef]
- Erkus-Ozturk, H.; Eraydin, A. Environmental governance for sustainable tourism development: Collaborative networks and organisation building in the Antalya tourism region. Tour. Manag. 2010, 31, 113–124. [Google Scholar] [CrossRef]
- Wang, Y.C.; Qu, H.L.; Yang, J. Love spillover from a hotel sub-brand to its corporate brand: An associative network theory perspective. J. Hosp. Tour. Manag. 2020, 44, 263–271. [Google Scholar] [CrossRef]
- Kirilenko, A.P.; Stepchenkova, S.O.; Hernandez, J.M. Comparative clustering of destination attractions for different origin markets with network and spatial analyses of online reviews. Tour. Manag. 2019, 72, 400–410. [Google Scholar] [CrossRef]
- Asero, V.; Gozzo, S.; Tomaselli, V. Building Tourism Networks through Tourist Mobility. J. Travel Res. 2016, 55, 751–763. [Google Scholar] [CrossRef]
- Yin, P.; Lin, Z.B.; Prideaux, B. The impact of high-speed railway on tourism spatial structures between two adjoining metropolitan cities in China: Beijing and Tianjin. J. Transp. Geogr. 2019, 80, 102495. [Google Scholar] [CrossRef]
- Gong, H.X.; Zheng, Y.M.; Shi, J.L.; Wang, J.X.; Yang, H.Z.; Sibalo, S.P.A.; Mwamlima, A.; Li, J.Y.; Xu, S.T.; Xu, D.D.; et al. An Examination of the Spatial Spillover Effects of Tourism Transportation on Sustainable Development from a Multiple-Indicator Cross-Perspective. Sustainability 2023, 15, 4522. [Google Scholar] [CrossRef]
- Tong, Y.; Zhang, R.; He, B. The Carbon Emission Reduction Effect of Tourism Economy and Its Formation Mechanism: An Empirical Study of China’s 92 Tourism-Dependent Cities. Int. J. Environ. Res. Public Health 2022, 19, 1824. [Google Scholar] [CrossRef]
- Wang, D.G.; Niu, Y.; Qian, J. Evolution and optimization of China’s urban tourism spatial structure: A high speed rail perspective. Tour. Manag. 2018, 64, 218–232. [Google Scholar] [CrossRef]
- Chang, P.P.; Pang, X.R.; He, X.; Zhu, Y.T.; Zhou, C.S. Exploring the Spatial Relationship between Nighttime Light and Tourism Economy: Evidence from 31 Provinces in China. Sustainability 2022, 14, 7350. [Google Scholar] [CrossRef]
- Li, H.Y.; Sun, Z.Y.; Yang, C.Y. Dynamic linkages between tourism development, renewable energy and high-quality economic development: Evidence from spatial Durbin model. PLoS ONE 2024, 19, e0295448. [Google Scholar] [CrossRef] [PubMed]
- Wang, Y.W.; An, L.D.; Chen, H.; Zhao, Y.Y. Spatial Correlation and Influencing Factors of Tourism Eco-Efficiency in the Urban Agglomeration of the Yangtze River Delta Based on Social Network Analysis. Land 2022, 11, 2089. [Google Scholar] [CrossRef]
- Zhang, Y.; Li, Y.Y. A Study on the Coupling Coordination of Urban Resilience and the Tourism Economy in the Beijing-Tianjin-Hebei Region. Sustainability 2024, 16, 4946. [Google Scholar] [CrossRef]
- Li, Y.Y.; Zhang, Y. Spatial-temporal evolution and influencing factors of tourism eco-efficiency in China’s Beijing-Tianjin-Hebei region. Front. Environ. Sci. 2022, 10, 1067835. [Google Scholar] [CrossRef]
- Li, S.J.; Wei, Y.K. Exploring the mechanism of coordinated development with multi-source data fusion: A case study in Beijing-Tianjin-Hebei Region, China. Front. Ecol. Evol. 2023, 11, 1173867. [Google Scholar] [CrossRef]
- Sun, J.; Zhai, N.; Mu, H.; Miao, J.; Li, W.; Li, M. Assessment of urban resilience and subsystem coupling coordination in the Beijing-Tianjin-Hebei urban agglomeration. Sustain. Cities Soc. 2024, 100, 105058. [Google Scholar] [CrossRef]
- Liu, P.; Qin, Y.; Luo, Y.Y.; Wang, X.X.; Guo, X.W. Structure of low-carbon economy spatial correlation network in urban agglomeration. J. Clean. Prod. 2023, 394, 136359. [Google Scholar] [CrossRef]
- Chen, T.Y.; Zhou, Y.K.; Zou, D.; Wu, J.T.; Chen, Y.; Wu, J.P.; Wang, J. Deciphering China’s Socio-Economic Disparities: A Comprehensive Study Using Nighttime Light Data. Remote Sens. 2023, 15, 4581. [Google Scholar] [CrossRef]
- Zhang, G.; Guo, X.Y.; Li, D.R.; Jiang, B.Y. Evaluating the Potential of LJ1-01 Nighttime Light Data for Modeling Socio-Economic Parameters. Sensors 2019, 19, 1465. [Google Scholar] [CrossRef]
- Ge, J.; Meng, B.; Liang, T.; Feng, Q.; Gao, J.; Yang, S.; Huang, X.; Xie, H. Modeling alpine grassland cover based on MODIS data and support vector machine regression in the headwater region of the Huanghe River, China. Remote Sens. Environ. 2018, 218, 162–173. [Google Scholar] [CrossRef]
- Liang, L.W.; Chen, M.X.; Luo, X.Y.; Xian, Y. Changes pattern in the population and economic gravity centers since the Reform and Opening up in China: The widening gaps between the South and North. J. Clean. Prod. 2021, 310, 127379. [Google Scholar] [CrossRef]
- Manrique-de-Lara-Peñate, C.; Santana Gallego, M.; Valle, E.V. The economic impact of global uncertainty and security threats on international tourism. Econ. Model. 2022, 113, 105892. [Google Scholar] [CrossRef]
- Shen, W.; Liang, H.; Dong, L.; Ren, J.; Wang, G. Synergistic CO2 reduction effects in Chinese urban agglomerations: Perspectives from social network analysis. Sci. Total Environ. 2021, 798, 149352. [Google Scholar] [CrossRef] [PubMed]
- Dejean, S. The role of distance and social networks in the geography of crowdfunding: Evidence from France. Reg. Stud. 2020, 54, 329–339. [Google Scholar] [CrossRef]
- Zhang, Y.; Li, Z. Research on Spatial Correlation Network Structure of Inter-Provincial Electronic Information Manufacturing Industry in China. Sustainability 2019, 11, 3534. [Google Scholar] [CrossRef]
- Danish; Wang, Z.H. Dynamic relationship between tourism, economic growth, and environmental quality. J. Sustain. Tour. 2018, 26, 1928–1943. [Google Scholar] [CrossRef]
- Shan, Y.; Ren, Z. Does tourism development and renewable energy consumption drive high quality economic development? Resour. Pol. 2023, 80, 103270. [Google Scholar] [CrossRef]
- Meng, G.; Wang, K.; Wang, F.; Dong, Y. Analysis of the tourism-economy-ecology coupling coordination and high-quality development path in karst Guizhou Province, China. Ecol. Indic. 2023, 154, 110858. [Google Scholar] [CrossRef]
- Zhu, Y.; Zhu, Q.; Zhu, Z. Modeling, Evaluation and Analysis of Tourism Destination Competitiveness: A Case Study of the Yangtze River Delta of China. Asia Pac. J. Tour. Res. 2014, 19, 932–949. [Google Scholar] [CrossRef]
- Zhang, H.; Gu, C.-L.; Gu, L.-W.; Zhang, Y. The evaluation of tourism destination competitiveness by TOPSIS & information entropy—A case in the Yangtze River Delta of China. Tour. Manag. 2011, 32, 443–451. [Google Scholar] [CrossRef]
- Yuan, Y.; Zheng, Y.; Huang, X.; Zhai, J. Climate resilience of urban water systems: A case study of sponge cities in China. J. Clean. Prod. 2024, 451, 141781. [Google Scholar] [CrossRef]
- He, C.C.; Han, Q.; de Vries, B.; Wang, X.M.; Zhao, G.C. Evaluation of sustainable land management in urban area: A case study of Shanghai, China. Ecol. Indic. 2017, 80, 106–113. [Google Scholar] [CrossRef]
- Jing, X.; Tao, S.; Hu, H.; Sun, M.; Wang, M. Spatio-temporal evaluation of ecological security of cultivated land in China based on DPSIR-entropy weight TOPSIS model and analysis of obstacle factors. Ecol. Indic. 2024, 166, 112579. [Google Scholar] [CrossRef]
- Zhu, Y.M.; Zeng, S.Z.; Lin, Z.S.; Ullah, K. Comprehensive evaluation and spatial-temporal differences analysis of China’s inter-provincial doing business environment based on Entropy-CoCoSo method. Front. Environ. Sci. 2023, 10, 1088064. [Google Scholar] [CrossRef]
- Guo, K.; Liang, X.J.; Zhang, X.C.; Luo, R.B.; Qiu, T.Q.; He, Z.H.; Zhang, K.X. Development of an adverse outcome pathways approach for land resource and environment management at the regional scale. Ecol. Indic. 2023, 157, 111210. [Google Scholar] [CrossRef]
- Zeng, C.; Deng, X.Z.; Xu, S.; Wang, Y.T.; Cui, J.X. An integrated approach for assessing the urban ecosystem health of megacities in China. Cities 2016, 53, 110–119. [Google Scholar] [CrossRef]
- Guo, Y.; Yu, J.; Zhu, Y.; Zhang, H. Research on tourism ecological safety evaluation of Huizhou Cultural and ecological reserve based on entropy-TOPSIS. Heliyon 2024, 10, e24325. [Google Scholar] [CrossRef]
- Li, J.Q.; Yang, N.; Shen, Z.Y. Evaluation of the water quality monitoring network layout based on driving-pressure-state-response framework and entropy weight TOPSIS model: A case study of Liao River, China. J. Environ. Manag. 2024, 361, 121267. [Google Scholar] [CrossRef]
- Liu, B.; Huang, S.; Fu, H. An application of network analysis on tourist attractions: The case of Xinjiang, China. Tour. Manag. 2017, 58, 132–141. [Google Scholar] [CrossRef]
- Gregson, J.; Sowa, M.; Flynn, H.K. Evaluating Form and Function of Regional Partnerships: Applying Social Network Analysis to the Network for a Healthy California, 2001–2007. J. Nutr. Educ. Behav. 2011, 43, S67–S74. [Google Scholar] [CrossRef]
- Bai, C.; Zhou, L.; Xia, M.; Feng, C. Analysis of the spatial association network structure of China’s transportation carbon emissions and its driving factors. J. Environ. Manag. 2020, 253, 109765. [Google Scholar] [CrossRef] [PubMed]
- Benítez-Andrades, J.A.; García-Rodríguez, I.; Benavides, C.; Alaiz-Moretón, H.; Labra Gayo, J.E. An ontology-based multi-domain model in social network analysis: Experimental validation and case study. Inf. Sci. 2020, 540, 390–413. [Google Scholar] [CrossRef]
- Shi, S.N.; Liu, M.H.; Xi, J.C. Hierarchical Structure and Organizational Model of County Tourism Network of the Tibetan Plateau. Land 2022, 11, 1880. [Google Scholar] [CrossRef]
- Wang, K.; Wang, M.H.; Gan, C.; Chen, Q.C.; Voda, M. Tourism Economic Network Structural Characteristics of National Parks in the Central Region of China. Sustainability 2021, 13, 4805. [Google Scholar] [CrossRef]
- Borgatti, S.P.; Everett, M.G. Models of core/periphery structures. Soc. Netw. 2000, 21, 375–395. [Google Scholar] [CrossRef]
- Ma, L.; Yang, L.; Jiang, X.; Huang, D. Analysis of business interruption risk factors of Chinese enterprises during flood disasters based on social network analysis. Clim. Risk Manag. 2021, 33, 100353. [Google Scholar] [CrossRef]
- Wang, Z.; Liu, Q.; Xu, J.; Fujiki, Y. Evolution characteristics of the spatial network structure of tourism efficiency in China: A province-level analysis. J. Destin. Mark. Manag. 2020, 18, 100509. [Google Scholar] [CrossRef]
- Lv, K.; Feng, X.; Kelly, S.; Zhu, L.; Deng, M. A study on embodied carbon transfer at the provincial level of China from a social network perspective. J. Clean. Prod. 2019, 225, 1089–1104. [Google Scholar] [CrossRef]
- Li, A.; Mou, N.; Zhang, L.; Yang, T.; Liu, W.; Liu, F. Tourism Flow Between Major Cities During China’s National Day Holiday: A Social Network Analysis Using Weibo Check-in Data. IEEE Access 2020, 8, 225675–225691. [Google Scholar] [CrossRef]
- Liu, X.; Hu, Y.; Liu, N. Analysis on Tourism Economic Connection of Beijing-Tianjin-Hebei Based on the Improved Gravity Model. China Bus. Mark. 2020, 34, 121–128. [Google Scholar] [CrossRef]
- The People’s Government of Hebei Province, China. Hebei Province Tourism High Quality Development Plan. Beijing 2018. Available online: https://www.hebei.gov.cn/columns/b22afae0-df96-48fa-b3a0-38a652afcf79/202309/06/c92422ca-b507-476d-b6b4-acc038c36098.html (accessed on 18 July 2024).
- Ministry of Culture and Tourism, China. Tianjin Tourism Promotion Regulations. Beijing 2022. Available online: https://www.mct.gov.cn/whzx/qgwhxxlb/tj/202208/t20220803_935114.htm (accessed on 18 July 2024).
Disclaimer/Publisher’s Note: The statements, opinions and data contained in all publications are solely those of the individual author(s) and contributor(s) and not of MDPI and/or the editor(s). MDPI and/or the editor(s) disclaim responsibility for any injury to people or property resulting from any ideas, methods, instructions or products referred to in the content. |
© 2024 by the authors. Licensee MDPI, Basel, Switzerland. This article is an open access article distributed under the terms and conditions of the Creative Commons Attribution (CC BY) license (https://creativecommons.org/licenses/by/4.0/).