
The X-Minute City: Analysing Accessibility to Essential Daily Destinations by Active Mobility in Seville


Abstract
1. Introduction
2. Literature Review
2.1. The X-Minute City Concept
2.2. Main Dimensions of the X-Minute City Relevant for the Present Paper
- A list of destinations or amenities () that should be accessible in an x-minute city has to be defined;
- The analysis should be restricted to those modes of transport () that people would preferably use in the x-minute city;
- Potential indicators that can be used to quantify the x-minute city should be reviewed.
3. Materials and Methods
3.1. Cumulative Opportunity Accessibility
3.2. Calculation of the Population within the Desired Reach
3.3. Street Network
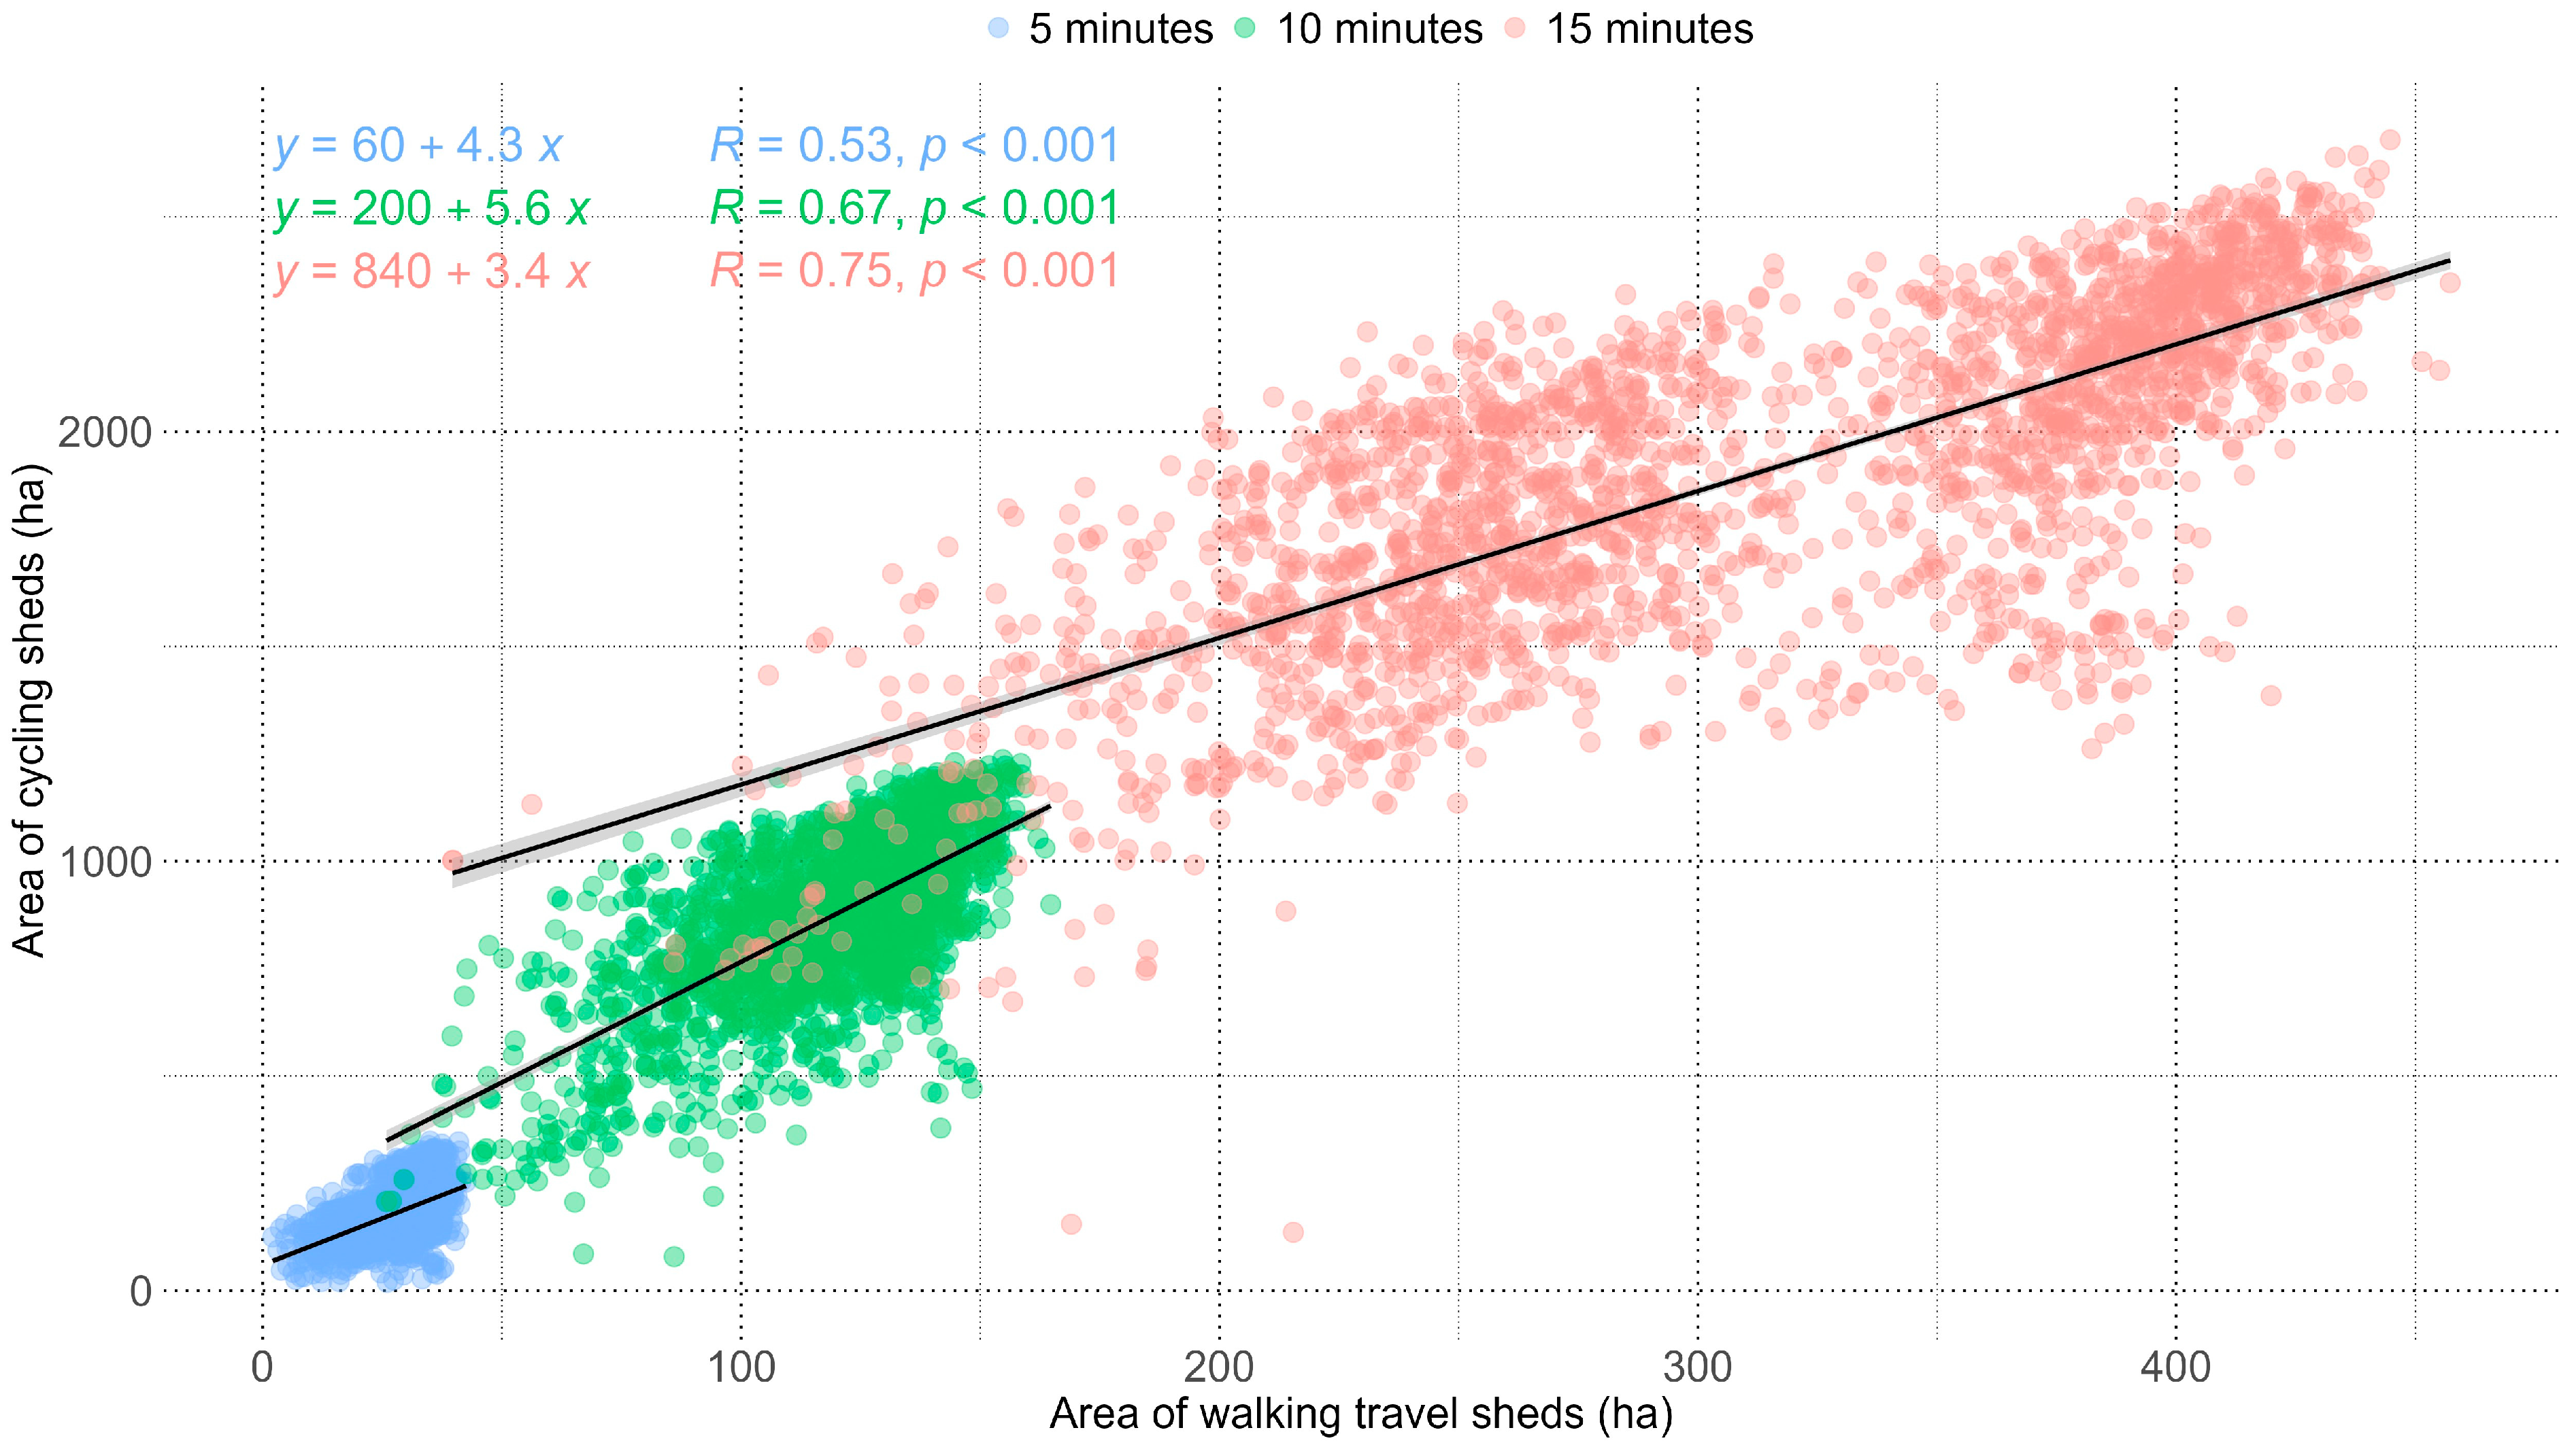
3.4. Grid-Based Analysis
3.5. Travel Shed Generation
4. Case Study
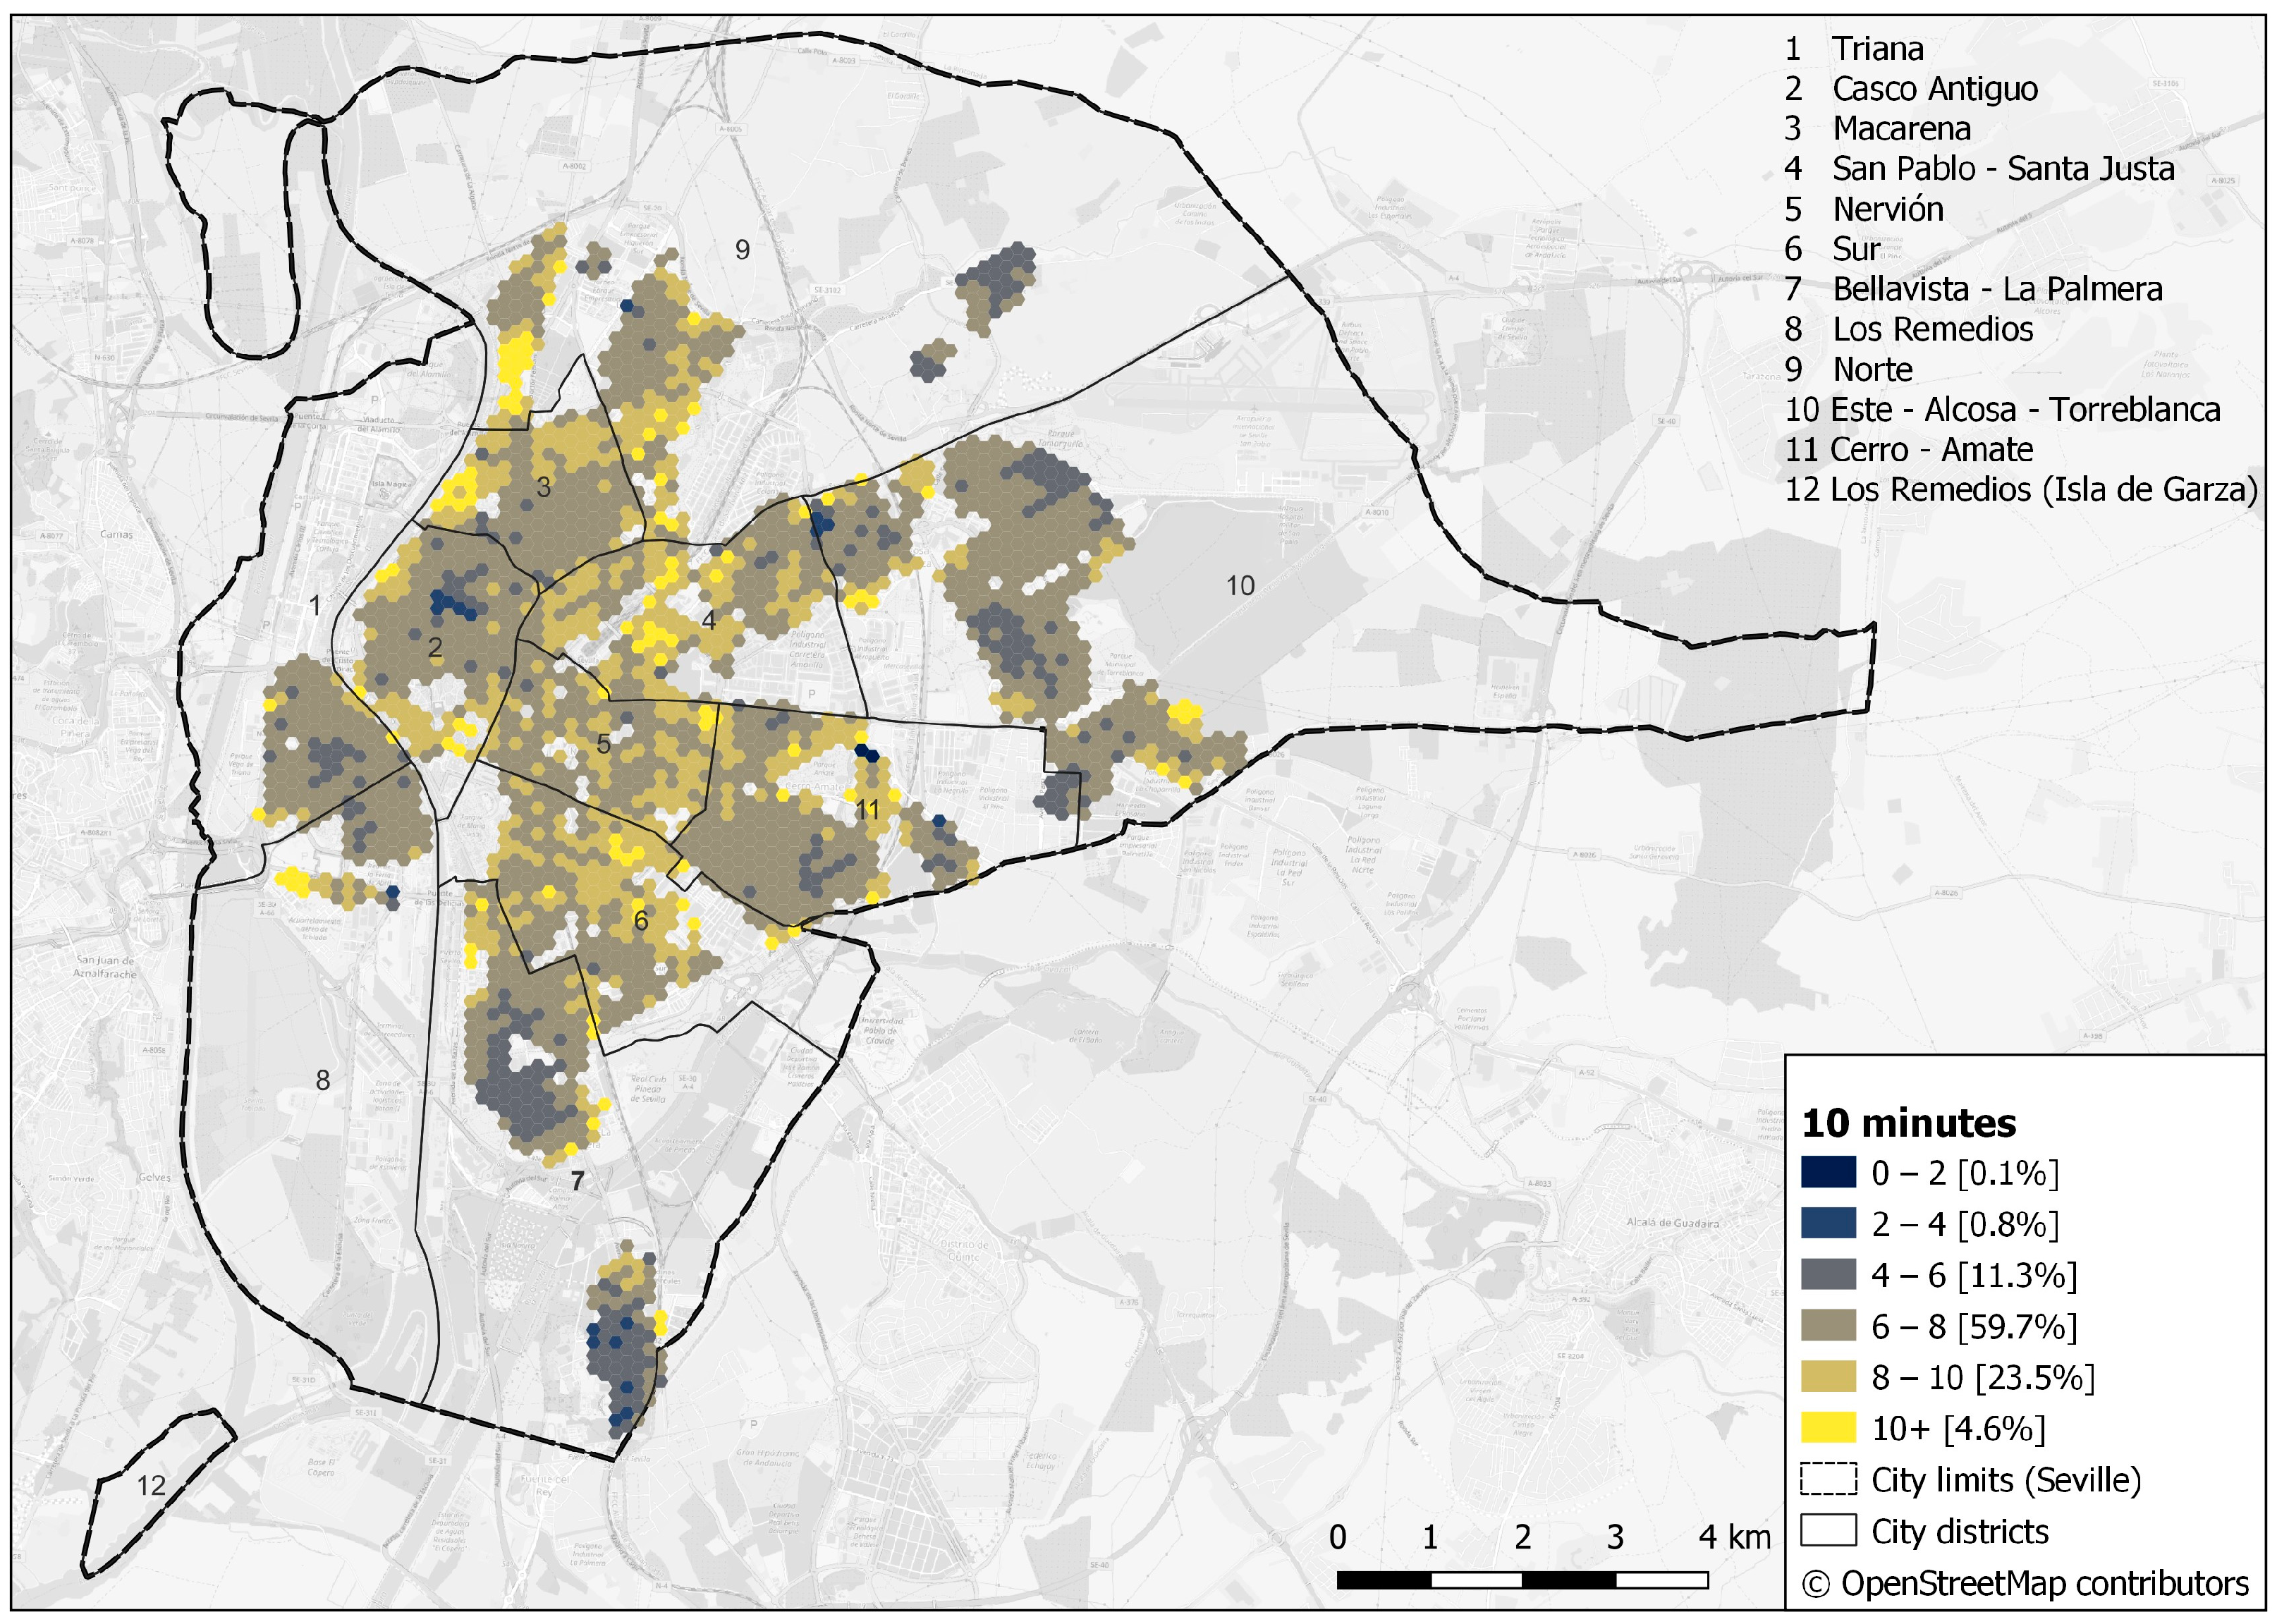
4.1. Study Area
4.2. Types of Destinations Considered

| Destination Categories ) | Destination Types ) | Data Source | Time Threshold ) | Evidence for the Chosen Time Threshold |
|---|---|---|---|---|
| Transport (public transport and active mobility) | City-level public transport stops (catchment ≤ core city) | GTFS | 5 | [82,87] |
| FUA-level public transport stops (core city < catchment ≤ functional urban area) | GTFS | 10 | [29] | |
| Regional-level public transport stops (catchment > functional urban area) | GTFS | ≥15 | Own definition | |
| Night public transport service (catchment ≤ functional urban area) | GTFS | 10 | [29] | |
| Bike-sharing stations | IDE.SEVILLA [88] | 5 | Own definition | |
| Bike parking facilities | IDE.SEVILLA [88] | 5 | [82] | |
| Cycling infrastructure | IDE.SEVILLA [88] | 5 | [82] | |
| Commerce | Food stores (grocery stores, supermarkets, etc.) | OSM [68] | 5 | [83] |
| Fresh-food shops (greengrocer, bakery, butcher, etc.) | OSM [68] | 5 | [83] | |
| Markets (food) | IDE.SEVILLA [88] | 10 | [82] | |
| Healthcare (public) | Healthcare centres | IDE.SEVILLA [88] | 10 | [82] |
| Hospitals | IDE.SEVILLA [88] | ≥15 | Own definition | |
| Social care centres | IDE.SEVILLA [88] | 10 | [82] | |
| Pharmacies | IDE.Andalucía | 5 | Own definition | |
| Education (public) | Preschool education | IDE.SEVILLA [88] | 5 | [82] |
| Primary education | IDE.SEVILLA [88] | 5 | [82] | |
| Secondary education | IDE.SEVILLA [88] | 10 | [82] | |
| Leisure | Playgrounds | OSM [68] | 5 | [29] |
| Sport facilities | OSM, IDE.SEVILLA [68,88] | 10 | [82] | |
| Squares and parks ≥ 1000 m2 | OSM, IDE.SEVILLA [68,88] | 5 | [83] | |
| Squares and parks ≥ 10,000 m2 | OSM, IDE.SEVILLA [68,88] | 10 | [83] | |
| Libraries | IDE.SEVILLA [88] | 10 | [82] | |
| Civic centres | IDE.SEVILLA [88] | 10 | [82] |
4.3. Accessibility Analysis
4.4. Population within Reach: Data and Calculation
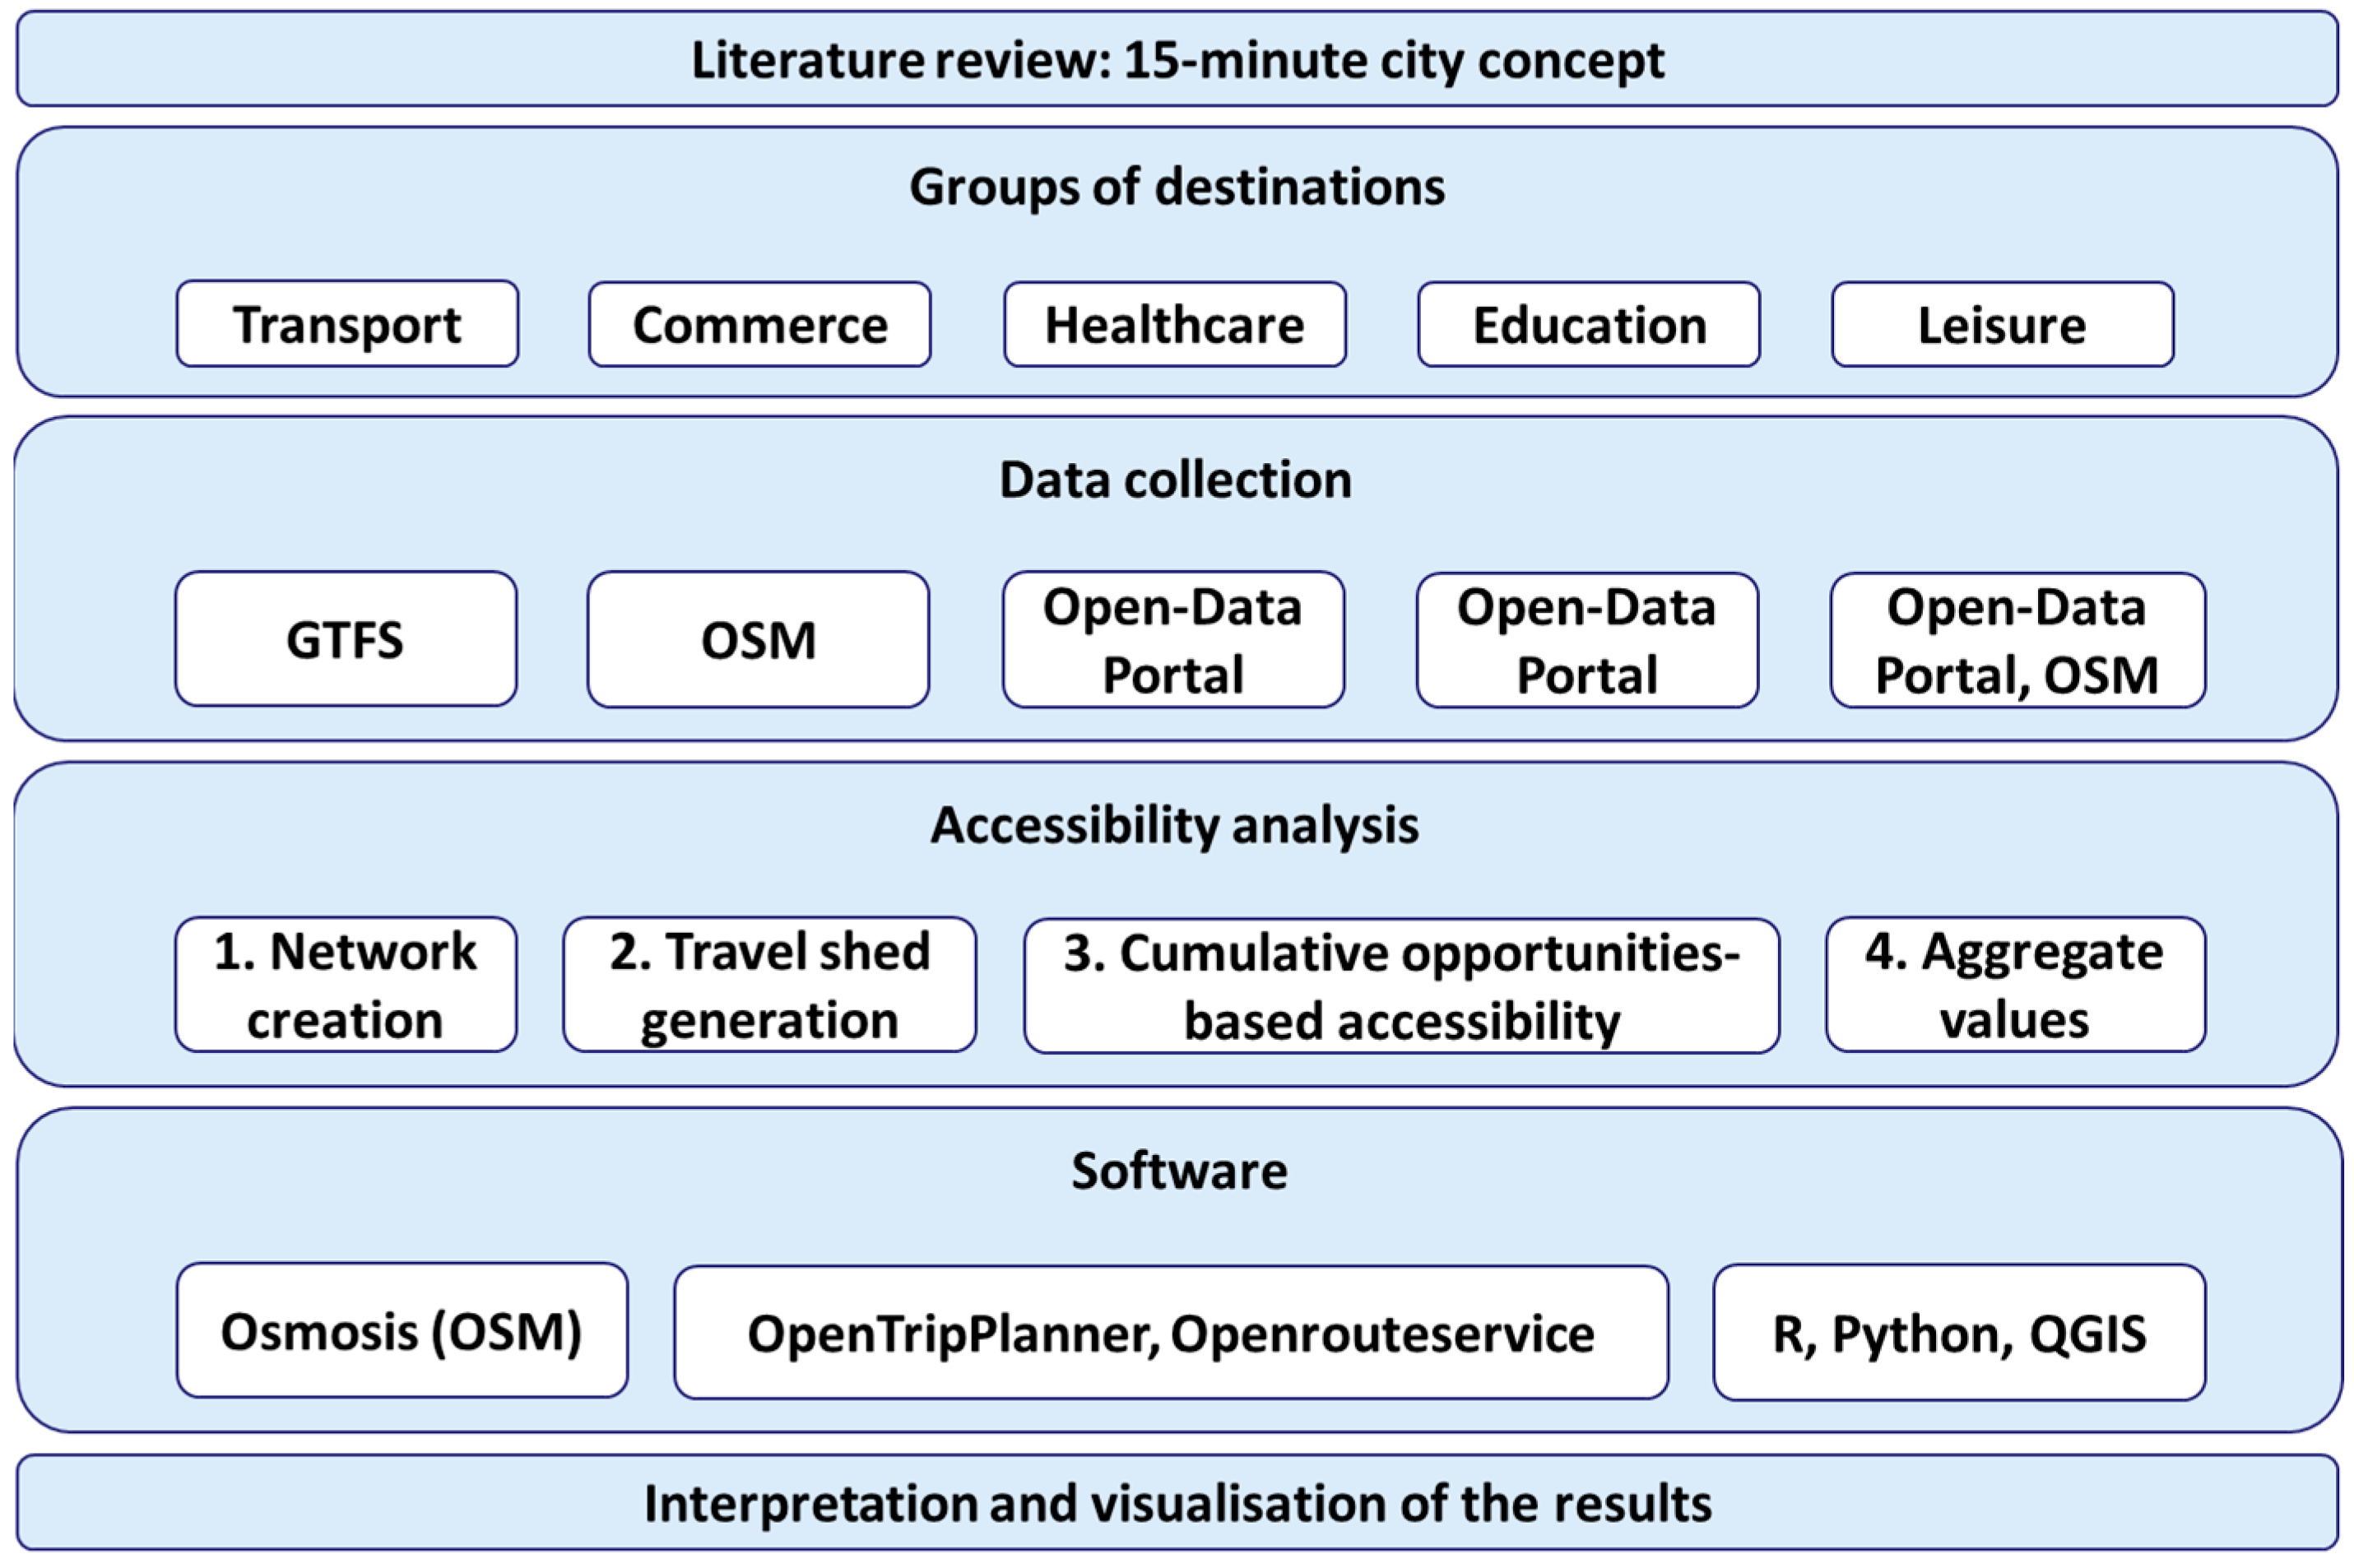
4.5. Operationalisation
- Identification of destination types that should be present and accessible in the study area.
- Data collection: street network and destinations (geodata) ().
- Grid generation based on the defined study area: hexagon cells, which are the units of the analysis.
- Travel shed generation for all the applied time thresholds and modes of transport for each grid cell (polygons).
- Calculating the number of accessible destinations for all destination types for each hexagon cell by counting points (destinations) in polygons (travel sheds) ()
- Data aggregation and visualisation.
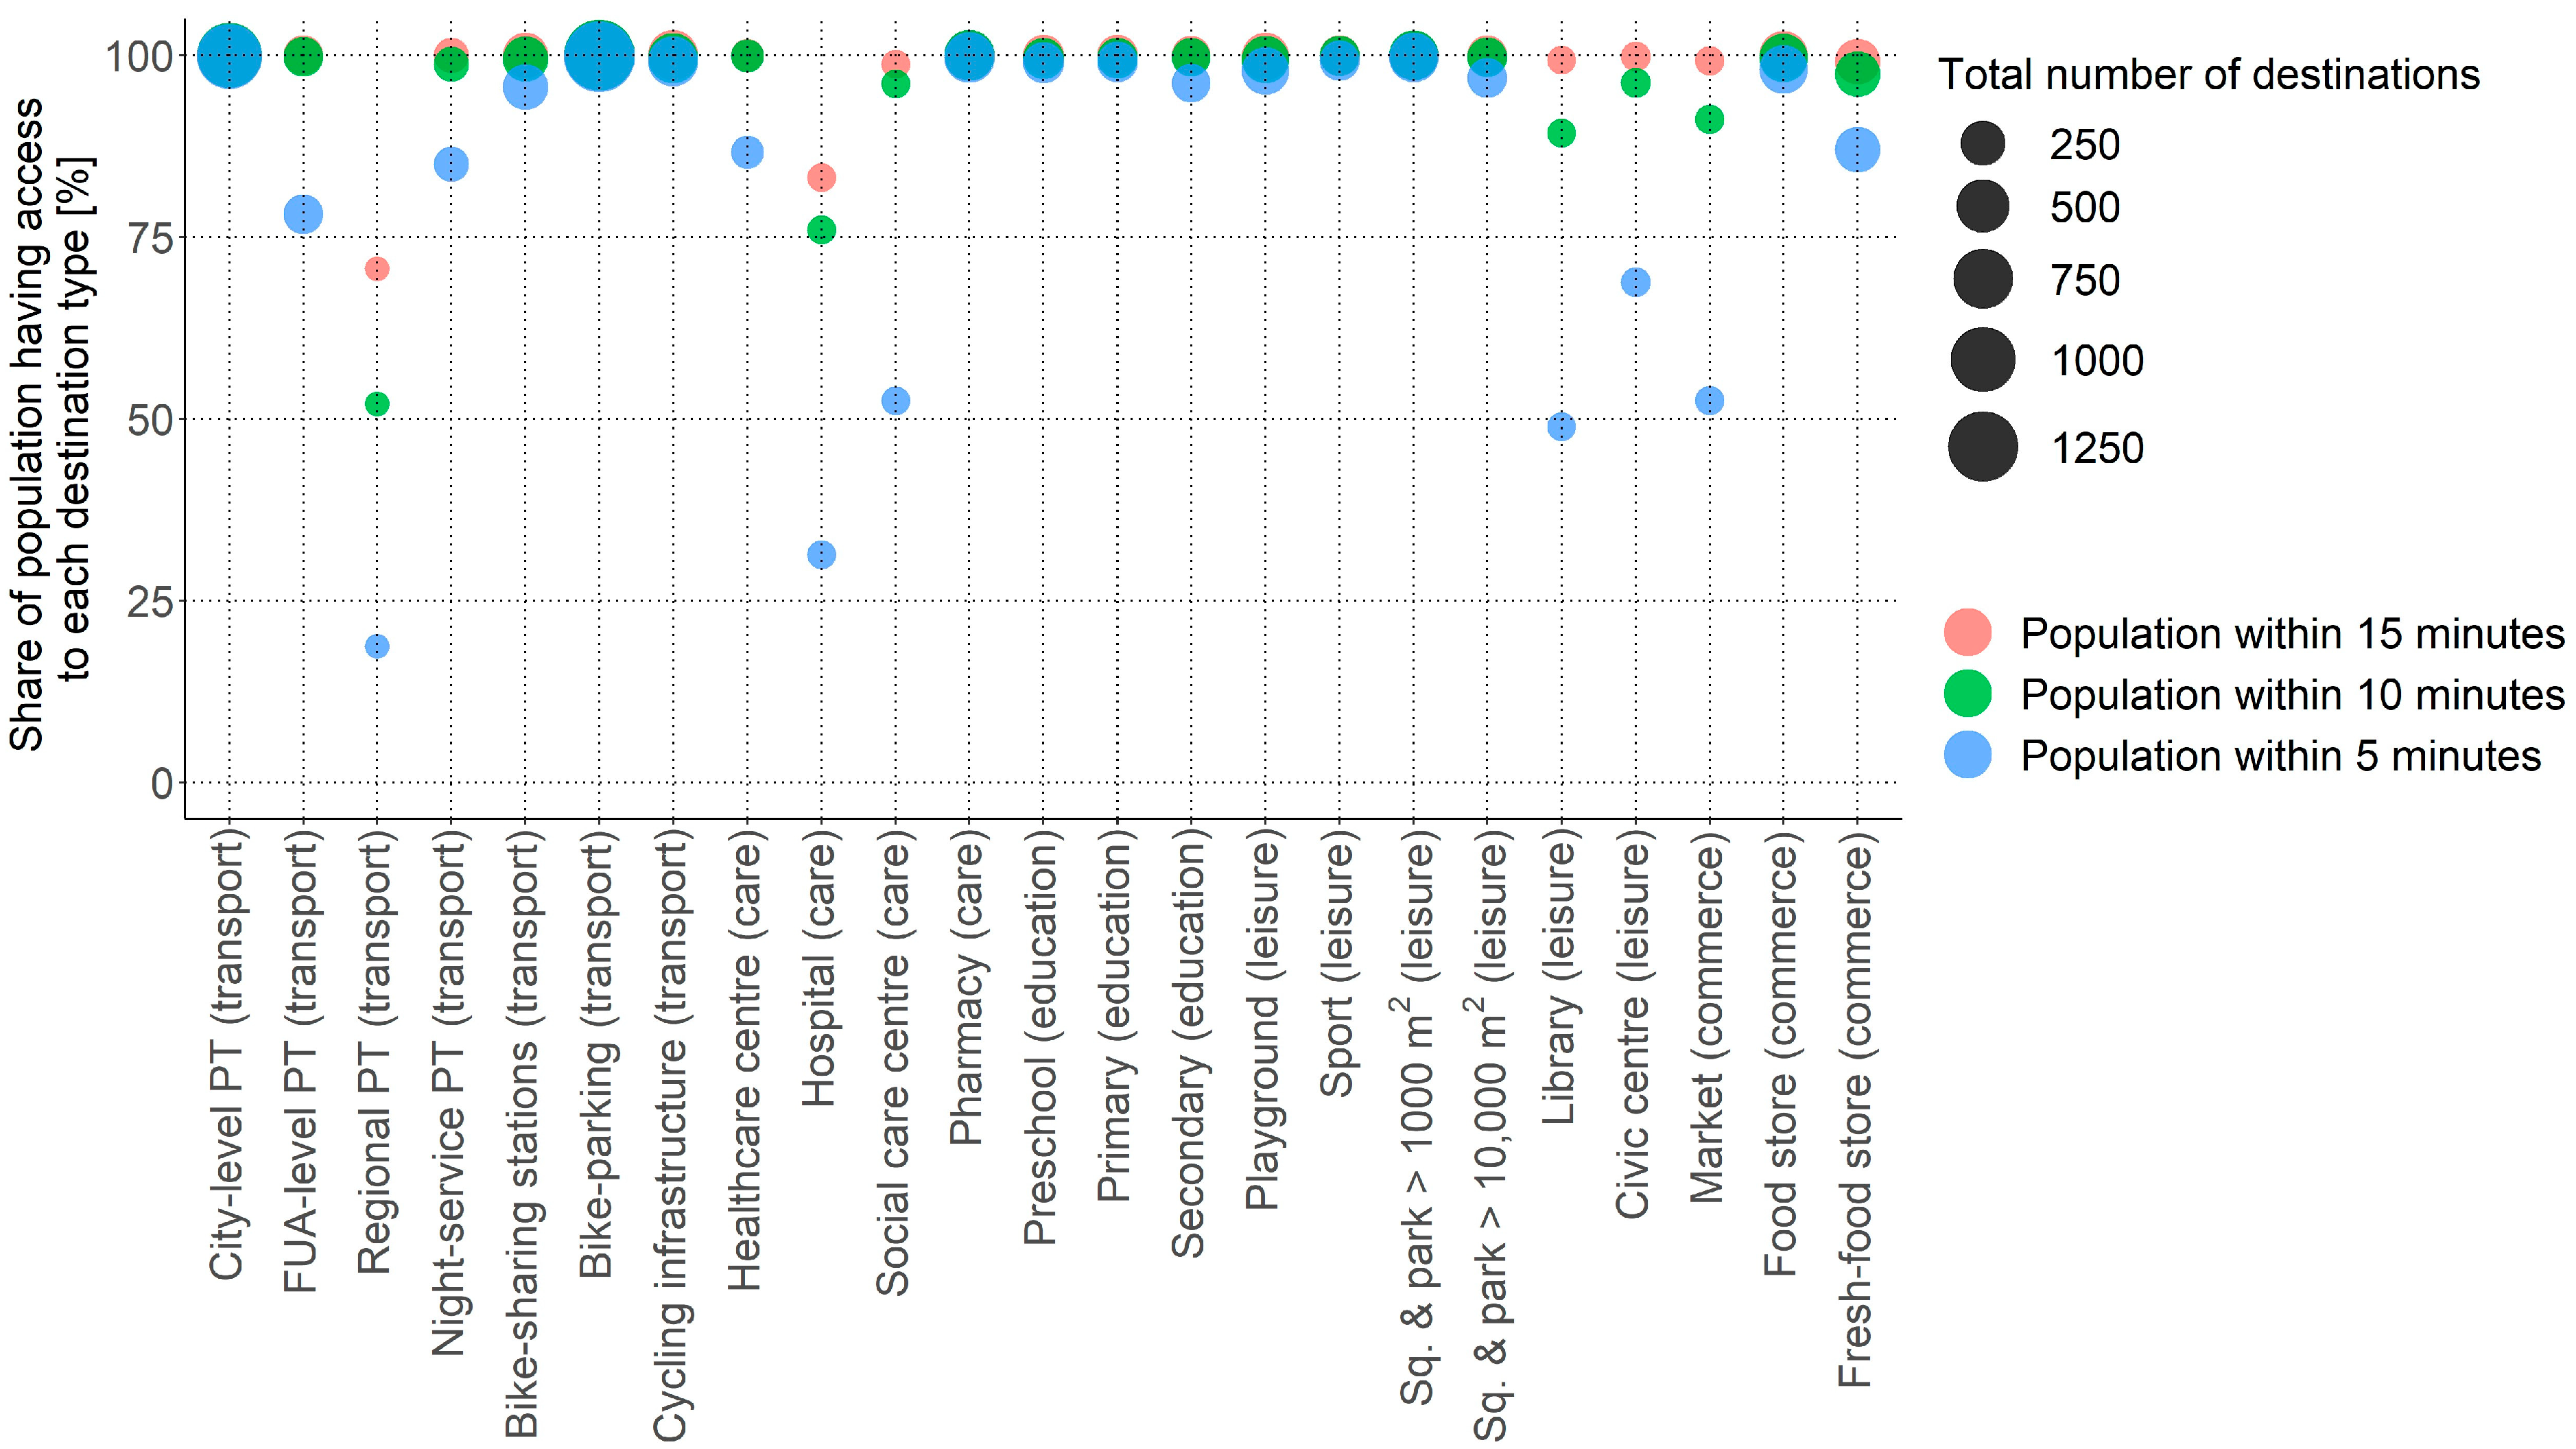
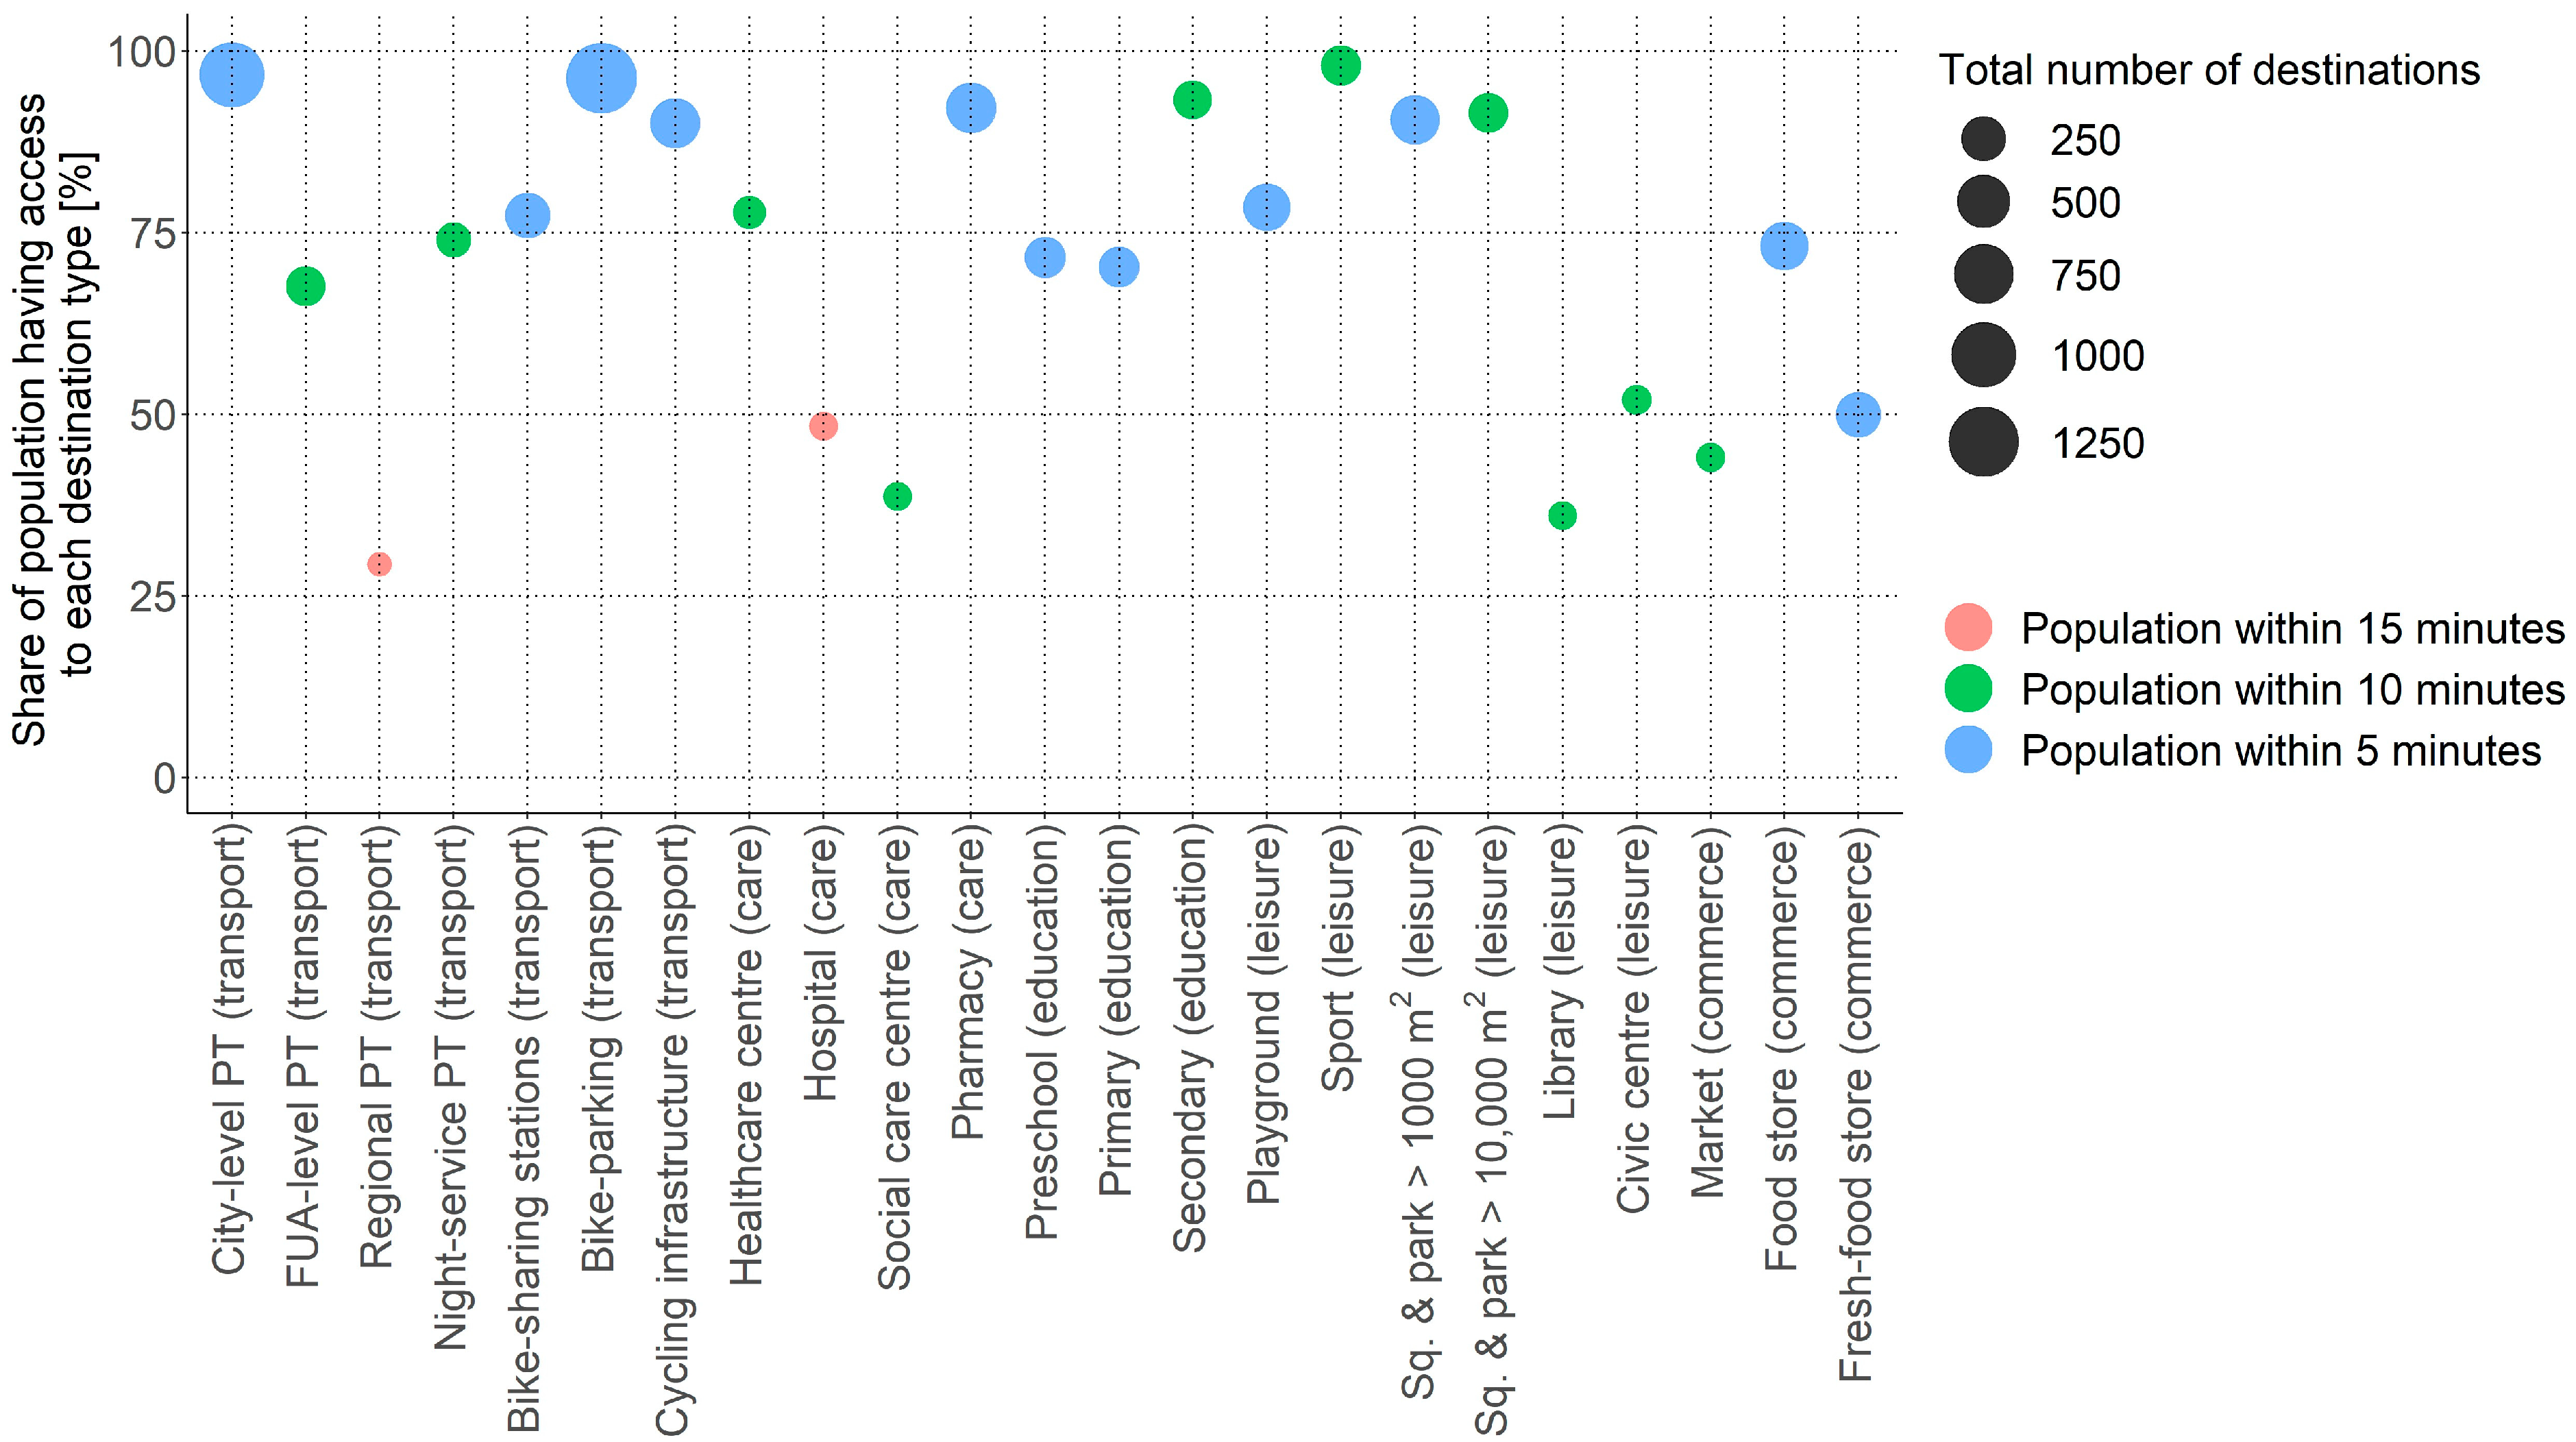
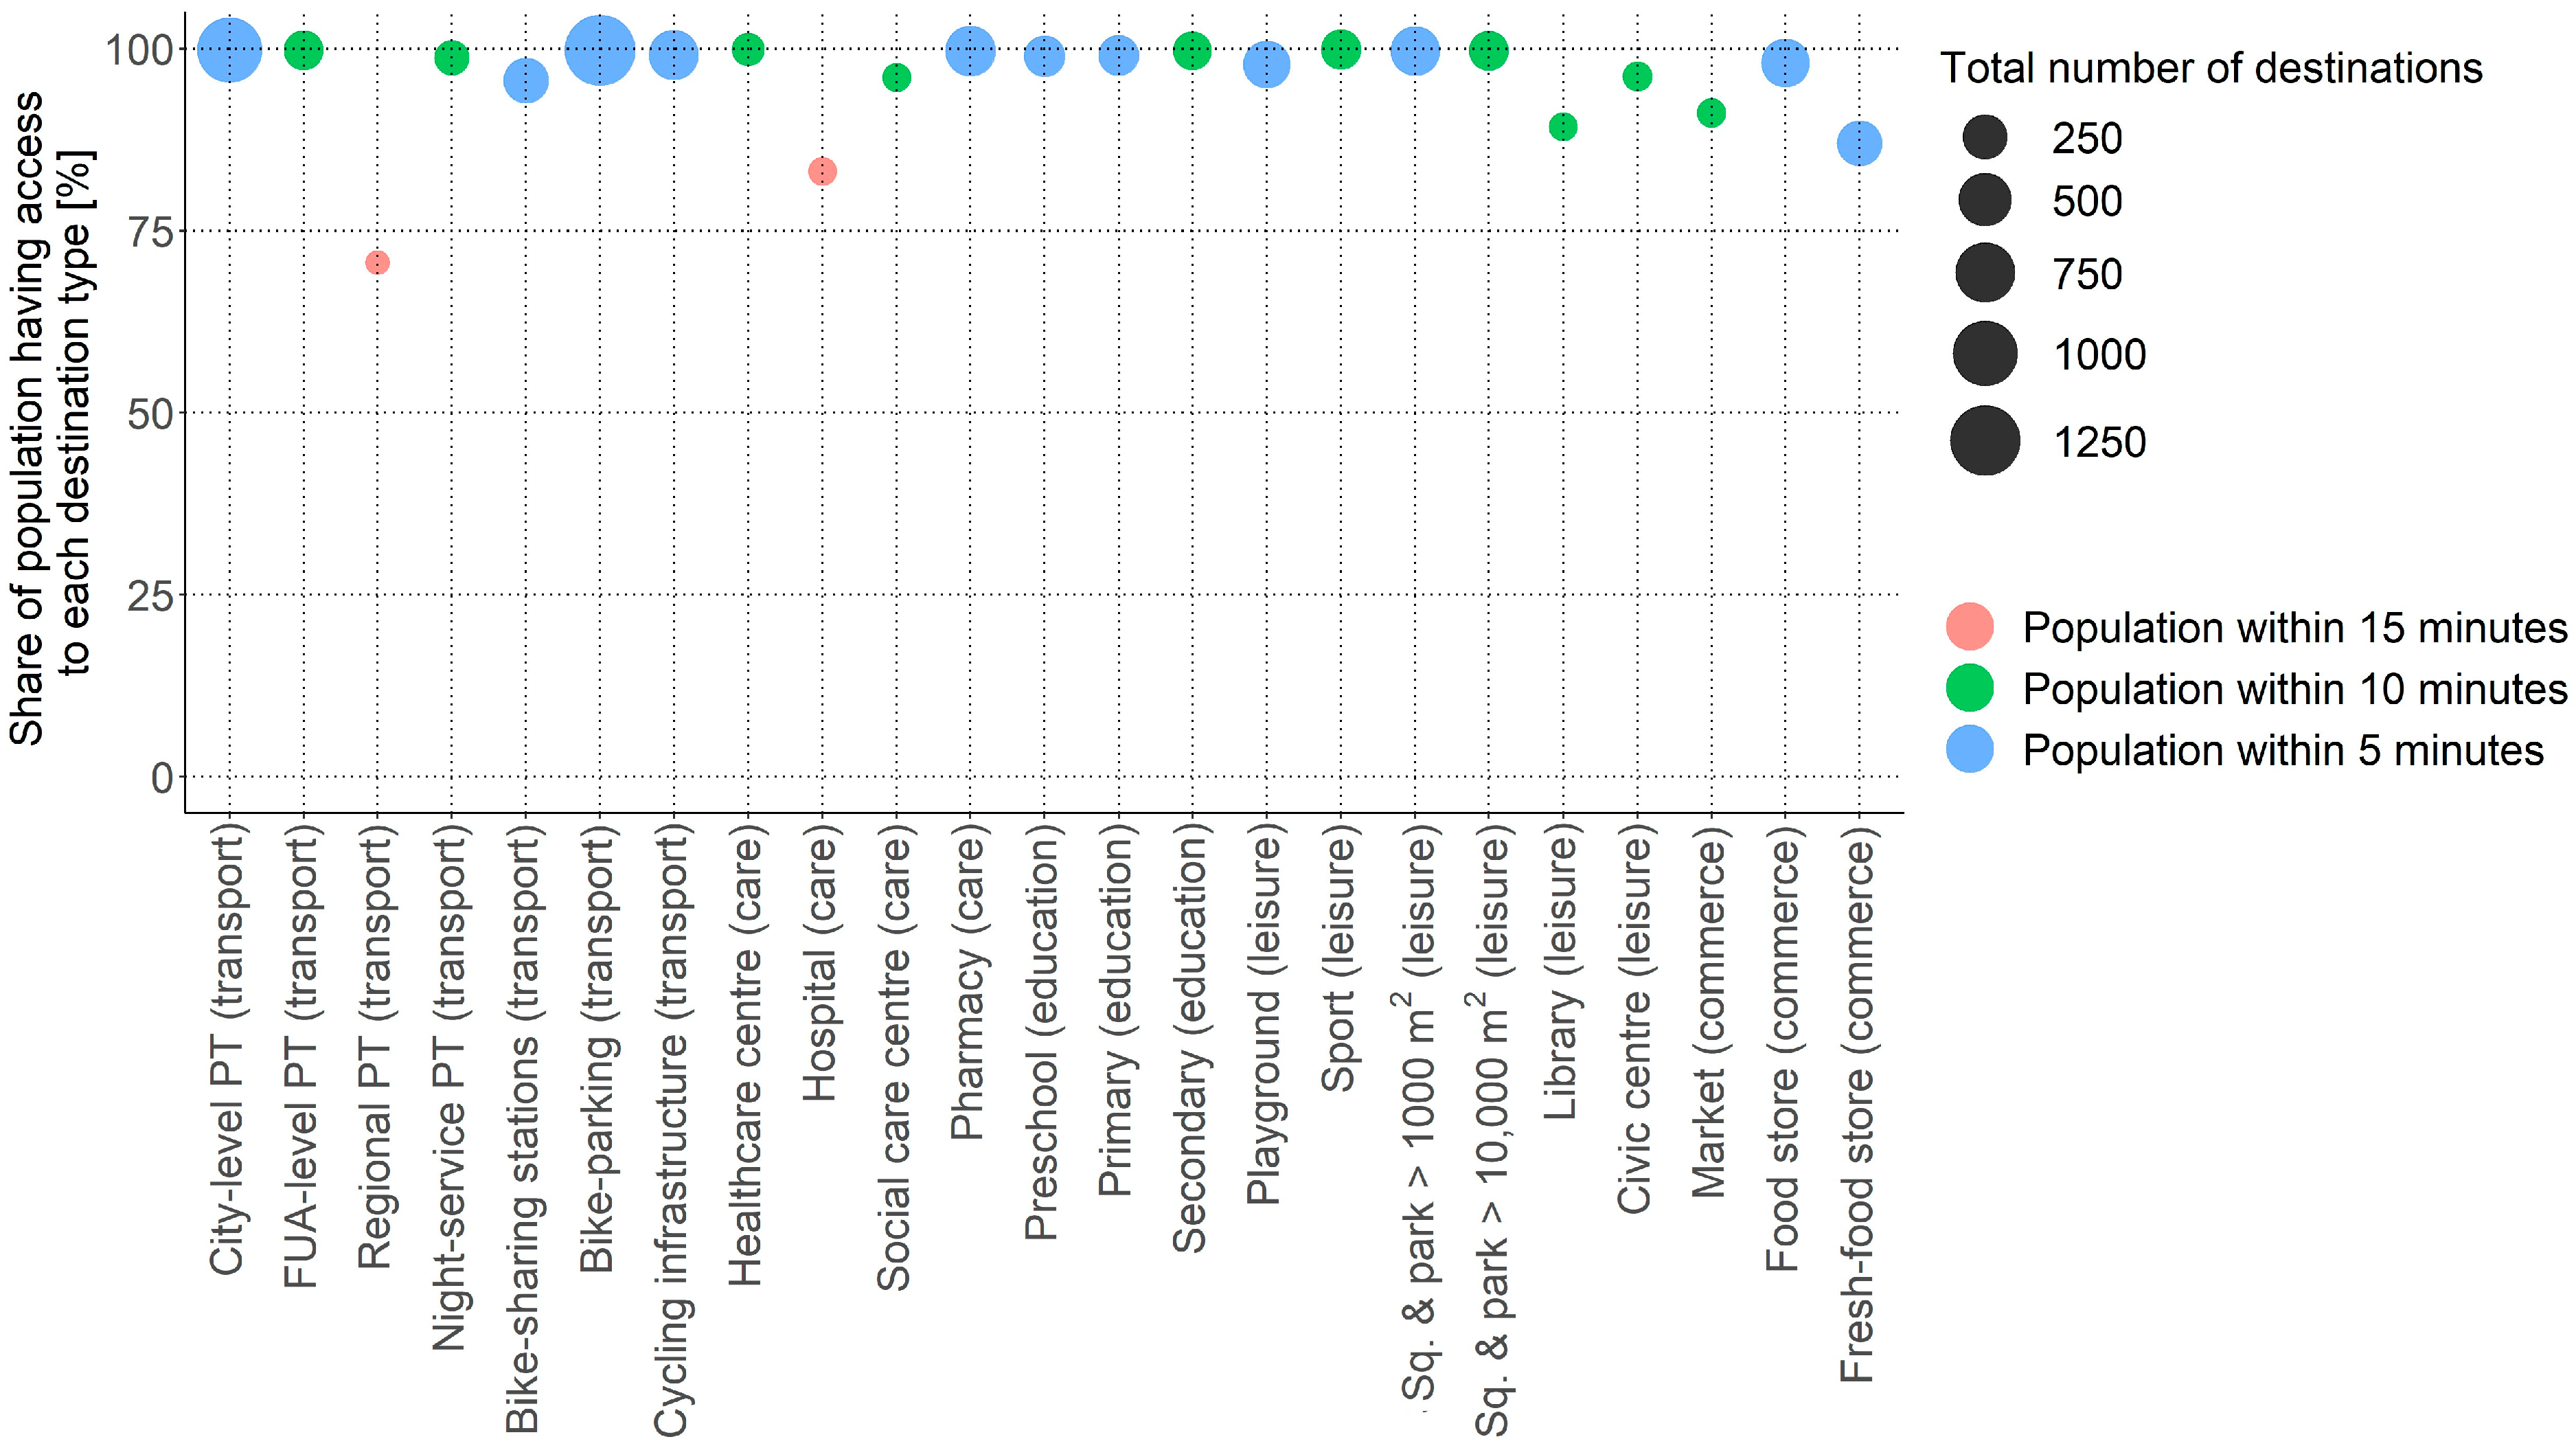
5. Results
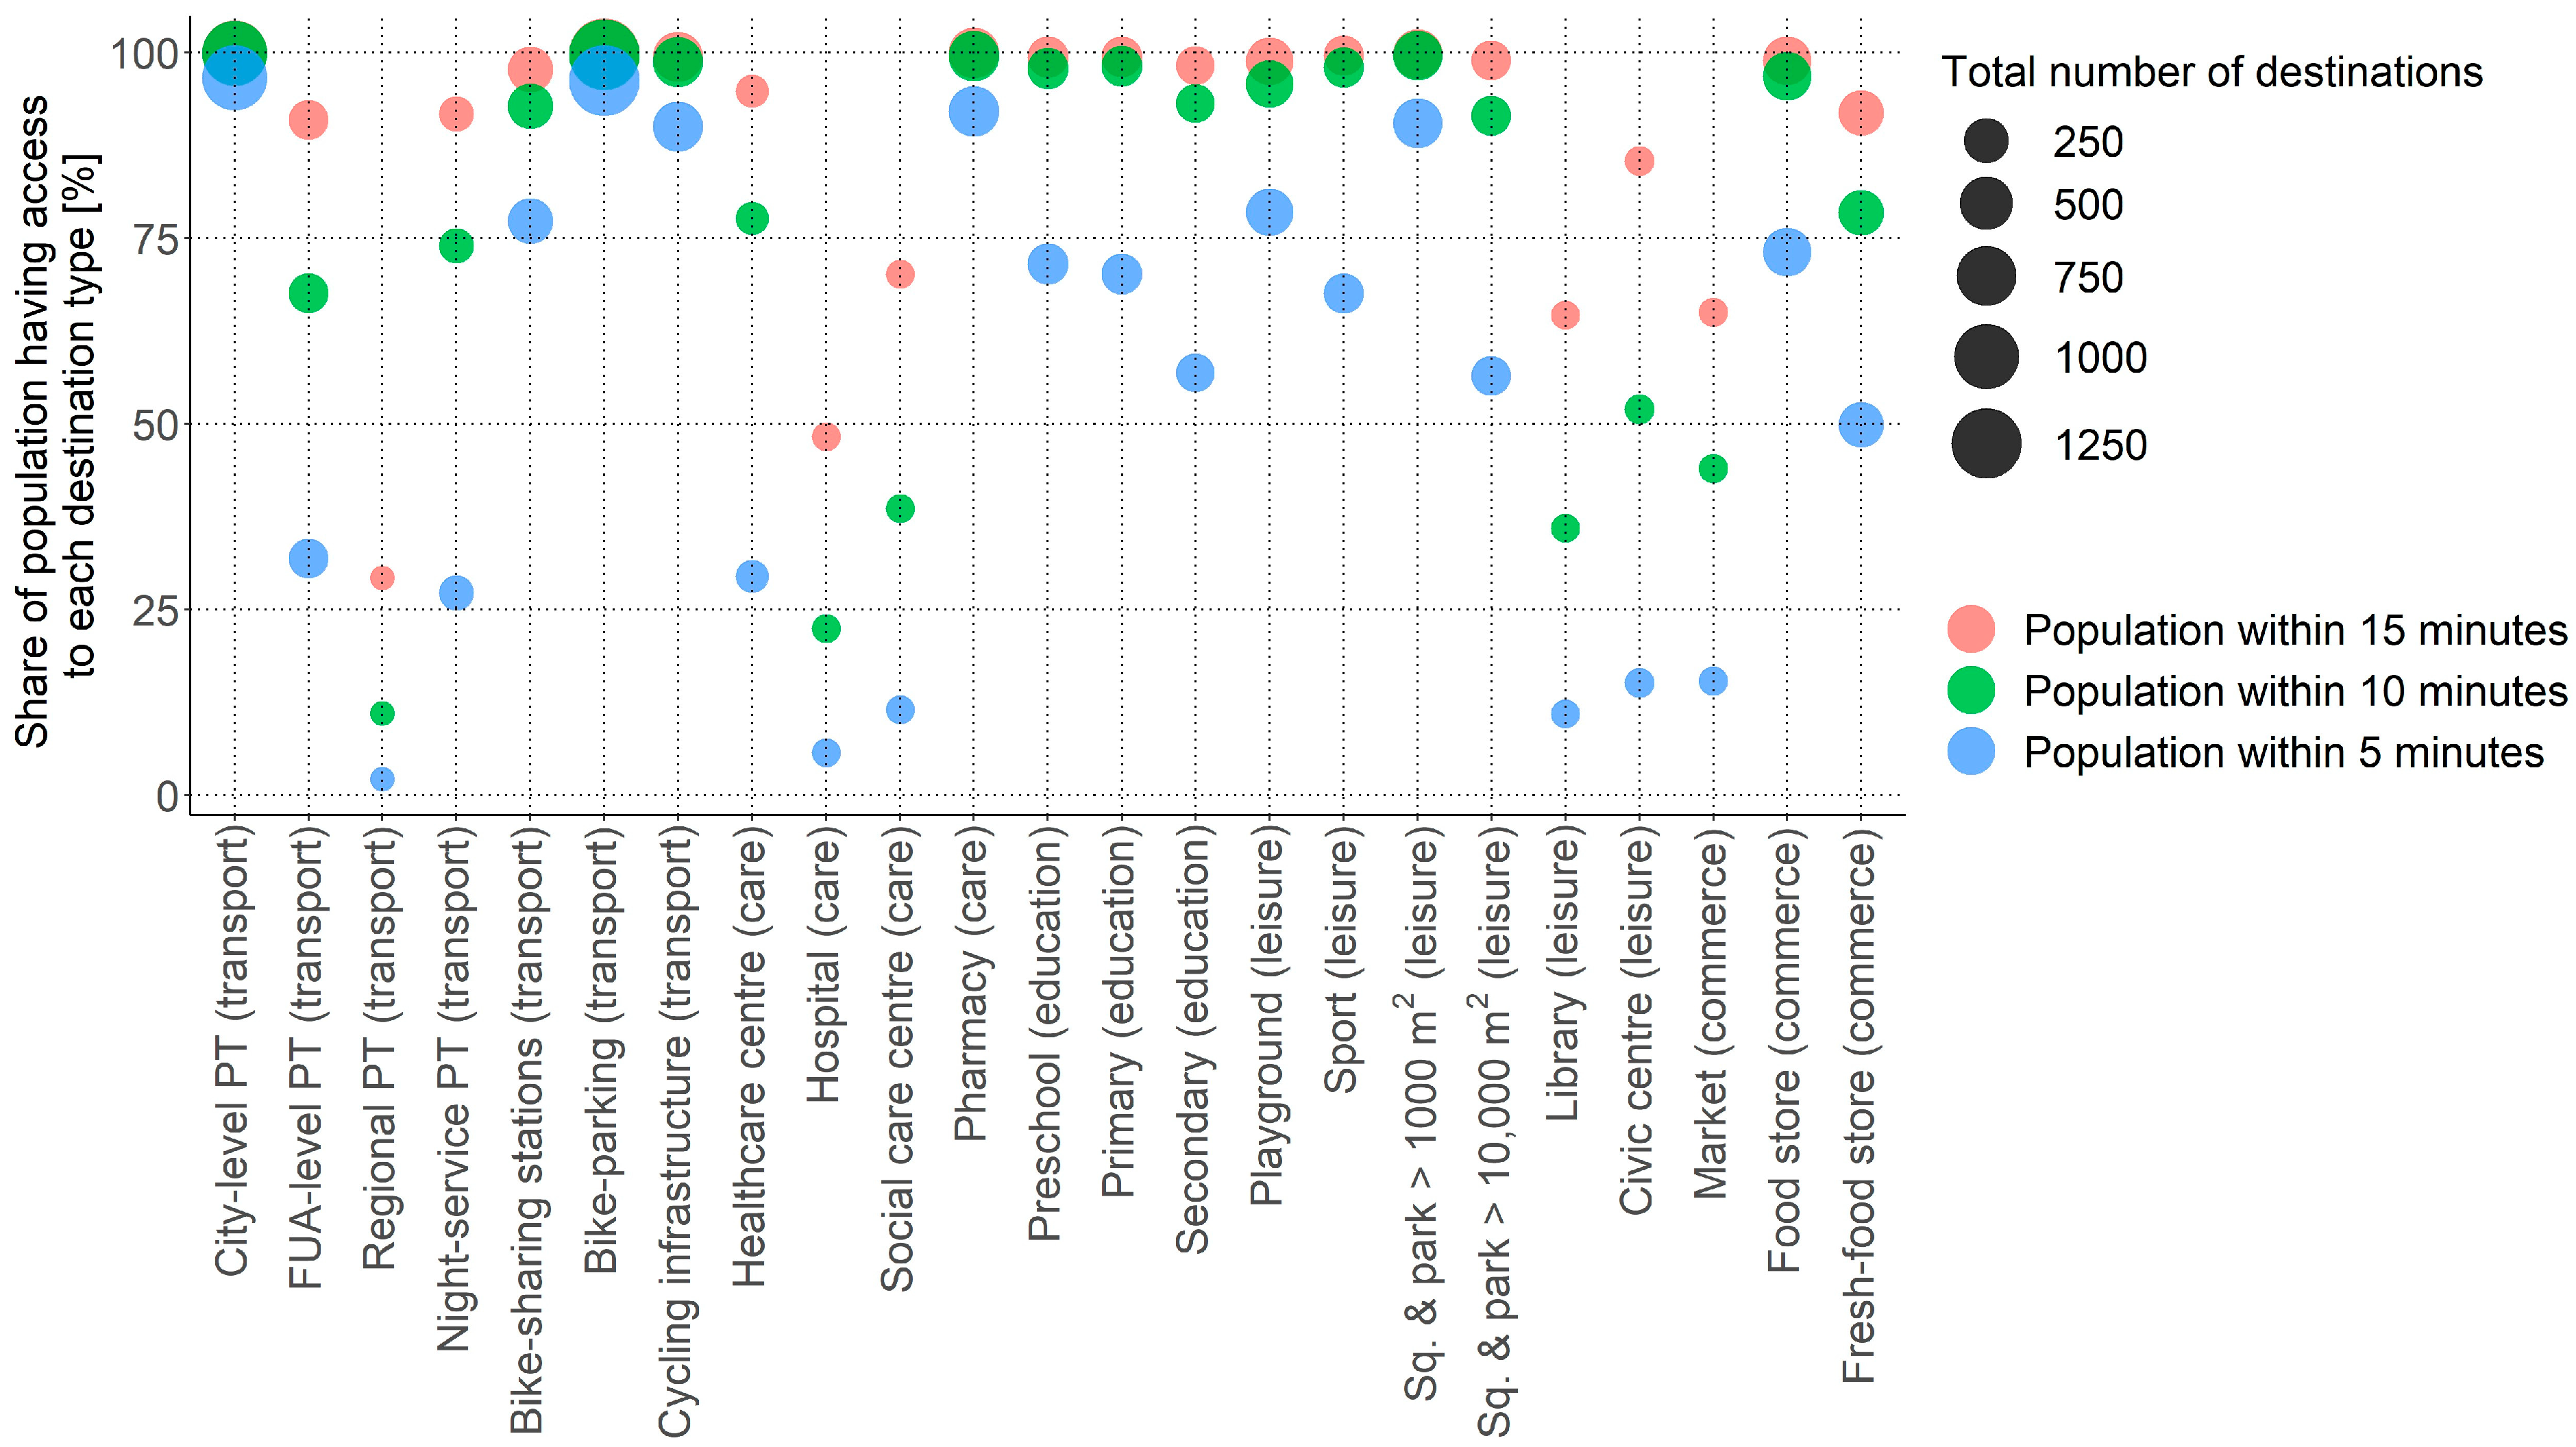
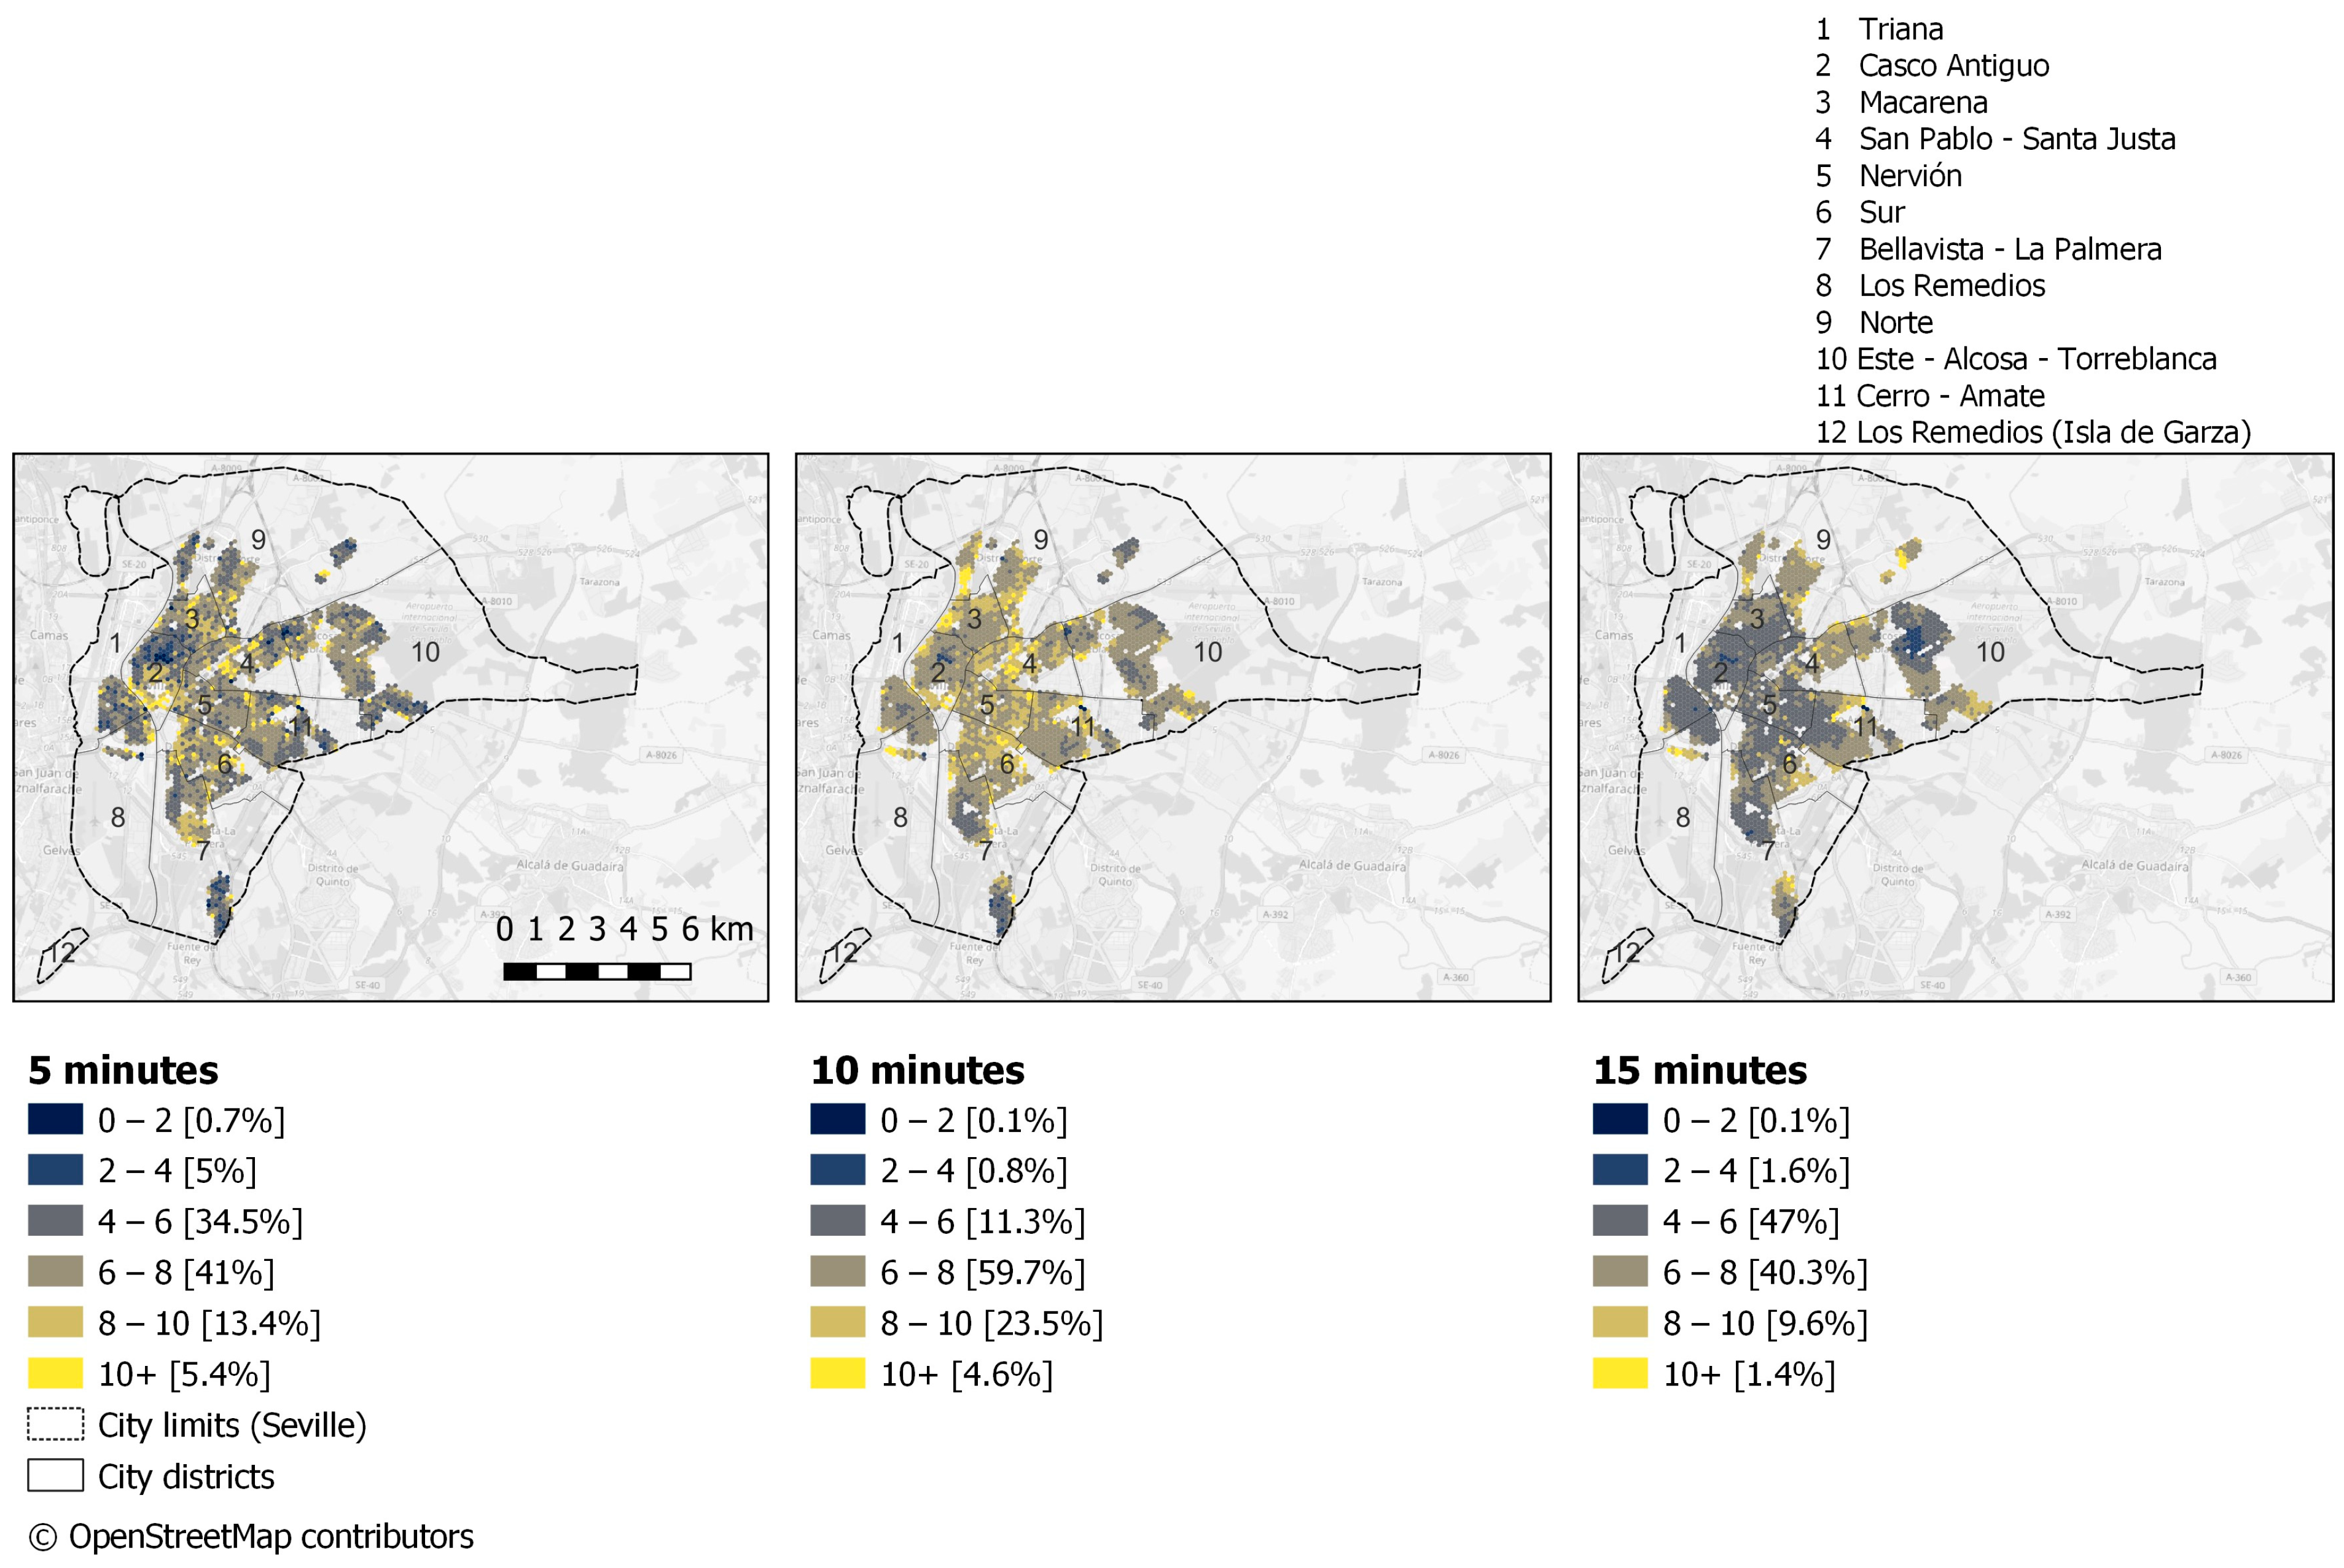
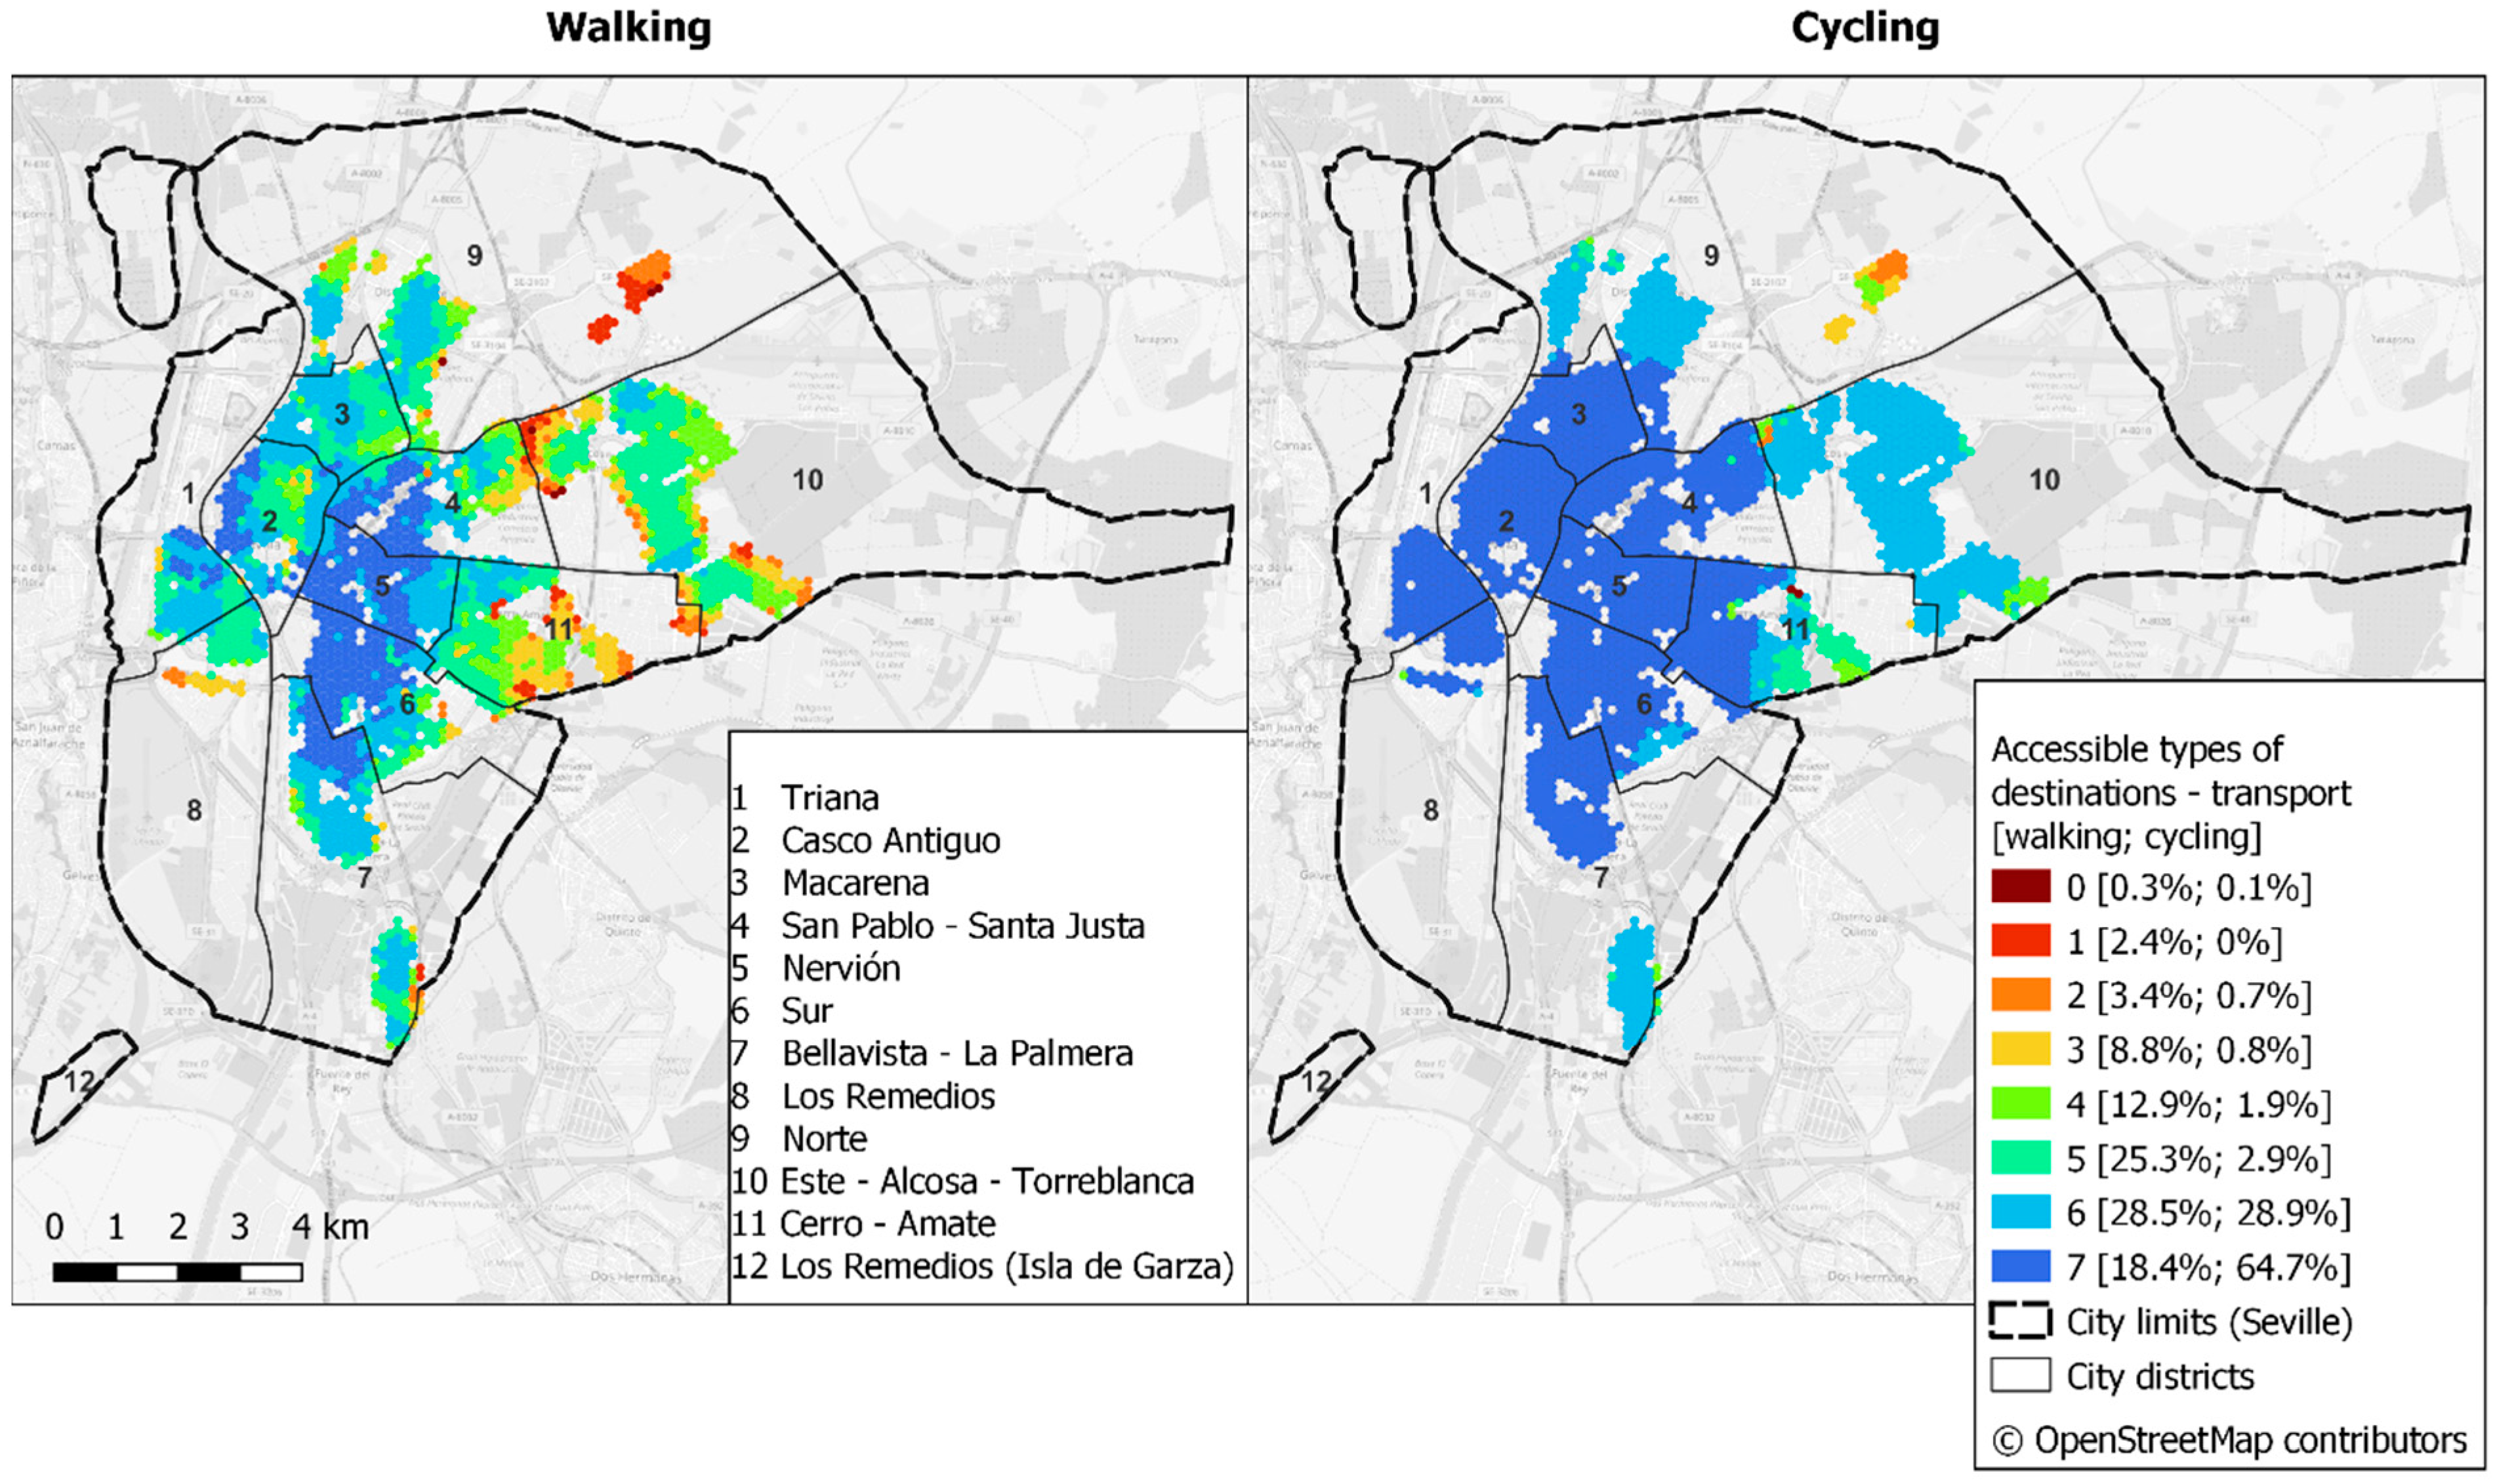
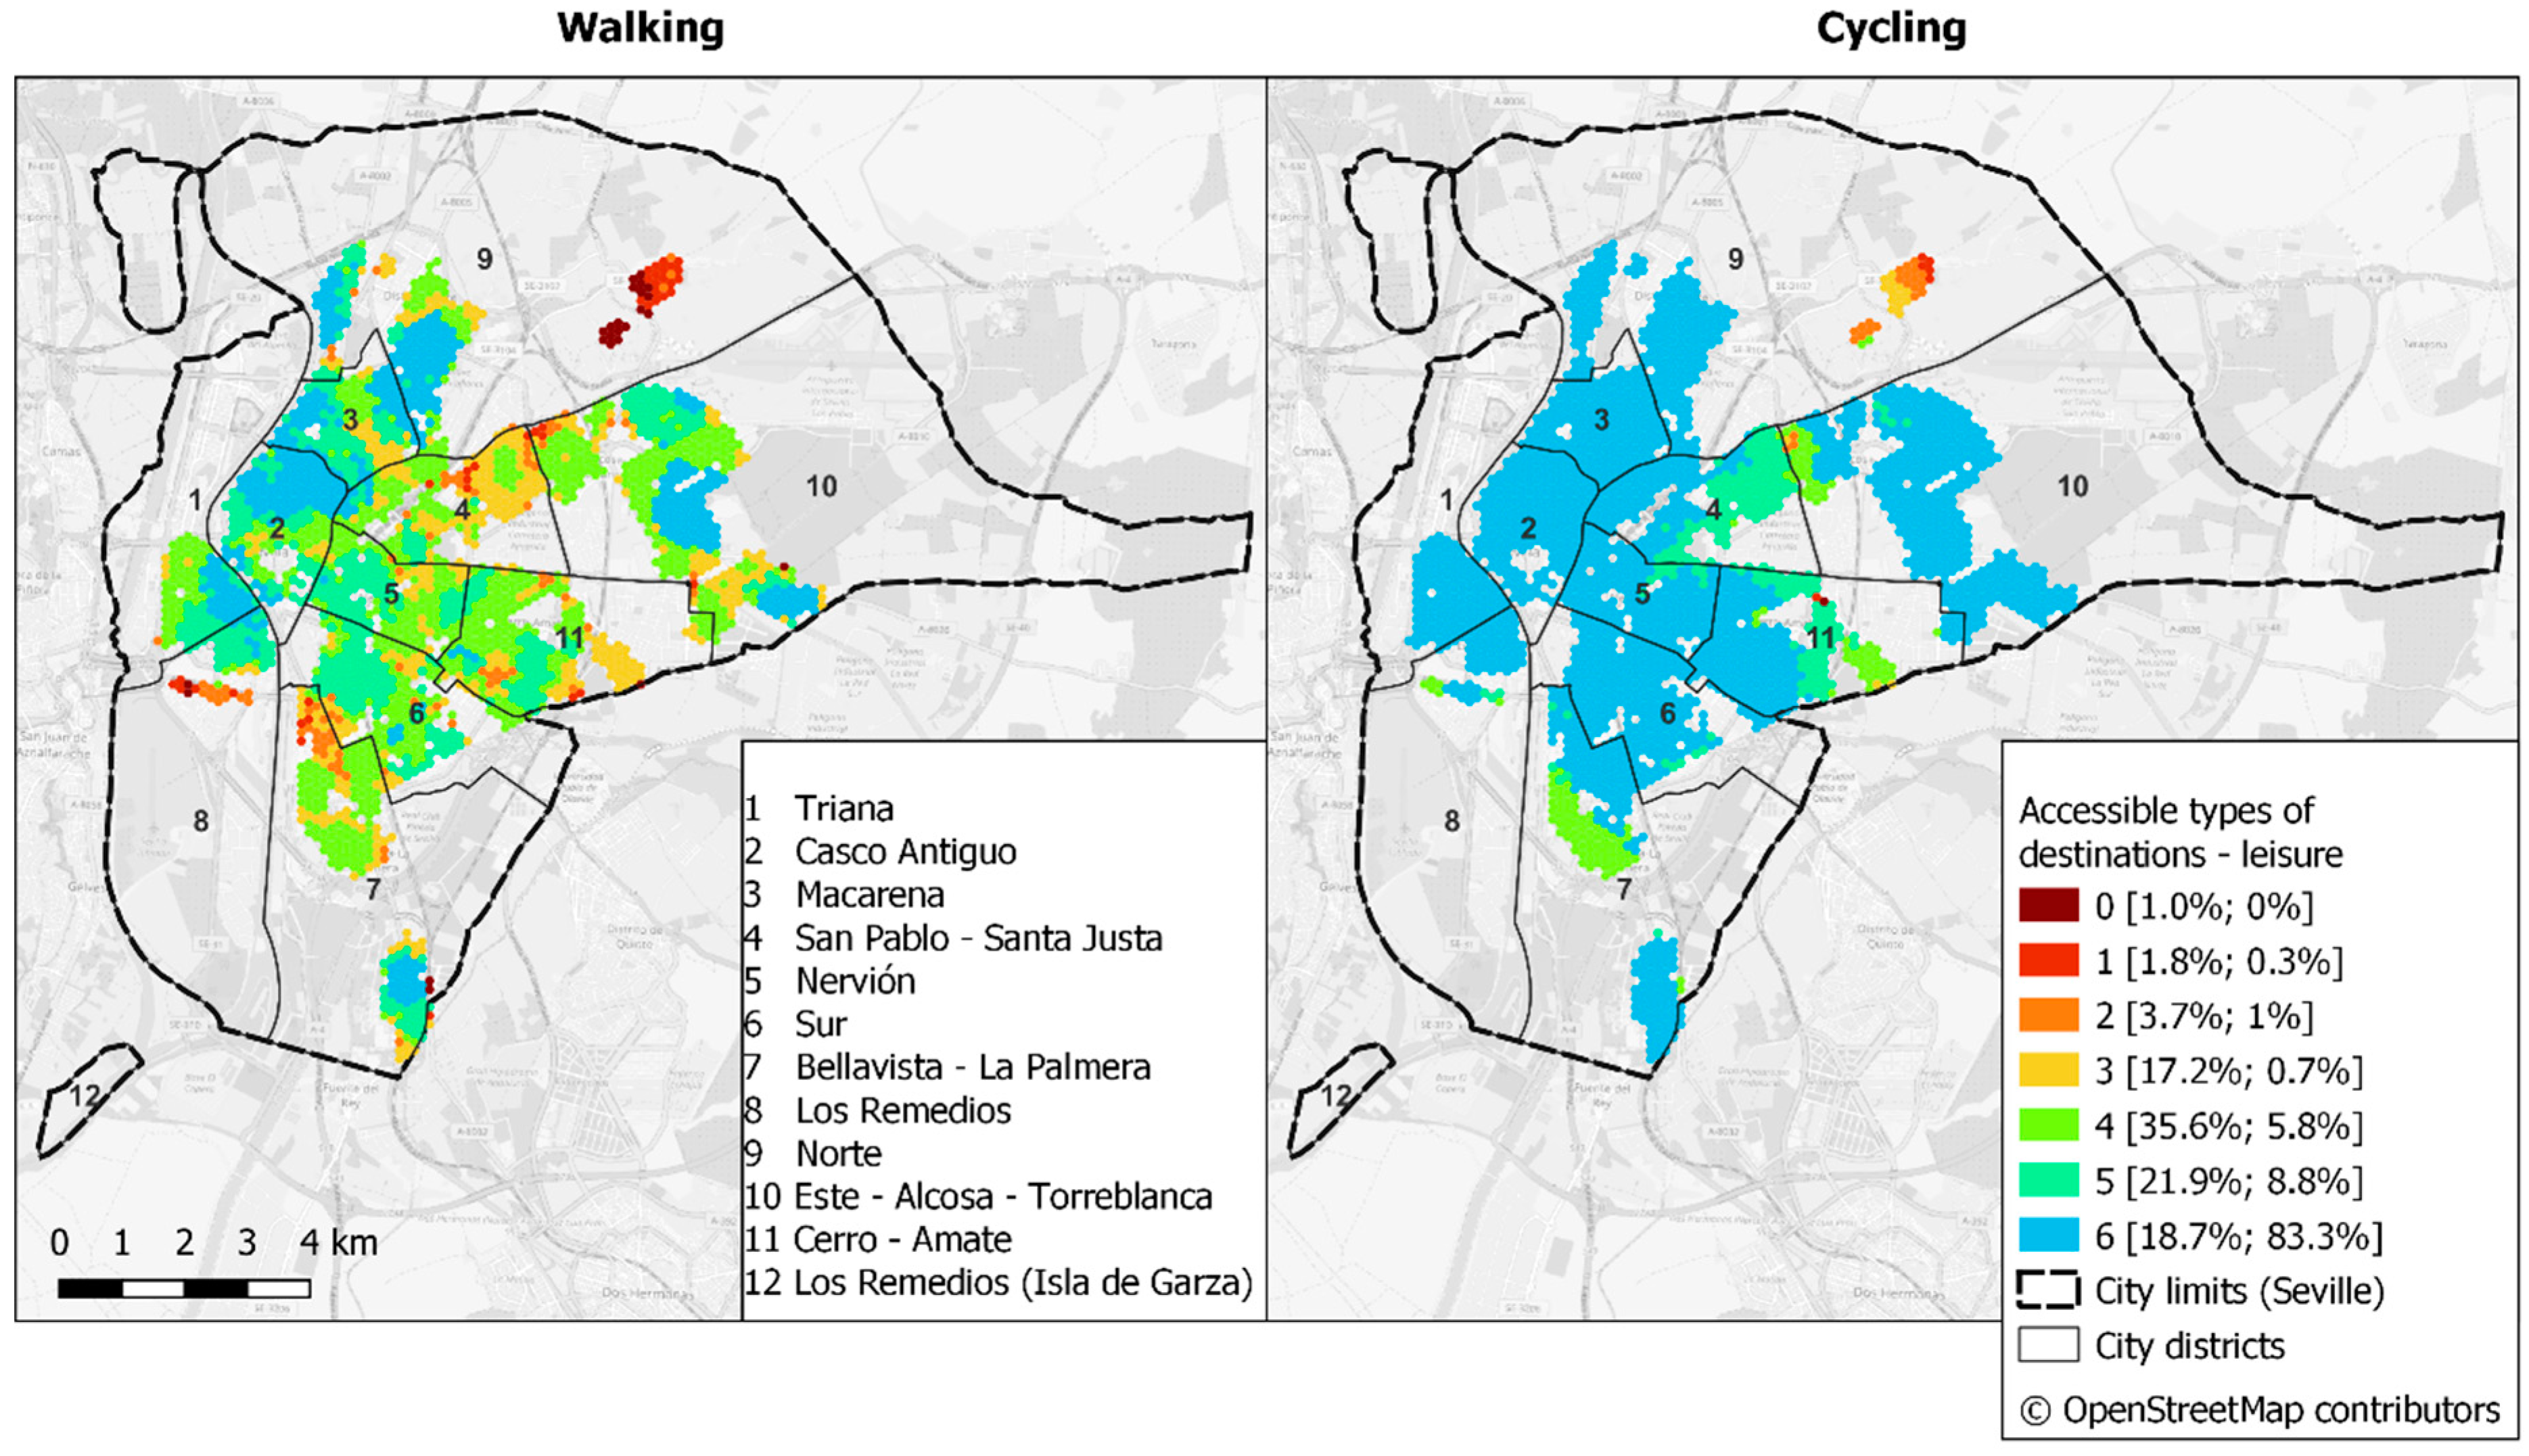
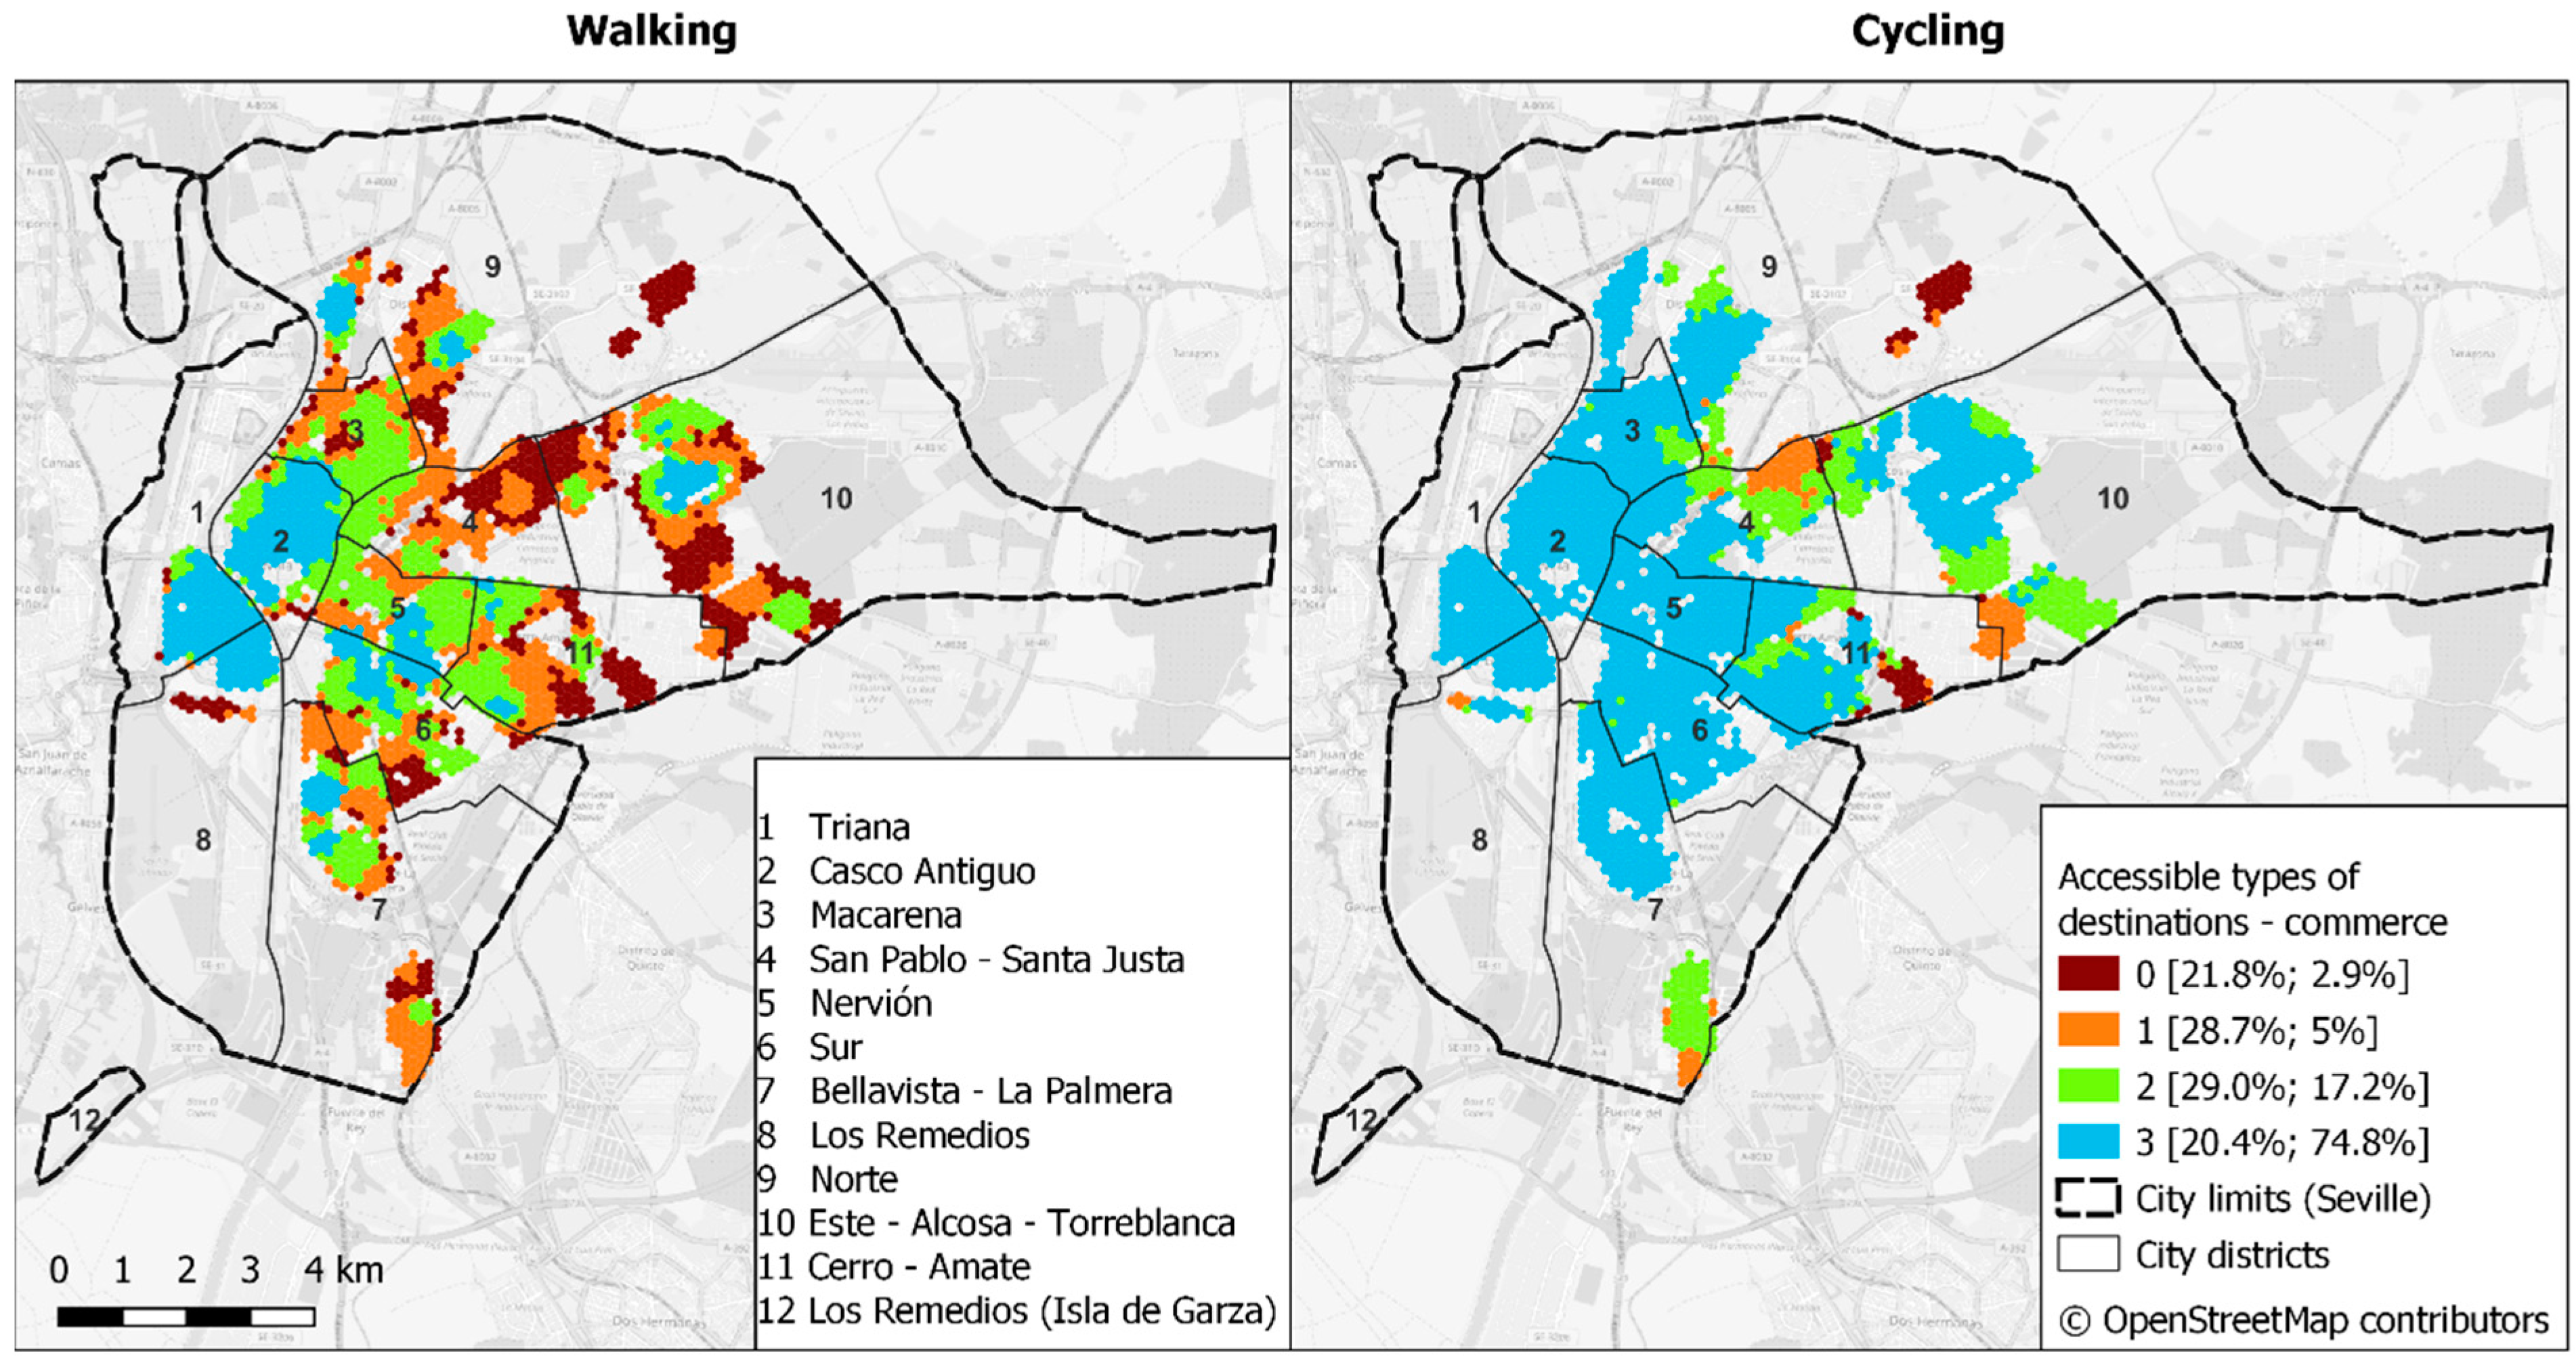
5.1. Share of the Population within Reach
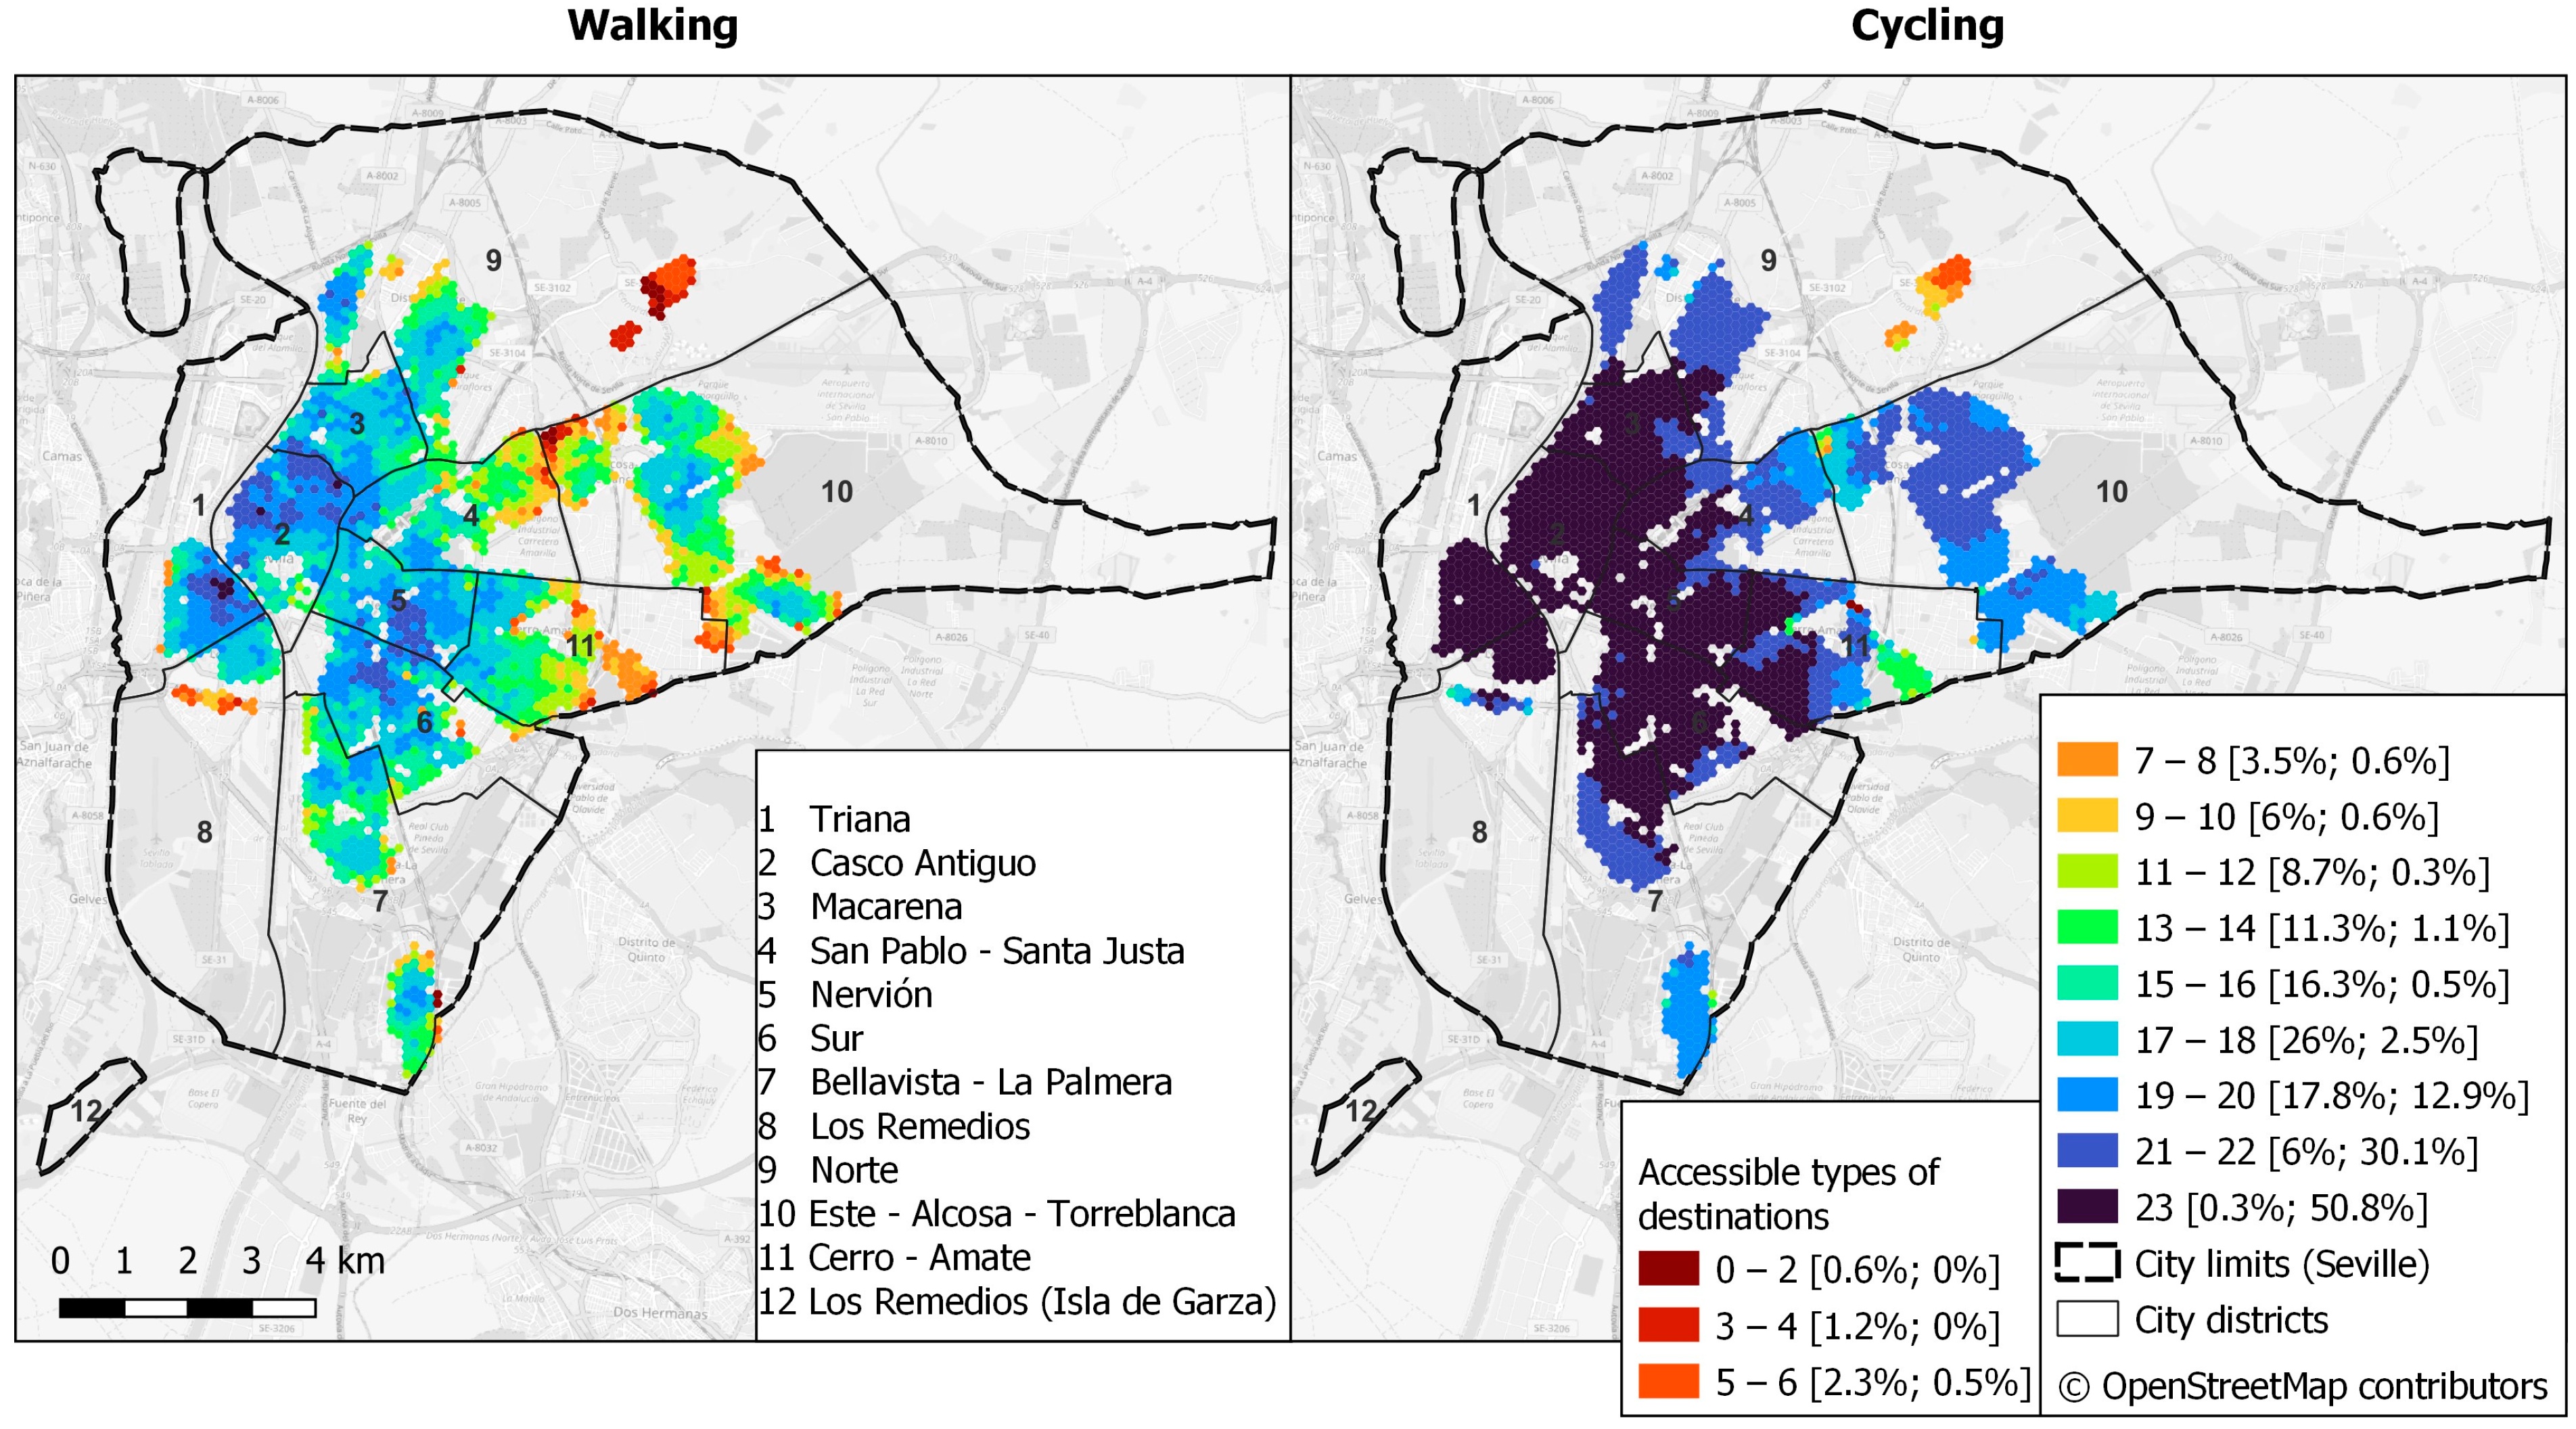
5.2. Spatial Representation of the Results
6. Discussion on the Limitations
7. Conclusions
Author Contributions
Funding
Data Availability Statement
Acknowledgments
Conflicts of Interest
Appendix A
| Location | Source | Comment | Destination Categories and Destinations | ||||||
|---|---|---|---|---|---|---|---|---|---|
| Living and Transport | Working | Commerce and Catering | Healthcare | Education | Entertainment, Leisure | [Other] | |||
| - | [1,12] | theoretical framework of the 15-minute city concept (predominantly descriptive requirements are listed for each category) | housing, energy, environment, facilities, transportation | atmosphere, access, diversification, services | eating, non-food purchase, public services | access to care, prevention, emergency, living environment, well-being, sport, pollutions | access, availability, accessibility, performance, guidance | holidays, culture, entertainment, associations | |
| Tempe, Arizona, US | [50] | 20 min accessibility assessment | -parks (parks, dog parks, and preserves) | -grocery stores -retail goods/services (pharmacy/drug stores, hardware stores, bike shops, shopping districts, and convenience stores) -restaurants -civic institutions (city offices/facilities, fire stations, and police stations) -services (banks, post offices, beauty salons/barber shops, and laundries/cleaners) | -health services | schools (day care, K–12 (from kindergarten to 12th grade), and higher education) | -festivals and special-event spaces (stadiums, theaters, concert halls, and other festival and special-event venues) -city recreational and cultural amenities (community centres, museums, libraries, public art, aquatic centres, gardens, zoos, and “points of pride”) -fitness centres | faith-based organisations (houses of worship and faith-based community services) | |
| Melbourne, Australia | [98] | 20-minute neighbourhoods | -bus stops -train stations -tram stops | -ATMs or banks -bars, pubs, and nightclubs -dine-in places (café, fast food, food court, restaurant) -post offices -pharmacies -shopping centres | -aged care -health facilities, including dental -maternal and child health centres | -childcare centres -kindergartens -primary schools -secondary schools | -community centres -neighbourhood parks -libraries -playgrounds | places of worship (church, mosque) | |
| Melbourne, Australia | [99] | part of the long-term development plan of the city | -safe streets and spaces -affordable housing options -ability to age in place -housing diversity -transport: walkability, safe cycling network, local public transport | -well connected to public transport -local employment opportunities | -local shopping centres | -local health facilities and services | -local schools -lifelong learning opportunities | -local playgrounds and parks -green streets and spaces -community gardens -sport and recreation facilities | |
| Barcelona, Spain | [29] | 15-minute accessibility | -collective rapid transit [10 min] -day buses [5 min] -night buses [10 min] -shared bike stations [5 min] -bike lanes [5 min] | -supermarkets [10 min] -markets [10 min] -fresh food [5 min] -daily non-food [5 min] -catering [5 min] miscellaneous services [5 min] | -health [10 min] -social services [15 min] -day centres [10 min] | -preschool education [5 min] -primary education [5 min] -secondary education [10 min] | -shows [10 min] -libraries [15 min] -civic centres [10 min] -children’s playgrounds [5 min] -sports facilities [10 min] -squares and parks > 1000 m2 [5 min] -squares and parks > 10,000 m2 [5 min] | ||
| Malaga, Spain | [31] | 15-minute accessibility | -bus stops [300 m] -metro stops [500 m] -bike lanes [300 m] | -grocery shops [300 m] -markets [500 m] | -health centres [500 m] -hospitals [1000 m] -social centres [500 m] | -kindergartens [300 m] -elementary schools [300 m] -secondary schools [500 m] | -playgrounds [300 m] -green areas between 1000 and 5000 m2 [500 m] -green areas over 10,000 m2 [900 m] -sports centres [500 m] -cultural centres [500 m] | ||
| Valencia, Spain | [87] | spatial plan defining the optimal density of various urban functions | -health centres [600 m] -social centres [900 m] -senior centres [600 m] -day-care centres [900 m] -youth centres [900 m] | -kindergartens [300 m] -elementary schools [300 m] -secondary schools [600 m] | -cultural centres, libraries [900 m] -minor sports centre [750–1000 m] -major sports centres [2000 m] | ||||
| Ireland | [27] | analysis of 5 cities in Ireland | -bus stops and stations -light-rail stations -train stations -safe pedestrian networks -safe cycling networks -active travel facilities -bicycle- and scooter-sharing stations -car-sharing schemes -assisted-mobility services | -offices -co-working hubs -workshops and factories -institutions, facilities, and services -remote/online jobs -field jobs and jobs in the community -building and construction sites -print shops and tech support -banks and post offices (supporting) | -grocery shops -markets -supermarkets -places selling healthy meals -cafés, pubs, and restaurants -shops and retail stores -post offices and newsagents | -health centres and GPs -dentists -pharmacies -physical and mental therapy centres -childcare centres and nurseries -senior care and nursing homes -community support -legal and financial support | -primary schools -secondary schools -third-level institutions -special-needs schools -libraries -online courses (and online access) -community classes -educational environments -skill hubs | -parks and green spaces -sports grounds and gyms -playgrounds -theatres and cinemas -museums and art galleries -hotels and tourism destinations | -allotments -community gardens -community kitchens -food banks -open orchards -faith groups and places of worship |
| Liverpool City region, UK | [55] | equity analysis | -buses (bus stops) -trains (railway stations, junctions, and halts) | -specialised food shops (bakeries, butchers, confectioners, delicatessens, fishmongers, tea and coffee, merchants, herbs and spices, grocers, farm shops, and pick-your-own farms) -general food shops (supermarkets) | -doctors -health products (chemists and pharmacies) | first, primary, and infant schools | -sporting facilities (sports complexes) -public parks -recreational spaces -places of cultural and entertaining activities (cinemas, nightclubs, social clubs, theatres, and concert halls) | -places of worship | |
| Milan, Italy | [39] | 15-minute city analysis | -food/grocery stores -commercial stores (including clothes shops, electronics shops, etc.) -restaurants -other (post offices, banks, etc.) | -health facilities | -educational facilities | -cultural venues -parks and green spaces -sports facilities | |||
| Turin, Italy | [53] | 15-minute city analysis | -post offices -open-air markets | -neighbourhood health centres -counselling centres -social care services -registry offices | -nurseries -kindergartens -elementary schools -middle schools -secondary schools | -green areas -playgrounds -playrooms -sports facilities (swimming pools, tennis courts, etc.) -libraries -theatres -cinemas | -police stations -churches | ||
| Toruń, Poland | [100] | 15-minute city analysis | Multiple tags from OSM | ||||||
| Spain | [83] | Spanish Urban Agenda | -road space for pedestrians, bicycles and PT [target not defined] -ISDG 11 indicator: access to PT [target not defined] | everyday food and products: -supply of basic foods [300 m] -municipal markets [500 m] | medical centres: -health centres [500 m] -hospitals [1000 m] social centres: -community social service centres and day centres for seniors [500 m] | Schools: -children’s school [300 m] -primary schools [300 m] -secondary schools [500 m] | sports centres: -sports facilities for public use [500 m] cultural centres: -public libraries, museums, and other cultural centres [500 m] Entertainment centres: -cinemas, theatres, and other leisure centres [500 m] Green urban spaces or leisure areas: -green/recreation > 1000 m2 [300 m] -green/recreation > 5000 m2 [500 m] -green/recreation > 1 Ha [900 m] | separate waste collection points: -points for separate waste collection (organic, paper, glass and plastic) [100 m] | |
| Seville, Spain | [89] | Special Plan for Environmental Sustainability Indicators of Urban Development Activies in Seville | -public transport stops [300 m] -cycling networks [300 m] -bike parking [300 m] | -municipal markets [10 min] | -healthcare centres [10 min] -social care services [10 min] | -pre-school education [5 min] -primary education [5 min] -secondary education [10 min] | -civic centres [5 min] -libraries [10 min] -municipal sports facilities [10 min] | -urban complexity -mixed functions in residential areas (commerce, services) -mixed use on ground floor areas (services, commerce) -pedestrian streets | |
| Florence, Italy | [57] | comprehensive 15-minute city index | -housing viability -government services -safety services -culture and cults services -environmental quality -slow-mobility services -fast-mobility services -sport services | economy and sustainability | food services | health services | education services | entertainment services | |
| Oslo, Norway | [54] | 15-minute city analysis (15-minute walking catchment) | -bank buildings, post offices -shopping centres -shops, commercial buildings -restaurants, fast food, food courts -bakeries -cafés -supermarkets, convenience stores, kiosks | -hospitals -clinics, doctor’s offices, medical centres, emergency, animal hospitals -health centres, health stations -dental clinics -pharmacies | schools, kindergartens | -libraries -playgrounds -museums, art galleries -sports halls -indoor ice rinks -swimming pools -gyms -cinemas, theatres, opera, concert halls -green spaces | |||
| 121 European urban areas | [61] | 15-minute city index based the new urban accessibility framework (ITF, 2019) | -food shops -restaurants | -hospitals | -schools | -recreation -green spaces | |||
| Barcelona, Spain | [45] | 15-minute city analysis and mobility flows | -public transport (bus stops, metro stations, bike stations, etc.) | -finance (banks and similar) -food (restaurants, bars, cafes, etc.) -retail (malls, supermarkets, shopping venues) | -health facilities (hospitals, primary care centres, medical offices, etc.) | -education (schools, universities, etc.) | -entertainment (indoor places where people pay for access) -recreational areas (parks, outdoors, etc.) | -government facilities -professional services -religious venues | |
| Bogotá, Columbia | [60] | 15-minute city index (diversity, walkability, accessibility, individual preferences) | -bus stops -BRT stations -bike sharing -cable car stations | -grocery shops -commerce -restaurants -drugstores -hairdressing -laundry services -bars -clothing stores -banks | -medical services -hospitals | -vocational training -preschools -schools -universities | -parks (>5000 m2) -sport venues -cultural venues | -veterinaries | |
| Ferrera, Italy | [58] | 15-minute city index for Italian cities based on OSM data | -grocery shops (15+ related OSM features) -post offices and banks -catering -shops (50+ related OSM features) | -health | -education (all levels, including language schools and other specialised schools) | -entertainment (10+ related OSM features) -parks | |||
Appendix B

Appendix C
Appendix D

References
- Moreno, C.; Allam, Z.; Chabaud, D.; Gall, C.; Pratlong, F. Introducing the “15-Minute City”: Sustainability, Resilience and Place Identity in Future Post-Pandemic Cities. Smart Cities 2021, 4, 93–111. [Google Scholar] [CrossRef]
- Data Catalog. Available online: https://datacatalog.worldbank.org/home (accessed on 15 September 2024).
- U.N.H.S. Programme. World Cities Report 2020: The Value of Sustainable Urbanization; UN-HABITAT: Nairobi, Kenya, 2020. [Google Scholar] [CrossRef]
- El Acuerdo de París|CMNUCC. Available online: https://unfccc.int/es/acerca-de-las-ndc/el-acuerdo-de-paris (accessed on 15 September 2024).
- EUR-Lex-52019DC0640-EN-EUR-Lex. Available online: https://eur-lex.europa.eu/legal-content/EN/TXT/?qid=1588580774040&uri=CELEX:52019DC0640 (accessed on 15 September 2024).
- EUR-Lex-52021DC0811-EN-EUR-Lex. Available online: https://eur-lex.europa.eu/legal-content/EN/TXT/?uri=COM%3A2021%3A811%3AFIN (accessed on 15 September 2024).
- Regulation-2021/1119-EN-EUR-Lex. Available online: https://eur-lex.europa.eu/eli/reg/2021/1119/oj (accessed on 15 September 2024).
- Climate-Neutral and Smart Cities-European Commission. Available online: https://research-and-innovation.ec.europa.eu/funding/funding-opportunities/funding-programmes-and-open-calls/horizon-europe/eu-missions-horizon-europe/climate-neutral-and-smart-cities_en (accessed on 15 September 2024).
- Nieuwenhuijsen, M.J. Urban and Transport Planning Pathways to Carbon Neutral, Liveable and Healthy Cities; A Review of the Current Evidence. Environ. Int. 2020, 140, 105661. [Google Scholar] [CrossRef] [PubMed]
- Ahfeldt, G.M.; Pietrostefani, E. The Compact City in Empirical Research: A Quantitative Literature Review; LSE Research Online Documents on Economics; Spatial Economics Research Centre (SERC): London, UK, 2017; Available online: https://eprints.lse.ac.uk/83638/1/sercdp0215.pdf (accessed on 17 September 2024).
- Defining the 15-Minute City|CNU. Available online: https://www.cnu.org/publicsquare/2021/02/08/defining-15-minute-city (accessed on 15 September 2024).
- Urban Proximity and the Love for Places Chrono-Urbanism, Chronotopia, Topophilia by Carlos Moreno *-Carlos Moreno. Available online: https://www.moreno-web.net/urban-proximity-and-the-love-for-places-chrono-urbanism-chronotopia-topophilia-by-carlos-moreno/ (accessed on 15 September 2024).
- Ascher, F. Du Vivre En Juste à Temps Au Chrono-Urbanisme. Ann. Rech. Urbaine 1997, 77, 112–122. [Google Scholar] [CrossRef]
- Allam, Z.; Bibri, S.E.; Chabaud, D.; Moreno, C. The ‘15-Minute City’ Concept Can Shape a Net-Zero Urban Future. Humanit. Soc. Sci. Commun. 2022, 9, 126. [Google Scholar] [CrossRef]
- Jacobs, J. The Death and Life of Great American Cities; Random House: New York, NY, USA, 2016. [Google Scholar]
- Hosford, K.; Beairsto, J.; Winters, M. Is the 15-Minute City within Reach? Evaluating Walking and Cycling Accessibility to Grocery Stores in Vancouver. Transp. Res. Interdiscip. Perspect. 2022, 14, 100602. [Google Scholar] [CrossRef]
- Perry, C. The Neighborhood Unit: From the Regional Plan of New York and Its Environs (1929). In The City Reader; Routledge: Abingdon-on-Thames, UK, 2020; pp. 557–569. [Google Scholar] [CrossRef]
- What Is New Urbanism?|CNU. Available online: https://www.cnu.org/resources/what-new-urbanism (accessed on 15 September 2024).
- Alberti, F.; Radicchi, A. From the Neighbourhood Unit to the 15-Minute City. Past and Recent Urban Models for Post-COVID Cities. In Urban and Transit Planning. Advances in Science, Technology & Innovation; Springer: Cham, Switzerland, 2023; pp. 159–170. [Google Scholar] [CrossRef]
- Gehl, J. Cities for People; Island Press: Washington, DC, USA, 2010; p. 288. [Google Scholar]
- Di Marino, M.; Tomaz, E.; Henriques, C.; Chavoshi, S.H. The 15-Minute City Concept and New Working Spaces: A Planning Perspective from Oslo and Lisbon. Eur. Plan. Stud. 2023, 31, 598–620. [Google Scholar] [CrossRef]
- Pozoukidou, G.; Angelidou, M. Urban Planning in the 15-Minute City: Revisited under Sustainable and Smart City Developments until 2030. Smart Cities 2022, 5, 1356–1375. [Google Scholar] [CrossRef]
- Büttner, B.; Seisenberger, S.; Baquero Larriva, M.T.; Rivas De Gante, A.G.; Haxhija, S.; Ramirez, A.; McCormick, B.; Atanova, A. Urban Mobility Next 9 ±15-Minute City: Human-Centred Planning in Action. 2022. Available online: https://www.eiturbanmobility.eu/wp-content/uploads/2022/11/EIT-UrbanMobilityNext9_15-min-City_144dpi.pdf (accessed on 17 September 2024).
- Papadopoulos, E.; Sdoukopoulos, A.; Politis, I. Measuring Compliance with the 15-Minute City Concept: State-of-the-Art, Major Components and Further Requirements. Sustain. Cities Soc. 2023, 99, 104875. [Google Scholar] [CrossRef]
- Lu, M.; Diab, E. Understanding the Determinants of X-Minute City Policies: A Review of the North American and Australian Cities’ Planning Documents. J. Urban Mobil. 2023, 3, 100040. [Google Scholar] [CrossRef]
- Paris Mayor Unveils “15-Minute City” Plan in Re-Election Campaign|Paris|the Guardian. Available online: https://www.theguardian.com/world/2020/feb/07/paris-mayor-unveils-15-minute-city-plan-in-re-election-campaign (accessed on 15 September 2024).
- Hassell|Close to Home–Exploring 15-Minute Urban Living in Ireland (and Beyond). Available online: https://www.hassellstudio.com/research/close-to-home-exploring-15-minute-urban-living-in-ireland-and-beyond (accessed on 15 September 2024).
- City of Ottawa 15-MINUTE NEIGHBOURHOODS BASELINE REPORT City of Ottawa Planning, Infrastructure and Economic Development. 2021. Available online: https://engage.ottawa.ca/the-new-official-plan/news_feed/15-minute-neighbourhoods (accessed on 17 September 2024).
- Ferrer-ortiz, C.; Marquet, O.; Mojica, L.; Vich, G. Barcelona under the 15-Minute City Lens: Mapping the Accessibility and Proximity Potential Based on Pedestrian Travel Times. Smart Cities 2022, 5, 146–161. [Google Scholar] [CrossRef]
- Ladra, S. Madrid, Ciudad De Los 15 Minutos; Lengua de Trapo: Madrid, Spain, 2022. [Google Scholar]
- Marin-Cots, P.; Palomares-Pastor, M. En Un Entorno de 15 Minutos: Hacia La Ciudad de Proximidad, y Su Relación Con El COVID-19 y La Crisis Climática, El Caso de Málaga. Ciudad. Y Territ. Estud. Territ. 2020, 52, 685–700. [Google Scholar] [CrossRef]
- Sevilla y París Trabajan Juntas Bajo El Plan “Ciudad En 15 Minutos”|Sevilla Actualidad. Available online: https://www.sevillaactualidad.com/sevilla/191255-sevilla-y-paris-trabajan-juntas-bajo-el-plan-ciudad-en-15-minutos/ (accessed on 15 September 2024).
- Levinson, D.M. The 30-Minute City: Designing for Access; Network Design Lab: Sydney, Australia, 2019; 113p, Available online: https://ses.library.usyd.edu.au/handle/2123/21630 (accessed on 17 September 2024).
- The Portland Plan|Portland.Gov. Available online: https://www.portland.gov/bps/planning/about-bps/portland-plan (accessed on 16 September 2024).
- 20-Minute Neighborhood|Eugene, OR Website. Available online: https://www.eugene-or.gov/506/20-Minute-Neighborhood# (accessed on 16 September 2024).
- Plan Melbourne 2017–2050. Available online: https://www.planning.vic.gov.au/guides-and-resources/strategies-and-initiatives/plan-melbourne (accessed on 16 September 2024).
- Future Transport. Available online: https://www.future.transport.nsw.gov.au/ (accessed on 16 September 2024).
- Logan, T.M.; Hobbs, M.H.; Conrow, L.C.; Reid, N.L.; Young, R.A.; Anderson, M.J. The X-Minute City: Measuring the 10, 15, 20-Minute City and an Evaluation of Its Use for Sustainable Urban Design. Cities 2022, 131, 103924. [Google Scholar] [CrossRef]
- Abdelfattah, L.; Deponte, D.; Fossa, G. The 15-Minute City: Interpreting the Model to Bring out Urban Resiliencies. Transp. Res. Procedia 2022, 60, 330–337. [Google Scholar] [CrossRef]
- How to Build Back Better with a 15-Minute City. Available online: https://www.c40knowledgehub.org/s/article/How-to-build-back-better-with-a-15-minute-city?language=en_US (accessed on 15 September 2024).
- Manifiesto por la Reorganización de la Ciudad Tras El Covid19%. Available online: https://manifiesto.perspectivasanomalas.org/en/manifiesto-2/ (accessed on 15 September 2024).
- Allam, Z.; Nieuwenhuijsen, M.; Chabaud, D.; Moreno, C. The 15-Minute City Offers a New Framework for Sustainability, Liveability, and Health. Lancet Planet Health 2022, 6, e181–e183. [Google Scholar] [CrossRef] [PubMed]
- Physical Activity through Sustainable Transport Approaches|Pasta|Project|Fact Sheet|FP7|CORDIS|European Commission. Available online: https://cordis.europa.eu/project/id/602624 (accessed on 15 September 2024).
- Brand, C.; Dons, E.; Anaya-Boig, E.; Avila-Palencia, I.; Clark, A.; de Nazelle, A.; Gascon, M.; Gaupp-Berghausen, M.; Gerike, R.; Götschi, T.; et al. The Climate Change Mitigation Effects of Daily Active Travel in Cities. Transp. Res. D Transp. Environ. 2021, 93, 102764. [Google Scholar] [CrossRef]
- Graells-Garrido, E.; Serra-Burriel, F.; Rowe, F.; Cucchietti, F.M.; Reyes, P. A City of Cities: Measuring How 15-Minutes Urban Accessibility Shapes Human Mobility in Barcelona. PLoS ONE 2021, 16, e0250080. [Google Scholar] [CrossRef]
- Guzman, L.A.; Arellana, J.; Oviedo, D.; Moncada Aristizábal, C.A. COVID-19, Activity and Mobility Patterns in Bogotá. Are We Ready for a ‘15-Minute City’? Travel. Behav. Soc. 2021, 24, 245–256. [Google Scholar] [CrossRef]
- 15-Minute Cities: How to Ensure a Place for Everyone. Available online: https://www.c40knowledgehub.org/s/article/15-minute-cities-How-to-ensure-a-place-for-everyone?language=en_US (accessed on 15 September 2024).
- Willberg, E.; Fink, C.; Toivonen, T. The 15-Minute City for All?—Measuring Individual and Temporal Variations in Walking Accessibility. J. Transp. Geogr. 2023, 106, 103521. [Google Scholar] [CrossRef]
- Carlos, P.; Director, M.S. Urban and Territorial Transitions. Available online: https://www.eiturbanmobility.eu/wp-content/uploads/2020/06/Carlos-Moreno_15-MinuteCity_EITwebianr_25-06.pdf (accessed on 17 September 2024).
- Da Silva, D.C.; King, D.A.; Lemar, S. Accessibility in Practice: 20-Minute City as a Sustainability Planning Goal. Sustainability 2019, 12, 129. [Google Scholar] [CrossRef]
- Khavarian-Garmsir, A.R.; Sharifi, A.; Sadeghi, A. The 15-Minute City: Urban Planning and Design Efforts toward Creating Sustainable Neighborhoods. Cities 2023, 132, 104101. [Google Scholar] [CrossRef]
- Kesarovski, T.; Hernández-Palacio, F. Time, the Other Dimension of Urban Form: Measuring the Relationship between Urban Density and Accessibility to Grocery Shops in the 10-Minute City. Environ. Plan B Urban Anal. City Sci. 2023, 50, 44–59. [Google Scholar] [CrossRef]
- Staricco, L. 15-, 10- or 5-Minute City? A Focus on Accessibility to Services in Turin, Italy. J. Urban Mobil. 2022, 2, 100030. [Google Scholar] [CrossRef]
- Akrami, M.; Sliwa, M.W.; Rynning, M.K. Walk Further and Access More! Exploring the 15-Minute City Concept in Oslo, Norway. J. Urban Mobil. 2024, 5, 100077. [Google Scholar] [CrossRef]
- Calafiore, A.; Dunning, R.; Nurse, A.; Singleton, A. The 20-Minute City: An Equity Analysis of Liverpool City Region. Transp. Res. D Transp. Environ. 2022, 102, 103111. [Google Scholar] [CrossRef]
- Knap, E.; Ulak, M.B.; Geurs, K.T.; Mulders, A.; van der Drift, S. A Composite X-Minute City Cycling Accessibility Metric and Its Role in Assessing Spatial and Socioeconomic Inequalities—A Case Study in Utrecht, the Netherlands. J. Urban Mobil. 2023, 3, 100043. [Google Scholar] [CrossRef]
- Badii, C.; Bellini, P.; Cenni, D.; Chiordi, S.; Mitolo, N.; Nesi, P.; Paolucci, M. Computing 15MinCityIndexes on the Basis of Open Data and Services. In Lecture Notes in Computer Science (including Subseries Lecture Notes in Artificial Intelligence and Lecture Notes in Bioinformatics); Springer International Publishing: Manhattan, NY, USA, 2021. [Google Scholar] [CrossRef]
- Olivari, B.; Cipriano, P.; Napolitano, M.; Giovannini, L. Are Italian Cities Already 15-Minute? Presenting the Next Proximity Index: A Novel and Scalable Way to Measure It, Based on Open Data. J. Urban Mobil. 2023, 4, 100057. [Google Scholar] [CrossRef]
- Liu, D.; Kwan, M.P.; Wang, L.; Kan, Z.; Wang, J.; Huang, J. Development of a Chrono-Urbanism Status Composite Index under the 5/10/15-Minute City Concept Using Social Media Big Data. Tijdschr. Voor Econ. Soc. Geogr. 2024, 115, 554–570. [Google Scholar] [CrossRef]
- Guzman, L.A.; Oviedo, D.; Cantillo-Garcia, V.A. Is Proximity Enough? A Critical Analysis of a 15-Minute City Considering Individual Perceptions. Cities 2024, 148, 104882. [Google Scholar] [CrossRef]
- Bartzokas-Tsiompras, A.; Bakogiannis, E. Quantifying and Visualizing the 15-Minute Walkable City Concept across Europe: A Multicriteria Approach. J. Maps 2023, 19, 2141143. [Google Scholar] [CrossRef]
- Elldér, E. Built Environment and the Evolution of the “15-Minute City”: A 25-Year Longitudinal Study of 200 Swedish Cities. Cities 2024, 149, 104942. [Google Scholar] [CrossRef]
- Birkenfeld, C.; Victoriano-Habit, R.; Alousi-Jones, M.; Soliz, A.; El-Geneidy, A. Who Is Living a Local Lifestyle? Towards a Better Understanding of the 15-Minute-City and 30-Minute-City Concepts from a Behavioural Perspective in Montréal, Canada. J. Urban Mobil. 2023, 3, 100048. [Google Scholar] [CrossRef]
- Levinson, D.; King, D. Transport Access Manual: A Guide for Measuring Connection between People and Places; University of Sydney: Camperdown, Australia, 2020. [Google Scholar]
- Geurs, K.T.; van Wee, B. Accessibility Evaluation of Land-Use and Transport Strategies: Review and Research Directions. J. Transp. Geogr. 2004, 12, 127–140. [Google Scholar] [CrossRef]
- Bertolini, L.; le Clercq, F. Urban Development without More Mobility by Car? Lessons from Amsterdam, a Multimodal Urban Region. Environ. Plan. A 2003, 35, 575–589. [Google Scholar] [CrossRef]
- Higgins, C.D.; Palm, M.; Dejohn, A.; Xi, Y.L.; Vaughan, J.; Farber, S.; Widener, M.; Miller, E.J. Calculating Place-Based Transit Accessibility: Methods, Tools and Algorithmic Dependence. J. Transp. Land Use 2022, 15, 95–116. [Google Scholar] [CrossRef]
- Osmosis-OpenStreetMap Wiki. Available online: https://wiki.openstreetmap.org/wiki/Osmosis (accessed on 15 September 2024).
- Barrington-Leigh, C.; Millard-Ball, A. The World’s User-Generated Road Map Is More than 80% Complete. PLoS ONE 2017, 12, e0180698. [Google Scholar] [CrossRef] [PubMed]
- Geofabrik Download Server. Available online: http://download.geofabrik.de/ (accessed on 16 September 2024).
- Why Hexagons?—ArcGIS Pro|Documentation. Available online: https://pro.arcgis.com/en/pro-app/2.8/tool-reference/spatial-statistics/h-whyhexagons.htm (accessed on 16 September 2024).
- Birch, C.P.D.; Oom, S.P.; Beecham, J.A. Rectangular and Hexagonal Grids Used for Observation, Experiment and Simulation in Ecology. Ecol. Modell. 2007, 206, 347–359. [Google Scholar] [CrossRef]
- Fishnets and Honeycomb: Square vs. Hexagonal Spatial Grids|Matt Strimas-Mackey. Available online: https://strimas.com/post/hexagonal-grids/ (accessed on 15 September 2024).
- Openrouteservice. Available online: https://openrouteservice.org/ (accessed on 16 September 2024).
- Bosina, E.; Weidmann, U. Estimating Pedestrian Speed Using Aggregated Literature Data. Phys. A Stat. Mech. Its Appl. 2017, 468, 1–29. [Google Scholar] [CrossRef]
- Weidmann, U. Transporttechnik Der Fussgänger. IVT Schriftenreihe 1992, 90, 68–73. [Google Scholar] [CrossRef]
- Marqués, R.; Hernández-Herrador, V.; Calvo-Salazar, M.; García-Cebrián, J.A. How Infrastructure Can Promote Cycling in Cities: Lessons from Seville. Res. Transp. Econ. 2015, 53, 31–44. [Google Scholar] [CrossRef]
- INE Padrón Municipal de Habitantes (Municipal Register of Inhabitants). Available online: https://www.ine.es/dyngs/INEbase/es/categoria.htm?c=Estadistica_P&cid=1254734710990 (accessed on 10 August 2023).
- Urban Atlas—Copernicus Land Monitoring Service. Available online: https://land.copernicus.eu/en/products/urban-atlas (accessed on 16 September 2024).
- Plan de Movilidad Urbana Sostenible de Sevilla—Actualidad. Available online: https://www.sevilla.org/actualidad/blog/plan-de-movilidad-urbana-sostenible-de-sevilla/ (accessed on 16 September 2024).
- Barómetro de la Bicicleta 2022-RedBici. Available online: https://www.redbici.org/barometro-de-la-bicicleta-2022/ (accessed on 15 September 2024).
- Avance Del Plan Especial de Indicadores de La Actividad Urbanística de Sevilla. (Gerencia de Urbanismo)—Gerencia de Urbanismo y Medio Ambiente-Ayuntamiento de Sevilla. Available online: https://www.urbanismosevilla.org/areas/sostenibilidad-innovacion/Sostenibilidad/otros-documentos/borrador-del-plan-especial-de-indicadores-de-sostenibilidad-ambiental-de-la-actividad-urbanistica-de-sevilla/view (accessed on 15 September 2024).
- Agenda Urbana Española|Agenda Urbana Española. Available online: https://www.aue.gob.es/ (accessed on 15 September 2024).
- El Ayuntamiento Aprueba el Plan de Acción Local de Sevilla Para Desarrollar la Agenda Urbana 2030, Que Cuenta Con 10 Ejes Estratégicos, 30 Retos Específicos y 291 Líneas de Actuación Para Lograr Una Ciudad Más Habitable, Sostenible e Innovadora—Actualidad. Available online: https://www.sevilla.org/actualidad/noticias/2022/el-ayuntamiento-aprueba-el-plan-de-accion-local-de-sevilla-para-desarrollar-la-agenda-urbana-2030-que-cuenta-con-10-ejes-estrategicos-30-retos-especificos-y-291-lineas-de-actuacion-para-lograr-una-ciudad-mas-habitable-sostenible-e-innovadora (accessed on 16 September 2024).
- New Urban Agenda|UN-Habitat. Available online: https://unhabitat.org/about-us/new-urban-agenda (accessed on 15 September 2024).
- Urban Agenda for the EU. Available online: https://ec.europa.eu/regional_policy/sources/policy/themes/urban-development/agenda/pact-of-amsterdam.pdf (accessed on 17 September 2024).
- Gil, F.P.; Mula, F.B.; Vicente, J.; Ferrer, G.; José, M.; Jiménez, G.; Belén, M.J.; Nieto, H.; Estellés, A.T. Plan Especial del Area Funcional 10. Available online: https://www.valencia.es/documents/20142/0/eate_pe_af_10_def_web.pdf/32aa56de-a9e8-3b5a-2bf9-c5cc9b92b21a (accessed on 17 September 2024).
- IDE.SEVILLA Infraestructura de Datos Espaciales. Available online: https://idesevilla.maps.arcgis.com/home/index.html (accessed on 15 September 2024).
- Plano Ordenación Pormenorizada PGOU—Gerencia de Urbanismo y Medio Ambiente-Ayuntamiento de Sevilla. Available online: https://www.urbanismosevilla.org/callejero-y-planos/plano-ordenacion-pormenorizada-pgou (accessed on 17 September 2024).
- Distribución Espacial de la Población en Andalucía|Instituto de Estadística y Cartografía de Andalucía. Available online: https://www.juntadeandalucia.es/institutodeestadisticaycartografia/dega/distribucion-espacial-de-la-poblacion-en-andalucia (accessed on 15 September 2024).
- GEOSTAT-Eurostat. Available online: https://ec.europa.eu/eurostat/web/gisco/geodata/population-distribution/geostat (accessed on 15 September 2024).
- Romanillos, G.; Gutiérrez, J. Cyclists Do Better. Analyzing Urban Cycling Operating Speeds and Accessibility. Int. J. Sustain. Transp. 2020, 14, 448–464. [Google Scholar] [CrossRef]
- Vu, D.; Chi, A.; Gosti, C.; Miller, L.; Aynashe, S. Bridging the Amenity Gap: How Emerging Data Can Help Detect Amenity Bypass. ITE J. 2021, 91, 44–49. [Google Scholar]
- Palacios, M.S.; El-geneidy, A. Cumulative versus Gravity-Based Accessibility Measures: Which One to Use? Findings 2022, 32444, 32444. [Google Scholar] [CrossRef]
- Pozoukidou, G.; Chatziyiannaki, Z. 15-Minute City: Decomposing the New Urban Planning Eutopia. Sustainability 2021, 13, 928. [Google Scholar] [CrossRef]
- Poorthuis, A.; Zook, M. Moving the 15-Minute City beyond the Urban Core: The Role of Accessibility and Public Transport in the Netherlands. J. Transp. Geogr. 2023, 110, 103629. [Google Scholar] [CrossRef]
- Kamruzzaman, L. Typologies of 20-Minute Neighbourhoods, Active Transport Use, and Spatial Spillovers. Findings 2022. [Google Scholar] [CrossRef]
- Victoria State Government 20-Minute Neighbourhoods: Creating a More Liveable Melbourne. Available online: https://www.planning.vic.gov.au/__data/assets/pdf_file/0022/653125/Creating-a-more-liveable-Melbourne.pdf (accessed on 17 September 2024).
- How to Bring the City Closer to People? Using Spatial Network Analysis to Create a 15-Minute City|Resources|High Street Task Force. Available online: https://www.highstreetstaskforce.org.uk/resources/details/?id=0f43f84f-1b49-4661-a9d6-fec3077095a9 (accessed on 17 September 2024).
- Nalaskowska, S. How to Bring the City Closer to People? Using Spatial Network Analysis to Create a 15-Minute City. 2021. Available online: https://www.researchgate.net/publication/354651826_How_to_bring_the_city_closer_to_people_Using_spatial_network_analysis_to_create_a_15-minute_city/citation/download (accessed on 17 September 2024).

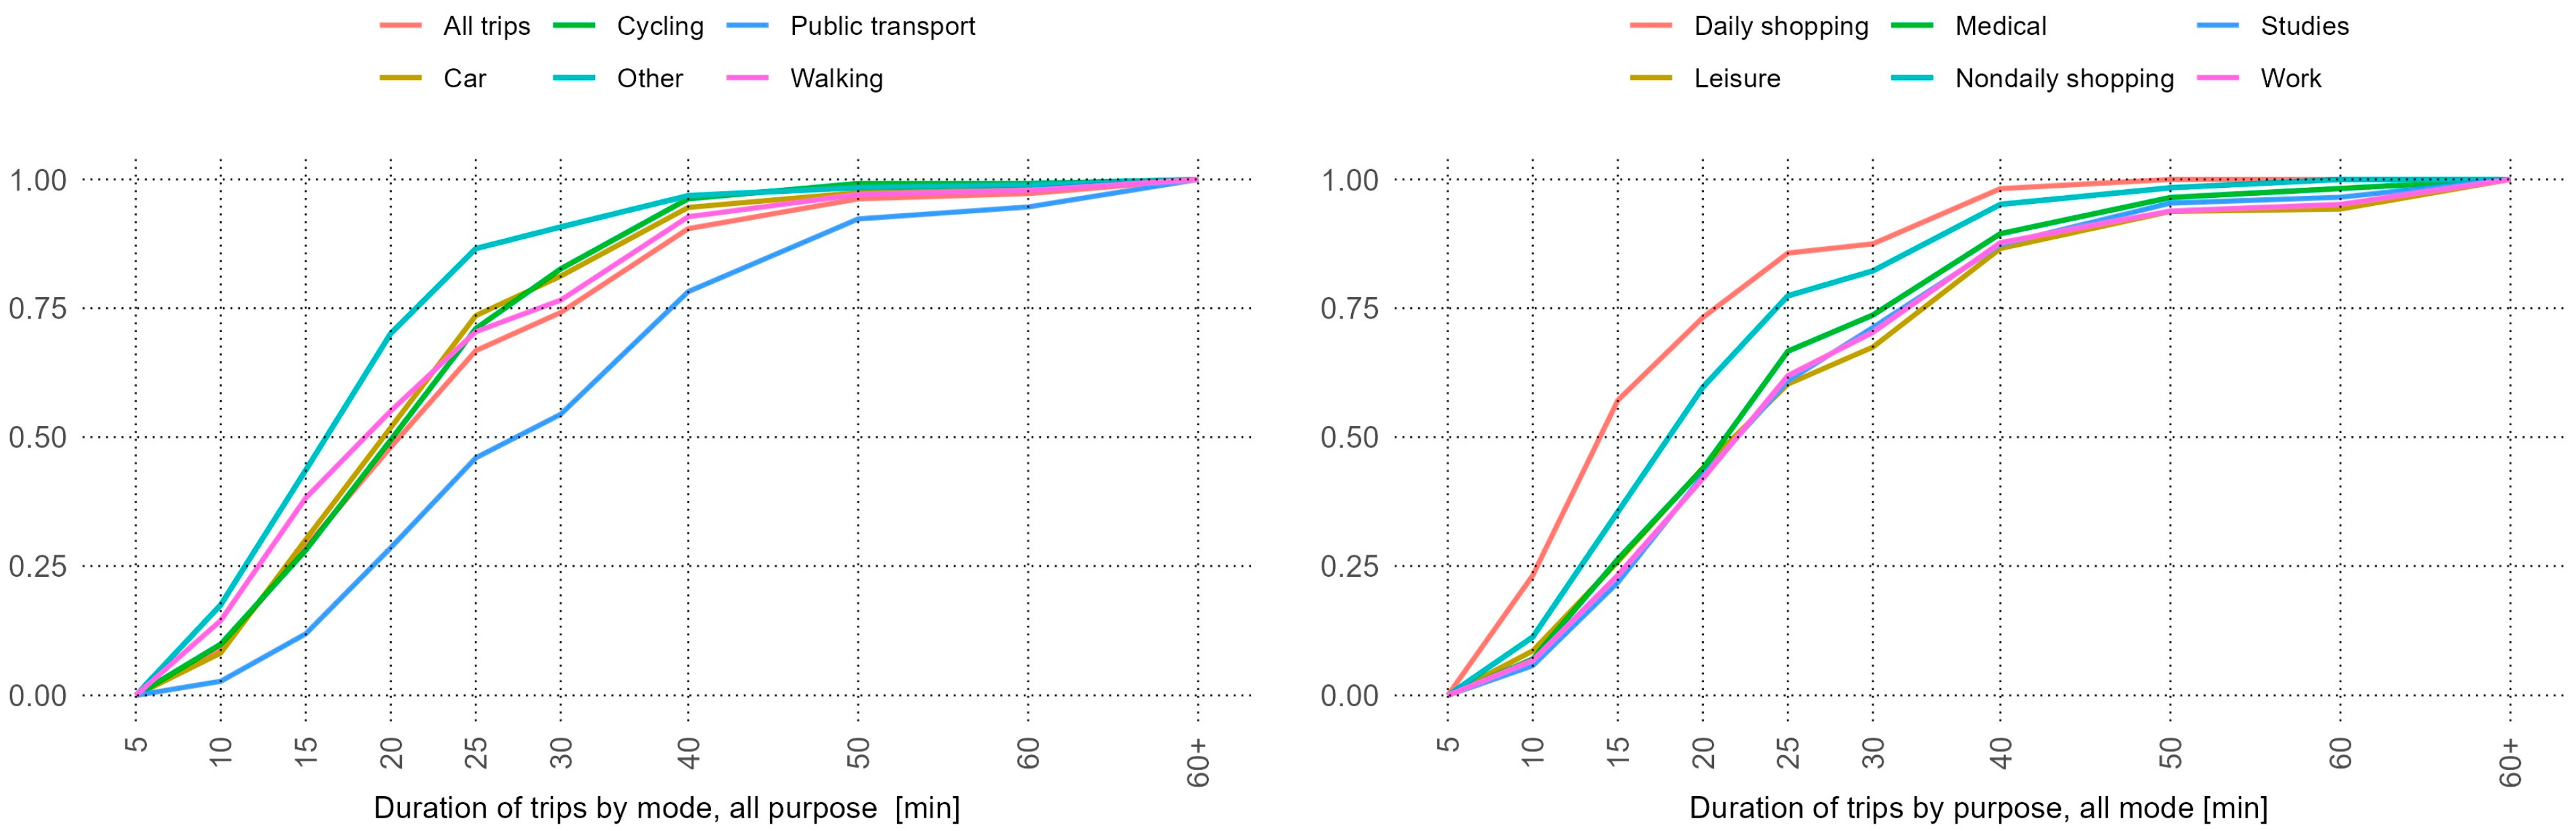


| Purpose of Trips | Percentage of Trips, All Modes [%] | Percentage of Trips by Mode for Each Trip Purpose | |||||
|---|---|---|---|---|---|---|---|
| Walking | Cycling | Public Transport | Car | Other | Total | ||
| Work | 31.2 | 12.9 | 4.3 | 19.7 | 56.4 | 6.6 | 100 |
| Studies | 8.7 | 21.6 | 7.7 | 43.4 | 24.1 | 3.2 | 100 |
| Medical | 5.7 | 22.6 | 0 | 35.6 | 34.5 | 7.4 | 100 |
| Daily shopping | 5.9 | 71.6 | 0.1 | 10.7 | 16.6 | 1.1 | 100 |
| Non-daily shopping | 6.3 | 33.4 | 1.3 | 22.9 | 41.3 | 1.1 | 100 |
| Personal matters | 9 | 24.6 | 2.1 | 27.7 | 41.4 | 4.2 | 100 |
| Leisure | 20.8 | 48.2 | 3.9 | 21.2 | 23.1 | 3.6 | 100 |
| Taking someone somewhere | 5.5 | 28 | 1.5 | 4.4 | 63.3 | 2.8 | 100 |
| Visiting someone | 5.2 | 16 | 2.3 | 28.3 | 49.5 | 3.8 | 100 |
| Other | 1.7 | 28.5 | 4.4 | 17.7 | 40.5 | 8.9 | 100 |
| Total | 100 | 28.6 | 3.4 | 23 | 40.5 | 4.5 | 100 |
| Walking | Cycling | |||||||
|---|---|---|---|---|---|---|---|---|
| Destination Category | Destination Type | Number of Elements | Population within 5 min [%] | Population within 10 min [%] | Population within 15 min [%] | Population within 5 min [%] | Population within 10 min [%] | Population within 15 min [%] |
| Transport | City-level PT | 1001 | 96.7 | 99.9 | 100 | 99.8 | 100 | 100 |
| Transport | FUA-level PT | 139 | 31.8 | 67.6 | 90.9 | 78.1 | 99.8 | 100 |
| Transport | Regional PT | 7 | 2.2 | 11 | 29.3 | 18.7 | 52 | 70.6 |
| Transport | Night-service PT | 67 | 27.3 | 74 | 91.8 | 85 | 98.8 | 100 |
| Transport | Bike-sharing stations | 260 | 77.3 | 92.8 | 97.8 | 95.6 | 99.5 | 100 |
| Transport | Bike parking | 1300 | 96.2 | 99.7 | 99.9 | 99.7 | 100 | 100 |
| Transport | Cycling infrastructure | 386 | 90 | 98.7 | 99.4 | 99.1 | 99.5 | 100 |
| Care | Healthcare centre | 45 | 29.5 | 77.7 | 94.8 | 86.6 | 99.9 | 100 |
| Care | Hospital | 16 | 5.7 | 22.4 | 48.3 | 31.3 | 75.9 | 83.1 |
| Care | Social care centre | 16 | 11.5 | 38.6 | 70.2 | 52.4 | 96.1 | 98.7 |
| Care | Pharmacy | 408 | 92.1 | 99.5 | 100 | 99.7 | 100 | 100 |
| Education | Preschool | 169 | 71.5 | 97.9 | 99.4 | 99 | 99.5 | 100 |
| Education | Primary | 161 | 70.2 | 98.2 | 99.4 | 99 | 99.5 | 100 |
| Education | Secondary | 120 | 56.8 | 93.2 | 98.2 | 96.1 | 99.6 | 100 |
| Leisure | Playground | 317 | 78.5 | 95.8 | 98.9 | 97.8 | 99.4 | 99.8 |
| Leisure | Sport | 148 | 67.6 | 98 | 99.6 | 99.2 | 99.9 | 100 |
| Leisure | Squares and parks > 1000 m2 | 375 | 90.5 | 99.6 | 99.8 | 99.7 | 100 | 100 |
| Leisure | Squares and parks > 10,000 m2 | 137 | 56.4 | 91.4 | 98.9 | 96.8 | 99.7 | 100 |
| Leisure | Library | 17 | 11 | 36 | 64.6 | 48.9 | 89.3 | 99.3 |
| Leisure | Civic centre | 21 | 15.1 | 52 | 85.4 | 68.8 | 96.2 | 99.8 |
| Commerce | Market | 18 | 15.4 | 44 | 65 | 52.4 | 91.1 | 99.2 |
| Commerce | Food store | 341 | 73.1 | 96.8 | 98.9 | 98.1 | 99.6 | 100 |
| Commerce | Fresh-food store | 264 | 49.9 | 78.5 | 91.9 | 87 | 97.4 | 99.1 |
Disclaimer/Publisher’s Note: The statements, opinions and data contained in all publications are solely those of the individual author(s) and contributor(s) and not of MDPI and/or the editor(s). MDPI and/or the editor(s) disclaim responsibility for any injury to people or property resulting from any ideas, methods, instructions or products referred to in the content. |
© 2024 by the authors. Licensee MDPI, Basel, Switzerland. This article is an open access article distributed under the terms and conditions of the Creative Commons Attribution (CC BY) license (https://creativecommons.org/licenses/by/4.0/).
Share and Cite
Radics, M.; Christidis, P.; Alonso, B.; dell’Olio, L. The X-Minute City: Analysing Accessibility to Essential Daily Destinations by Active Mobility in Seville. Land 2024, 13, 1656. https://doi.org/10.3390/land13101656
Radics M, Christidis P, Alonso B, dell’Olio L. The X-Minute City: Analysing Accessibility to Essential Daily Destinations by Active Mobility in Seville. Land. 2024; 13(10):1656. https://doi.org/10.3390/land13101656
Chicago/Turabian StyleRadics, Miklós, Panayotis Christidis, Borja Alonso, and Luigi dell’Olio. 2024. "The X-Minute City: Analysing Accessibility to Essential Daily Destinations by Active Mobility in Seville" Land 13, no. 10: 1656. https://doi.org/10.3390/land13101656
APA StyleRadics, M., Christidis, P., Alonso, B., & dell’Olio, L. (2024). The X-Minute City: Analysing Accessibility to Essential Daily Destinations by Active Mobility in Seville. Land, 13(10), 1656. https://doi.org/10.3390/land13101656