Abstract
The relationship between residential patterns and socioeconomic statuses highlights the complex interactions between the economic regime, welfare system, and neighborhood effects, which are crucial in urban inequality studies. With the diversification of the housing demand and supply system, the traditional analysis conducted separately from the ethnic or spatial segregation perspective fails to capture the rising inequalities and changing socio-spatial context. Taking Nanjing as an example, based on a multi-source database including the housing price, residential environmental quality, surrounding support facilities, and mobile phone user portrait data, this paper proposed a modified method for discovering the coupling relationship between residential patterns and socioeconomic statuses. It is found that socioeconomic status contributes to residential spatial aggregation and that the relationship between social and spatial dimensions of residential differentiation is tightly coupled and related. The lower socioeconomic strata were displaced to the periphery and the older urban core, while affluent inhabitants were more likely to settle voluntarily in segregated enclaves to isolate themselves from the general population through more flexible housing options. The heterogeneity of the urban socioeconomic dimension is primarily affected by consumption and occupational status, while housing prices mainly determine the divergence of spatial distribution.
1. Introduction
The processes of urbanization and industrialization have led to the formation of mobile urban societies, which are characterized by urban–rural integration, spatial densification, high-speed mobility, and complex risks, and, at the same time, give rise to complex urban problems such as unequal distribution of resources, unequal opportunities for individual development, and urban–rural imbalances in development. Since the 1960s, spatial econometrics research has further explained and solved many problems related to unequal distribution. The importance of the spatial dimension in social research has been increasing, and spatial injustice has become the focus of academic attention. In this context, since the 1980s, globalization, labor market restructuring, and economic liberalization have led to increasing income and wealth inequality worldwide, resulting in growing socioeconomic segregation and spatial impacts on the formation of urban settlement patterns [1,2].
The rapid external expansion and internal restructuring of China’s large cities, income inequality, and the transformation of the housing market have brought to the forefront the geographical imbalance in the allocation of socio-spatial resources within cities. The imbalance in the distribution of social wealth and the accumulation effect aggravates socio-spatial differentiation, polarization, and solidification, which is reflected in the urban residential differentiation and manifests itself in the new trend of multi-level heterogeneity and multi-scale fragmentation of socio-spatial space. Under the combined influence of institutional factors inherited from the hukou system and market factors brought about by the transition, the aggravation of socioeconomic inequality translates into selective residential mobility between neighborhoods [3,4], leading to residential segregation in which different socioeconomic strata settle in different types of housing according to their own economic strength and residential preferences [5,6]. Recent studies have shown that although the housing crisis and frequent urban migration have exacerbated social inequality, the degree of spatial aggregation has not increased as expected [7] and has failed to profoundly explain its variability, complexity, diversity, heterogeneity, and multidimensional interactions in large cities [8]. This paradox between rising inequality and declining indices of differentiation is known as the “segregation paradox” or “contextual blindness”, and it challenges the traditional paradigm that relies on the homogeneity dimension [9,10]. This may be due to the fact that high-income groups moved into centrally located and attractive low-income neighborhoods, which in time led to mixed residential patterns of different socioeconomic groups in the central city [11,12] and drew academic attention to the relationship between residential patterns and socioeconomic status [13]. Despite a large number of studies on both residential patterns and socioeconomic status perspectives, few studies have focused on the explanation and correspondence of the relationship [14]. The complex nonlinear causal relationship between settlement patterns and socioeconomic status, as well as the spatial mechanisms linking the two, involve economic systems, welfare systems, and neighborhood effects, which play an important role in the study of the geography of urban inequality [15,16].
Residential space research is the earliest discipline to explore and study urban or large-scale residential space differentiation from the perspective of non-spatial attributes. Residential differentiation research arose in the early 20th century when the Chicago School first proposed three basic models of urban residential differentiation based on human ecology theory [17]. Sociologists and geographers have deepened their understanding of the relationship between socioeconomic structure and residential spatial differentiation from different perspectives. In the 1970s, Harvey [18] first clarified the inevitable relationship between social structure and residential differentiation from neoclassical economic theory. Subsequently, Cannadine [19] further explained the intrinsic relationship between ground shape and social shape from the perspective of historians. In Western societies, the uneven distribution of resources is highly correlated with socioeconomic status, where the concentration of power and wealth enables them to secure more quality resources for their communities. These limited quality resources tend to be concentrated in white and more economically affluent communities [20], while in contrast, relatively disadvantaged communities face scarcity and stigmatization [21]. Differences in socioeconomic status not only exacerbate social and spatial differentiation but also limit the freedom of low-income groups in their residential choices. In studies of residential differentiation in Europe and the United States, differences in socioeconomic status related to race, gender, and identity have often been a central research theme. Similar studies have emphasized the distributional characteristics of different socioeconomic statuses in the urban space of China. China’s household registration system, as a unique social management mechanism, has profoundly impacted urban residential differentiation, interacting with the advancement of market economic reforms to exacerbate urban social differentiation. The household registration system and political identity have become the main drivers of housing wealth inequality. However, the relationship between spatial differentiation and socioeconomic status remains under-explored in China compared to other regions.
With the depth of research, the existing theoretical literature can be broadly categorized into two groups. One category of research focuses on the supply side, delving into how unequal spatial structures form and evolve. This includes residential categorization [22,23], housing tenure [24,25], the strength of socioeconomic segregation [26,27], and the mechanism between spatial accumulation and income inequality [26,28]. Inspired by the Schelling model of segregation [29], another strand of research emphasizes the profound impact of the spatial environment on individual outcomes from the perspective of individual agency [30,31]. Research has shown that the environment in which a person lives and grows up throughout their life can significantly impact future life outcomes [32,33]. Relevant studies include children [33], immigration [34], health [35], income [16], housing structure [36], and effects on different socioeconomic or ethnic groups. However, Petrović and colleagues [37] argue that it is only by synthesizing the rich body of research on spatial patterns and environmental effects that we will be able to fully understand the potential impacts of uneven development. This perspective not only challenges the simplistic understanding of residential disparities as equivalent to racial segregation, neighborhood poverty, or social exclusion but also reveals the complex and diverse relationships and interactions between these factors. They propose a new research paradigm that revisits and analyzes residential spatial differentiation in the context of changing social and geographic environments and certain institutional processes. Friedman and Petrovic et al. [38,39] further strengthened this trend by emphasizing that the study of spatial differentiation must go beyond simple categorization and labeling and delve into the social, economic, and institutional factors behind it. As a result, it has become a mainstream trend to study settlement patterns within and between different countries from the perspective of socio-spatial linkages. At the same time, the adoption of interdisciplinary and multidimensional research methods can not only reveal the complexity and diversity of residential spatial differentiation but also lay a solid theoretical foundation and empirical support for constructing a more just and scientific urban spatial planning and policy framework.
Previous empirical research mainly relies on two databases to establish the relationship between spatial patterns and social context. One starts from spatial structure dimensions and geographical data, such as housing price or POI (point of interest) data [40,41,42], to reveal the impact of the market transition on the inequality of housing resources and how housing inequality translates spatially into different urban functional areas [43]. The other is based on social agency dimensions and survey data such as census or other sample surveys [44] and adopting ecological factors [45], local entropy models [46], and social area analysis [47] to investigate the socioeconomic difference and its driving force from the perspective of individuals. In the mid-20th century, as various related ideologies evolved along with the improvement of methodologies, Western urban studies scholars broke through the traditional theoretical framework and began utilizing statistical data to quantitatively measure and map the spatial patterns of urban residential differentiation [48]. Many of these studies utilized individual spatial–temporal trajectories to measure residential differentiation under the framework of time geography, including comparing spatiotemporal trajectories [49], community-based random walk analysis [50], and applying regression-based measures [51]. The recent direction in segregation study acknowledges segregation to be present in multiple socio-geographical spaces [52] and focuses on the connections of segregation situations across domains through space and time, such as the connections of segregation between residential and economic [52], work [53], and school [54]. However, studies based on social surveys have the advantage of fine-grained individual data but have limitations in overall and long-term observation [51]. Visual analysis based on spatial–temporal geographic data makes the research more intuitive, but it remains an indirect projection that lacks social stratum attributes [55]. The interactive relationship between the spatial structure and social effects based on multi-source spatial data and the reaction of different socioeconomic groups to the spatial differences deserve further research [11,56]. In recent years, with the rapid and ubiquitous adoption of mobile smart devices, researchers have gradually developed a richer, more nuanced, and timely set of data sources to explore the patterns of urban residential differentiation [57]. As various methodological approaches and modeling strategies have been developed to identify unevenness in geography, integrating and mining multi-source geographic spatial–temporal data proves to be one of the key and arduous fields in relevant research.
Therefore, this paper aims to yield fresh insights into the social–spatial dual attributes of residential differentiation and their coupling relationship. Taking the city of Nanjing as an example, this paper analyzes the relationship between socioeconomic class and spatial differentiation through multi-source spatial data and tests it in specific cases. This paper makes several contributions to the existing literature. It introduces a new framework for understanding urban inequality, contrasting with traditional studies that focus separately on ethnic or spatial segregation. Secondly, different from the previous hysteresis approach, multi-source spatial data and the integrated methods of data mining and visual analysis have advantages in accuracy and timeliness. Thirdly, studying individual housing preferences on a more fine scale overcomes the previous large-scale empirical studies based on census units. This paper is structured as follows. The next section presents the study area, data processing, methodology, as well as variable selection and parameter estimation. The third section presents the results of empirical models and their evolutionary determinants. The final section presents the conclusion and provides a discussion.
2. Data and Methods
2.1. Study Area
Nanjing, with its long history, profound culture, and developed economy, is a city with both traditional and modern characteristics. As the provincial capital and Yangtze River Delta of Jiangsu province, its development and modernization process showcases a unique Chinese model and development experience. With the development over time, according to the Statistical Bulletin of National Economic and Social Development of Jiangsu Province 2023 (https://tjj.nanjing.gov.cn/; accessed on 30 August 2024), the income levels of Nanjing residents have steadily increased, reflecting a trend of diversification. People from different social classes and cultural backgrounds coexist harmoniously here, forming a diverse community. At the same time, the coexistence of ancient buildings and modern skyscrapers also shows the unique living environment in Nanjing, which is a typical study city for studying the relationship between residential patterns and socioeconomic status. According to the Overall Planning of Land and Space in Nanjing (2020–2035), the main urban area of Nanjing includes Jiangnan in the south of the city center and Jiangbei north of the river. This paper chooses the main urban area of Nanjing as its research subject (Figure 1), which covers an area of 801 km2 and accounts for 12% of the total area of Nanjing (6587 km2), with 2744 residential communities and an area of 172 km2.
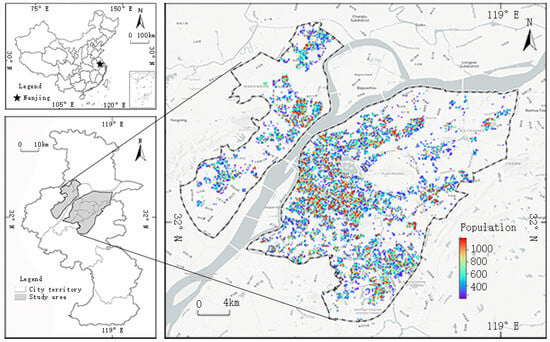
Figure 1.
The main urban area of Nanjing.
2.2. Data Selection
2.2.1. The Socioeconomic Statuses Attribute Data
Dimensions of socioeconomic status include age, gender, occupation, family status, and consumption level, which are often considered the most critical factors contributing to residential segregation [27,28]. The difficulty of defining socioeconomic status also depends on how neighborhood effects are measured, as there are different endogenous indicators. Typically, environmental effects are based on neighborhood income levels; however, income is not the only important environmental influence, and other indicators reflecting local characteristics should also be considered. This study uses big data from mobile devices, which are accumulated through the use of specific products and services with the authorization of the user. The data are extracted and processed to reveal the correlation between variables, enhancing the application value of the data and serving the commercial and public service sectors. The research data are based on anonymous cell phone user profiles provided by the Ge Tui Data Intelligent Service platform (www.getui.com; accessed on 1 November 2020), including multidimensional features such as device ID, timestamp, GPS location, IP address, app usage, and user offline behavioral preferences (Table 1). These data are integrated into mobile applications through SDKs with user authorization to collect LBS data such as latitude and longitude, WIFI, and IP information from location service applications. Subsequently, users are categorized based on labels such as age, gender, and consumption level through big data analysis tools to support subsequent studies [58]. Data were collected in November 2020 from 33,737 150 m × 150 m grid units in the Nanjing study area, covering about 7,413,090 residents.

Table 1.
The indicators of socioeconomic status attributes.
Compared with mobile signal data, the location-based service (LBS) data from Ge Tui platform does not rely on base-station density. By converting users’ frequent offline locations into the form of a grid space, we can research socioeconomic statuses of those who live in specific areas. In this paper’s study area (see Section 3.1), there are 33,955 grid units, with (746/100) million residents. Traditional LBS data, such as data accumulation based on specific apps, is derived from relatively singular information sources, which may easily produce group deviations. Meanwhile, the Ge Tui platform covers the daily activity of more than 400 million independent devices. The social characteristics of the socioeconomic statuses, such as their age, gender, consumption level, and other social characteristics, are calculated by learning the users’ offline activity characteristics and online app interests and preferences.
The social characteristics of a particular socioeconomic status, such as age, gender, consumption level, and other social characteristics, are calculated by learning the user’s offline activity characteristics and online app interests and preferences. Although income is the prerequisite basis for consumption, the permanent income status of residents determines their consumption level [59]. Compared to the income level, the consumption level is easier to capture through mobile device data and better reflects the permanent and stable economic status of residents, making it a measure of socioeconomic status. For a comprehensive assessment, we also combined multidimensional indicators such as occupation and family status.
2.2.2. The Residential Pattern Attribute Data
The dimension of residential patterns involves elements such as market attributes, architectural characteristics, locations, traffic, and support facilities [60]. Residential pattern attributes involve the community characteristics of the residential area and the surrounding environment. The community characteristics include community boundary, housing price, completion year, floor space, the number of residential units, floor area ratio, and greening rate. The surrounding environment includes traffic location and service facilities. Among them, the attribute data of residential areas, such as the longitude and latitude, housing price (average listing price per unit area of residential area in 2020), and architectural characteristics, are provided by China Housing Price Market platform (www.creprice.cn; accessed on 12 October 2020); the boundary of residential area is derived from AOI boundary data provided by AutoNavi map; the urban road network is based on vector data from OpenStreetMap (www.openstreetmap.org; accessed on 1 September 2020); and the location information of subway stations and residential supporting service facilities is provided by AutoNavi POI point data. In this way, an urban residential space attribute indicator system can be constructed as follows (Table 2).
Table 2.
The indicators of residential space attribute.
2.3. Methodologies
In order to explore the complex relationship between housing patterns and socioeconomic status, we calculated the flow of housing choice behaviors of residents of different socioeconomic statuses in various types of housing through data-driven and multi-source spatial data mining methods. Compared with the non-spatial differentiation index method commonly used in existing studies, we not only measure the phenomenon of “multi-contextual segregation” but also further expand the analytical framework to multidimensional, cross-sectoral, and multi-temporal [52,61]. However, traditional research is limited by the limitations of data sources, such as the coarse-grained spatial aggregation of census data, the lack of daily mobility information, and the time and sample size constraints of sampling surveys, which together constrain the realization of in-depth analysis of socio-spatial differentiation [62,63]. By integrating big data from mobile devices, we can effectively break through the limitations of traditional data sources and significantly improve the spatial and temporal resolution of analysis and the richness of socioeconomic attributes. Multi-source spatial data are characterized by massive data and multiple feature dimensions. This requires mapping data points from high- to low-dimensional space to reduce the dimensionality. Based on the theoretical understanding of the dialectical relationship between social and spatial dimensions, this paper estimates and validates the relationship between residential patterns and socioeconomic status in Nanjing by combining principal component analysis (PCA), the K-means algorithm, and the Sankey diagram method.
Firstly, the feature dimension matrix of residential community (or portrait grid) is constructed. Based on the data extracted from mobile phone features such as age, gender, occupation, family situation, and consumption level, the feature matrix of residents’ socioeconomic status attributes is constructed. And the feature matrix of residential patterns was obtained based on the indicators of market attributes, architectural characteristics, location and traffic, and support facilities.
Then, the mean and covariance matrix of the samples are calculated:
where stands for the total number of communities (or portrait grids), stands for the -th feature dimension, stands for the -th feature dimension, stands for the mean value of the -th feature dimension, stands for the mean value of the -th feature dimension, and stands for the -th feature of communities (or portrait grids) and the covariance matrix of the -th feature dimension.
Then, eigenvalues and eigenvectors are obtained based on Singular Value Decomposition (SVD) covariance matrix:
As the dimensionality of the data features increases, the traditional Euclidean distance approach to measure the similarity between two high-dimensional data will fail and even lead to the problem of “dimensionality catastrophe”. On the one hand, the performance of data mining algorithms based on index structure will be degraded. On the other hand, the traditional mining methods based on non-spatial distance function will also fail. In order to overcome the above problems, the study adopts the principal component analysis (PCA) method, in which the hyperplanes of multiple feature dimensions are projected into a new coordinate system by linear transformation so as to maximize the variance of the data. A matrix containing vectors corresponding to M features with maximum eigenvalues (i.e., maximum variance) is chosen to obtain a mapping function that achieves the mapping of the input data back into a low-dimensional space while still preserving most of the features of the original data. In this study, we reduce the dimensionality of N rows and D columns of data matrix into N rows and 2 columns of two-dimensional data matrix so that the data can be visualized and analyzed in the two-dimensional plane, with the aim of reducing the dimensionality of the data while retaining the intrinsic structure of the data as much as possible; this is an effective method for multi-source data processing.
K-means clustering is an effective method for fast classification and minimizing intra-type differences while maximizing inter-type differences. It is particularly useful for dividing a given sample set into K clusters based on the distance between samples. The goal is to connect the points within the clusters as closely as possible while the difference between clusters can be adjusted as large as possible. This method is commonly used for dividing communities or portrait grids into clusters; assuming that the clusters are divided into , our goal is to minimize the square error :
where is the mean vector of the cluster , also known as the centroid, which is solved by heuristic iterative method. The expression is
In K-means clustering, the silhouette coefficient measures the cohesion and separation of the clustering results and can help determine the optimal number of clusters. Based on the silhouette coefficients of different socioeconomic and residential spatial attributes (Figure 2), five classes were selected as the optimal number of clusters:
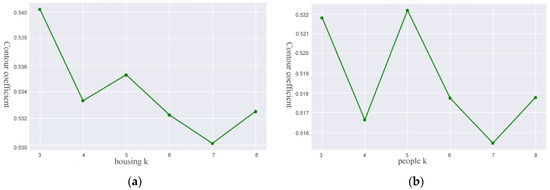
Figure 2.
The contour coefficient is the optimal K value. (a) Profile coefficients for clustered k-values of housing attribute; (b) profile coefficients for clustered k-values of people attribute.
Finally, Sankey diagrams are used to illustrate the quality and connectivity of flows between entities across time. Based on spatial clustering analysis, the corresponding relationship between residents and community segregation results can be observed through Sankey diagram, the segregation characteristics of different groups in different residential communities, as well as the socio-spatial coupling model of urban residential differentiation, which can be summarized and theorized.
3. Results
3.1. Clustering Results of Socioeconomic Statuses
By reducing the dimensions of 12 indicators, like age, gender, occupation, family, and the consumption attribute of socioeconomic statuses, and analyzing spatial segregation, as well as revealing evident characteristics of age and consumption level related to the differences among groups, this paper divides socioeconomic statuses in Nanjing into five resident socioeconomic status types (from Type I to Type V) (Table 3 and Figure 3), which are, respectively, named the middle-aged group with high income, middle-aged and young group with higher income, young group with medium income, young group with lower income, and middle-aged and young group with low income.
Table 3.
The proportion of five socioeconomic statuses and the average value of various indicators.
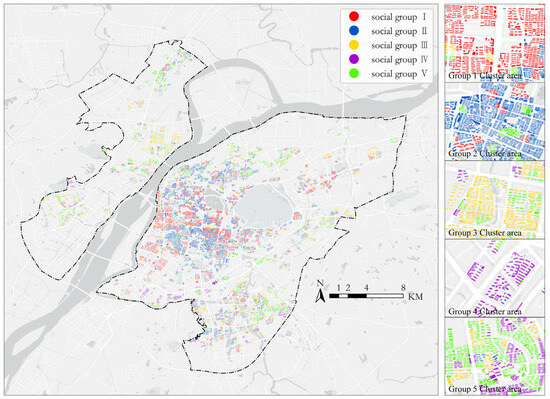
Figure 3.
The spatial distribution of five socioeconomic statuses in Nanjing.
Type I is the middle-aged with high-income socioeconomic group. In the group, the proportion of residents with high consumption levels is as high as 37.33%, and the white-collar group accounts for more than 60%. The middle-aged group dominates in the age structure, and the elderly group and parents of primary and secondary school students account for the highest proportion. In terms of gender, the proportion of females is significantly higher than that of males. Geographically, this group is mainly distributed in the central part of Nanjing as well as Longjiang and the Olympic Sports Area of Hexi New Town.
Type II is the young and middle-aged with above-average income socioeconomic group, a vibrant segment of Nanjing’s population. This group is characterized by medium–high and medium consumption levels, accounting for around 83% of the total population. The white-collar group accounts for 53.11%, which is only lower than that of Type I. In terms of age structure, the middle-aged and young group dominates, accounting for more than 86%. In terms of gender, the proportion of females is slightly lower than that of males. Geographically, this group is mainly distributed in the former southern area of the central part of Nanjing and the Nanhu area of Hexi New Town, reflecting the relatively high consumption in urban centers and downtowns.
Type III is the young with average income socioeconomic group. In terms of age structure, the middle-aged and young group dominates, accounting for more than 88%. The proportion of parents of 0–6-year-old infants and of primary and secondary school students is higher than other groups. Over half of the young group stays at the medium consumption level, and the white-collar group accounts for around 58%. In terms of gender, the proportion of females is slightly higher than that of males. Geographically, this group is scattered in the periphery of the main urban area of Nanjing and the core urban area of Jiangbei New Area.
Type IV is the young with below-average income socioeconomic group. The proportion of the group is relatively small, accounting for 12.7%. Compared with Type III, the proportion of residents with high consumption levels is less, whereas the proportion of residents with low consumption levels is higher. The proportion of the white-collar group is less than 50%. In terms of age structure, the young group dominates, accounting for 63.08%, and the proportion of the old group is the lowest, only 3.62%. The proportion of families with primary and secondary school students is relatively low. Geographically, this group is mainly distributed in the periphery of the main urban area of Nanjing.
Type V is called young and middle-aged with low-income socioeconomic groups. This group has a large population, accounting for 22.33%. The proportion of residents with high consumption levels and the white-collar group are the lowest among all groups, while the proportion of residents with low consumption levels is the highest. The age structure is dominated by the middle-aged and young groups, with the old group accounting for 3.8%. The proportion of parents of primary and secondary school students is relatively high. Geographically, this group is mainly distributed in the periphery of Nanjing.
3.2. Clustering Results of Residential Differentiation
By reducing the dimensions of 12 indicators in Table 2, this paper divides residential space in Nanjing into five types (from Type A to Type E) (Table 4 and Figure 4): houses with high-end support facilities and scarce landscapes, houses with high-quality locations and high-quality services, traditional multi-story and medium-level houses in the main urban area, newly built houses with low-level support facilities in the periphery and newly built commercial houses in the core area of new towns.
Table 4.
The proportion of five types of housing scale and the average value of various indicators.
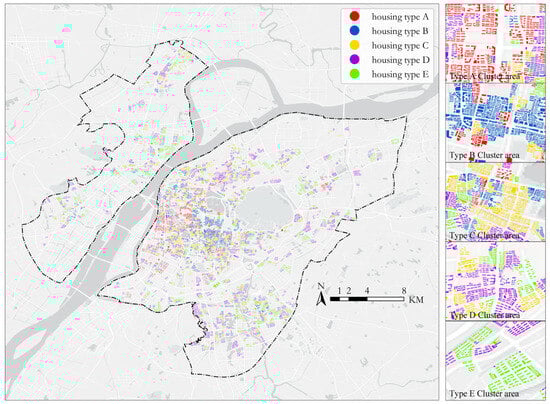
Figure 4.
The spatial distribution of five housing types in Nanjing.
Type A represents housing with excellent amenities and scarce landscapes. It accounts for the smallest proportion and features the longest house age, making it a rare and coveted choice. Most residential communities were built before 2000, yet the average housing price per unit area is the highest, reflecting its elite status. Type A boasts good traffic conditions and support facilities. Spatially, Type A is mainly distributed in famous school districts with the highest quality of compulsory education in the central part of Nanjing and Hexi New Town, as well as high-end enclosed communities and villas with superior landscapes such as Xuanwu Lake and Qinhuai River.
Type B represents housing with a prime location and high-quality service. Type B accounts for around 1/5, with high-quality communities and the highest floor area ratio. Type B offers the best internal and external traffic and support facilities among all kinds of houses. While its housing price is lower than Type A, it is significantly higher than other types, reflecting its allure and prime location. Geographically, Type B is mainly distributed in the central part of Nanjing and Longjiang of Hexi New Town.
Type C represents traditional multi-story and medium-level housing in the main urban area. Type C accounts for 16.4% of the total number of residential areas, with medium-level residential environments, traffic conditions, and support facilities among all kinds of houses. Traditional multi-story communities were mostly built before 2000, with an average housing price of 31,401 CNY/m2. Geographically, Type C is mainly distributed in Xiaguan District, the Confucius Temple area in the south of Qinhuai River, and Nanhu of Hexi New Town.
Type D represents newly built houses with low-level support facilities in the periphery. Type D accounts for the largest proportion, i.e., 28.25% of the total number of communities. Type D possesses a high-quality residential environment yet the worst traffic conditions and support facilities among all kinds of communities. In general, Type D is a newly built large-scale house sold in 2000, with an average housing price of 30,116 CNY/m2. Spatially, Type D is scattered in the periphery of the main urban area of Nanjing.
Type E represents newly built commercial houses in the core area of new towns. Type E accounts for 21.81% of the total number of houses, with the lowest house age and the lowest housing price (with an average of 28,495 CNY/m2) among all kinds of houses. In terms of traffic conditions and support facilities, Type E is only second to Type B in all kinds of houses. Spatially, Type E is mainly distributed in the core areas of new towns such as Jiangbei, Xianlin, and Dongshan.
3.3. The Interaction of Social and Spatial Dimensions
Their matching relationship will be discussed based on the clustering analysis of urban socioeconomic statuses and residential space in Nanjing City. Firstly, groups characterized by high consumption usually have higher incomes, and such groups generally live in high-quality housing (Table 5). For instance, in housing Type A, residents of Type I dominate, accounting for 63.06% of the total groups, yet residents of Type V account for less, only 4.69%. With the transformation of housing types from high housing prices to relatively low housing prices (from A to E), the proportion of the Type I high-income group demonstrates a significant downward trend.
Table 5.
The proportion of socioeconomic statuses residing in five types of residential space.
Secondly, the group with high income enjoys more freedom of choice in the housing market and commonly prefers the housing type with higher living quality and better support services (Table 6). In contrast, the group with low income enjoys less freedom of choice. Most low-income groups are coerced to purchase or rent relatively low-value houses. For example, the proportion of Group type I that chooses Housing Type A is the highest, reaching 28.13%, and the proportion of the group that chooses Housing Type E is the lowest, reaching only 11.4%. Furthermore, in Group type V, the proportion of the group that chooses Housing Type D and Housing Type E reaches as high as 67.31%, but the proportion of the group that chooses Housing Type A and Housing Type B reaches only 13.13%.
Table 6.
The proportion of five socioeconomic statuses distributed between different housing types.
Noticeably, there is a corresponding or coupling relationship between socioeconomic status and residential space to a certain extent (Figure 5). People in socioeconomic status I mainly live in housing types A–D, people in socioeconomic status II mainly live in housing types B–D, and people in socioeconomic statuses III–V mainly live in housing types D and E. This suggests a correlation between socioeconomic status and residential patterns, though the relationship is not strictly spatially defined.
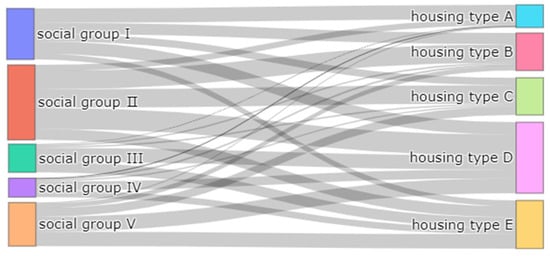
Figure 5.
The distribution of different types of socioeconomic statuses in different housing types in Nanjing.
3.4. Coupling Patterns and Case Verification
Based on the matching between socioeconomic status and housing type in urban residential space, this paper identifies seven typical models of socio-spatial coupling of urban residence in Nanjing (Table 7).
Table 7.
The comparison of typical coupling patterns and characteristics of residential socio-space in Nanjing.
(1) The old neighborhood community is a historical gem in the inner city. It is predominantly located in the old urban area, where mostly multi-story houses built in the 1970s or the 1980s bear witness to the city’s rich past. Despite challenges such as traffic congestion and limited parking, this community holds immense potential for rejuvenation. While many young and middle-aged residents have moved out, the remaining population, primarily the elderly, maintains a modest lifestyle.
(2) The new high-quality community in the inner city. It is strategically scattered in the central area or along the main road. These newly built high-rise hotel apartments and high-end enclosed communities, designed for both commercial and residential use, offer a luxurious living experience. The majority of residents, a mix of middle-aged and young individuals, enjoy a high income. Despite the steep housing prices, the allure of modern living quality and high-quality service and support facilities is irresistible.
(3) The education-related community in the main urban area. It refers to school district houses around famous schools, with relatively low living quality and the highest housing price. Residents are mainly families with middle school and primary school students. In general, residents who purchase or rent houses there embody high income and consumption levels. In terms of age, they are mainly middle-aged and young groups.
(4) The enclosed landscape community is a picturesque haven in the main urban area. It is primarily located in scenic areas such as Zijin Mountain and Xuanwu Lake. The scarcity of such landscapes, coupled with the high-quality community, contributes to the high housing prices. The residents, mainly middle-aged, are known for their high income and admirable work. The community’s unique selling point is its breathtaking location, making it a desirable place to live.
(5) The newly built community in the main urban area. It is widely distributed in the main urban areas, mostly commercial housing communities built after 2000, with high-quality communities and comprehensive support facilities. Residents come from various professions whose consumption level and age structure approximate the urban average level, and the housing price is moderate.
(6) The downtown community in the new towns. The houses in the area were built in different completion years and had different residential qualities. In comprehensive support facilities, it is generally inferior to the core area of the main city. The housing price is moderate. Residents come from various professions with high consumption levels. In terms of age structure, they are mainly middle-aged and young groups.
(7) The suburban community in the new towns. It is distributed in the periphery of Nanjing or new towns. It has been built in recent years with large and dense communities. The proportion of affordable housing is high, comprehensive support facilities are unsatisfactory, and the price is relatively low. Residents are the youngest and have the lowest consumption level.
3.5. The Coupling Mechanism of Residential Pattern and Socioeconomic Statuses
Accordingly, in order to further investigate and verify the socio-spatial characteristics and differences of community types, this paper chooses seven representative case communities in Nanjing according to their spatial characteristics in terms of spatial location, completion year, community scale, community environment, building quality, and surrounding support facilities. As suggested in Table 8, seven representative communities are the Ertiaoxiang community (traditional and old residential area), Jinying International Garden (newly built high-quality residential area), Kuanglu New Village (education-related community), Jinling Royal Garden (enclosed landscape residential area), Zijin Huafu (ordinary newly built residential area), Yajule Binjiang International (the core residential area of new towns), and Caofang Xinyuan (large residential area in the outer suburbs). Residential spaces with specific location conditions, price levels, neighborhood quality, and comprehensive support services are likely to be populated by specific social groups with similar residential preferences, economic strength, occupational types, and family age characteristics. This interaction reveals the inherent complexity of spatial differentiation in Nanjing, where the specific attributes of each neighborhood are closely intertwined with the socioeconomic characteristics of its residents. Therefore, we have tailored differentiated development strategies for seven different types of neighborhoods: for traditional and old-style residential areas, such as the Erzhangxiang neighborhood, priority is given to urban renewal and historical and cultural preservation; for newly built high-quality residential areas, such as the Jinying International Garden, the high quality standard is maintained and enhanced; for education-related neighborhoods, such as the Kuanglu Xincun, the focus is on maintenance and optimization of educational resources; for closed landscape residential areas, such as Jinling Royal Garden, strengthen the maintenance and management of natural landscape; for ordinary new residential areas, such as Zijinhua Mansion, improve the living facilities to meet the daily needs of the residents; for the core residential areas of the new city, such as Yajule Riverside International, optimize the transportation network and improve the level of comprehensive support; for large-scale suburban residential areas, such as Yajule Riverside International, need to optimize the transportation network; and for large suburban residential areas, such as Caofang Xinyuan, priority should be given to solving transportation problems and developing regional industries to enhance their attractiveness. These strategies aim to promote each community’s sustainable development and enhance their residents’ quality of life.
Table 8.
The comparison of socio-spatial attributes of representative case communities.
In terms of the social attributes of residents in different types of communities, as Table 8 reveals, (1) In terms of age, the core residential area of new towns and newly built high-quality residential areas in the inner city rank first and second in the proportion of young people (18–34 years old), which is the lowest in education-related communities and enclosed landscape residential areas. Traditional and old residential areas in the inner city have the highest proportion of the elderly (over 60 years old), and second in education-related communities, newly built high-quality residential areas, and enclosed landscape residential areas, while the core residential area of new towns has the lowest. (2) In terms of family structure, the education-related community is the most typical. In Kuanglu New Village, the proportion of families with primary and secondary school students reaches 34.4%, which is much higher than in enclosed landscape residential areas (the second). (3) In terms of consumption level and the proportion of the white-collar group, residents in education-related communities and enclosed landscape residential areas generally possess high consumption levels. In large residential areas in the outer suburbs, the proportion of the white-collar group is the lowest.
As stated above, this paper discovers a remarkable coupling between the social attribute and spatial attribute of case communities, which is in accordance with the overall characteristics of seven socio-spatial coupling models. Therefore, this paper further verifies the socio-spatial coupling characteristics of urban residential differentiation from the perspective of community scale.
4. Discussion
The residential pattern is both a cause and consequence of socioeconomic inequalities. Although the most important cause for the increase in residential segregation between socioeconomic groups is an increase in income inequality, there is no one-to-one relationship between the two. As social–spatial dialectics unfold, there is a dialectical and interdependent relationship between the socio-spatial dimensions of residential differentiation. As the projection of group differentiation onto urban space, residential differentiation implies a subtle metaphor of capital and class. The differences in the possession and choice of residential space among socioeconomic statuses have a direct or indirect impact on their family wealth distribution, class identity, and inter-generational transmission and boost or strengthen class differentiation and re-differentiation at the subculture level [64]. This paper basically verifies the correlation and coupling between two subsystems (i.e., socioeconomic statuses and residential space) in the residential differentiation system and proposes to research the coupling process and mechanism between urban socioeconomic statuses and residential space, as well as the socio-spatial differentiation that results from socio-spatial coupling.
Previous studies highlight the decisive role of socioeconomic status differentiation on residential space differences while ignoring the feedback of residential space differences on social stratification. In particular, guided by the balanced and sustainable development outlook on urban social space, the “mutual construction” mechanism and “solidification effect” of social differentiation and housing differentiation deserve great attention from urban social geographers. The ‘mutual construction’ mechanism refers to the reciprocal relationship between social differentiation and housing differentiation, where changes in one system influence the other and vice versa. The ‘solidification effect’ of social differentiation and housing differentiation is the process by which these two systems reinforce and perpetuate each other, leading to the formation of distinct and stratified urban social spaces. For example, the high-income class can obtain higher economic returns, class identity, and better educational opportunities by purchasing high-quality houses in advantageous locations [64]. However, the low-income group can only live in old, decrepit, crowded, and marginalized residential spaces and obtain less economic returns and educational opportunities, which causes the locking mechanism of residential differentiation [44]. This differentiation not only reflects differences in socioeconomic status but also further exacerbates social inequality through solidified spatial characteristics. In the context of China’s rapid urbanization, local governments and developers have adopted differentiated residential development strategies in response to the spatial characteristics of different locations, exacerbating to some extent the determining influence of socioeconomic status on the choice of living space. The unequal distribution of high-quality resources and scarce landscapes enables high-income groups to gain more economic and social advantages, while low-income groups face more life challenges. According to the empirical study of Nanjing in this paper, the fundamental cause of residential spatial differentiation is the unequal spatial distribution of urban resource elements. Therefore, in order to reduce the degree of residential spatial differentiation in the metropolis, we can start from the perspective of spatial balance and optimal allocation of urban resources and prevent the further aggravation of residential spatial differentiation in the city by promoting the balanced layout in the spatial layout and quality of service of public resources and supporting services, such as public facilities, public space, education and medical care, and commercial and leisure services.
China’s political and economic system has a significant impact on the structure of urban residential space [65]. What is often referred to as “family ties” may create a specific corresponding coupling relationship between distinct socioeconomic statuses and residential spaces [66]. Typical examples of such ties may include “occupation-related” communities with the same occupation or industry residing together during China’s planned economy period, “region-related” communities with people from the same birthplace or with similar religious beliefs at the beginning stages of China’s reform and opening up, “industry-related” communities with similar economic and social status during China’s housing marketization period, and “interest-related” communities where people with specific needs and tastes reside together due to these interests. Since the reform and opening-up, the occupations and incomes of Chinese urban residents have become continuously diversified. Social differentiation is driven by capital factors instead of labor factors. The comprehensive socioeconomic statuses of the inhabitants cannot be simply reflected by occupational characteristics. While the housing market has a profound impact on people’s social welfare and access to socioeconomic resources, housing assets, in fact, have become the most important economic assets and the main source of wealth accumulation for urban families in China [67]. Akin to income gap and occupational differentiation, differences in housing resources now function as a major factor that characterizes and affects socio-spatial differentiation [68]. As the marketization of urban housing continually deepens and the housing price quickly rises, the price screening and “purification of space” effect of the housing market emerge. Diverse groups with different economic, social, and cultural attributes re-assemble in and integrate into diverse communities with different locations, values, and qualities. The continuous interaction and coupling between socioeconomic statuses and residential space construct a new, increasingly diversified, and fragmented urban social space (Figure 6). The role of housing marketization in shaping the urban social space is a significant factor in socio-spatial differentiation, and it will help the reader understand the current state of urban development in China. Therefore, this paper analyzes and theorizes the characteristics of socio-spatial differentiation and coupling of urban residence in the new era, which theoretically and practically advances the research on urban residential differentiation in China and establishes a foundation for the ensuing research on the process, mechanism, effect, and regulation of the socio-spatial coupling of residential differentiation.
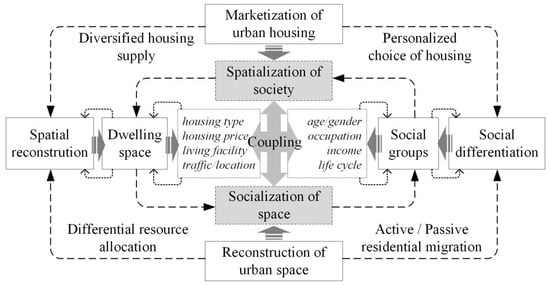
Figure 6.
The socio-spatial coupling of residential differentiation.
5. Conclusions
Under the background of continuous differentiation and rapid reconstruction of the social and spatial structure of big cities in the new era, residential differentiation signifies a process in which urban socioeconomic statuses and residential space are continuously differentiated and mutually coupled. Based on understanding the dual socio-spatial attribute of urban residential differentiation, this paper takes Nanjing as a case city; constructs an index system of socioeconomic status attributes and residential space attributes based on the data of the urban housing market, built-up environment, and mobile phone user data; and divides socioeconomic statuses and residential space into five types by reducing the indicator dimension and analyzing spatial segregation. It unveils that the difference in socioeconomic status is mainly signaled by residents’ consumption levels and occupational structures, and the difference in residential space is mainly signaled by housing price by observing the attribute characteristics and distribution differences between different types of socioeconomic statuses and residential space. In particular, high-income groups enjoy more freedom of choice in the housing market, and they generally prefer to choose housing types with a higher quality of residence and better support services; by contrast, low-income groups have less freedom of choice. Most low-income groups are forced to buy or rent houses of relatively low value. Moreover, there is a corresponding relationship between social group type and residential space type. This paper proceeds to summarize and theorize seven typical models of the socio-spatial coupling of urban residence in Nanjing.
Taking the classic problem of residential space differentiation as the research object, this paper puts forward a new understanding of the dual attributes and coupling of social space and expounds on the relationship between socioeconomic status and residential space differentiation. By fusing multidimensional information such as socioeconomic attributes, behavioral preferences, and location trajectories, we overcome the limitations of traditional data sources and achieve a more comprehensive and detailed analysis of residential segregation. The integration of multidimensional data reveals the complex relationship between socioeconomic status and housing patterns and improves the precision and fine granularity of the analysis. However, it also shows that there are some limitations in this study, which provides a direction for future research. This paper adopts the user attribute information reflected by the smartphone. Because smartphone use among the elderly is lower than among the middle-aged and young, Nanjing’s older population is relatively small in the population sample, and the influence of the special population on residential space differentiation is not fully considered. In addition, although the seven models summarized in this paper are examples of the coupling of urban residential space and social space in Nanjing, they are not universal and may need to be adjusted to specific socioeconomic conditions. Therefore, future research should focus on in-depth analysis and comparison of different types and levels of social groups and explore the use of a broader and more comprehensive measure of socioeconomic status indicators; furthermore, the multidimensional measure model of residential space differentiation is discussed to promote the rationalization and optimization of urban residential space.
In conclusion, the relationship between residential patterns and socioeconomic statuses in China is becoming increasingly complex. The residential spatial difference mirrors the allocation of urban resources and the differentiation of residents’ economic strength. This research provides data support and an analytical approach for residential differentiation, and partially covers the shortage of time lag caused by census data and information. The proposed analytical framework of the socio-spatial coupling system of residential differentiation is a crucial step towards addressing this issue. It will further analyze the socio-spatial structure, coupling model, and mechanism of urban residential differentiation to predict and judge the development trend of urban socio-spatial differentiation, which enables us to take optimal controlling measures of residential differentiation in big cities according to the principle of balanced and sustainable development.
Author Contributions
Q.H. and J.H. conceived and designed this research; Q.H. and J.H. collected and analyzed the data; Q.H. and J.H. drafted the manuscript; W.S. wrote, reviewed, and edited this manuscript. All authors have read and agreed to the published version of the manuscript.
Funding
This research is supported by the National Natural Science Foundation of China (Nos. 42201251 and 42171234) and the Zhejiang University of Science and Technology Youth Science Foundation (2023QN013).
Data Availability Statement
The original contributions presented in the study are included in the article material, further inquiries can be directed to the corresponding author.
Acknowledgments
We thank the editors and anonymous commentators whose comments were very constructive and inspiring in preparing the final edition of this paper. We thank Zhouao Zhou from Xiamen University for the discussion and support. We take full responsibility for the opinions expressed in this article.
Conflicts of Interest
The authors declare no conflicts of interest.
References
- Faber, J. Contemporary Echoes of Segregationist Policy: Spatial Marking and the Persistence of Inequality. Urban Stud. 2021, 58, 1067–1086. [Google Scholar] [CrossRef]
- Tammaru, T.; Knapp, D.; Silm, S.; Van Ham, M.; Witlox, F. Spatial Underpinnings of Social Inequalities: A Vicious Circles of Segregation Approach. Soc. Incl. 2021, 9, 65–76. [Google Scholar] [CrossRef]
- Li, Z.; Wu, F. Tenure-based Residential Segregation in Post-reform Chinese Cities: A Case Study of Shanghai. Trans. Inst. Br. Geogr. 2008, 33, 404–419. [Google Scholar] [CrossRef]
- Lin, S.; Gaubatz, P. Socio-Spatial Segregation in China and Migrants’ Everyday Life Experiences: The Case of Wenzhou. Urban Geogr. 2017, 38, 1019–1038. [Google Scholar] [CrossRef]
- Song, W.; Huang, Q.; Gu, Y.; He, G. Unraveling the Multi-Scalar Residential Segregation and Socio-Spatial Differentiation in China: A Comparative Study Based on Nanjing and Hangzhou. J. Geogr. Sci. 2021, 31, 1757–1774. [Google Scholar] [CrossRef]
- Wei, Z.; Liu, Y.; He, S.; Mo, H. Housing Differentiation in Transitional Urban China. Cities 2020, 96, 102469. [Google Scholar] [CrossRef]
- Shi, Q.; Dorling, D. Growing Socio-Spatial Inequality in Neo-Liberal Times? Comparing Beijing and London. Appl. Geogr. 2020, 115, 102139. [Google Scholar] [CrossRef]
- Krupka, D.J. Are Big Cities More Segregated? Neighbourhood Scale and the Measurement of Segregation. Urban Stud. 2007, 44, 187–197. [Google Scholar] [CrossRef]
- Owen, G.; Chen, Y.; Birabi, T.; Pryce, G.; Song, H.; Wang, B. Residential Segregation of Migrants: Disentangling the Intersectional and Multiscale Segregation of Migrants in Shijiazhuang, China. Urban Stud. 2023, 60, 166–182. [Google Scholar] [CrossRef]
- Marcińczak, S.; Gentile, M.; Stępniak, M. Paradoxes of (Post)Socialist Segregation: Metropolitan Socio-spatial Divisions Under Socialism and After In Poland. Urban Geogr. 2013, 34, 327–352. [Google Scholar] [CrossRef]
- Fowler, C.S.; Frey, N.; Folch, D.C.; Nagle, N.; Spielman, S. Who Are the People in My Neighborhood?: The “Contextual Fallacy” of Measuring Individual Context with Census Geographies. Geogr. Anal. 2020, 52, 155–168. [Google Scholar] [CrossRef]
- Cai, W.; Shen, Z. Heterogeneity, Differentiation Mechanisms and Social Effects of Urban Residential Space in China’s Large Cities: A Case Study of Wuhan. Land 2024, 13, 85. [Google Scholar] [CrossRef]
- Boterman, W.R.; Musterd, S.; Manting, D. Multiple Dimensions of Residential Segregation. The Case of the Metropolitan Area of Amsterdam. Urban Geogr. 2021, 42, 481–506. [Google Scholar] [CrossRef]
- Tammaru, T.; Marcin’czak, S.; Aunap, R.; Van Ham, M.; Janssen, H. Relationship between Income Inequality and Residential Segregation of Socioeconomic Groups. Reg. Stud. 2020, 54, 450–461. [Google Scholar] [CrossRef]
- Hennerdal, P.; Nielsen, M.M. A Multiscalar Approach for Identifying Clusters and Segregation Patterns That Avoids the Modifiable Areal Unit Problem. Ann. Am. Assoc. Geogr. 2017, 107, 555–574. [Google Scholar] [CrossRef]
- Zhang, T.; Duan, X.; Wong, D.W.S.; Lu, Y. Discovering Income-Economic Segregation Patterns: A Residential-Mobility Embedding Approach. Comput. Environ. Urban Syst. 2021, 90, 101709. [Google Scholar] [CrossRef]
- Park, R.E. The City: Suggestions for the Investigation of Human Behavior in the City Environment. Am. J. Sociol. 1915, 20, 577–612. [Google Scholar] [CrossRef]
- Harvey, D. Class Structure in a Capitalist Society and the Theory of Residential Differentation; Heinemann: Portsmouth, NH, USA, 1975. [Google Scholar]
- Canadine, D. Residential Differentiation in Nineteenth Century; Routledge: England, UK, 2021; ISBN 978-1-00-317026-6. [Google Scholar]
- Clark, W.A.V.; Ong ViforJ, R.; Truong, N.T.K. Neighbourhood Selection and Neighbourhood Matching: Choices, Outcomes and Social Distance. Urban Stud. 2022, 59, 937–955. [Google Scholar] [CrossRef]
- Pinkster, F.M.; Ferier, M.S.; Hoekstra, M.S. On the Stickiness of Territorial Stigma: Diverging Experiences in Amsterdam’s Most Notorious Neighbourhood. Antipode 2020, 52, 522–541. [Google Scholar] [CrossRef]
- Sager, L. Residential Segregation and Socioeconomic Neighbourhood Sorting: Evidence at the Micro-Neighbourhood Level for Migrant Groups in Germany. Urban Stud. 2012, 49, 2617–2632. [Google Scholar] [CrossRef]
- Modai-Snir, T.; Plaut, P. The Analysis of Residential Sorting Trends: Measuring Disparities in Socio-Spatial Mobility. Urban Stud. 2019, 56, 288–300. [Google Scholar] [CrossRef] [PubMed]
- Kim, C.; Choi, H.; Choi, Y. Retirement Age and Housing Consumption: The Case of South Korea. Sustainability 2021, 13, 1286. [Google Scholar] [CrossRef]
- Chen, G. The Heterogeneity of Housing-Tenure Choice in Urban China: A Case Study Based in Guangzhou. Urban Stud. 2016, 53, 957–977. [Google Scholar] [CrossRef]
- Catney, G. The Complex Geographies of Ethnic Residential Segregation: Using Spatial and Local Measures to Explore Scale-dependency and Spatial Relationships. Trans. Inst. Br. Geogr. 2018, 43, 137–152. [Google Scholar] [CrossRef]
- Haandrikman, K.; Costa, R.; Malmberg, B.; Rogne, A.F.; Sleutjes, B. Socioeconomic Segregation in European Cities. A Comparative Study of Brussels, Copenhagen, Amsterdam, Oslo and Stockholm. Urban Geogr. 2023, 44, 1–36. [Google Scholar] [CrossRef]
- Azhdari, A.; Sasani, M.A.; Soltani, A. Exploring the Relationship between Spatial Driving Forces of Urban Expansion and Socioeconomic Segregation: The Case of Shiraz. Habitat Int. 2018, 81, 33–44. [Google Scholar] [CrossRef]
- Schelling, T.C. Dynamic Models of Segregation. J. Math. Sociol. 1971, 1, 143–186. [Google Scholar] [CrossRef]
- Minh, A.; Muhajarine, N.; Janus, M.; Brownell, M.; Guhn, M. A Review of Neighborhood Effects and Early Child Development: How, Where, and for Whom, Do Neighborhoods Matter? Health Place 2017, 46, 155–174. [Google Scholar] [CrossRef]
- Fu, H.; Liu, J.; Dong, X.; Chen, Z.; He, M. Evaluating the Sustainable Development Goals within Spatial Planning for Decision-Making: A Major Function-Oriented Zone Planning Strategy in China. Land 2024, 13, 390. [Google Scholar] [CrossRef]
- Petrović, A.; Manley, D.; Van Ham, M. Freedom from the Tyranny of Neighbourhood: Rethinking Socio-spatial Context Effects. Prog. Hum. Geogr. 2020, 44, 1103–1123. [Google Scholar] [CrossRef]
- Friedman, S.; Wynn, C.E.; Tsao, H. Racial and Ethnic Residential Segregation by Family Structure and the Presence of Children in Metropolitan America. Race Soc. Probl. 2022, 14, 170–188. [Google Scholar] [CrossRef]
- Nielsen, M.M.; Hennerdal, P. Changes in the Residential Segregation of Immigrants in Sweden from 1990 to 2012: Using a Multi-Scalar Segregation Measure That Accounts for the Modifiable Areal Unit Problem. Appl. Geogr. 2017, 87, 73–84. [Google Scholar] [CrossRef]
- Xiao, Y.; Miao, S.; Sarkar, C.; Fan, L.; Li, Z. Do Neighborhood Ties Matter for Residents’ Mental Health in Affordable Housing: Evidence from Guangzhou, China. Cities 2020, 100, 102666. [Google Scholar] [CrossRef]
- Ren, P.; Li, Y.; You, K. Residents’ Demands for Urban Retail: Heterogeneity in Housing Structure Characteristics, Price Quantile, and Space. Land 2021, 10, 1321. [Google Scholar] [CrossRef]
- Petrović, A.; Van Ham, M.; Manley, D. Where Do Neighborhood Effects End? Moving to Multiscale Spatial Contextual Effects. Ann. Am. Assoc. Geogr. 2022, 112, 581–601. [Google Scholar] [CrossRef]
- Friedman, S. Residential Segregation in Comparative Perspective; Routledge: England, UK, 2016. [Google Scholar]
- Petrović, A.; Manley, D.; Van Ham, M. Multiscale Contextual Poverty in the Netherlands: Within and Between-Municipality Inequality. Appl. Spat. Anal. Policy 2022, 15, 95–116. [Google Scholar] [CrossRef]
- Chen, K.; Long, H.; Qin, C. The Impacts of Capital Deepening on Urban Housing Prices: Empirical Evidence from 285 Prefecture-Level or above Cities in China. Habitat Int. 2020, 99, 102173. [Google Scholar] [CrossRef]
- Li, H.; Wei, Y.D.; Wu, Y.; Tian, G. Analyzing Housing Prices in Shanghai with Open Data: Amenity, Accessibility and Urban Structure. Cities 2019, 91, 165–179. [Google Scholar] [CrossRef]
- Niu, F.; Yang, X.; Wang, F. Urban Agglomeration Formation and Its Spatiotemporal Expansion Process in China: From the Perspective of Industrial Evolution. Chin. Geogr. Sci. 2020, 30, 532–543. [Google Scholar] [CrossRef]
- Zhan, D.; Kwan, M.-P.; Zhang, W.; Xie, C.; Zhang, J. Impact of the Quality of Urban Settlements on Housing Prices in China. J. Urban Plan. Dev. 2021, 147, 05021044. [Google Scholar] [CrossRef]
- Wu, Q.; Cheng, J.; Chen, G.; Hammel, D.J.; Wu, X. Socio-Spatial Differentiation and Residential Segregation in the Chinese City Based on the 2000 Community-Level Census Data: A Case Study of the Inner City of Nanjing. Cities 2014, 39, 109–119. [Google Scholar] [CrossRef]
- Raudenbush, S.W.; Sampson, R.J. Ecometrics: Toward a Science of Assessing Ecological Settings, with Application to the Systematic Social Observation of Neighborhoods. Sociol. Methodol. 1999, 29, 1–41. [Google Scholar] [CrossRef]
- Feitosa, F.F.; Câmara, G.; Monteiro, A.M.V.; Koschitzki, T.; Silva, M.P.S. Global and Local Spatial Indices of Urban Segregation. Int. J. Geogr. Inf. Sci. 2007, 21, 299–323. [Google Scholar] [CrossRef]
- Spielman, S.E.; Thill, J.-C. Social Area Analysis, Data Mining, and GIS. Comput. Environ. Urban Syst. 2008, 32, 110–122. [Google Scholar] [CrossRef]
- Lens, M.C. Measuring the Geography of Opportunity. Prog. Hum. Geogr. 2017, 41, 3–25. [Google Scholar] [CrossRef]
- Atkinson, R.; Flint, J. Fortress UK? Gated Communities, the Spatial Revolt of the Elites and Time–Space Trajectories of Segregation. Hous. Stud. 2004, 19, 875–892. [Google Scholar] [CrossRef]
- Dannemann, T.; Sotomayor-Gómez, B.; Samaniego, H. The Time Geography of Segregation during Working Hours. R. Soc. Open Sci. 2018, 5, 180749. [Google Scholar] [CrossRef]
- Li, F.; Wang, D. Measuring Urban Segregation Based on Individuals’ Daily Activity Patterns: A Multidimensional Approach. Environ. Plan. Econ. Space 2017, 49, 467–486. [Google Scholar] [CrossRef]
- Van Ham, M.; Tammaru, T. New Perspectives on Ethnic Segregation over Time and Space. A Domains Approach. Urban Geogr. 2016, 37, 953–962. [Google Scholar] [CrossRef]
- Joassart-Marcelli, P. Gender, Social Network Geographies, and Low-Wage Employment among Recent Mexican Immigrants in Los Angeles. Urban Geogr. 2014, 35, 822–851. [Google Scholar] [CrossRef]
- Malmberg, B.; Andersson, E.K.; Bergsten, Z. Composite Geographical Context and School Choice Attitudes in Sweden: A Study Based on Individually Defined, Scalable Neighborhoods. Ann. Assoc. Am. Geogr. 2014, 104, 869–888. [Google Scholar] [CrossRef]
- Smet, K. Housing Prices in Urban Areas. Prog. Hum. Geogr. 2016, 40, 495–510. [Google Scholar] [CrossRef]
- Connor, D.S.; Gutmann, M.P.; Cunningham, A.R.; Clement, K.K.; Leyk, S. How Entrenched Is the Spatial Structure of Inequality in Cities? Evidence from the Integration of Census and Housing Data for Denver from 1940 to 2016. Ann. Am. Assoc. Geogr. 2020, 110, 1022–1039. [Google Scholar] [CrossRef]
- Zhang, S.; Yang, Y.; Zhen, F.; Lobsang, T. Exploring Temporal Activity Patterns of Urban Areas Using Aggregated Network-Driven Mobile Phone Data: A Case Study of Wuhu, China. Chin. Geogr. Sci. 2020, 30, 695–709. [Google Scholar] [CrossRef]
- Huang, Q.; Chen, J. Geographic Information Dataset of Mobile Phone User Portrait in Inner-city Nanjing (2020)GCdataPR. E-Mag. Engl. Chin. 2024, in press.
- Pettengill, R.; Friedman, M. Theory of the Consumption Function. Rev. Econ. Stat. 1957, 40, 431. [Google Scholar] [CrossRef]
- Song, W.; Mao, N.; Chen, P.; Yuan, Y.; Wang, Y. Coupling mechanism and spatial-temporal pattern of residential differentiation from the perspective of housing prices: A case study of Nanjing. Acta Geogr. Sin. 2017, 72, 589–602. [Google Scholar] [CrossRef]
- Park, Y.M.; Kwan, M.-P. Beyond Residential Segregation: A Spatiotemporal Approach to Examining Multi-Contextual Segregation. Comput. Environ. Urban Syst. 2018, 71, 98–108. [Google Scholar] [CrossRef]
- Wang, D.; Li, F.; Chai, Y. Activity Spaces and Socio-spatial Segregation in Beijing. Urban Geogr. 2012, 33, 256–277. [Google Scholar] [CrossRef]
- Li, R.; Tong, D. Constructing Human Activity Spaces: A New Approach Incorporating Complex Urban Activity-Travel. J. Transp. Geogr. 2016, 56, 23–35. [Google Scholar] [CrossRef]
- Liu, C.; Song, W. Perspectives of Socio-Spatial Differentiation from Soaring Housing Prices: A Case Study in Nanjing, China. Sustainability 2019, 11, 2627. [Google Scholar] [CrossRef]
- Huang, X.; Yang, Y. Urban Redevelopment, Gentrification and Gentrifiers in Post-Reform Inland China: A Case Study of Chengdu, China. Chin. Geogr. Sci. 2017, 27, 151–164. [Google Scholar] [CrossRef]
- Klinthäll, M.; Urban, S. The Strength of Ethnic Ties: Routes into the Labour Market in Spaces of Segregation. Urban Stud. 2016, 53, 3–16. [Google Scholar] [CrossRef]
- Wu, Q.; Wallace, M. Hukou Stratification, Class Structure, and Earnings in Transitional China. Chin. Sociol. Rev. 2021, 53, 223–253. [Google Scholar] [CrossRef]
- Liu, Y.; He, S.; Wu, F. Housing Differentiation under Market Transition in Nanjing, China. Prof. Geogr. 2012, 64, 554–571. [Google Scholar] [CrossRef]
Disclaimer/Publisher’s Note: The statements, opinions and data contained in all publications are solely those of the individual author(s) and contributor(s) and not of MDPI and/or the editor(s). MDPI and/or the editor(s) disclaim responsibility for any injury to people or property resulting from any ideas, methods, instructions or products referred to in the content. |
© 2024 by the authors. Licensee MDPI, Basel, Switzerland. This article is an open access article distributed under the terms and conditions of the Creative Commons Attribution (CC BY) license (https://creativecommons.org/licenses/by/4.0/).