Article

Ensemble Machine-Learning-Based Framework for Estimating Surface Soil Moisture Using Sentinel-1/2 Data: A Case Study of an Arid Oasis in China

by
Junhao Liu
1,2,†,
Zhe Hao
3,4,5,†,
Jianli Ding
1,2,6,*,
Yukun Zhang
3,4,5,
Zhiguo Miao
3,4,5,
Yu Zheng
3,4,5,
Alimira Alimu
3,4,5,
Huiling Cheng
3,4,5 and
Xiang Li
1,2
1
College of Geography and Remote Sensing Sciences, Xinjiang University, Urumqi 830046, China
2
Xinjiang Key Laboratory of Oasis Ecology, Xinjiang University, Urumqi 830046, China
3
Xinjiang Uygur Autonomous Region Comprehensive Land Management Center, Urumqi 830063, China
4
Ministry of Natural Resources Desert-Oasis Ecological Monitoring and Restoration Engineering Technology Innovation Center, Urumqi 830063, China
5
Field Scientific Observatory for Soil and Water Processes and Ecological Security in Oasis of Tarim River Headwaters Area, Ministry of Natural Resources of China, Aksu 843000, China
6
Xinjiang Institute of Technology, Aksu 843100, China
*
Author to whom correspondence should be addressed.
These authors contributed equally to this work.
Land 2024, 13(10), 1635; https://doi.org/10.3390/land13101635
Submission received: 10 September 2024 / Revised: 2 October 2024 / Accepted: 4 October 2024 / Published: 8 October 2024

Abstract

Soil moisture (SM) is a critical parameter in Earth’s water cycle, significantly impacting hydrological, agricultural, and meteorological research fields. The challenge of estimating surface soil moisture from synthetic aperture radar (SAR) data is compounded by the influence of vegetation coverage. This study focuses on the Weigan River and Kuche River Delta Oasis in Xinjiang, employing high-resolution Sentinel-1 and Sentinel-2 images in conjunction with a modified Water Cloud Model (WCM) and the grayscale co-occurrence matrix (GLCM) for feature parameter extraction. A soil moisture inversion method based on stacked ensemble learning is proposed, which integrates random forest, CatBoost, and LightGBM. The findings underscore the feasibility of using multi-source remote sensing data for oasis moisture inversion in arid regions. However, soil moisture content estimates tend to be overestimated above 10% and underestimated below 5%. The CatBoost model achieved the highest accuracy (R2 = 0.827, RMSE = 0.014 g/g) using the top 16 feature parameter groups. Additionally, the R2 values for Stacking1 and Stacking2 models saw increases of 0.008 and 0.016, respectively. Thus, integrating multi-source remote sensing data with Stacking models offers valuable support and reference for large-scale estimation of surface soil moisture content in arid oasis areas.

1. Introduction

Surface soil moisture (SSM) plays a crucial role in understanding the Earth’s water cycle and has profound impacts on energy and water exchange in fields such as ecosystems, climate change, and agricultural production [1,2]. It is crucial for the processes of precipitation, surface water, and groundwater transformation, directly impacting ecosystem health and the management of water resources [3,4]. Moreover, accurate acquisition of soil moisture with high temporal and spatial resolution is particularly important for precise irrigation, crop growth monitoring, and field estimation in agricultural production [5]. At present, although soil moisture constitutes a relatively minor fraction of the Earth’s surface—ranging from 0 to 0.05%—it is pivotal in regulating the exchange of water vapor and energy between the soil and atmosphere through transpiration [6]. Different applications require varying spatial scales of soil moisture data. For instance, climate models and hydrological studies might necessitate coarse spatial resolution data, whereas agricultural applications demand high-resolution soil moisture information. The implementation of precision agriculture and advances in information technology have underscored the importance of high-precision soil monitoring and management, markedly enhancing soil moisture utilization efficiency. Especially in arid areas, soil moisture, as an indispensable resource, seriously restricts the sustainable development of the oasis economy and the stability of the ecological environment [7]. This work focuses on using high-resolution Sentinel data to retrieve soil moisture, aiming to meet the demands of applications requiring detailed spatial information. Sentinel satellites provide valuable high-resolution data that can significantly improve the accuracy of soil moisture retrievals. Therefore, precise inversion of soil moisture is of great significance for understanding and solving agricultural production, ecological planning, and drought monitoring.
Traditional SSM monitoring techniques mainly rely on mass weighing, SSM meters, and ground observation stations. However, these measurement methods are mainly based on specific sampling points. Although these methods can provide high soil moisture measurement accuracy, the number and coverage range of sampling points are significantly limited, and there are also shortcomings such as poor timeliness and lack of spatial continuity of points, making it difficult to accurately and effectively monitor SSM information on a large scale [8,9]. Remote sensing technology is a technology that can obtain large-scale, planar soil moisture, and has the advantages of large-scale, efficient, and dynamic monitoring advancements in automated soil moisture measurement [10]. At the same time, theoretical models have also been developed. Currently, the methods for retrieving soil moisture based on remote sensing are mainly divided into physical models (the advanced integral equation model [11]), empirical models (Oh model [12]), and semi-empirical models (Shi model [13]). These models exhibit certain differences in migration performance across different regions and periods. For vegetation-covered areas, widely used scattering models mainly include WCM [14] and Michigan microwave canopy scattering models [15]. Among them, the semi-empirical WCM, in particular, is valued for its straightforward approach and practicality in elucidating the radar scattering mechanisms over surfaces with low vegetation cover. Cui et al. [16] used Sentinel data and employed an ANN SMC inverse algorithm that combines WCM, AIEM, and Oh model databases. This confirms that the SM inversion of Sentinel-1 in low vegetation areas has higher accuracy. Baghdadi et al. [17] calibrated the WCM using NDVI and analyzed the impact of different polarizations on radar signals using Sentinel-1/2 remote sensing data. By integrating soil surface scattering models with vegetation scattering models, these approaches aim to disentangle the combined effects of vegetation and soil on SAR signals. This separation helps prevent the underestimation or overestimation often encountered in radar-based soil moisture inversion processes. Despite these advancements, the intricate interactions among precipitation, surface water, soil water, and groundwater within ecosystems pose a significant challenge, often beyond the scope of single-sensor remote sensing to capture comprehensively and accurately.
In recent years, the request for higher precision in soil moisture monitoring, especially under complex surface conditions like vast bare soil expanses and vegetated areas, has intensified. This has led to a growing consensus on the necessity of integrating the unique advantages of both high-resolution optical and microwave satellite sensors. Such integration aims to overcome the inherent limitations and challenges associated with relying on a single satellite sensor type for soil moisture detection. Consequently, an increasing number of researchers are exploring the collaborative inversion of multi-source remote sensing data to enhance soil moisture estimation accuracy [18,19]. Pioneering work by Ma et al. [20] introduced an algorithm that utilizes SAR and multispectral imagery to concurrently estimate soil moisture, surface roughness, and vegetation moisture content. Their findings underscore the efficacy of VV polarization, particularly in COSMOS and single-site scenarios, thereby underscoring SAR’s utility in agricultural settings. Similarly, Zhang et al. [21] combined Terra-SAR and Landsat-7 data to develop a comprehensive scattering model. Their proposed inversion method, capable of estimating soil moisture across various corn growth stages, yielded correlation coefficients ranging from 0.72 to 0.87. These studies exemplify the promise of multi-source remote sensing in soil moisture content estimation endeavors. Despite these advances, the challenge of achieving high precision soil moisture inversion in areas with dense vegetation, particularly when starting from small sample datasets, remains formidable.
Machine learning techniques represent a paradigm shift in soil moisture monitoring, establishing empirical relationships between independent variables and soil moisture without the constraints of input parameter quantity and type. This approach facilitates the learning of nonlinear and complex mapping relationships. To date, a variety of machine learning techniques, including Random Forest (RF) [22], Support Vector Machine (SVM) [23], and Artificial Neural Network (ANN) [24], have been employed to enhance the accuracy of soil moisture inversion. In contrast, ensemble learning methods generally exhibit superior predictive performance. Predominantly incorporating the Bagging algorithm [25], Boosting algorithm [26], and Stacking algorithm. Notably, Wang et al. [27] developed a soil moisture retrieval model utilizing ensemble learning algorithms, demonstrating the RF model’s superiority over the adaptive boosting model. This framework, which capitalizes on diverse data and models, holds significant promise for soil moisture estimation. Similarly, Zhang et al. [28] leveraged Landsat8 optical and thermal observation data, finding through cross-validation that the XGBoost model within an ensemble learning framework slightly outperforms the RF model in applications such as climate change and agricultural monitoring, showcasing its potential. Liu et al. [29] used Sentinel data to retrieve SM based on multiple regression algorithms and deep neural network (DNN) algorithms. DNN’s estimation accuracy for SM exceeded GRNN and RFR. Furthermore, Feng et al. [30] crafted an integrated machine-learning model, applying it successfully to predict alfalfa yield. These algorithms typically exhibit more accurate predictive performance, surpassing parametric regression models in terms of predictive model capability [31,32,33]. Despite these advancements, research on soil moisture inversion in arid oasis areas through ensemble learning is still relatively nascent. Integrated learning can integrate the results of multiple learning methods to enhance the generalization ability of the original method, which is more accurate than a single model, and has the potential to improve the accuracy of soil moisture estimation.
The specific research question that this research is addressing is: “How can multiple remote sensing parameters and advanced machine learning algorithms be optimized and integrated into an ensemble learning model to accurately estimate high-resolution (15 m) soil moisture in arid oasis areas, and how does this approach enhance prediction accuracy and performance in large-scale soil moisture inversion?” The primary objectives of this work are as follows: (1) to propose a high-precision soil moisture inversion method based on multiple parameters; (2) to evaluate and optimize machine learning algorithms; (3) to apply an innovative ensemble learning model, and enhance prediction accuracy and performance in large-scale soil moisture estimation for arid oasis areas.
Filling the gaps in soil moisture estimation research in the Xinjiang region, this study proposes the following innovations and contributions. First, although many studies have explored the application of multi-source remote sensing data in soil moisture inversion (such as Ma et al. [20] and Zhang et al. [21]), these studies mostly focus on non-arid areas or crop monitoring scenarios, and pay less attention to the complex impact of the special ecological environment and vegetation cover in arid oasis areas on soil moisture estimation. They integrate high-resolution Sentinel-1 and Sentinel-2 imagery with a modified WCM and a GLCM for feature extraction. This novel approach effectively addresses the challenges posed by vegetation coverage in SAR data. Second, existing literature mainly utilizes traditional physical and empirical models for soil moisture inversion (such as Cui et al. [16] and Baghdadi et al. [17]). Based on this, this study evaluates three machine learning algorithms that are well-suited for small sample training—RF, CatBoost, and LightGBM—and proposes an innovative soil moisture inversion method based on a stacked ensemble learning architecture. The results indicate that CatBoost has the best prediction accuracy and the ensemble model has higher prediction performance. The integration of multi-source remote sensing data with Stacking models provides a robust framework for more reliable and accurate soil moisture assessments. This study contributes valuable insights for the sustainable management and monitoring of arid oasis ecosystems.

2. Study Area and Data

2.1. Study Area

The selection of the Weiku Oasis within the Tarim Basin in Xinjiang Uygur Autonomous Region as the study area provides a unique opportunity to explore soil moisture inversion in a distinctly arid oasis environment. This delta oasis, framed by the geographical coordinates of 80°37′ E to 83°59′ E and 41°06′ N to 42°40′ N, showcases a diverse topography that transitions from elevated northern terrains to lower southern plains, culminating in a fan-shaped oasis landscape, as shown in Figure 1. Recognized as a quintessential example of an arid oasis, the Weiku Oasis spans approximately 9500 km2 and experiences a continental warm temperate arid climate. With average annual temperatures ranging between 10.5 °C and 14.4 °C, and an annual precipitation of 55.45 mm that predominantly occurs between June and July, the area’s climate underscores the challenges and significance of accurate soil moisture monitoring in such environments [34,35].
The topography of the Weiku Oasis is categorized into three principal sections: the Tianshan Mountains to the north, the central area’s residual hills characterized by low mountains and the Qiulitag Mountains, and the alluvial fan plain in the south [36]. These landforms are formed by the erosion of the Weigan River and Kuche River systems, specifically manifested as alluvial fan plains. The geomorphic types of the study area include internal agricultural oasis, peripheral Saline desert ecotone, and saline-alkali desert. Vegetation is divided into artificial vegetation in irrigation areas and natural vegetation in the desert oasis ecotone, mainly including crops such as cotton, wheat, corn, rice, etc. [37]. The alluvial fan plain has formed gentle hills and low-lying areas, the region is dominated by three soil groups according to the World Reference Base for Soil Resources (IUSS Working Group WRB, 2007): Calcisols, Solonchaks, and Regosols, offering a rich tapestry of conditions for examining soil moisture dynamics in arid oasis ecosystems [38].

2.2. Data

The Sentinel-1 employs a constellation of C-band Synthetic Aperture Radar satellites, Sentinel-1A and Sentinel-1B, dedicated to global environmental surveillance and security purposes [39]. This advanced SAR system is pivotal for a wide array of applications ranging from ocean and land monitoring to emergency response and climate studies. The Sentinel-1 satellites offer four primary imaging modes to cater to diverse monitoring needs: the Interferometric Wide (IW) mode, the Extra Wide (EW) mode, the Strip Map (SM) mode, and the Wave (WV) mode. These modes provide a spectrum of resolution and coverage options, ensuring flexibility and adaptability in various research and operational scenarios. In the context of this study, the choice to utilize Single Look Complex (SLC) image data in the Interferometric Wide (IW) mode is particularly noteworthy. This mode, known for its two polarization capabilities (VV and VH), is adept at capturing detailed surface information. It stands out by offering a fine balance between high spatial resolution (5 m × 20 m) and substantial swath width (250 km), thus delivering enhanced imaging performance suitable for precise environmental monitoring tasks (https://search.asf.alaska.edu/#/, (accessed on 16 June 2023)).
The preprocessing of SLC format data encompasses a series of critical steps to ensure the accuracy and usability of the information derived from Sentinel-1 images. These steps include orbit correction to adjust for satellite positioning errors, thermal noise removal to enhance signal clarity, radiometric calibration for consistent image brightness and contrast, and filtering to reduce speckle noise. Additional preprocessing steps such as Deburst, polarization decomposition, multi-view processing, and terrain correction are essential for preparing the data for analysis. Table 1 shows the various parameters of Sentinel-1 data.
Sentinel-2 carries a MSI (Multispectral Instrument) sensor, comprising two satellites—Sentinel-2A and Sentinel-2B—that enhance Earth observation capabilities by halving the revisit time to just five days [40], thanks to its dual-satellite configuration. This rapid revisit capability is crucial for monitoring dynamic Earth surface conditions and ensures timely data acquisition (https://earthexplorer.usgs.gov/, (accessed on 29 June 2023)). For this study, Sentinel-2A data from 15 June 2022, at Level-1C was utilized, chosen for its temporal proximity to the radar data, facilitating a cohesive analysis. The preprocessing of Sentinel-2 data is comprehensive, involving radiometric calibration, atmospheric correction, geometric correction, resampling (15 m), and image stitching and cropping. Within this study, Sentinel-2 data serves as a basis for calculating several key indices in ENVI 5.3 software, including the Normalized Difference Vegetation Index (NDVI), Normalized Difference Water Index (NDWI), Normalized Difference Moisture Index (NDMI), and the Enhanced Vegetation Index (EVI) [41,42,43]. These indices are essential for assessing vegetation health, soil moisture, and water content, providing critical insights into the environmental conditions of the study area.
Additionally, the study incorporates the Advanced Spaceborne Thermal Emission and Reflection Radiometer Global Digital Elevation Model (ASTER-GDEM) with a 30 m resolution (https://www.gscloud.cn/, (accessed on 29 June 2023)). This digital elevation data, sourced from the spatial geographic data cloud, is instrumental in global Earth observation research [44,45].
In addition, the field investigation was conducted from 15 June 2022, to 22 June 2022. Taking into account factors such as vegetation cover and soil characteristics, a total of 89 representative sampling sites were identified for soil collection. These sites, all situated more than 1 km apart from each other, were evenly distributed in cultivated areas, transitional desert zones, and regions beyond the oasis to ensure a comprehensive spatial distribution.
Within a range of 30 m × 30 m, soil samples from the surface (0–5 cm) were collected in a five-point plum blossom shape. The collected soil samples were loaded into aluminum boxes of known mass and recorded as m0. Under laboratory conditions, the collected aluminum boxes were dried at 105 °C for 48 h to constant weight, and the dry soil and aluminum box mass md were measured again to determine the weight and water content (or mass water content) of the soil sample θm can be calculated using Equation (1):
θ m = m 0 m d m d m a × 100 %
where m0 represents the mass of the soil sample and aluminum box before drying; md is the mass of the dried soil sample and aluminum box; ma represents the quality of the empty aluminum box.

3. Methods

This investigation employed satellite observations from Sentinel-1 and Sentinel-2 and Digital Elevation Models to compile feature datasets. Subsequently, it leveraged three distinct machine-learning algorithms to develop models for the inversion of soil moisture. Building upon these foundational models, the study introduced a sophisticated Stacking ensemble learning framework by integrating multiple individual machine-learning models through ensemble learning techniques. The methodology adopted for model development within this research is depicted in Figure 2.

3.1. Sentinel-1 Feature Parameters

Based on the measured soil moisture, the sampling points latitude and longitude were used to extract the incident angle(θ) through SAR data [46] and backscatter coefficient (VH, VV) [47]. Unlike the backscatter coefficient of images, polarization decomposition is a method of parameterizing the information contained in polarimetric radar measurements. H/α Polarization decomposition [48] can be determined by polarization scattering entropy (H) and average scattering angle (Alpha, α) Represented by inverse entropy (A) (Table 2). In addition, the vegetation types within the Wei Ku oasis are relatively uniform, mostly consisting of low and dwarf crops such as cotton and wheat. The WCM model is used to eliminate the contribution of vegetation to the total backscatter coefficient, as shown in Formulas (2)–(4):
σ c o n 0 ( θ ) = σ v e g 0 ( θ ) + γ 2 ( θ ) σ s o i l 0 ( θ )
σ v e g 0 ( θ ) = A · v w c · cos ( θ ) · ( 1 - γ 2 ( θ )
γ 2 ( θ ) p p = exp ( 2 B v w c / cos ( θ ) )
where σ c o n 0 ( θ ) is the total backscatter coefficient; σ v e g 0 ( θ ) is the backscatter coefficient contributed by vegetation; γ 2 ( θ ) is the double-layer attenuation factor of electromagnetic waves penetrating the crop layer; σ s o i l 0 ( θ ) is the radar backscatter coefficient of the exposed surface; vwc is the average moisture content of vegetation; A and B are the revised values of the constant term for different vegetation moisture content parameters; θ is the incident angle of the radar wave.
In this study, the values of A and B were based on the results of Bindlish and Barros [49], and combined with the distribution of vegetation types in the Wei Ku oasis wetland, the vegetation types were classified as comprehensive types, namely A = 0.0012 and B = 0.091. In addition, this study used the normalized vegetation moisture index to obtain the vegetation moisture content in the study area [50]. The VWC can be represented by Formula (5):
V W C = 2.15 N D M I + 0.32

3.2. Sentinel-2 Feature Parameters

Combined with the actual vegetation coverage in the study area and its correlation with soil moisture, four commonly used vegetation indices in SSM inversion studies were finally selected [51,52,53]. In addition, the GLCM [54] is used to extract texture features and then used as input data for SMC prediction. This study obtained texture information based on Matlab 9.4(R2018a) software and conducted correlation analysis with soil moisture. Finally, four texture feature values of Sentinel-2 images were selected, namely contrast (CON), dissimilarity (DIS), entropy (ENT), and second-order distance (SEC) (Table 2).

3.3. ASTER-GDEM Feature Parameters

Elevation, slope, and aspect were extracted as input feature sets from ASTER-GDEM utilizing ArcGIS 10.6 software. These geospatial attributes serve as critical variables in numerous environmental and geological studies. Han et al. [55] evaluate the accuracy of various global DEM datasets and explore their application performance in terrain analysis. Wang et al. [56] utilized environmental data such as ASTER-GDEM and improved the resolution and estimation accuracy of soil moisture data through the Bayesian maximum entropy algorithm, significantly optimizing the spatial estimation results. DEM providing foundational data for analyzing topographical influences on various natural phenomena (Table 2).

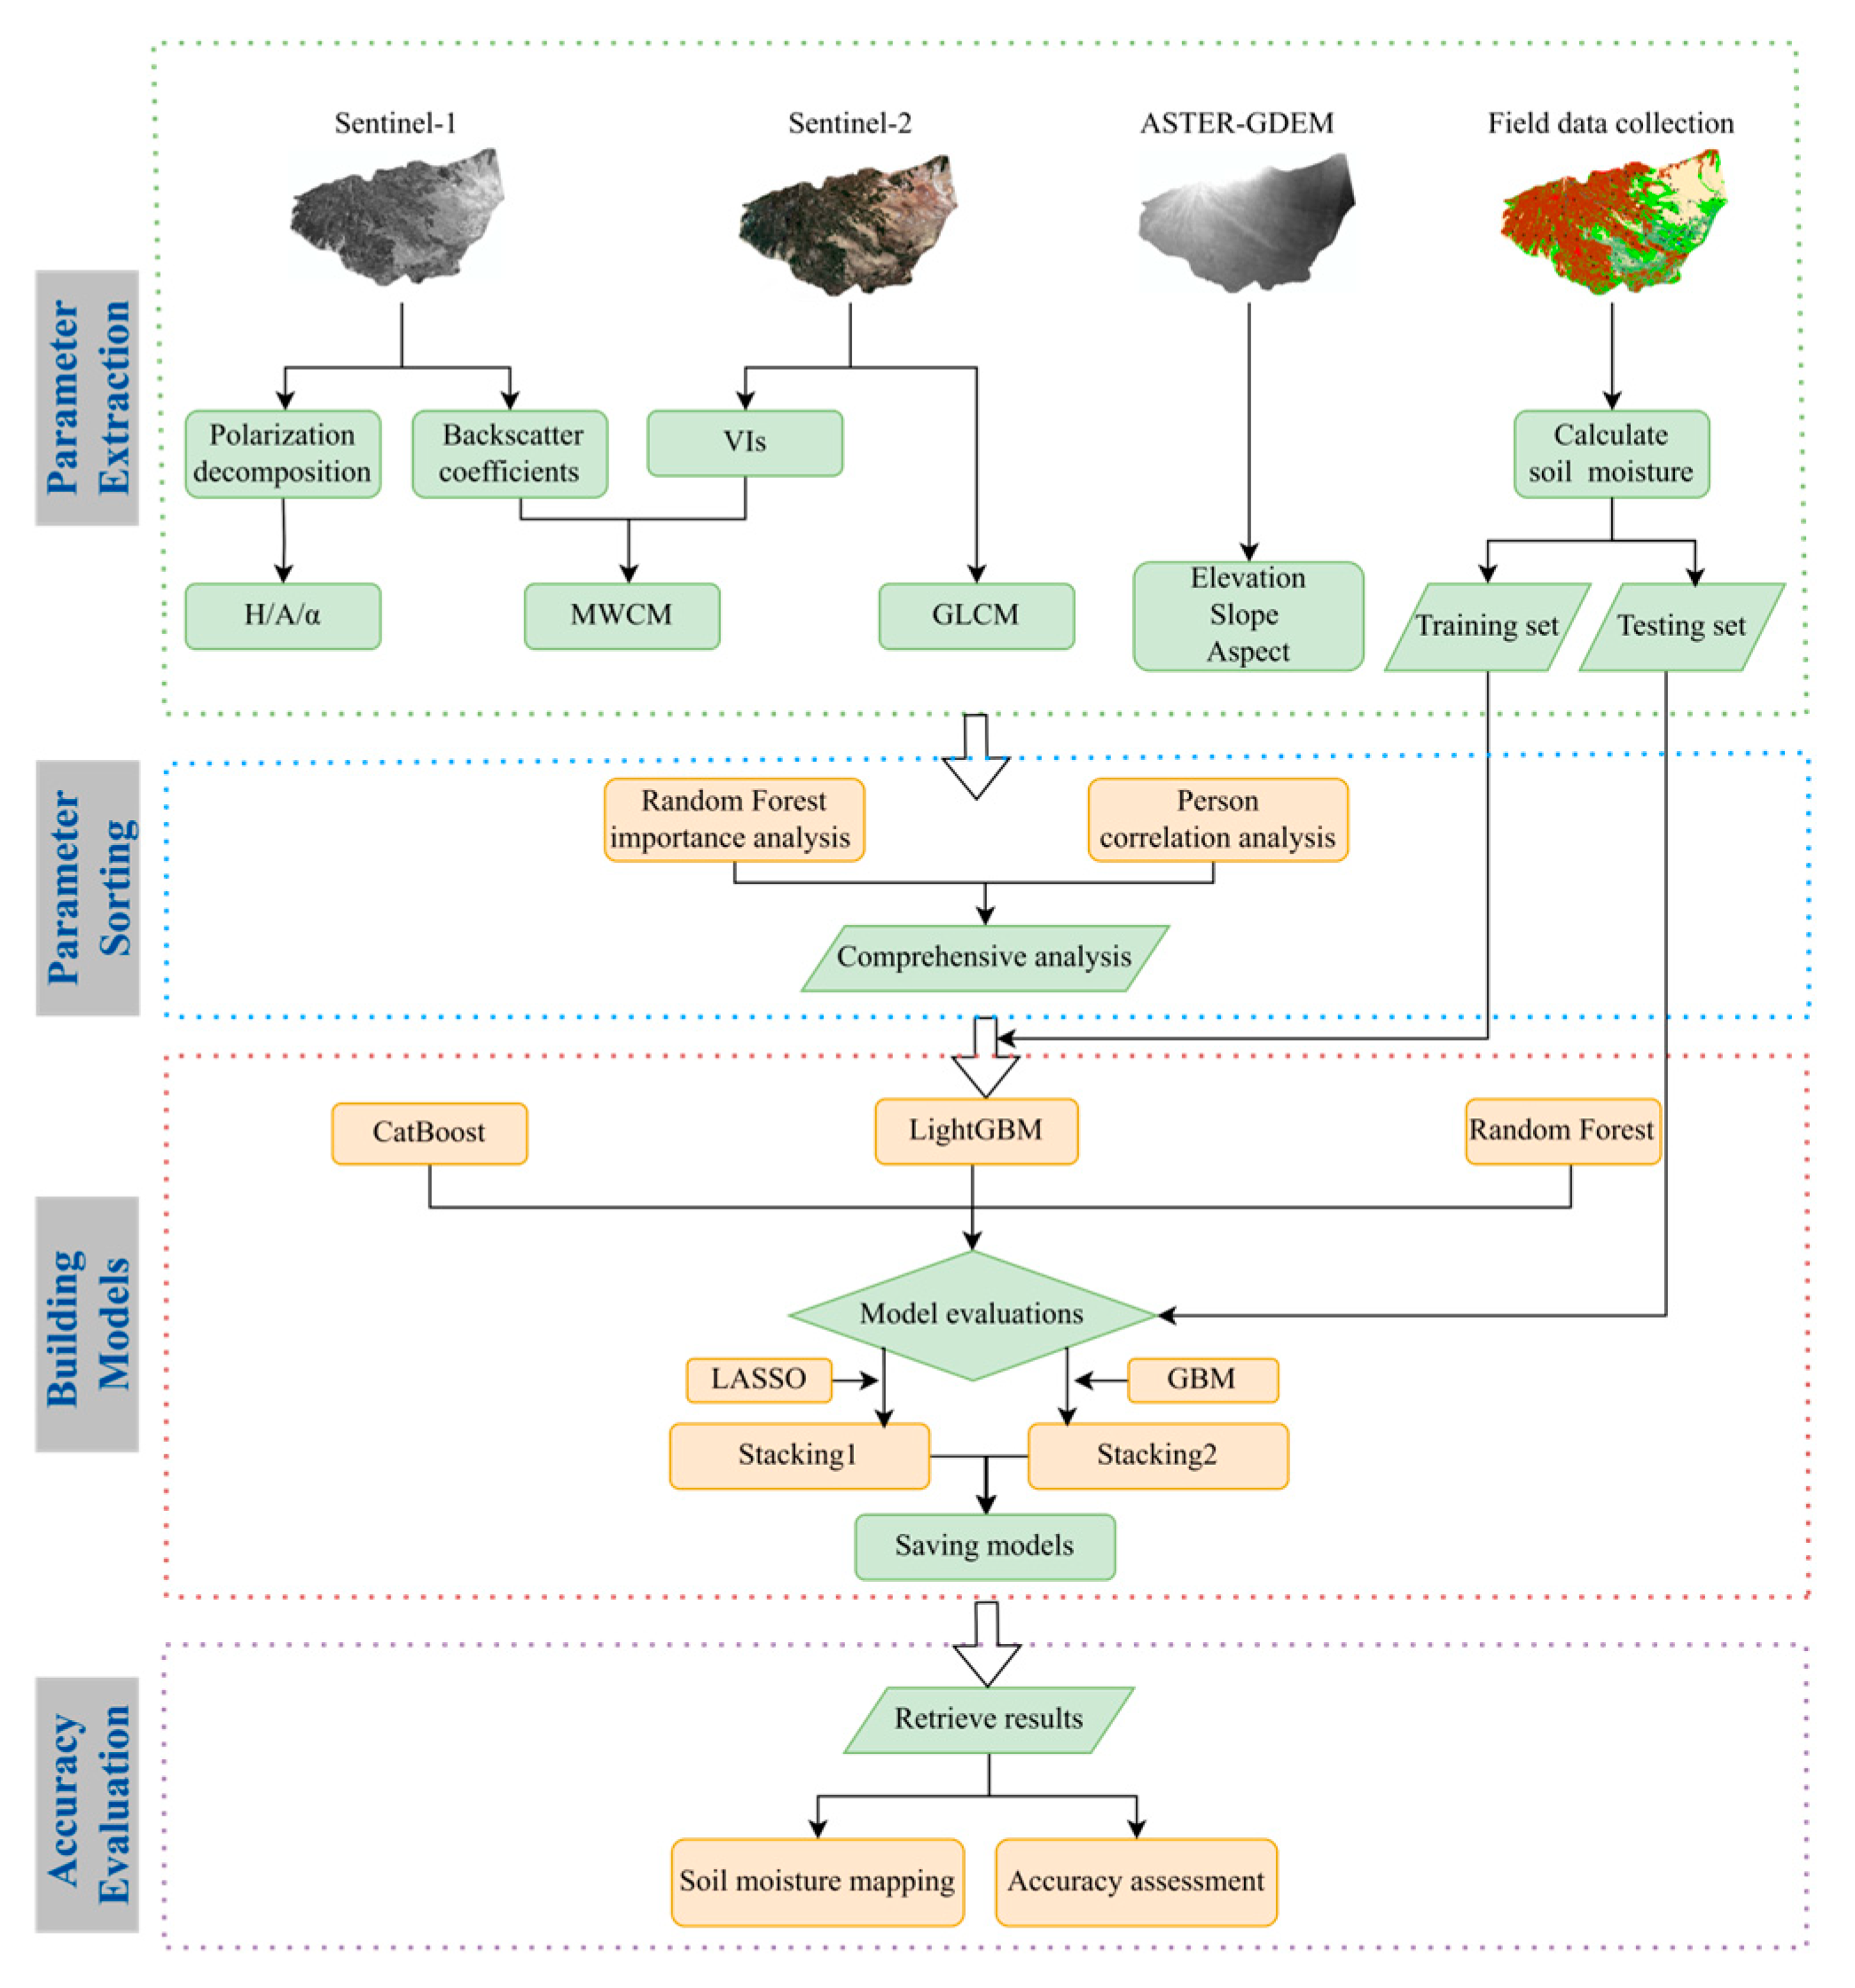
3.4. Modeling Framework for Soil Moisture Content

3.4.1. Parameter Sorting

This investigation established its modeling approach via two methodologies: the Pearson correlation coefficient and the significance of variables as assessed by random forest algorithms. The Pearson correlation coefficient (ρ) serves to quantify the degree of linear association between two variables, X and Y, offering a range from −1 to 1. The coefficient is determined by the following Formula (6):
ρ X , Y = cov ( X , Y ) σ X σ Y = E ( X Y ) E ( X ) E ( Y ) E ( X 2 ) E 2 ( X ) E ( Y 2 ) E 2 ( Y )
The closer P is to 1 or −1, the stronger the correlation. Positive values indicate a positive correlation, while negative values indicate a negative correlation. The closer P is to 0, the weaker the correlation.
The variable importance measurement in RF analysis prioritizes potential predictive variables based on their significance. This process entails assessing the model’s accuracy by excluding variables one at a time and evaluating their contribution to the prediction of the target variable. Within each tree of the forest, two-thirds of the data samples are allocated for training, while the remaining third serve as Out of Bag (OOB) samples for validation purposes. The criterion for determining the importance of each feature parameter is the average reduction in prediction accuracy that occurs when the feature is excluded. A larger average decline in prediction accuracy denotes a higher importance rank for the variable, indicating a stronger predictive capacity for soil moisture.

3.4.2. Building Models

All input features in Table 2 come from 89 sampling points (Figure 1c) and match the SMC measured in situ for each image. To improve prediction performance, this study used ensemble models to synthesize multiple single machine learning models for better performance without frequent iterations, This approach entailed two primary phases: (1) selection of varied foundational learners, including CatBoost [57], LightGBM [58], and RF [59], was undertaken to ensure each model’s distinctiveness while concurrently minimizing similarities amongst them [60]. This strategy, predicated on the robust performance of all constituent models, facilitated their integration for predictive tasks, thereby diminishing model bias and yielding more optimal outcomes. (2) The study initially applied the LASSO (Least Absolute Shrinkage and Selection Operator) model, a regularized linear model known for its efficacy in model simplification and variable selection. Concurrently, it explored the Generalized Augmented Regression Model (termed as Stacking2), tailored for handling nonlinear systems, thereby offering commendable predictive capabilities.
CatBoost consists of Categorical and Boosting, employing symmetric decision trees as the foundational learners. It sequentially integrates multiple base learners without altering the training sample set, thereby enhancing noise resilience through ordered boosting. This process creates a series of weak learners that are mutually dependent, culminating in a final prediction through weighted regression. Notably, CatBoost excels in accuracy, addressing gradient bias and prediction shift issues, mitigating overfitting, and thus elevating the algorithm’s generalizability and precision [61].
LightGBM stands as a refined version of the conventional Gradient Boosting Decision Tree (GBDT) algorithm. This model implements gradient-based one-sided sampling and exclusive feature bundling techniques to eliminate lesser gradient data and diminish feature quantity, thereby streamlining computational speed and reducing memory demands. Employing a histogram-based approach, LightGBM aims to aggregate data into bins, significantly lowering the algorithm’s time complexity [62]. A suitable set of model parameters, such as tree number, leaf number, maximum depth, etc., is needed to reduce overfitting of the model.
RF is an ensemble supervised learning algorithm within the realm of machine learning, known for creating a multitude of independent classification and regression tree (CART) units. These units are randomly amalgamated to assemble a “forest”. In the presence of new data, each tree within the ensemble casts a decision on the data’s classification or regression outcome. The advantages of RF include randomly selecting samples and reducing the risk of overfitting, but the disadvantages are complex construction and high computational complexity [63]. Take the mean of each decision tree and regress the predicted result with t:
h ( x ) = 1 T t = 1 T h x , θ t
where x is the independent variable; θ t is a random variable; T is the number of decision trees; h x , θ t is the output based on t x and θ t .

3.4.3. Accuracy Evaluation

To evaluate the performance of the SMC estimation model, this study employed three statistical metrics: the Coefficient of Determination (R2), the Root Mean Squared Error (RMSE), and the Mean Absolute Error (MAE). These metrics collectively offer a comprehensive assessment of the model’s accuracy and predictive reliability.
R 2 = i = 1 n ( y i ^ y ¯ ) 2 i = 1 n ( y i y ¯ ) 2
R M S E = i = 1 n ( y i ^ y i ) 2 m
M A E = 1 n i = 1 m y i ^ y i
where y i ^ is the predicted soil moisture content; y ¯ is the average measured soil moisture content; y i is the measured value of soil moisture content; and m is the number of samples.

4. Results

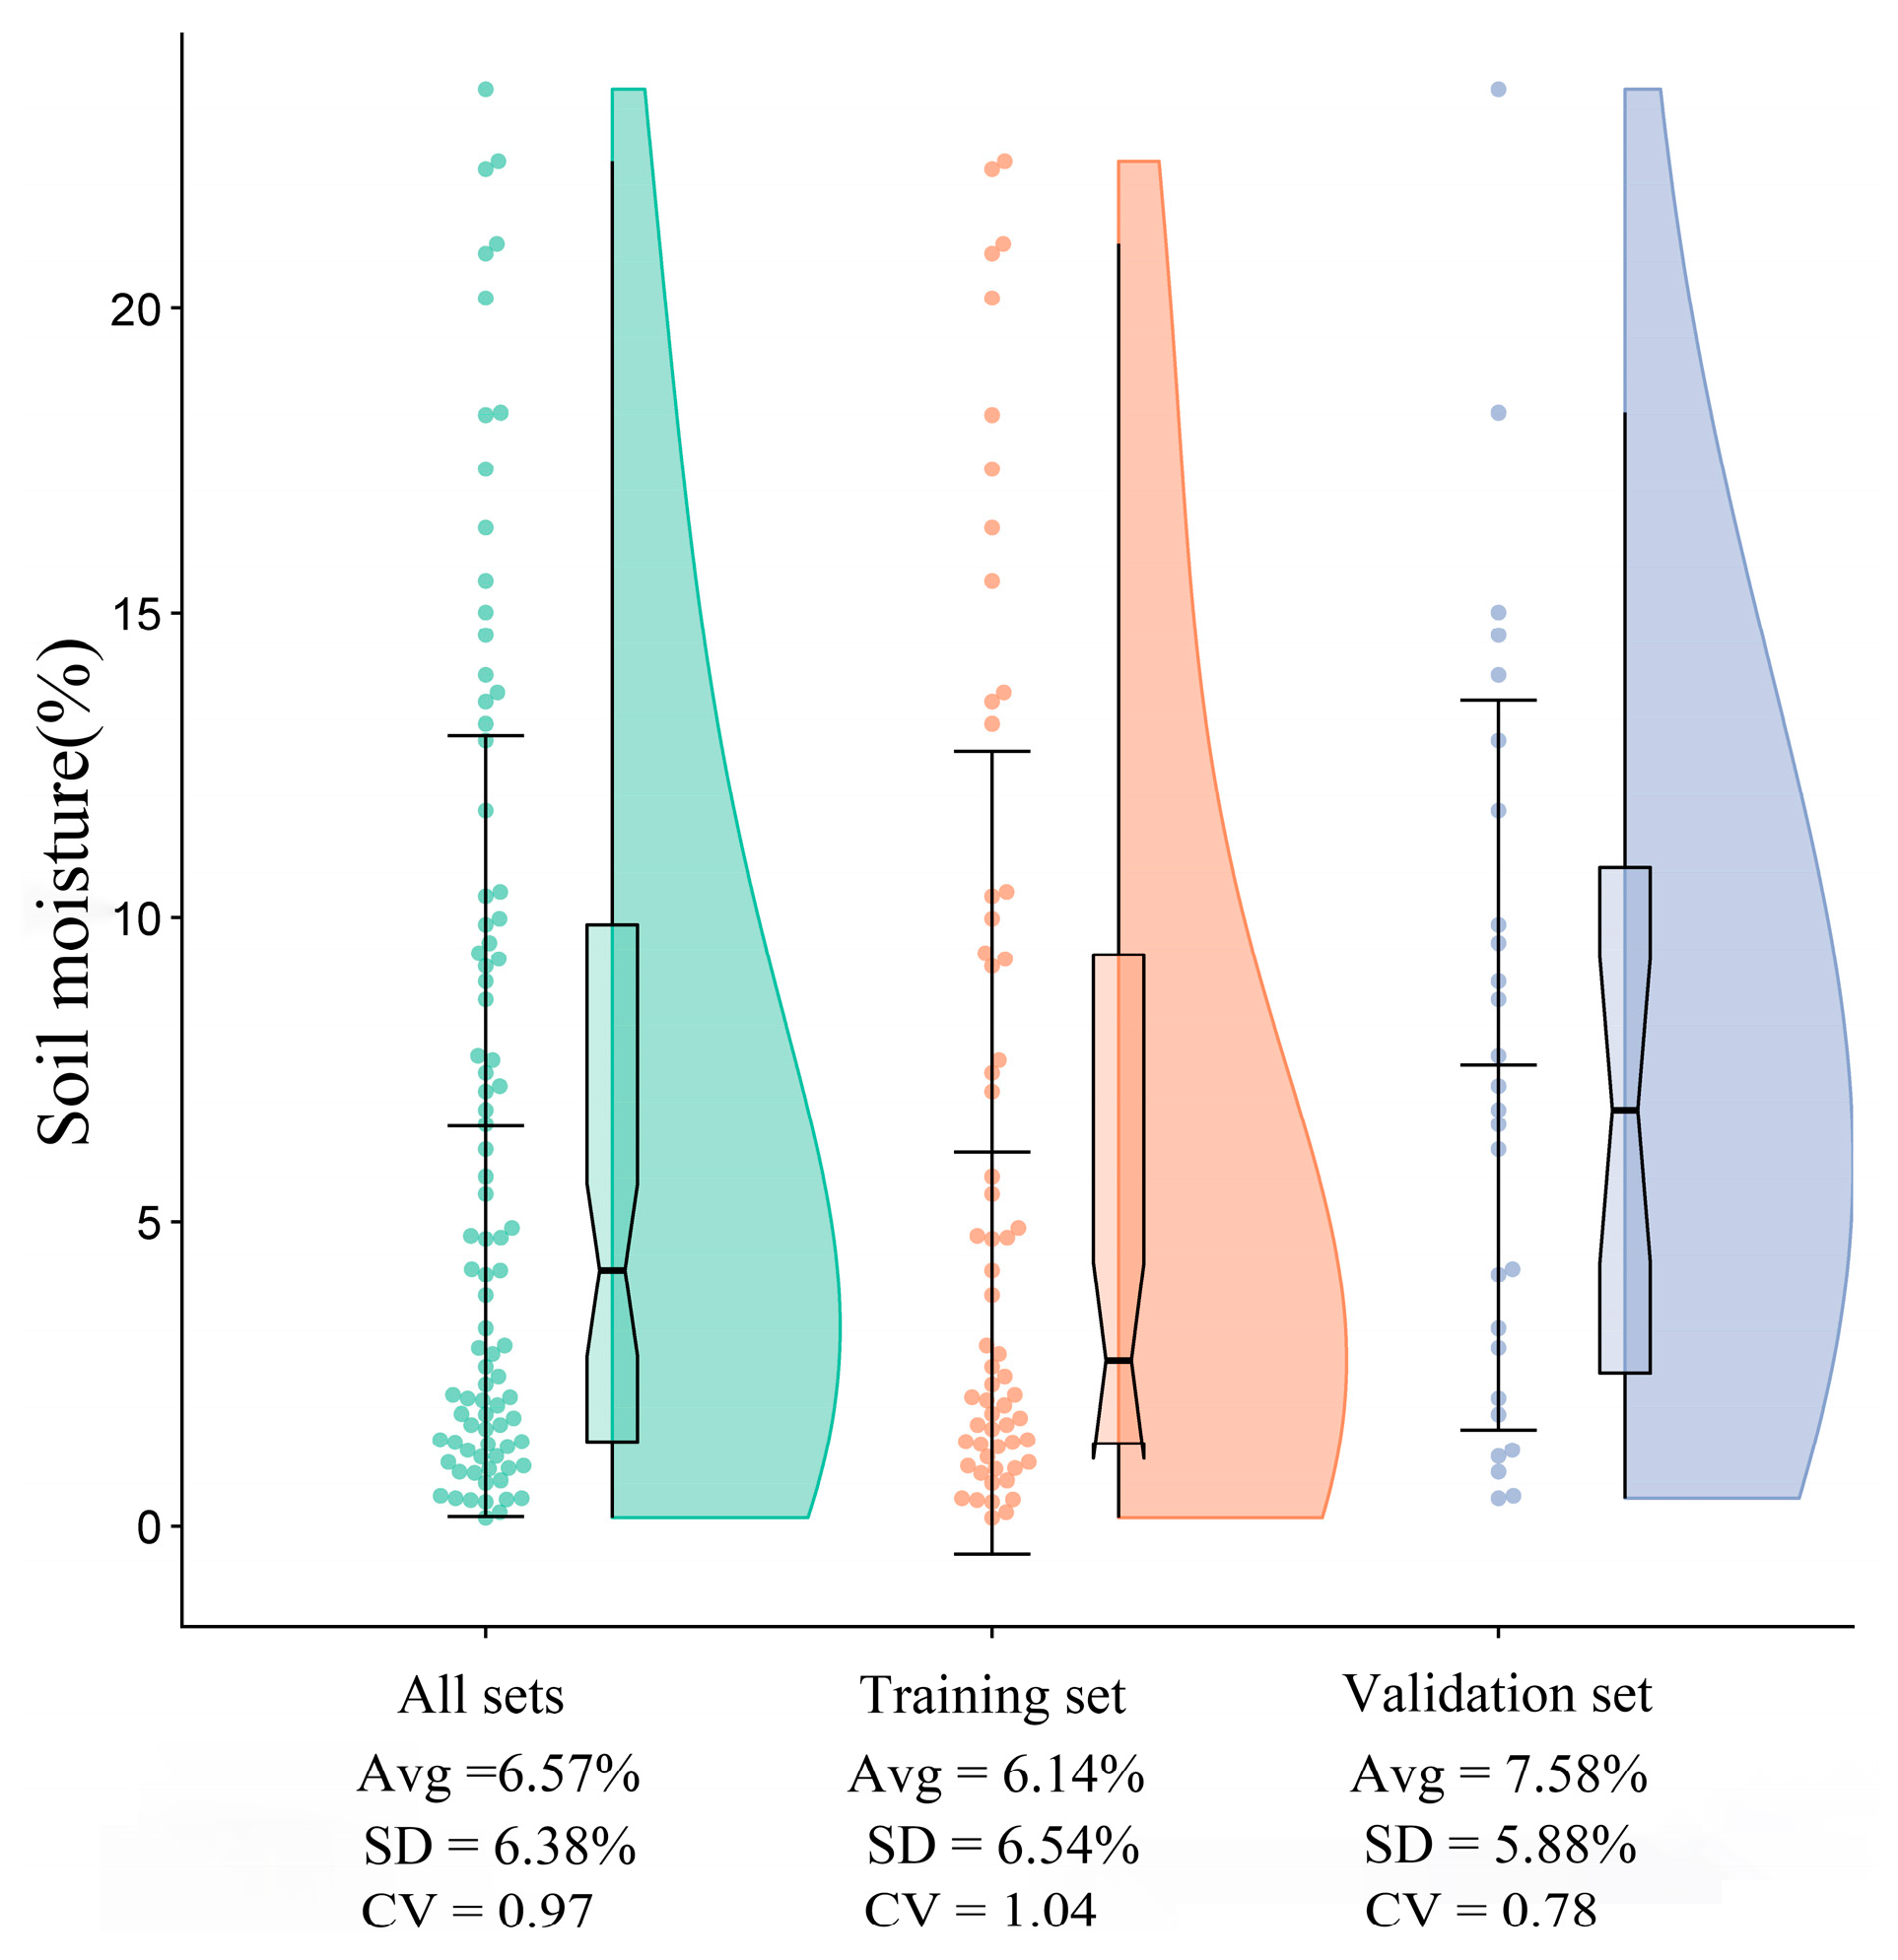
4.1. Statistical Description of Soil Samples

To guarantee the comparability of machine learning algorithms, we randomly divided 89 soil moisture data from June 2022 into two groups: a modeling set (70%, 62 samples) for model training, and a validation set (30%, 27 samples) for model validation. The distribution results of the divided sample data are shown in Figure 3, with a mean soil moisture content of 6.57% and a standard deviation of 6.38% for the entire set. The mean values of the training set (0.14~22.41%) and the validation set (0.46~23.60%) are 6.14% and 7.58%, respectively, indicating that the statistical distribution of soil moisture content in the three datasets has a similar pattern, while ensuring representative samples, the estimation of bias in the modeling, and validation sets are minimized as much as possible.

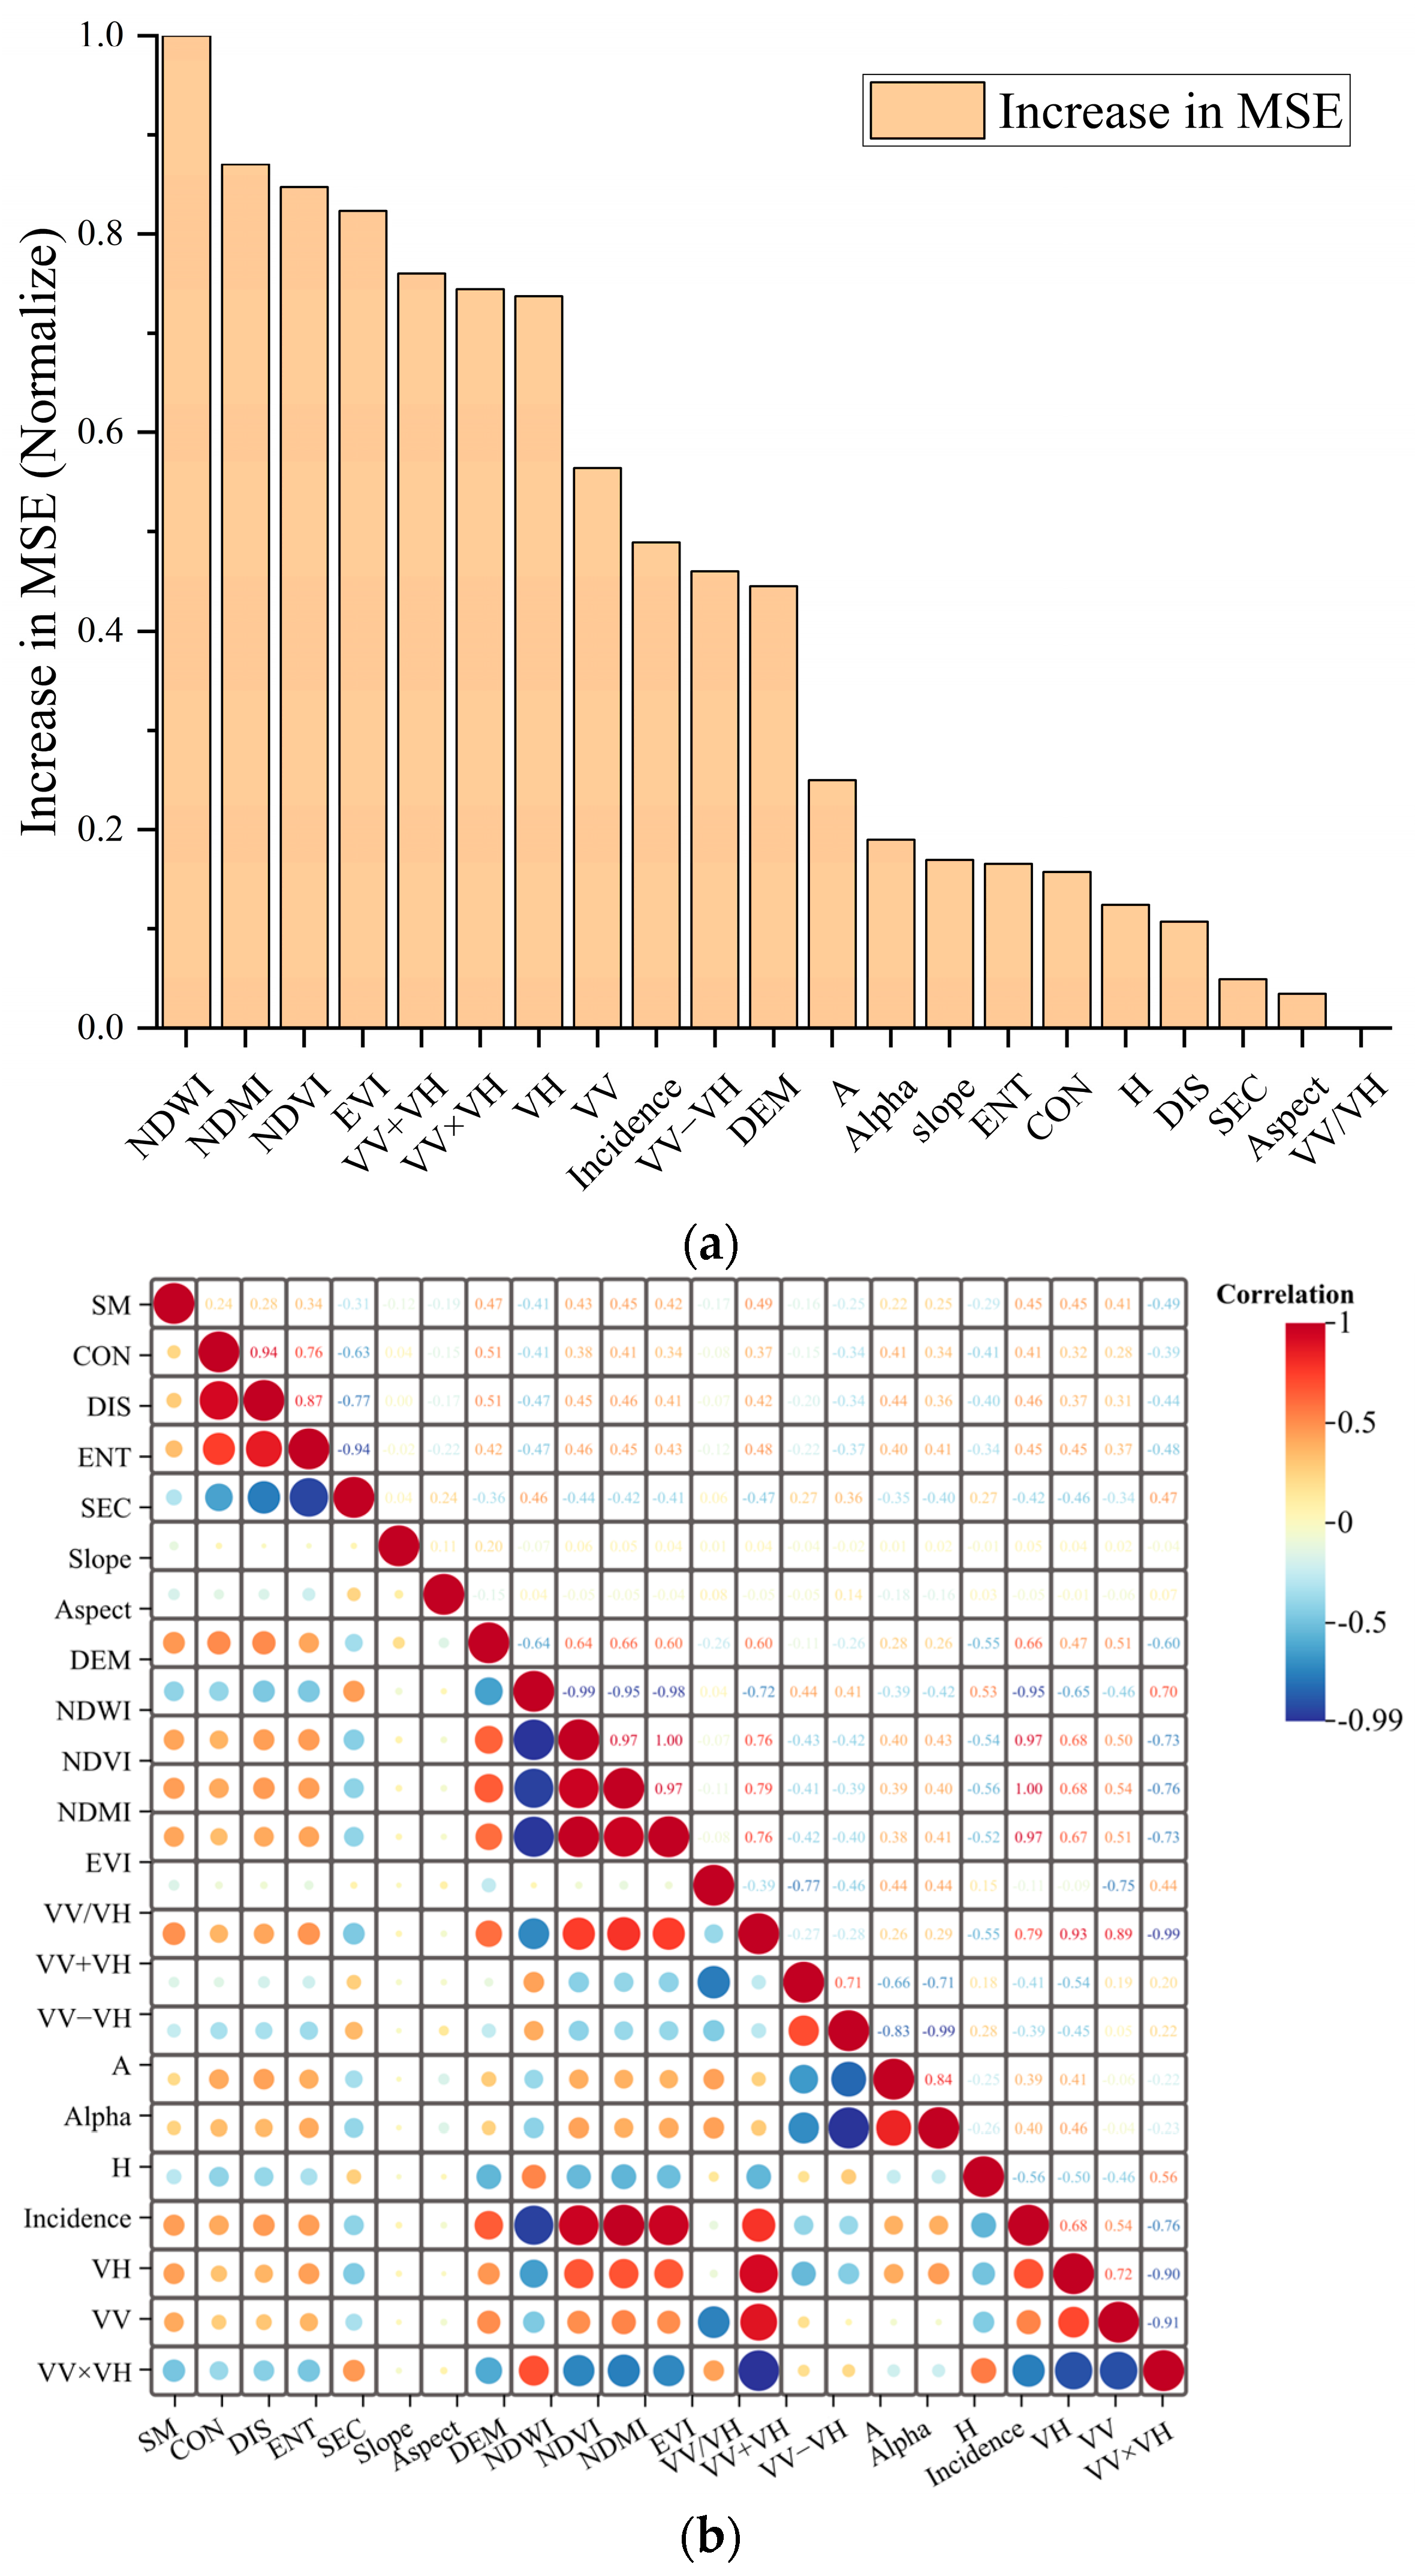
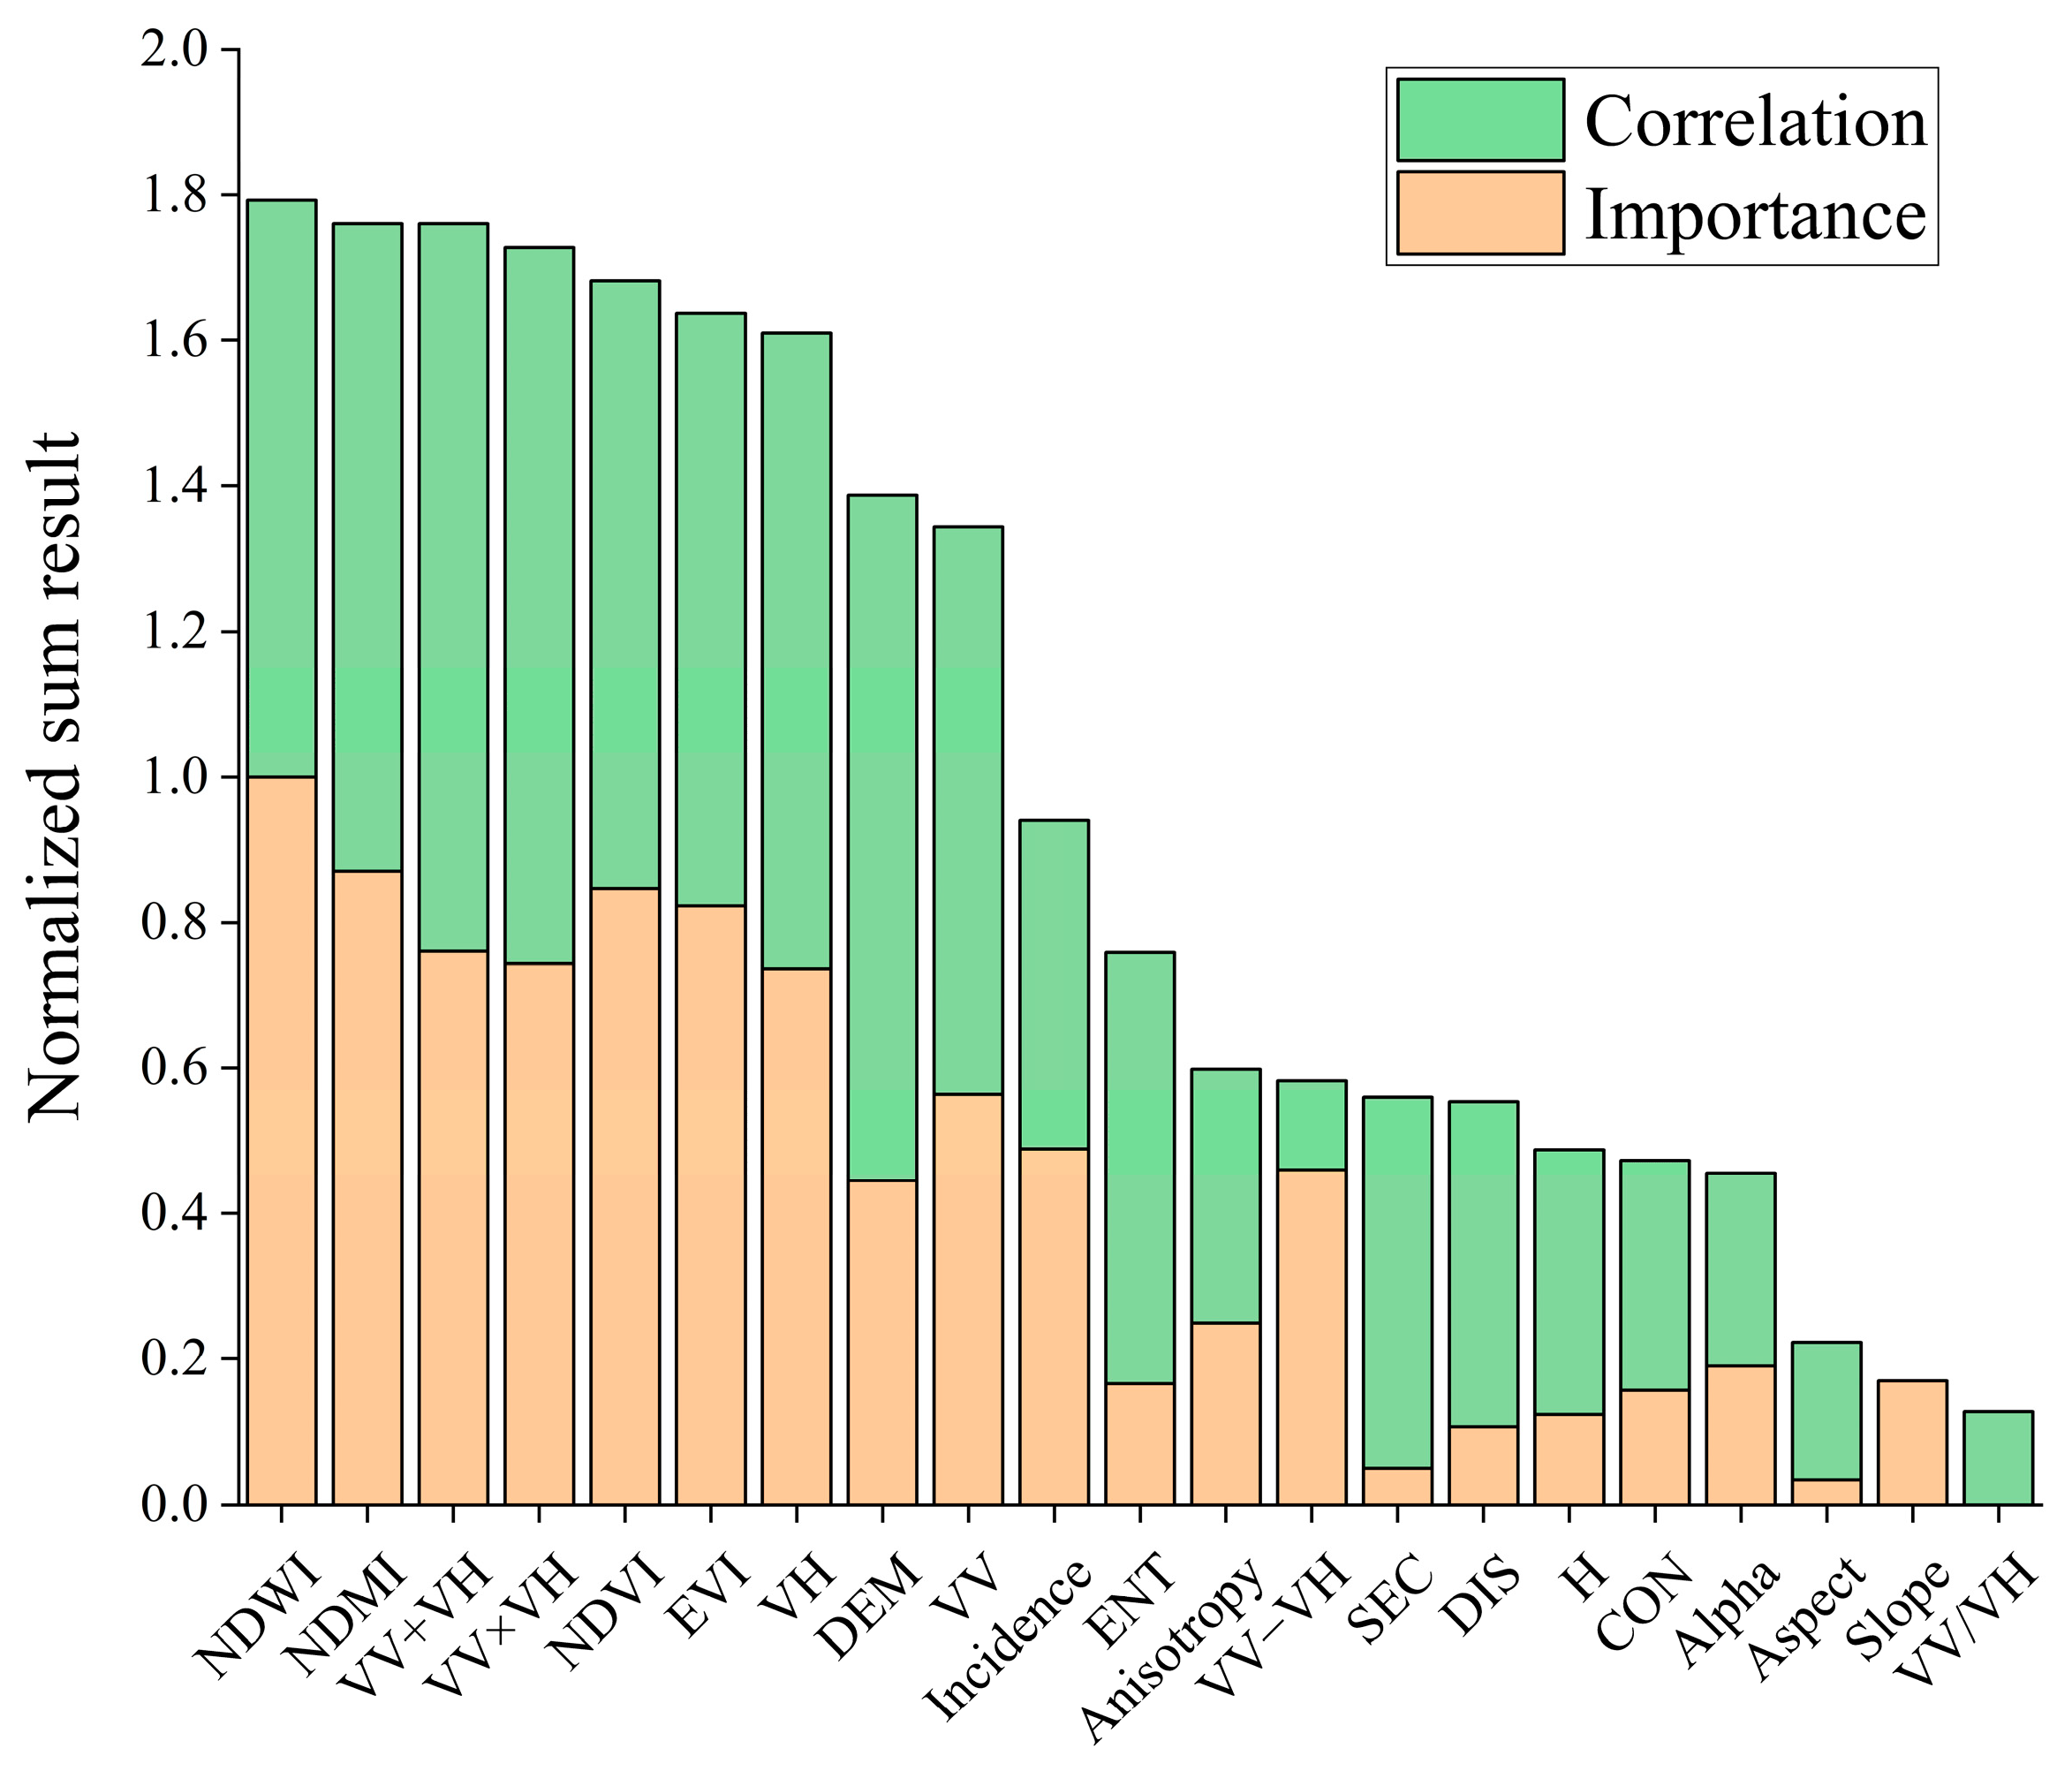
4.2. Characteristic Variable Analysis

Due to the complex nonlinear relationship between multiple characteristic parameters and soil moisture content, and the complementarity between characteristic parameters, selecting a reasonable number of characteristic parameters with strong complementarity can effectively improve the estimation accuracy and model efficiency of soil moisture inversion models, and construct the optimal feature subset. Based on the RStudio platform, the RF algorithm is used to score the importance of feature parameters, and the scoring results are shown in Figure 4a. In addition, the correlation between characteristic parameters and soil moisture was quantitatively analyzed through the Pearson correlation coefficient, and the correlation analysis results are shown in Figure 4b. The correlation between features can be clearly distinguished in the figure, and the larger the radius of the circle in the horizontal and vertical intersecting areas, the darker the color, indicating a stronger correlation between features.
Normalize the sum of importance and correlation as the main basis for considering the order of input variables into the model, and conduct a comprehensive analysis of each feature parameter. The result is shown in Figure 5. The comprehensive ranking of feature parameters from high to low is NDWI, NDMI, VV+VH, VV*VH, NDVI, EVI, VH, DEM, VV, Incidence, ENT, Anisotropy, VH-VV, SEC, DIS, H, CON, Alpha, Aspect, Slope, and VV/VH.

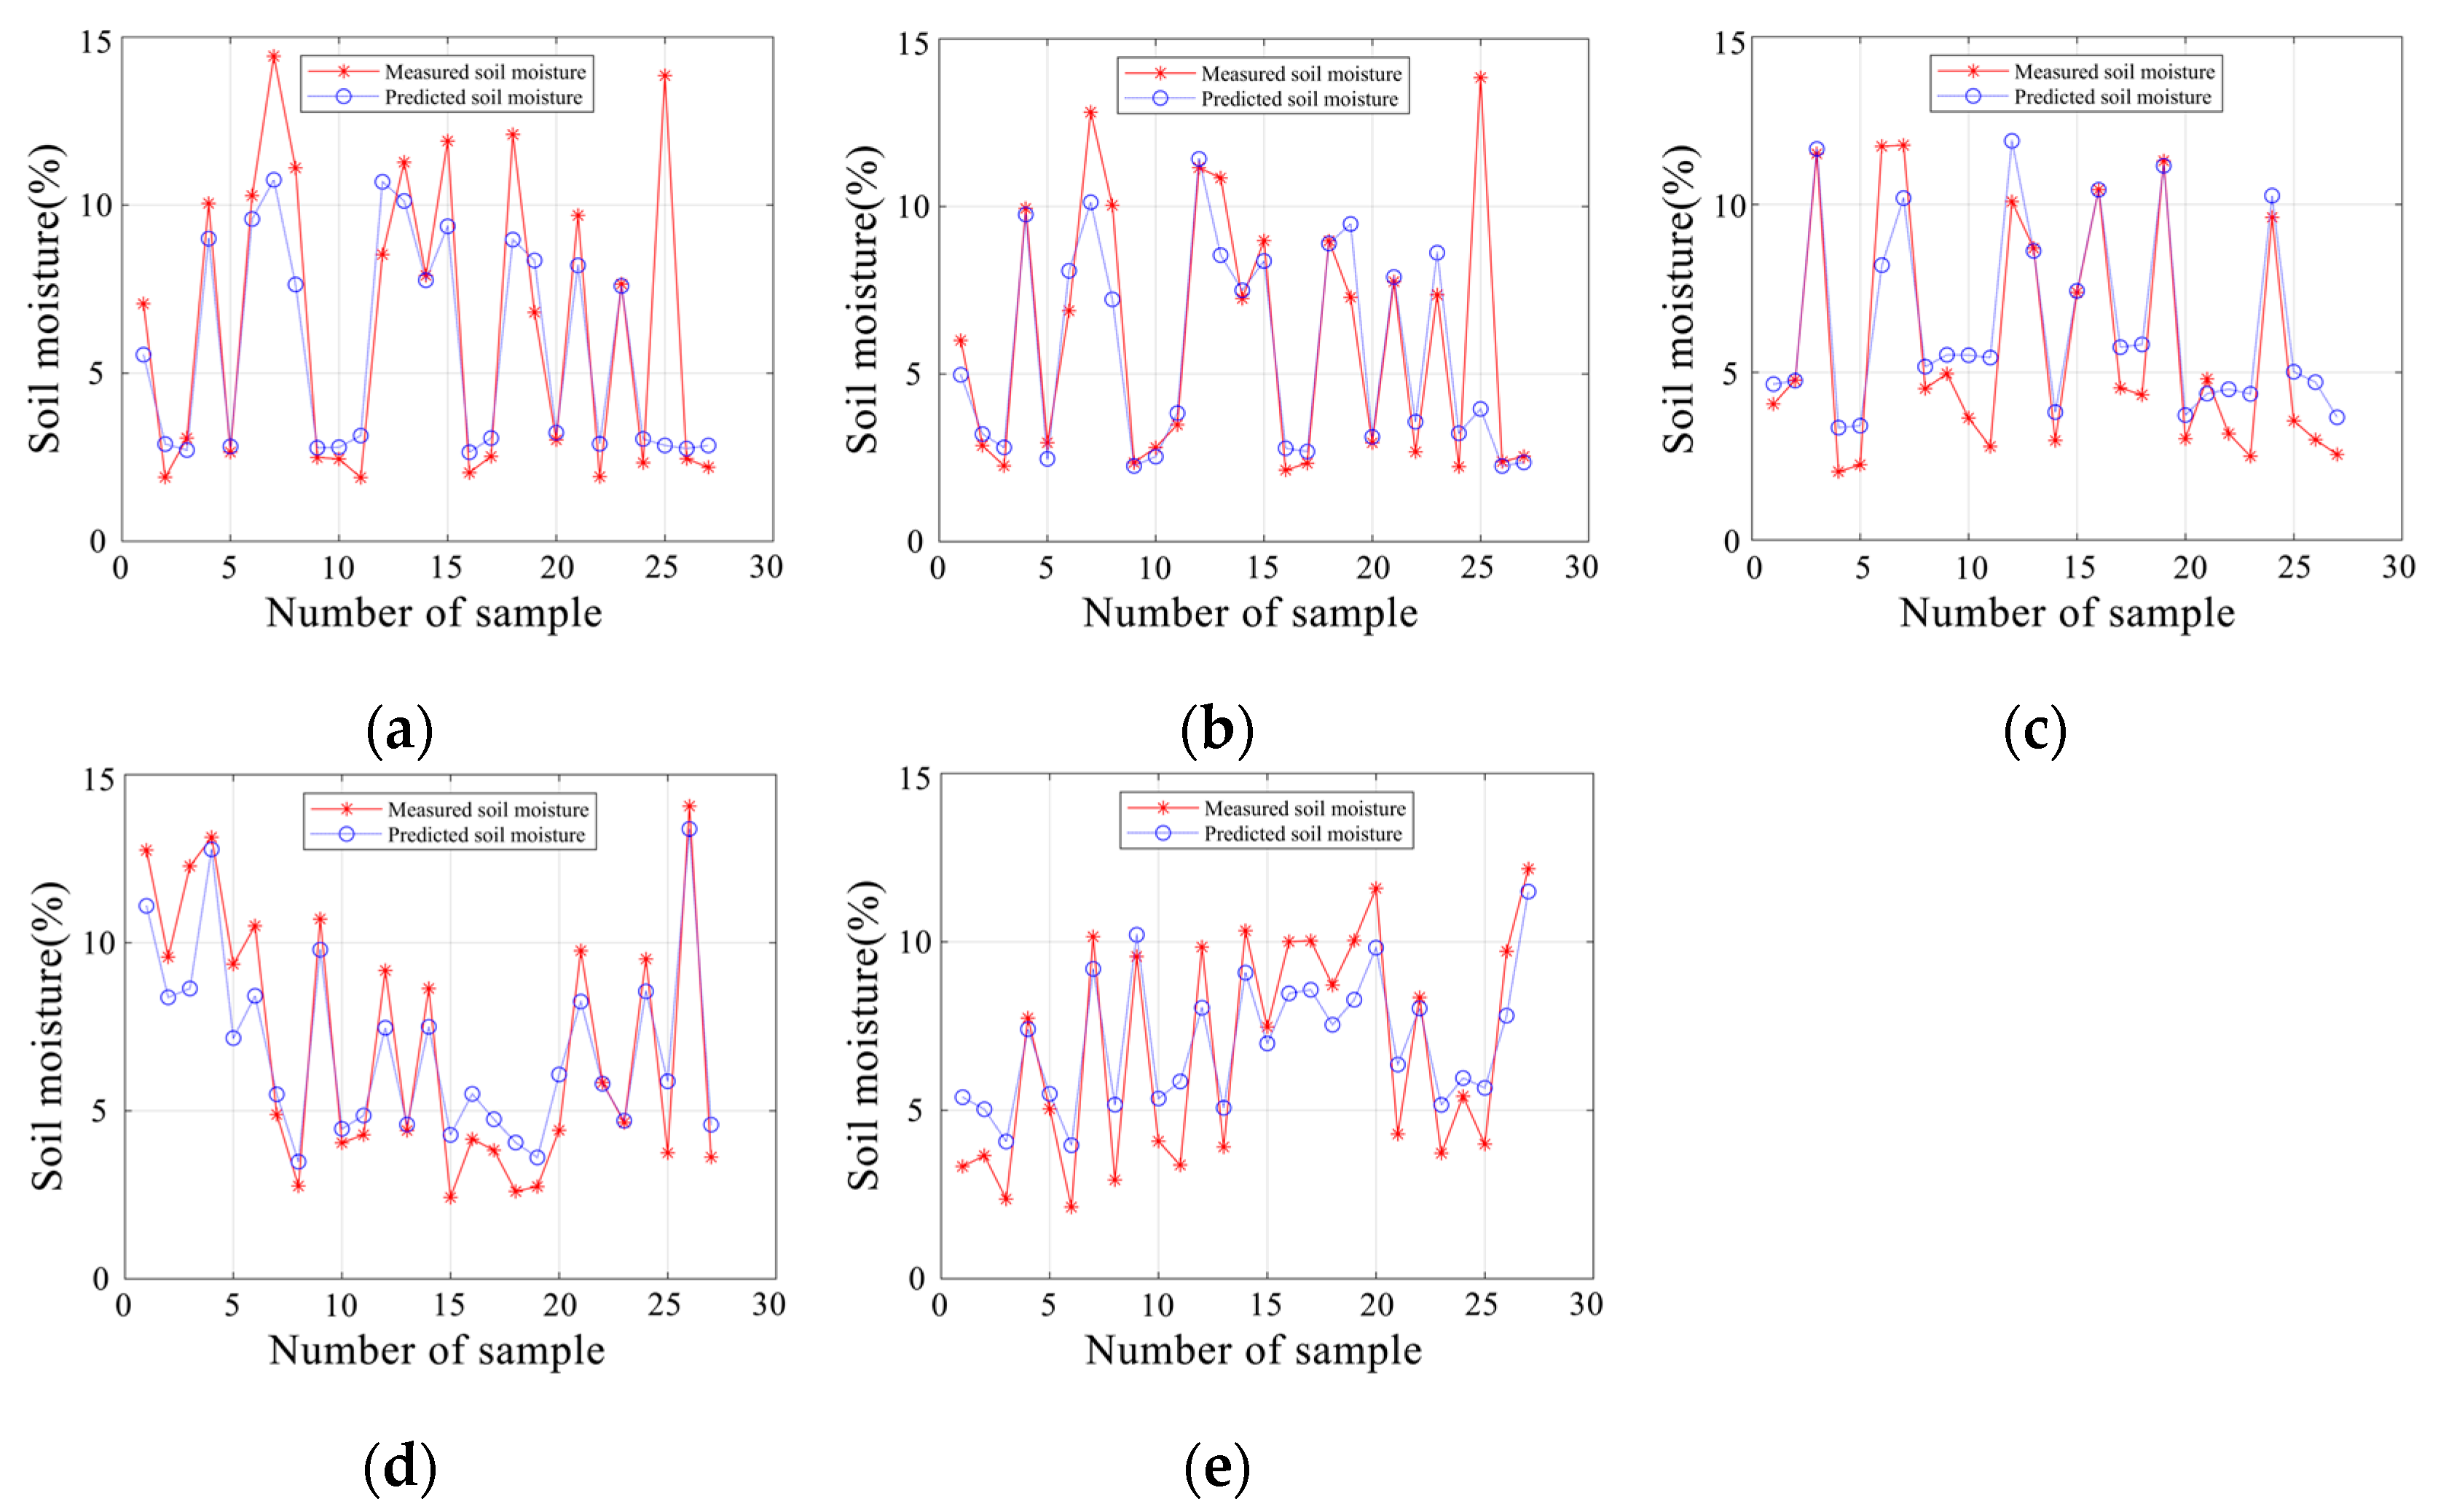
4.3. Comparison and Evaluation of Multiple Models

To verify the effectiveness of normalized addition of importance and correlation, three machine learning models were compared in detail in the study area based on different combinations of feature variables. The feature parameters were sequentially divided into the top 4, top 8, top 12, top 16, and all 21 feature parameter combinations. Five feature parameter combinations were constructed, and the models were trained using grid search and ten-fold, cross-validation to find the optimal parameters for each model. Comparative experiments were conducted using on-site measured SSM data to explore the application performance of multiple data sources, input parameter combinations, and machine learning models in SSM inversion, as shown in Table 3.
Typically, with an increase in the number of feature parameters, all machine learning models exhibit a gradual improvement in R2 values and a reduction in RMSE (Table 3). This trend indicates that all methods are adept at effectively integrating information from multimodal data sources. However, the CatBoost model demonstrates relatively higher accuracy when utilizing the first 16 parameters and can elucidate the contribution of all parameters to the model effectively. It adeptly captures the nonlinear relationship with soil moisture, showcasing superior inversion performance compared to other models. The inversion results of the CatBoost model also more accurately reflect the actual distribution scenario. Across all parameter combinations, the estimation results from the CatBoost model slightly outperform those of the RF and LightGBM models, rendering it more suitable for SMC prediction. In the training set, R2 values ranged from 0.752 to 0.848, and for the validation set, from 0.592 to 0.827. Notably, employing a combination of the top 16 feature parameters yielded the best SMC prediction performance, with CatBoost achieving a training set R2 of 0.848, validation set R2 of 0.827, RMSE of 1.529%, and MAE of 1.319%. Figure 6 presents scatter plot results for the CatBoost model’s top 4, top 8, top 12, top 16, and all 21 features, totaling five feature inversion sets. Figure 7 illustrates the distribution curves of soil moisture for measured and inverted values from 27 validation points using multi-source remote sensing data across the aforementioned five feature combinations. The horizontal axis denotes the number of samples, while the vertical axis represents predicted soil moisture values. The results exhibit a strong correlation between the inverted and measured data. However, it is noted that soil sample moisture content above 10% tends to be underestimated, whereas moisture content below 5% tends to be overestimated.
Concurrently, the study juxtaposed the Stacking1 and Stacking2 models of ensemble learning with the optimal single model. Figure 8 delineates the inversion scatter plot outcomes for the Stacking1 and Stacking2 models, employing the top 16 parameters, while Figure 9 illustrates the line graph correlating the predicted to the measured soil moisture content results from both models. Notably, the R2 values for the Stacking1 and Stacking2 models witnessed an increment of 0.008 and 0.016, respectively. Figure 10 offers a performance comparison between the CatBoost model and the Stacking ensemble models. In contrast to the regression tree model, the Stacking multimodel fusion approach exhibits enhanced accuracy and superior performance. Moreover, it was observed that the Stacking models tend to overestimate at lower SMC levels and underestimate at higher SMC levels.

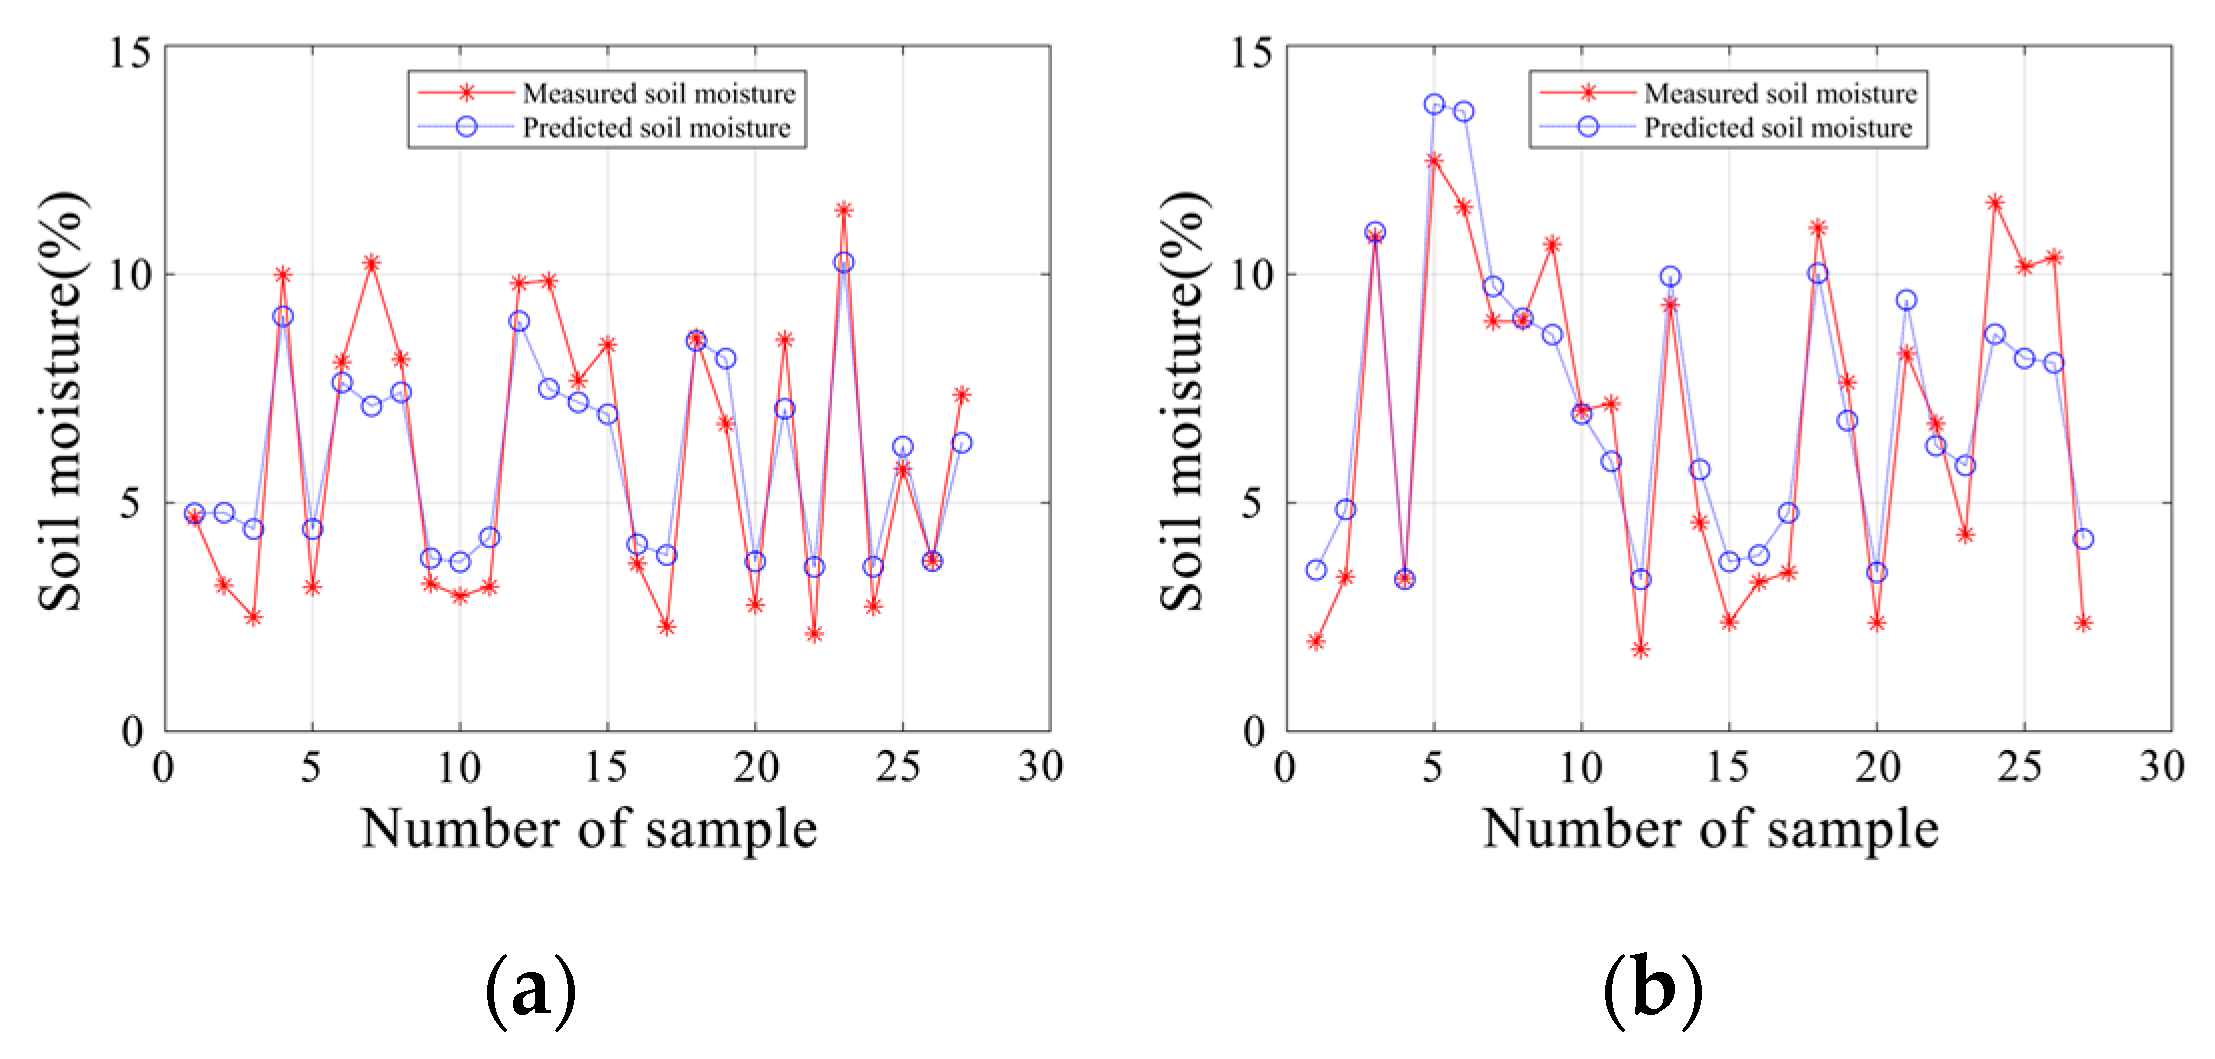
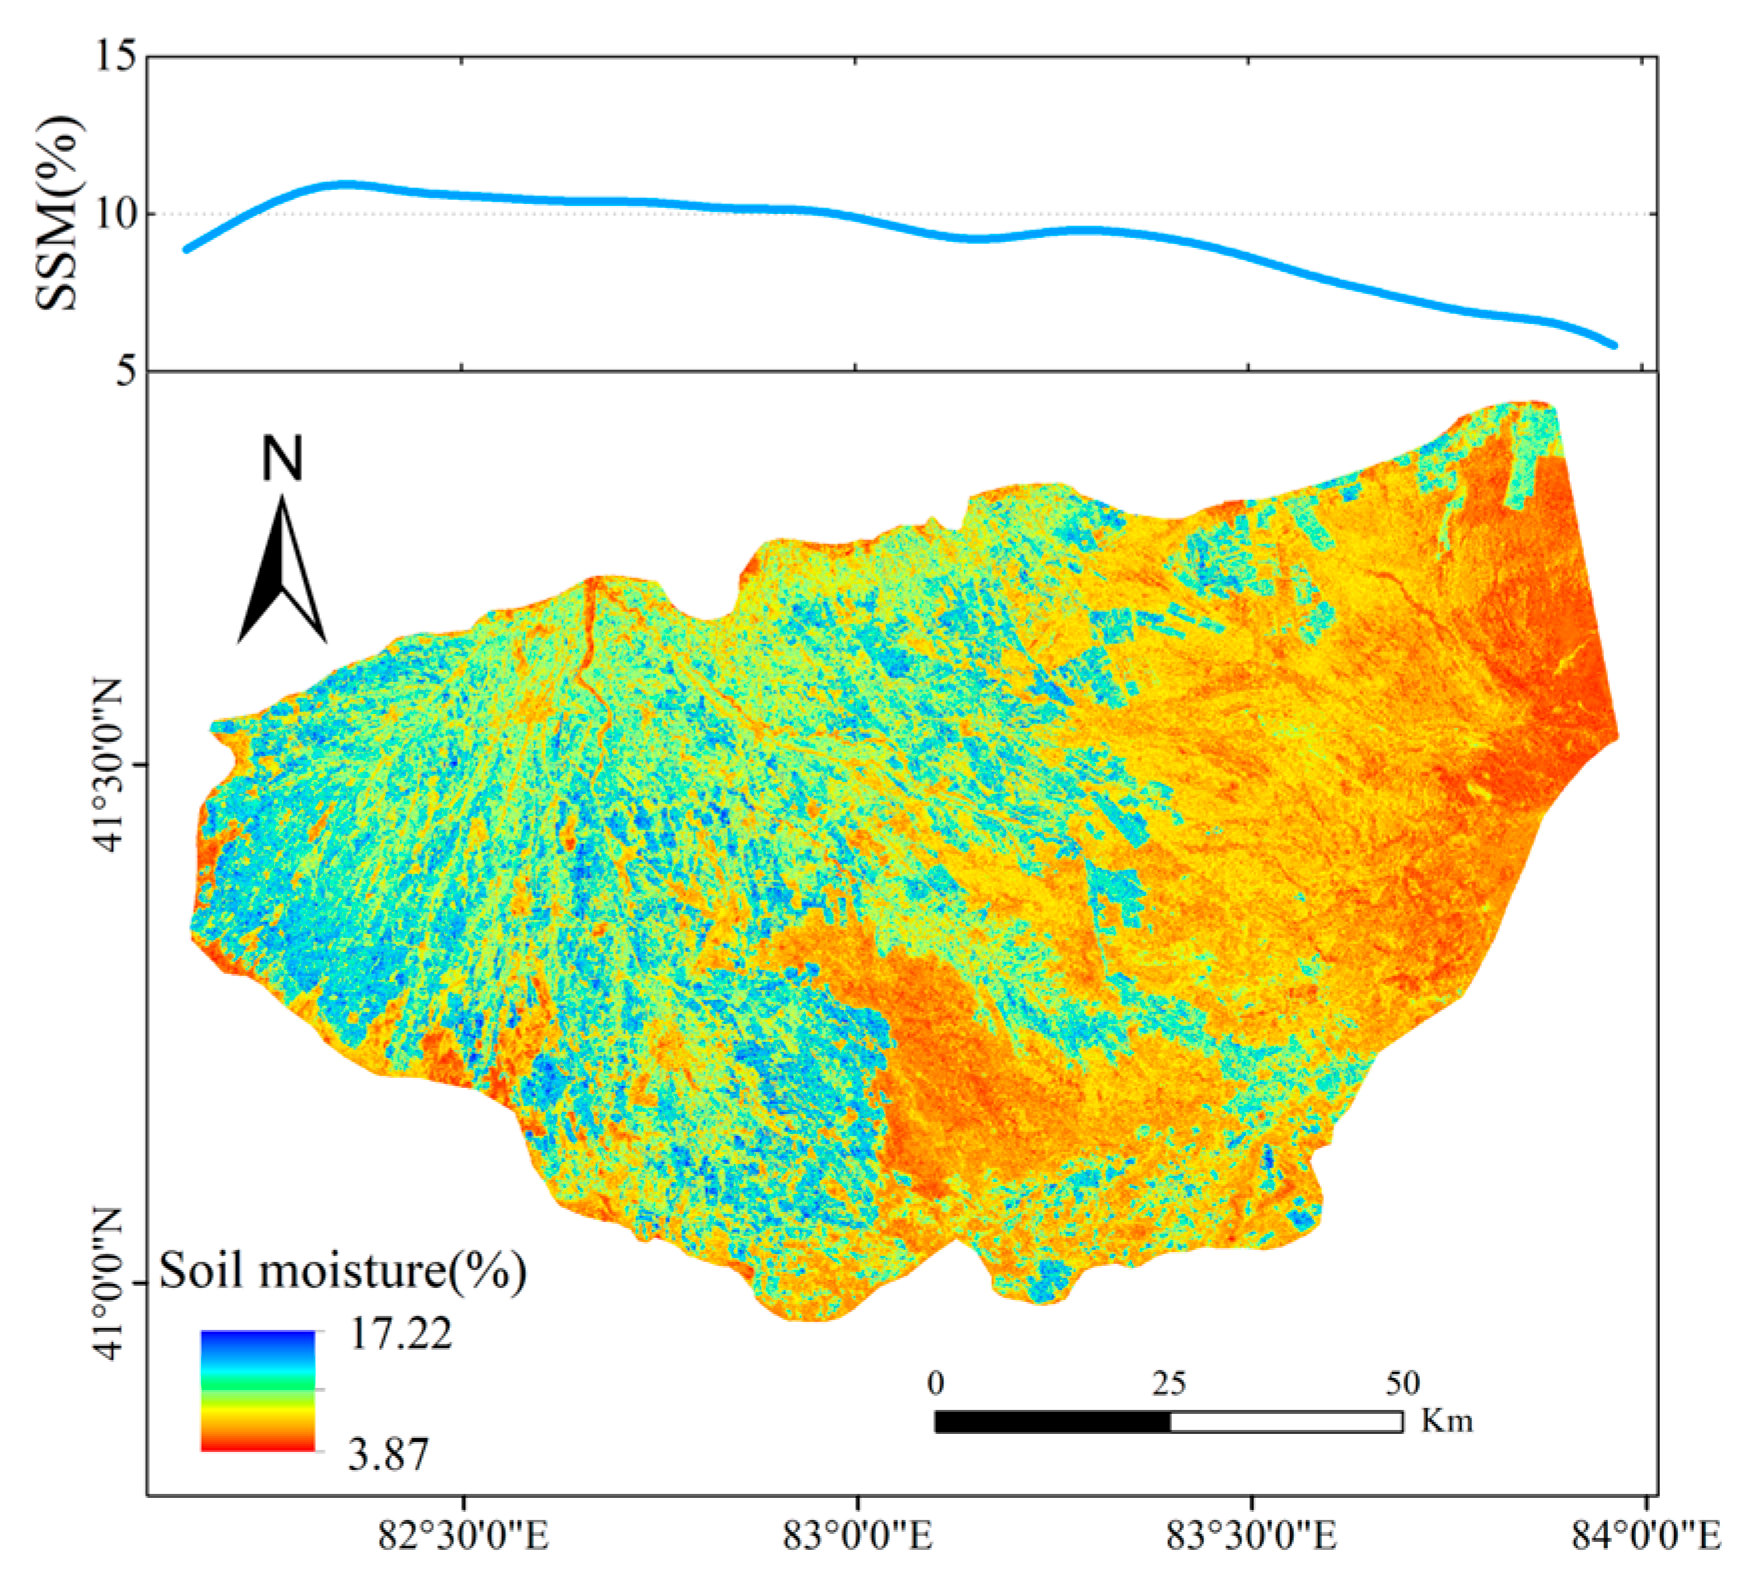
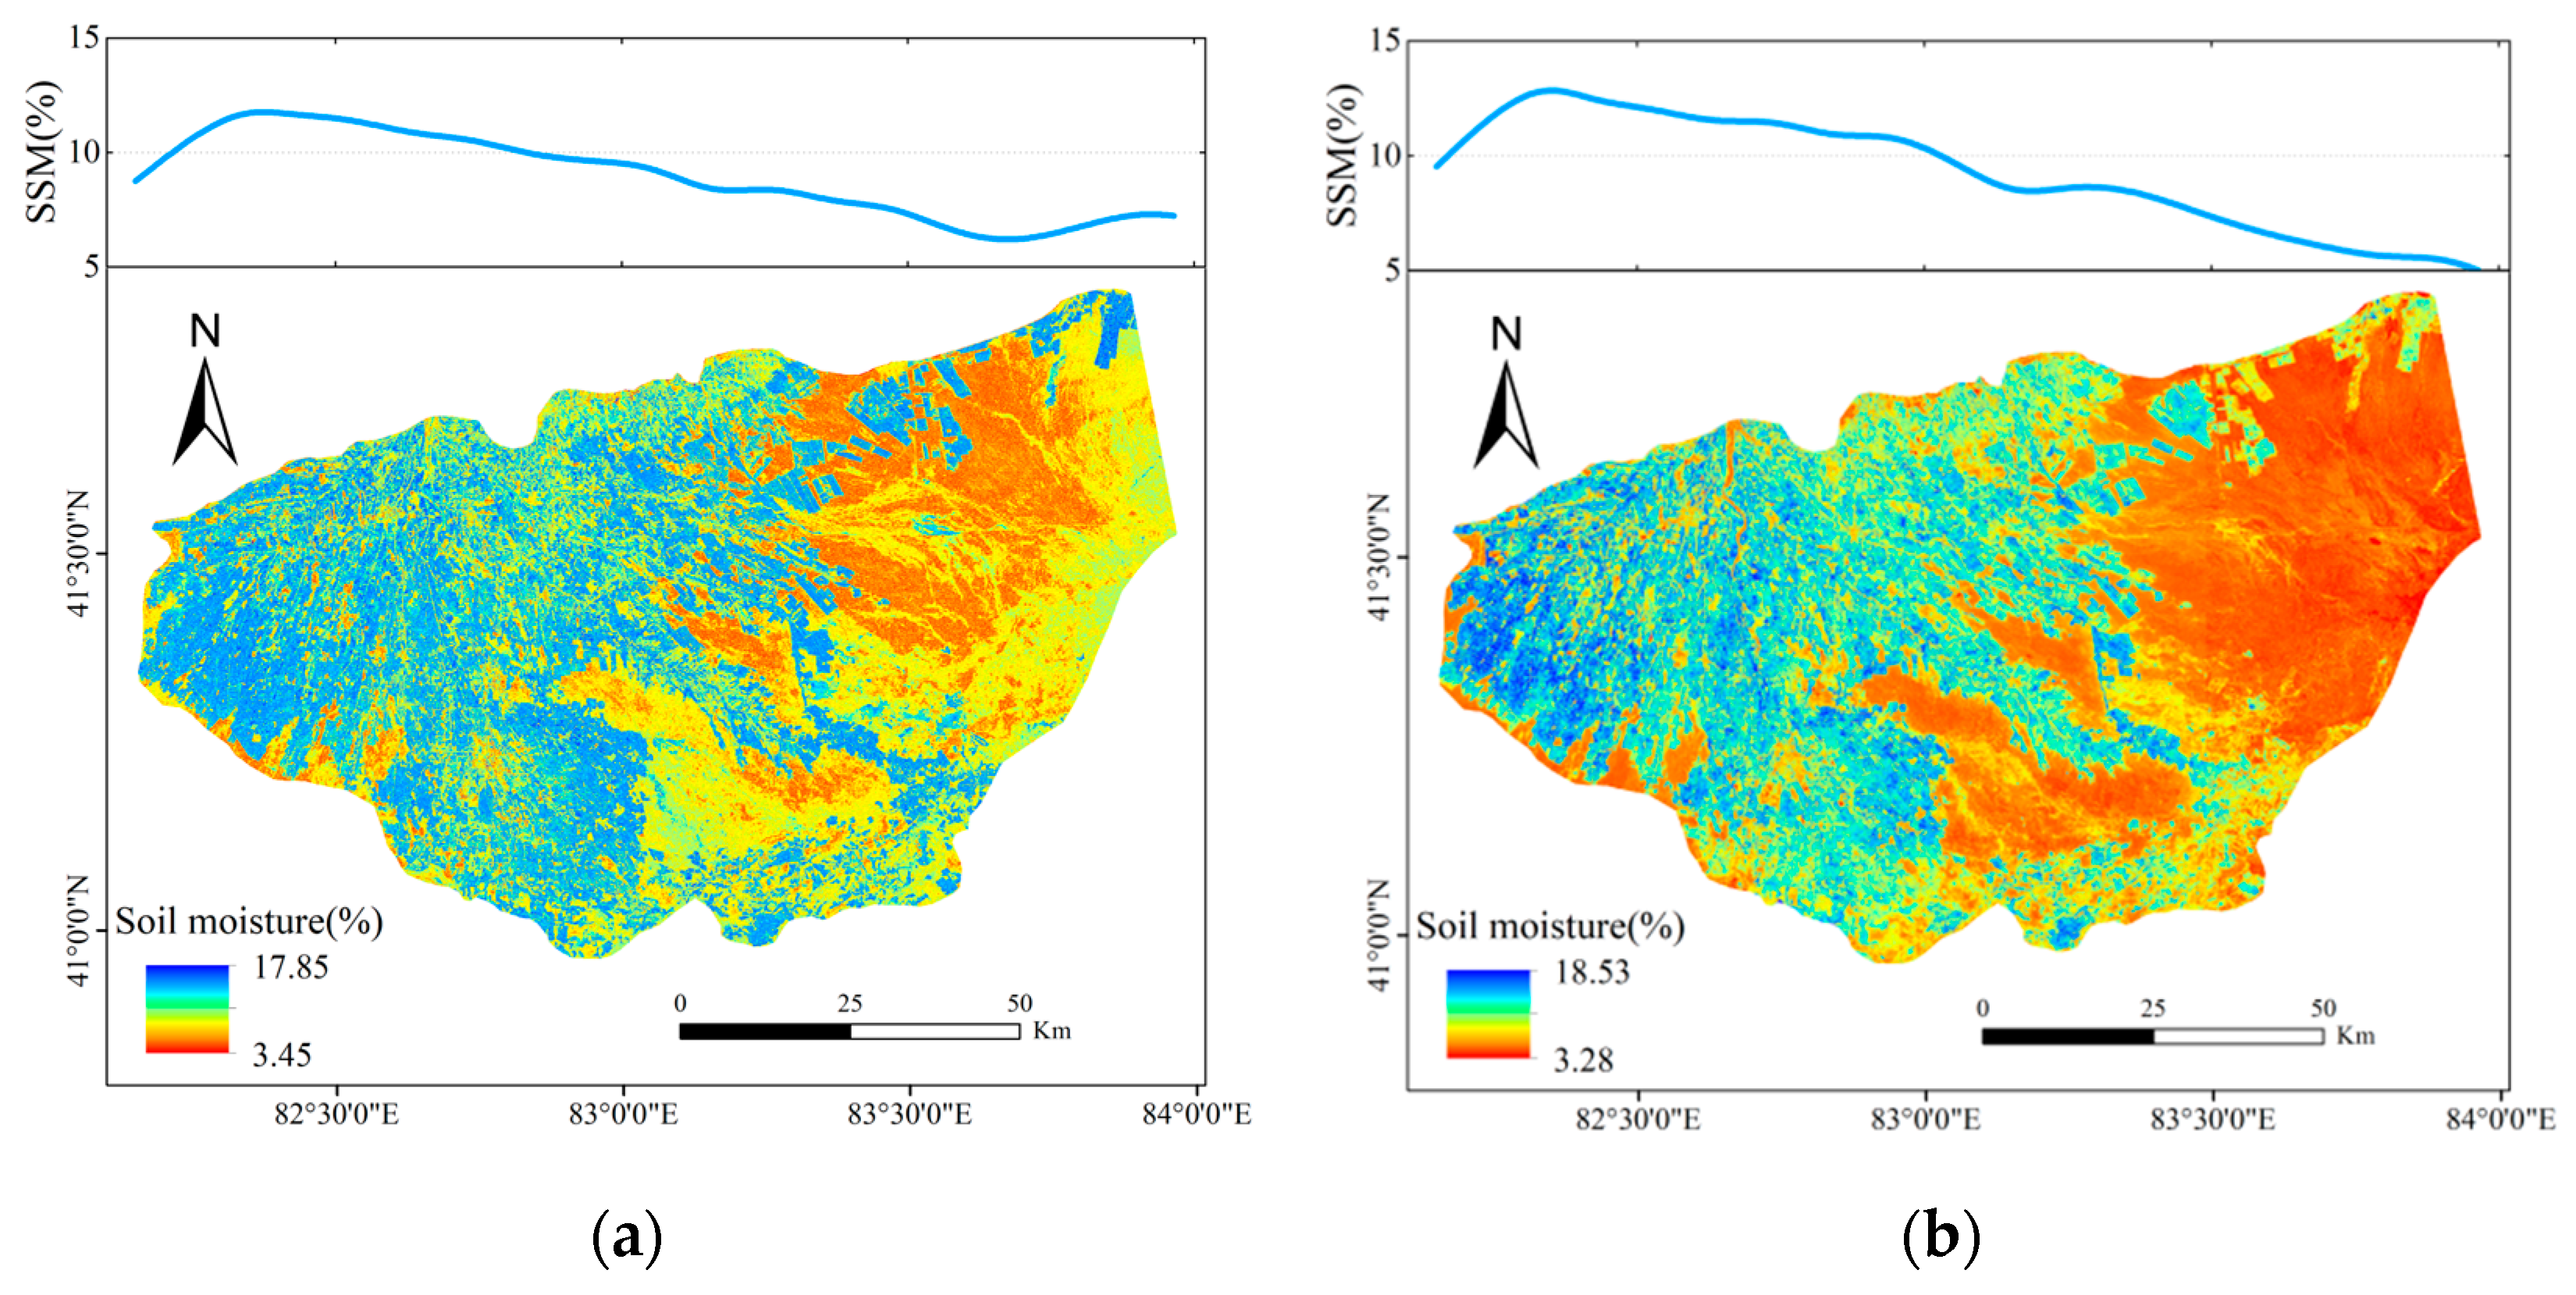
4.4. Inversion Results

The research results indicate that the model using the CatBoost machine learning algorithm and selecting the first 16 parameters as input variables performs the best in fitting performance. Based on this model, the soil moisture content in the study area was inverted, and the results are shown in Figure 11. The predicted values of soil moisture content in the study area ranged from 3.87% to 17.22%, with the western segment of the area displaying higher moisture levels. This distribution is attributed to the western part being an oasis zone, characterized by substantial vegetation coverage and a pronounced capacity for water retention. Such a pattern aligns with the moisture content data derived from measured samples, corroborating the high fidelity of the inversion results.
Figure 12 shows the SMC spatial distribution of the Stacking1 model and Stacking2 model, which are consistent with the inversion results of the optimal single model, and the results are consistent with reality, which can comprehensively reflect the overall pattern of regional SMC spatial distribution.
Further analysis shows that there is a significant spatial differentiation in the surface soil moisture of the Weiku Oasis, with higher soil moisture values in areas close to the oasis and lower soil moisture values in areas far away from the oasis. This difference is mainly due to the extremely small natural precipitation in the Weiku Oasis, and the water demand for agricultural production mainly relies on surface canal systems and groundwater pumping irrigation. As a result, the area near the water source is an agricultural production area, with dense irrigation canal systems, resulting in higher soil moisture. The areas far away from oases are mainly natural vegetation or desert Gobi areas, lacking artificial irrigation and maintenance, greatly affected by dry climate, and with low soil moisture.

5. Discussion

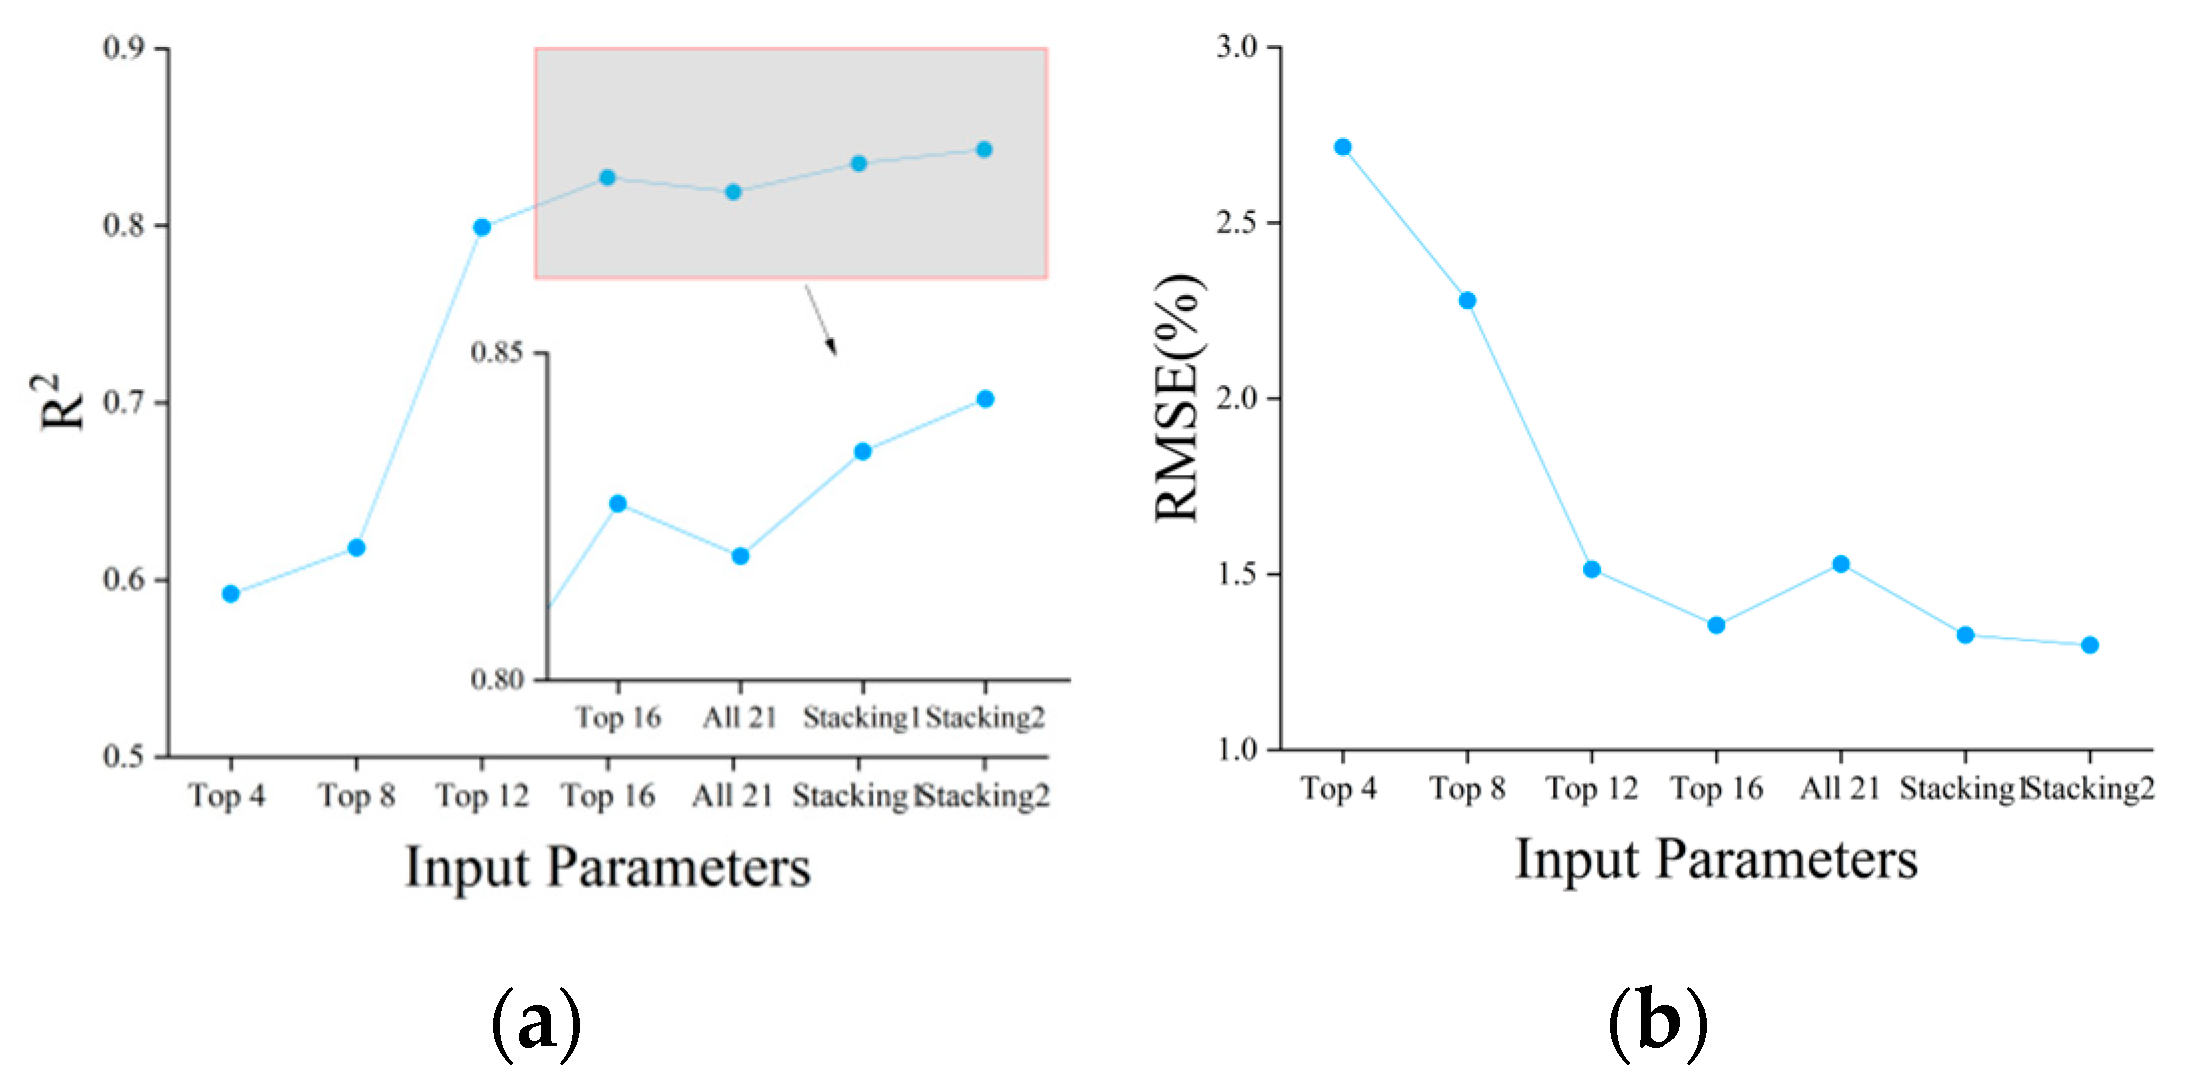
5.1. Determine Model Input Parameters through Feature Selection

This research explored various combinations of feature variables and identified that models incorporating the first 16 feature parameters yielded the most effective fitting results. This set not only showcased the individual contributions of all parameters to the model but also significantly enhanced model performance. Specifically, the introduction of polarization decomposition parameters and texture features derived from Sentinel-2 imagery into the first 16 feature parameter groups, compared to the first 8 feature parameter groups, led to an average increase of 0.173 in the R2 values across three machine learning models. This enhancement underscores the efficacy of including polarization decomposition parameters and texture features in improving the accuracy of soil moisture inversion models. Previous studies have delved into the utility of polarization decomposition and texture features for soil moisture content inversion. For instance, Wang et al. [64] introduced a dual-component (surface and volume) C-band polarization decomposition approach, establishing that the dihedral scattering component at the C-band could be overlooked, thus simplifying the process of deriving soil moisture from surface components. Similarly, Zhang et al. [65] demonstrated that incorporating texture features from RGB and multispectral images as inputs in machine learning models elevates the accuracy of these models’ inversion capabilities. These findings are in harmony with the outcomes of the current study. Moreover, this study undertook a detailed analysis and prioritization of features through the normalization of correlation and importance scores. This methodology not only elucidates the significance of each feature in the model’s construction but also serves as a guide for determining the sequence in which parameters should be entered into the model. By offering a refined approach to feature selection and parameter input, this study contributes to the development of more precise and reliable soil moisture estimation models.

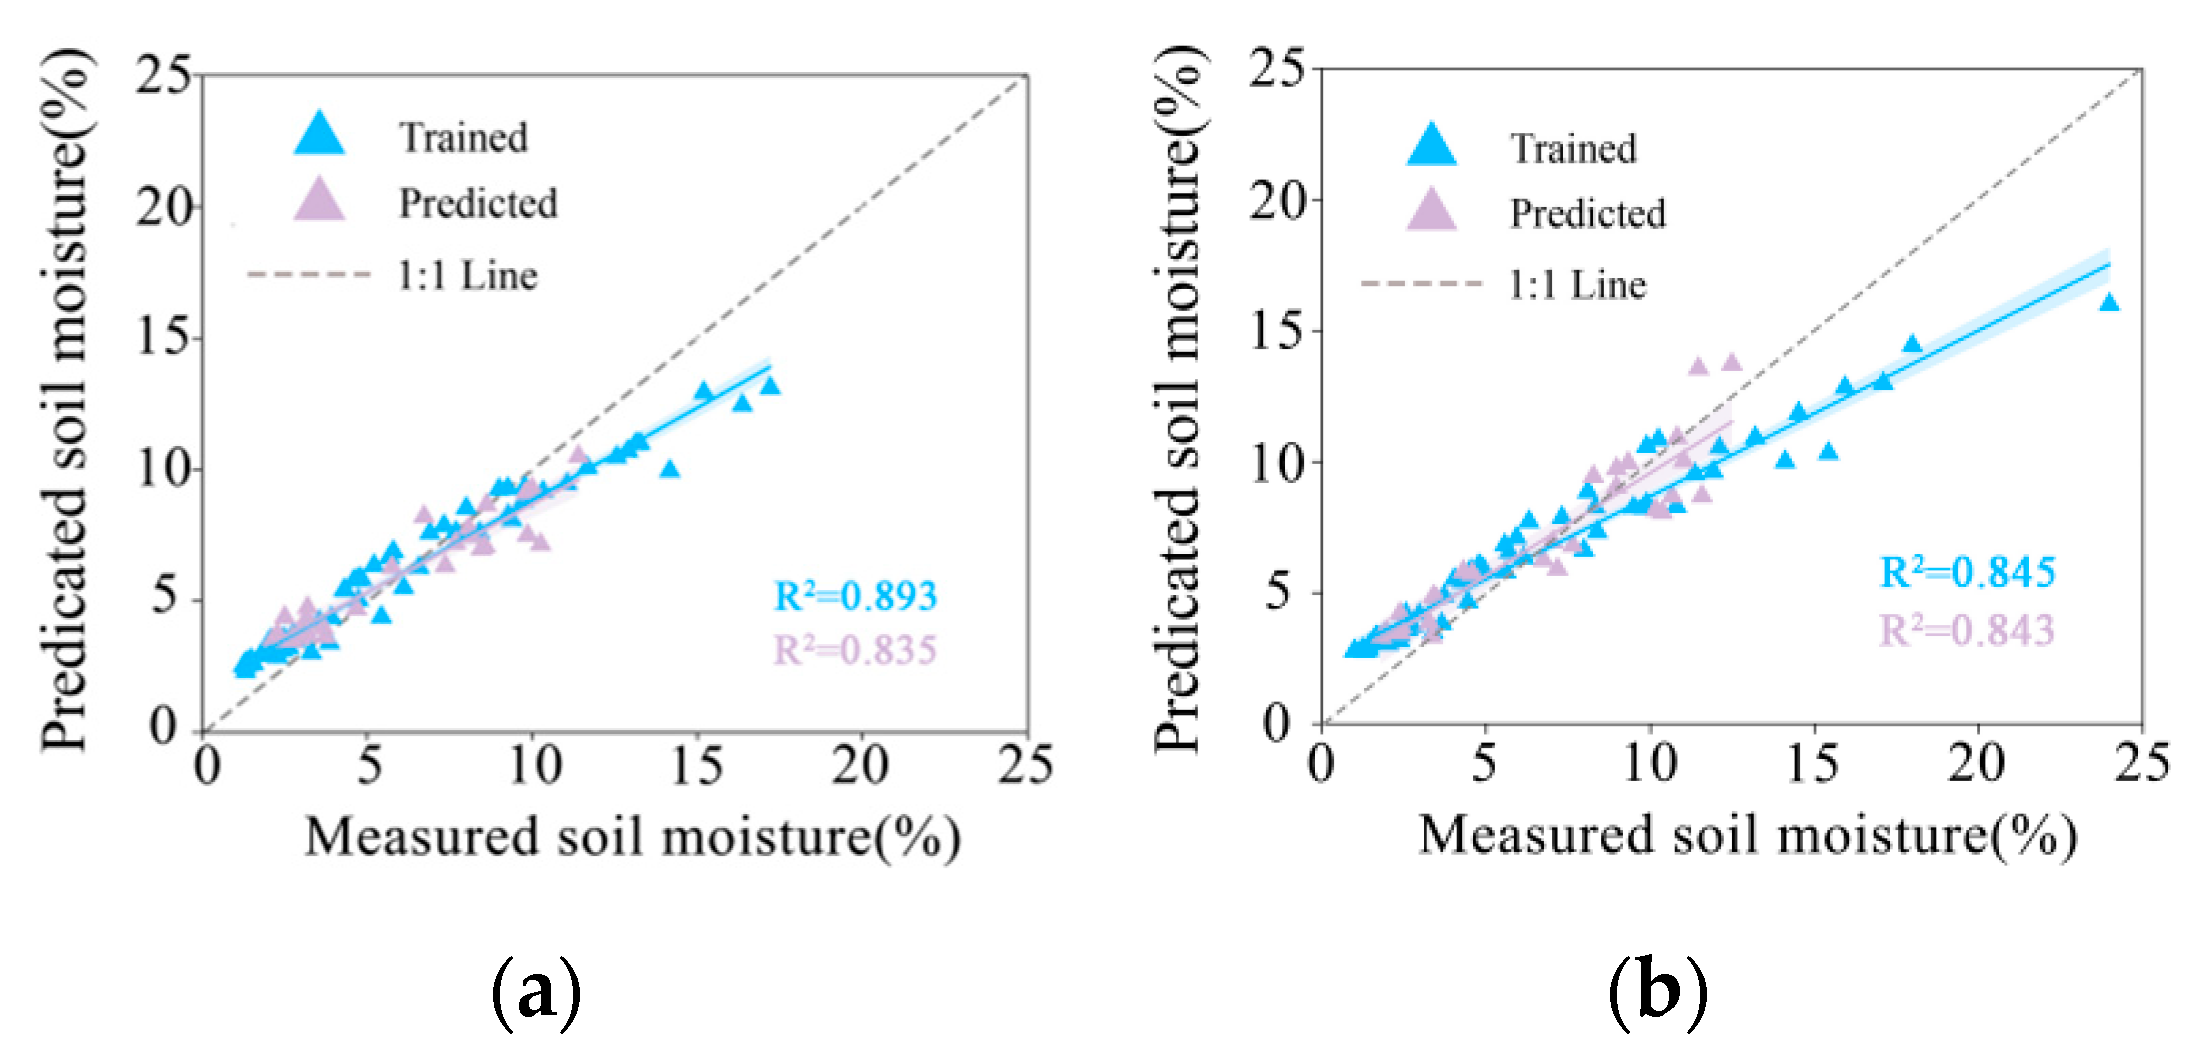
5.2. Estimating Soil Moisture through Ensemble Learning

The precise detection of the spatiotemporal distribution of surface soil moisture is of great significance for understanding the Earth’s water cycle, and it is also a dynamic variable that is influenced by various factors such as vegetation cover, soil type, terrain, etc. At different spatiotemporal scales, significant changes can occur even in smaller areas. Previous studies have shown that multi-source remote sensing data can effectively predict soil moisture (Table 4). In recent years, machine learning methods have been introduced into soil moisture research, becoming an effective technique to improve the spatial resolution of soil moisture. However, no matter what modeling method is used, multi-source data can produce the best accuracy, with a significant accuracy of about 1.5% RMSE. These results are consistent with previous research findings, which also found that texture, polarization decomposition, and band information provide unique and complementary information that is beneficial for SMC prediction [7,47,66]. In this study, we established a prediction model for soil moisture content in arid oases using Sentinel-1/2 data. The CatBoost model showed higher estimation accuracy (Table 3). However, many studies have shown that the integrated model outperforms the single model in many applications [67,68]. This paper constructs Stacking1 (linear) and Stacking2 (nonlinear) integrated learning methods based on the single machine learning model to retrieve soil moisture, which has higher model accuracy, robustness, and overall induction ability. The research area’s western part is an oasis with high vegetation coverage and strong water retention capacity. The results are consistent with the measured content of the samples, indicating a high accuracy of the inversion results. However, the soil moisture content data is underestimated at high values and overestimated at low values, with the main errors mainly considering vegetation and surface roughness. The increase in meteorological conditions and vegetation coverage may reduce the estimation accuracy of SMC [69]. At the same time, differences in irrigation volume and meteorological conditions, especially in oasis farmland where flood irrigation may be adopted, as well as differences in precipitation, may reduce the accuracy of using the CatBoost model for SMC estimation. Therefore, future research can consider incorporating remote sensing data from different seasons and climate regions into model training to enhance the model’s adaptability to environmental changes. Meanwhile, evaluating the applicability of the model in different environments and conditions can be achieved by validating its performance on a new test set, utilizing different testing scenarios such as different soil types or vegetation conditions to reveal the limitations and advantages of the model in practical applications.

5.3. Uncertainty Analysis of Research

Uncertainty analysis is a critical aspect of model evaluation, shedding light on the inherent limitations and contributing significantly towards enhancing model interpretability [70]. A straightforward strategy to boost interpretability involves simplifying the model, for instance, by reducing the quantity of decision trees in a random forest model. Heretofore, a common shortfall in contemporary research is the lack of precise uncertainty quantifications. Kévin Vaysse et al. [71] adeptly applied quantile regression for estimating the uncertainty associated with soil property grids within forested regions. The primary contributors to uncertainty typically encompass data sources, input variables, and the models themselves. This investigation employs a combination of optical and radar data, variable sorting techniques, and ensemble learning models to mitigate uncertainty levels. It further integrates various single models to develop a Stacking model, which yields more consistent outcomes, thereby diminishing uncertainty. Colby Brungard et al. [72] have indicated that regional modeling plays a beneficial role in digital soil mapping by lowering prediction uncertainty and offering deeper insights into the dynamics between accuracy and uncertainty. Nonetheless, owing to the restricted quantity of sampling locations within the study area, a machine learning algorithm adept at training with limited samples was selected to minimize epistemic uncertainty. Moreover, augmenting the soil sample count in future endeavors could furnish more authentic and reliable sample data, thus curtailing computational uncertainty.

6. Conclusions

The employment of a modeling approach that amalgamates optical and radar imagery for the inversion of soil moisture illustrates the viability of utilizing multi-source remote sensing data for assessing the moisture content in oases within arid regions. The principal findings from this study are summarized as follows:
(1)
The analysis indicates a tendency to overestimate soil moisture at lower humidity levels and underestimate it at higher humidity levels.
(2)
Among the machine learning models evaluated, CatBoost outperformed RF and LightGBM, achieving the highest prediction accuracy with an R2 of 0.827 and RMSE of 1.355%. This confirms the superiority of CatBoost for small sample datasets and complex soil moisture estimation tasks.
(3)
The Stacking ensemble models, Stacking1 and Stacking2, demonstrated enhanced predictive capabilities compared to individual models, with increases in R2 by 0.008 and 0.016, respectively. This underscores the potential of ensemble learning to improve soil moisture inversion accuracy and generalization.

Author Contributions

J.L.: Conceptualization, methodology, validation, formal analysis, visualization, writing—original draft, and writing—review and editing. Z.H.: Methodology, validation, investigation, writing—review and editing, and funding acquisition. J.D.: Conceptualization, supervision, resources, and funding acquisition. Y.Z. (Yukun Zhang): Software. Z.M.: Software. Y.Z. (Yu Zheng): Investigation. A.A.: Investigation. H.C.: Resources. X.L.: Supervision. All authors have read and agreed to the published version of the manuscript.

Funding

This research was funded by the Dynamic Monitoring and Analysis Service of Soil Salinization in Aksu River Basin (No. 11N45760377620244002), the Technology Innovation Team (Tianshan Innovation Team), the Innovative Team for Efficient Utilization of Water Resources in Arid Regions (No. 2022TSYCTD0001), the Key Project of Natural Science Foundation of Xinjiang Uygur Autonomous Region (No. 2021D01D06), the National Natural Science Foundation of China (No. 41961059), and the Research Project on Spatial and Temporal Evolution of Soil Salinization in the Aksu River Basin (No. 11N457603776202312202).

Data Availability Statement

The data presented in this study are available on request from the corresponding author.

Acknowledgments

We are sincerely grateful to the reviewers and editors for their constructive comments on the improvement of the manuscript.

Conflicts of Interest

The authors declare no conflicts of interest.

References

  1. Zhu, L.; Yuan, S.; Liu, Y.; Chen, C.; Walker, J.P. Time Series Soil Moisture Retrieval from SAR Data: Multi-Temporal Constraints and a Global Validation. Remote Sens. Environ. 2023, 287, 113466. [Google Scholar] [CrossRef]
  2. Peng, J.; Albergel, C.; Balenzano, A.; Brocca, L.; Cartus, O.; Cosh, M.H.; Crow, W.T.; Dabrowska-Zielinska, K.; Dadson, S.; Davidson, M.W.J.; et al. A Roadmap for High-Resolution Satellite Soil Moisture Applications—Confronting Product Characteristics with User Requirements. Remote Sens. Environ. 2021, 252, 112162. [Google Scholar] [CrossRef]
  3. Sadeghi, M.; Ebtehaj, A.; Crow, W.T.; Gao, L.; Purdy, A.J.; Fisher, J.B.; Jones, S.B.; Babaeian, E.; Tuller, M. Global Estimates of Land Surface Water Fluxes from SMOS and SMAP Satellite Soil Moisture Data. J. Hydrometeorol. 2020, 21, 241–253. [Google Scholar] [CrossRef]
  4. Ye, L.; Xu, Y.; Zhu, G.; Zhang, W.; Jiao, Y. Effects of Different Mulch Types on Farmland Soil Moisture in an Artificial Oasis Area. Land 2024, 13, 34. [Google Scholar] [CrossRef]
  5. Zhang, Y.; Bu, J.; Zuo, X.; Yu, K.; Wang, Q.; Huang, W. Vegetation Water Content Retrieval from Spaceborne GNSS-R and Multi-Source Remote Sensing Data Using Ensemble Machine Learning Methods. Remote Sens. 2024, 16, 2793. [Google Scholar] [CrossRef]
  6. Li, Z.-L.; Leng, P.; Zhou, C.; Chen, K.-S.; Zhou, F.-C.; Shang, G.-F. Soil Moisture Retrieval from Remote Sensing Measurements: Current Knowledge and Directions for the Future. Earth-Sci. Rev. 2021, 218, 103673. [Google Scholar] [CrossRef]
  7. Ge, X.; Ding, J.; Jin, X.; Wang, J.; Chen, X.; Li, X.; Liu, J.; Xie, B. Estimating Agricultural Soil Moisture Content through UAV-Based Hyperspectral Images in the Arid Region. Remote Sens. 2021, 13, 1562. [Google Scholar] [CrossRef]
  8. Yang, Z.; He, Q.; Miao, S.; Wei, F.; Yu, M. Surface Soil Moisture Retrieval of China Using Multi-Source Data and Ensemble Learning. Remote Sens. 2023, 15, 2786. [Google Scholar] [CrossRef]
  9. Shokati, H.; Mashal, M.; Noroozi, A.; Abkar, A.A.; Mirzaei, S.; Mohammadi-Doqozloo, Z.; Taghizadeh-Mehrjardi, R.; Khosravani, P.; Nabiollahi, K.; Scholten, T. Random Forest-Based Soil Moisture Estimation Using Sentinel-2, Landsat-8/9, and UAV-Based Hyperspectral Data. Remote Sens. 2024, 16, 1962. [Google Scholar] [CrossRef]
  10. Cashion, J.; Lakshmi, V.; Bosch, D.; Jackson, T.J. Microwave Remote Sensing of Soil Moisture: Evaluation of the TRMM Microwave Imager (TMI) Satellite for the Little River Watershed Tifton, Georgia. J. Hydrol. 2005, 307, 242–253. [Google Scholar] [CrossRef]
  11. Chen, K.-S.; Wu, T.-D.; Tsang, L.; Li, Q.; Shi, J.; Fung, A.K. Emission of Rough Surfaces Calculated by the Integral Equation Method with Comparison to Three-Dimensional Moment Method Simulations. IEEE Trans. Geosci. Remote Sens. 2003, 41, 90–101. [Google Scholar] [CrossRef]
  12. Oh, Y. Quantitative Retrieval of Soil Moisture Content and Surface Roughness from Multipolarized Radar Observations of Bare Soil Surfaces. IEEE Trans. Geosci. Remote Sens. 2004, 42, 596–601. [Google Scholar] [CrossRef]
  13. Shi, J.; Wang, J.; Hsu, A.Y.; O’Neill, P.E.; Engman, E.T. Estimation of Bare Surface Soil Moisture and Surface Roughness Parameter Using L-Band SAR Image Data. IEEE Trans. Geosci. Remote Sens. 1997, 35, 1254–1266. [Google Scholar] [CrossRef]
  14. Attema, E.P.W.; Ulaby, F.T. Vegetation Modeled as a Water Cloud. Radio Sci. 1978, 13, 357–364. [Google Scholar] [CrossRef]
  15. Ulaby, F.T.; Sarabandi, K.; Mcdonald, K.; Whitt, M.; Dobson, M.C. Michigan Microwave Canopy Scattering Model. Int. J. Remote Sens. 1990, 11, 1223–1253. [Google Scholar] [CrossRef]
  16. Cui, H.; Jiang, L.; Paloscia, S.; Santi, E.; Pettinato, S.; Wang, J.; Fang, X.; Liao, W. The Potential of ALOS-2 and Sentinel-1 Radar Data for Soil Moisture Retrieval with High Spatial Resolution over Agroforestry Areas, China. IEEE Trans. Geosci. Remote Sens. 2022, 60, 1–17. [Google Scholar] [CrossRef]
  17. Baghdadi, N.; El Hajj, M.; Zribi, M.; Bousbih, S. Calibration of the Water Cloud Model at C-Band for Winter Crop Fields and Grasslands. Remote Sens. 2017, 9, 969. [Google Scholar] [CrossRef]
  18. Rawat, K.S.; Singh, S.K.; Ray, R.L. An Integrated Approach to Estimate Surface Soil Moisture in Agricultural Lands. Geocarto Int. 2021, 36, 1646–1664. [Google Scholar] [CrossRef]
  19. Li, M.; Yan, Y. Comparative Analysis of Machine-Learning Models for Soil Moisture Estimation Using High-Resolution Remote-Sensing Data. Land 2024, 13, 1331. [Google Scholar] [CrossRef]
  20. Ma, C.; Li, X.; McCabe, M.F. Retrieval of High-Resolution Soil Moisture through Combination of Sentinel-1 and Sentinel-2 Data. Remote Sens. 2020, 12, 2303. [Google Scholar] [CrossRef]
  21. Zhang, L.; Lv, X.; Chen, Q.; Sun, G.; Yao, J. Estimation of Surface Soil Moisture during Corn Growth Stage from SAR and Optical Data Using a Combined Scattering Model. Remote Sens. 2020, 12, 1844. [Google Scholar] [CrossRef]
  22. Carranza, C.; Nolet, C.; Pezij, M.; van der Ploeg, M. Root Zone Soil Moisture Estimation with Random Forest. J. Hydrol. 2021, 593, 125840. [Google Scholar] [CrossRef]
  23. He, B.; Jia, B.; Zhao, Y.; Wang, X.; Wei, M.; Dietzel, R. Estimate Soil Moisture of Maize by Combining Support Vector Machine and Chaotic Whale Optimization Algorithm. Agric. Water Manag. 2022, 267, 107618. [Google Scholar] [CrossRef]
  24. Maaoui, W.; Lazhar, R.; Najjari, M. Soil Moisture Retrieval Model Based on Dielectric Measurements and Artificial Neural Network. J. Porous Media 2022, 25, 19–33. [Google Scholar] [CrossRef]
  25. Breiman, L. Bagging Predictors. Mach. Learn. 1996, 24, 123–140. [Google Scholar] [CrossRef]
  26. Bartlett, P.; Freund, Y.; Lee, W.S.; Schapire, R.E. Boosting the Margin: A New Explanation for the Effectiveness of Voting Methods. Ann. Stat. 1998, 26, 1651–1686. [Google Scholar] [CrossRef]
  27. Wang, L.; Gao, Y. Soil Moisture Retrieval from Sentinel-1 and Sentinel-2 Data Using Ensemble Learning over Vegetated Fields. IEEE J. Sel. Top. Appl. Earth Obs. Remote Sens. 2023, 16, 1802–1814. [Google Scholar] [CrossRef]
  28. Zhang, Y.; Liang, S.; Zhu, Z.; Ma, H.; He, T. Soil Moisture Content Retrieval from Landsat 8 Data Using Ensemble Learning. ISPRS J. Photogramm. Remote Sens. 2022, 185, 32–47. [Google Scholar] [CrossRef]
  29. Liu, Y.; Qian, J.; Yue, H. Combined Sentinel-1A with Sentinel-2A to Estimate Soil Moisture in Farmland. IEEE J. Sel. Top. Appl. Earth Obs. Remote Sens. 2021, 14, 1292–1310. [Google Scholar] [CrossRef]
  30. Feng, L.; Zhang, Z.; Ma, Y.; Du, Q.; Williams, P.; Drewry, J.; Luck, B. Alfalfa Yield Prediction Using UAV-Based Hyperspectral Imagery and Ensemble Learning. Remote Sens. 2020, 12, 2028. [Google Scholar] [CrossRef]
  31. Zhai, W.; Li, C.; Cheng, Q.; Ding, F.; Chen, Z. Exploring Multisource Feature Fusion and Stacking Ensemble Learning for Accurate Estimation of Maize Chlorophyll Content Using Unmanned Aerial Vehicle Remote Sensing. Remote Sens. 2023, 15, 3454. [Google Scholar] [CrossRef]
  32. Tao, S.; Zhang, X.; Feng, R.; Qi, W.; Wang, Y.; Shrestha, B. Retrieving Soil Moisture from Grape Growing Areas Using Multi-Feature and Stacking-Based Ensemble Learning Modeling. Comput. Electron. Agric. 2023, 204, 107537. [Google Scholar] [CrossRef]
  33. Cui, S.; Yin, Y.; Wang, D.; Li, Z.; Wang, Y. A Stacking-Based Ensemble Learning Method for Earthquake Casualty Prediction. Appl. Soft Comput. 2021, 101, 107038. [Google Scholar] [CrossRef]
  34. Ma, G.; Ding, J.; Han, L.; Zhang, Z.; Ran, S. Digital Mapping of Soil Salinization Based on Sentinel-1 and Sentinel-2 Data Combined with Machine Learning Algorithms. Reg. Sustain. 2021, 2, 177–188. [Google Scholar] [CrossRef]
  35. Ding, J.; Yu, D. Monitoring and Evaluating Spatial Variability of Soil Salinity in Dry and Wet Seasons in the Werigan–Kuqa Oasis, China, Using Remote Sensing and Electromagnetic Induction Instruments. Geoderma 2014, 235–236, 316–322. [Google Scholar] [CrossRef]
  36. Wang, F.; Shi, Z.; Biswas, A.; Yang, S.; Ding, J. Multi-Algorithm Comparison for Predicting Soil Salinity. Geoderma 2020, 365, 114211. [Google Scholar] [CrossRef]
  37. Tan, J.; Ding, J.; Han, L.; Ge, X.; Wang, X.; Wang, J.; Wang, R.; Qin, S.; Zhang, Z.; Li, Y. Exploring PlanetScope Satellite Capabilities for Soil Salinity Estimation and Mapping in Arid Regions Oases. Remote Sens. 2023, 15, 1066. [Google Scholar] [CrossRef]
  38. He, B.; Ding, J.; Huang, W.; Ma, X. Spatiotemporal Variation and Future Predictions of Soil Salinization in the Werigan–Kuqa River Delta Oasis of China. Sustainability 2023, 15, 13996. [Google Scholar] [CrossRef]
  39. Baghdadi, N.; Bazzi, H.; El Hajj, M.; Zribi, M. Detection of Frozen Soil Using Sentinel-1 SAR Data. Remote Sens. 2018, 10, 1182. [Google Scholar] [CrossRef]
  40. Bousbih, S.; Zribi, M.; Lili-Chabaane, Z.; Mougenot, B.; Pelletier, C.; El Hajj, M.; Baghdadi, N. Sentinel-1 and Sentinel-2 Data for the Characterisation of the States of Continental Surface over a Semi-Arid Region En Tunisia. In Proceedings of the 2020 Mediterranean and Middle-East Geoscience and Remote Sensing Symposium (M2GARSS), Tunis, Tunisia, 9–11 March 2020; IEEE: Piscataway, NJ, USA, 2020; pp. 285–288. [Google Scholar]
  41. Sims, D.A.; Gamon, J.A. Estimation of Vegetation Water Content and Photosynthetic Tissue Area from Spectral Reflectance: A Comparison of Indices Based on Liquid Water and Chlorophyll Absorption Features. Remote Sens. Environ. 2003, 84, 526–537. [Google Scholar] [CrossRef]
  42. Djamai, N.; Fernandes, R. Comparison of SNAP-Derived Sentinel-2A L2A Product to ESA Product over Europe. Remote Sens. 2018, 10, 926. [Google Scholar] [CrossRef]
  43. Bhatnagar, S.; Gill, L.; Regan, S.; Naughton, O.; Johnston, P.; Waldren, S.; Ghosh, B. Mapping vegetation communities inside wetlands using Sentinel-2 imagery in Ireland. Int. J. Appl. Earth Obs. Geoinf. 2020, 88, 102083. [Google Scholar] [CrossRef]
  44. Abdelouhed, F.; Ahmed, A.; Abdellah, A.; Mohammed, I.; Zouhair, O. Extraction and Analysis of Geological Lineaments by Combining ASTER-GDEM and Landsat 8 Image Data in the Central High Atlas of Morocco. Nat. Hazards 2022, 11, 1907–1929. [Google Scholar] [CrossRef]
  45. Ni, W.; Sun, G.; Ranson, K.J. Characterization of ASTER GDEM Elevation Data over Vegetated Area Compared with Lidar Data. Int. J. Digit. Earth 2015, 8, 198–211. [Google Scholar] [CrossRef]
  46. Skrunes, S.; Brekke, C.; Jones, C.E.; Espeseth, M.M.; Holt, B. Effect of Wind Direction and Incidence Angle on Polarimetric SAR Observations of Slicked and Unslicked Sea Surfaces. Remote Sens. Environ. 2018, 213, 73–91. [Google Scholar] [CrossRef]
  47. Zhao, J.; Zhang, C.; Min, L.; Guo, Z.; Li, N. Retrieval of Farmland Surface Soil Moisture Based on Feature Optimization and Machine Learning. Remote Sens. 2022, 14, 5102. [Google Scholar] [CrossRef]
  48. Cloude, S.R.; Pottier, E. An Entropy Based Classification Scheme for Land Applications of Polarimetric SAR. IEEE Trans. Geosci. Remote Sens. 1997, 35, 68–78. [Google Scholar] [CrossRef]
  49. Bindlish, R.; Barros, A.P. Parameterization of Vegetation Backscatter in Radar-Based, Soil Moisture Estimation. Remote Sens. Environ. 2001, 76, 130–137. [Google Scholar] [CrossRef]
  50. Penuelas, J.; Pinol, J.; Ogaya, R.; Filella, I. Estimation of Plant Water Concentration by the Reflectance Water Index WI (R900/R970). Int. J. Remote Sens. 1997, 18, 2869–2875. [Google Scholar] [CrossRef]
  51. Chen, D.; Huang, J.; Jackson, T.J. Vegetation Water Content Estimation for Corn and Soybeans Using Spectral Indices Derived from MODIS Near-and Short-Wave Infrared Bands. Remote Sens. Environ. 2005, 98, 225–236. [Google Scholar] [CrossRef]
  52. Zhao, J.; Zhang, B.; Li, N.; Guo, Z. Cooperative Inversion of Winter Wheat Covered Surface Soil Moisture Based on Sentinel-1/2 Remote Sensing Data. J. Electron. Inf. Technol. 2021, 43, 692–699. [Google Scholar] [CrossRef]
  53. Huete, A.; Didan, K.; Miura, T.; Rodriguez, E.P.; Gao, X.; Ferreira, L.G. Overview of the Radiometric and Biophysical Performance of the MODIS Vegetation Indices. Remote Sens. Environ. 2002, 83, 195–213. [Google Scholar] [CrossRef]
  54. Haralick, R.M.; Shanmugam, K.; Dinstein, I.H. Textural Features for Image Classification. IEEE Trans. Syst. Man Cybern. 1973, SMC-3, 610–621. [Google Scholar] [CrossRef]
  55. Han, H.; Zeng, Q.; Jiao, J. Quality Assessment of TanDEM-X DEMs, SRTM and ASTER GDEM on Selected Chinese Sites. Remote Sens. 2021, 13, 1304. [Google Scholar] [CrossRef]
  56. Wang, C.; Xie, Q.; Gu, X.; Yu, T.; Meng, Q.; Zhou, X.; Han, L.; Zhan, Y. Soil Moisture Estimation Using Bayesian Maximum Entropy Algorithm from FY3-B, MODIS and ASTER GDEM Remote-Sensing Data in a Maize Region of HeBei Province, China. Int. J. Remote Sens. 2020, 41, 7018–7041. [Google Scholar] [CrossRef]
  57. Veronika Dorogush, A.; Ershov, V.; Gulin, A. CatBoost: Gradient Boosting with Categorical Features Support. arXiv 2018, arXiv:1810.11363. [Google Scholar]
  58. Ke, G.; Meng, Q.; Finley, T.; Wang, T.; Chen, W.; Ma, W.; Ye, Q.; Liu, T.-Y. Lightgbm: A Highly Efficient Gradient Boosting Decision Tree. Adv. Neural Inf. Process. Syst. 2017, 30, 52. [Google Scholar]
  59. Breiman, L. Random Forests. Mach. Learn. 2001, 45, 5–32. [Google Scholar] [CrossRef]
  60. Dietterich, T.G. Ensemble Learning. Handb. Brain Theory Neural Netw. 2002, 2, 110–125. [Google Scholar]
  61. Saber, M.; Boulmaiz, T.; Guermoui, M.; Abdrabo, K.I.; Kantoush, S.A.; Sumi, T.; Boutaghane, H.; Nohara, D.; Mabrouk, E. Examining LightGBM and CatBoost Models for Wadi Flash Flood Susceptibility Prediction. Geocarto Int. 2022, 37, 7462–7487. [Google Scholar] [CrossRef]
  62. Ge, X.; Sun, J.; Lu, B.; Chen, Q.; Xun, W.; Jin, Y. Classification of Oolong Tea Varieties Based on Hyperspectral Imaging Technology and BOSS-LightGBM Model. J. Food Process Eng. 2019, 42, e13289. [Google Scholar] [CrossRef]
  63. Chang, X.; Xing, Y.; Gong, W.; Yang, C.; Guo, Z.; Wang, D.; Wang, J.; Yang, H.; Xue, G.; Yang, S. Evaluating Gross Primary Productivity over 9 ChinaFlux Sites Based on Random Forest Regression Models, Remote Sensing, and Eddy Covariance Data. Sci. Total Environ. 2023, 875, 162601. [Google Scholar] [CrossRef]
  64. Wang, H.; Magagi, R.; Goïta, K. Potential of a Two-Component Polarimetric Decomposition at C-Band for Soil Moisture Retrieval over Agricultural Fields. Remote Sens. Environ. 2018, 217, 38–51. [Google Scholar] [CrossRef]
  65. Zhang, Y.; Han, W.; Zhang, H.; Niu, X.; Shao, G. Evaluating Soil Moisture Content under Maize Coverage Using UAV Multimodal Data by Machine Learning Algorithms. J. Hydrol. 2023, 617, 129086. [Google Scholar] [CrossRef]
  66. Luo, L.; Li, Y.; Guo, F.; Huang, Z.; Wang, S.; Zhang, Q.; Zhang, Z.; Yao, Y. Research on Robust Inversion Model of Soil Moisture Content Based on GF-1 Satellite Remote Sensing. Comput. Electron. Agric. 2023, 213, 108272. [Google Scholar] [CrossRef]
  67. Zandi, O.; Zahraie, B.; Nasseri, M.; Behrangi, A. Stacking Machine Learning Models versus a Locally Weighted Linear Model to Generate High-Resolution Monthly Precipitation over a Topographically Complex Area. Atmos. Res. 2022, 272, 106159. [Google Scholar] [CrossRef]
  68. Jia, W.; Cheng, J.; Hu, H. A Cluster-Stacking-Based Approach to Forecasting Seasonal Chlorophyll-a Concentration in Coastal Waters. IEEE Access 2020, 8, 99934–99947. [Google Scholar] [CrossRef]
  69. Cheng, M.; Jiao, X.; Liu, Y.; Shao, M.; Yu, X.; Bai, Y.; Wang, Z.; Wang, S.; Tuohuti, N.; Liu, S.; et al. Estimation of Soil Moisture Content under High Maize Canopy Coverage from UAV Multimodal Data and Machine Learning. Agric. Water Manag. 2022, 264, 107530. [Google Scholar] [CrossRef]
  70. Wadoux, A.M.J.-C.; Minasny, B.; McBratney, A.B. Machine Learning for Digital Soil Mapping: Applications, Challenges and Suggested Solutions. Earth-Sci. Rev. 2020, 210, 103359. [Google Scholar] [CrossRef]
  71. Vaysse, K.; Lagacherie, P. Using Quantile Regression Forest to Estimate Uncertainty of Digital Soil Mapping Products. Geoderma 2017, 291, 55–64. [Google Scholar] [CrossRef]
  72. Brungard, C.; Nauman, T.; Duniway, M.; Veblen, K.; Nehring, K.; White, D.; Salley, S.; Anchang, J. Regional Ensemble Modeling Reduces Uncertainty for Digital Soil Mapping. Geoderma 2021, 397, 114998. [Google Scholar] [CrossRef]
Figure 1. (a) Location of the study area on the overview map of China; (b) Xinjiang location; (c) land use types and distribution of sampling points in the research area; (d) H-α images covering the study area in the dual-polarized decomposition (source: Sentinel-1); (e) optical images of the study area (source: Sentinel-2).
Land 13 01635 g001
Figure 2. Technology roadmap.
Land 13 01635 g002
Figure 3. Descriptive statistical chart of soil moisture content.
Land 13 01635 g003
Figure 4. Variable analysis results: (a) importance assessment results; (b) correlation analysis results.
Land 13 01635 g004
Figure 5. Normalized addition result.
Land 13 01635 g005
Figure 6. Scatter plot of estimated soil moisture content and measured soil moisture content using CatBoost model: (a) top 4 features, (b) top 8 features, (c) top 12 features, (d) top 16 features, (e) all 21 features.
Land 13 01635 g006
Figure 7. The line graph of the CatBoost model for predicting soil moisture content and measured soil moisture content: (a) top 4 features, (b) top 8 features, (c) top 12 features, (d) top 16 features, (e) all 21 features.
Land 13 01635 g007
Figure 8. Scatter plot results of Stacking model inversion under the first 16 parameters: (a) Stacking1, (b) Stacking2.
Land 13 01635 g008
Figure 9. Line graphs of the predicted and measured soil moisture content of the Stacking models under the first 16 parameters: (a) Stacking1 and (b) Stacking2.
Land 13 01635 g009
Figure 10. Performance comparison of the validation set for soil moisture inversion model: (a) R2 and (b) RMSE (%).
Land 13 01635 g010
Figure 11. Inversion results of soil moisture of optimal single model.
Land 13 01635 g011
Figure 12. Stacking model soil moisture inversion results (a) Stacking1 and (b) Stacking2.
Land 13 01635 g012
Table 1. Main parameters of Sentinel-1 data.
Parameter TypeData
Imaging date19 June 2022
Data FormatLevel-1 SLC
PolarizedVV+VH
Projection methodUTM
BandC-Band, 5.405 GHz
Flight directionASCENDING
Incident angle38.9°
Distance sampling interval13.9 m
Azimuth sampling interval2.33 m
Sub-bandsIW1, IW2, IW3
Table 2. Main parameters of Sentinel-1/2 data, DEM.
DatasetFeaturesFormulation/Simple Description
Sentinel-1Incidence angleθ
Backscatter coefficientVV, VH, VV+VH, VV-VH, VV×VH, VV/VH
Polarization decomposition (H/A/α) H = i = 1 2 P i log 2 P i
A = λ 1 λ 2 λ 1 + λ 2
α = i = 1 2 P i α i = P 1 α 1 + P 2 α 2
Sentinel-2NDMI N D M I = ρ N I R ρ M I R ρ N I R + ρ M I R
NDVI N D V I = ρ N I R ρ R E D ρ N I R + ρ R E D
NDWI N D W I = ρ G R E E N ρ N I R ρ G R E E N + ρ N I R
EVI E V I = ρ N I R ρ R E D ρ N I R + 6 ρ R E D 7.5 ρ B L U E + 1
GLCMContrast (CON), Dissimilarity (DIS), Entropy (ENT), Second moment (SEC)
ASTER-GDEMDEMElevation
Slope
Aspect
Table 3. Comparison of accuracy of inversion results.
Parameter CombinationModelT-R2V-R2V-RMSEV-MAE
Top 4 featuresRF0.6070.5672.797%1.650%
CatBoost0.7520.5922.716%1.749%
LightGBM0.6510.5982.69%1.525%
Top 8 featuresRF0.7170.5812.387%1.286%
CatBoost0.8480.6182.279%1.278%
LightGBM0.6830.5792.392%1.272%
Top 12 featuresRF0.8140.7121.812%1.456%
CatBoost0.8210.7991.514%1.249%
LightGBM0.7700.7071.828%1.465%
Top 16 featuresRF0.7890.7281.743%1.537%
CatBoost0.8480.8271.355%1.319%
LightGBM0.8350.7421.475%1.380%
All 21 featuresRF0.7320.7001.918%1.249%
CatBoost0.8220.8191.529%1.222%
LightGBM0.8530.7861.867%1.024%
Note: T-R2: R2 of the training set; V-R2: R2 of the validation set; V-RMSE: RMSE of the validation set; V-MAE: The MAE of the validation set.
Table 4. Example of estimating soil moisture content using remote sensing.
Remote Sensing SourceModelSample DepthPerformance
Sentinel-1/2,
Radarsat-2
Random Forest0–5 cmR2 = 0.64,
RMSE = 2.64%
GF-1Robust Extreme Learning Machine0–20 cmR2 = 0.696,
RMSE = 1.8%
UAVExtreme Gradient
Boost
0–10 cmR2 = 0.921,
RMSE = 1.9%
Sentinel-1/2Random Forest0–5 cmMAE = 2.289%,
RMSE = 2.934%
Disclaimer/Publisher’s Note: The statements, opinions and data contained in all publications are solely those of the individual author(s) and contributor(s) and not of MDPI and/or the editor(s). MDPI and/or the editor(s) disclaim responsibility for any injury to people or property resulting from any ideas, methods, instructions or products referred to in the content.

