Article

Sustainable Organic Farming Crops in Nepal in Climate Change Conditions: Predictions and Preferences

1
Department of Geoinformatics, Faculty of Science, Palacký University Olomouc, 17. Listopadu 50, CZ-771 46 Olomouc, Czech Republic
2
Global Change Research Institute of the Czech Academy of Sciences, Bělidla 986/4a, CZ-603 00 Brno, Czech Republic
3
Rural Reconstruction Nepal (RRN), 288 Gairidhara Marg, Gairidhara, Kathmandu 44600, Nepal
4
Department of Landscape Management, Faculty of Agriculture, University of South Bohemia, Studentská 1668, CZ-370 05 České Budějovice, Czech Republic
*
Author to whom correspondence should be addressed.
Land 2024, 13(10), 1610; https://doi.org/10.3390/land13101610
Submission received: 23 August 2024 / Revised: 24 September 2024 / Accepted: 1 October 2024 / Published: 3 October 2024

Abstract

:
In Nepal, climate change is projected to cause a rapid increase in air temperature, erratic rainfalls, and other changes that could negatively impact agricultural productivity. Given the crucial role of agriculture in household income and consumption, Nepal is particularly vulnerable to these impacts. Organic farming has the potential to enhance environmental protection and contribute positively to climate change mitigation and adaptation. This study aims to identify suitable crops for individual wards within the Dolakha district under changing climatic conditions. The EcoCrop model was applied to crops pre-selected by local small farmers to assess their suitability under both current and projected climate conditions in 2050. According to the model, the most successful crops under both current and future climate conditions were beans and colocasia, garlic, local radish, and finger millet. The modeling results were then compared to the preferences of local farmers as revealed through a questionnaire survey. Most crops selected by the model were also selected as suitable by local farmers, with beans being the exception. These findings have the potential to assist local stakeholders, including farmers, planners, and local authorities, in promoting successful organic farming by selecting suitable crops, thereby aiding the region in better adapting to expected climate change.

1. Introduction

Nepal faces significant risks associated with climate change which includes rapid temperature increase [1,2], erratic rainfall patterns, decreased length of winter, and increased frequency and length of droughts [3]. The further acceleration of climate warming is expected; regional climate-model projections carried out by Ahmed [4] showed expected temperature increases of 1.6–2 °C by 2030, 2.3–2.9 °C by 2050, and 3.4–5.0 °C by 2080. Moreover, scientists have confirmed that an increase in temperature also plays a great role in changing precipitation patterns [5].
Climate change affects the resources that human life depends on and usually has the highest impact on the poor and vulnerable population groups [6,7]. Temperature rise implies significant agricultural productivity loss. Although mean annual precipitation varies within the country and there is no definite trend in total precipitation, there has already been evidence of extreme precipitation in Nepal causing damage to crops [8] as well as droughts that reduced crop production of 12.5% on a national basis [1]. Such extreme events have significant negative impacts on crop productivity and food supply [9] and Nepal is expected to be one of the most vulnerable places in South Asia regarding this impact [4] among other factors due to the crucial role of agriculture in household income and consumption.
The impact of climate change on agricultural production is also greatly aggravated by degradation caused by inappropriate management, especially intensive inorganic farming practices, posing a direct threat to agricultural productivity (exacerbating erosion and soil contamination) [10] as well as environmental quality and biodiversity [11]. Human activities such as deforestation, agriculture activities on steep slopes, and rapid population growth have increased in this district [12]. Such changes are leading to land degradation, especially to soil erosion, which occurs mainly in the northeastern part of the country due to steep slopes [13]. Due to this land degradation, barren land increased from 2001 to 2018 [13]. Mountain farming systems are very fragile due to steep slopes, erodible soils, intense rainfall, intensive cultivation, and uncertain markets [14]. Thanks to increasing awareness of the risks arising from the combination of vulnerable landscape, climate change, and intensive management, organic farming is highly recommended in Nepal and the trends promoting organic farming are growing there [15].
Organic farming is defined as a form of agriculture that does not use chemical inputs and promotes biological and ecological processes to improve soil fertility and animal and plant health [16]. It can help to stop losses of fertile arable land [17], has the potential to improve environmental protection, conservation of non-renewable resources, resource and food quality [18,19], and has significant environmental benefits compared to conventional farming, see [20]. A European study also found it has a positive effect on soil organic matter accumulation, soil biology, reduction of nitrate leaching and pesticide contamination [21], and on landscape diversity [22]. Organic agricultural practices also play a role in climate change mitigation and adaptation [11,23] due to lower agricultural greenhouse gas emissions and an increase in soil carbon storage [24].
Organic agriculture is not a new system in the context of Nepal; farmers of hills and mountains are using traditional farming with lower productivity which is similar to organic farming [25,26]. Over time, farmers have developed indigenous knowledge and local practices that involve maintaining interactions among crops, trees, and animals [27,28]. Drawing on such traditional knowledge and skills, farmers in the hills and mountains of Nepal have strategically incorporated climatically and geographically suitable species into their agricultural lands [29]. Until the 1950s, the Nepalese farming system was predominantly organic. However, over time, there has been a shift towards inorganic farming practices, posing a direct threat to sustainable agricultural productivity, environmental quality, and human health [27,28]. Presently, numerous institutions, individuals, and farmers are actively participating, at least partially, in organic farming promotion. Due to growing demand and expanding export markets, the Nepali government recognized organic farming opportunities in its Agriculture Development Strategy. First prioritized in 2003 [30], organic farming is now part of national policy. However, the field-level adoption of organic farming practices is still limited and is more common in subsistence agriculture [25]. For instance, the organic certified land area in Nepal was only 11,851 ha (0.30% of the total agricultural land area) in 2018 [31]. This indicates that while there is a growing interest in organic agriculture, the actual implementation and certification of organic farming practices remain relatively low. However, organic farming is growing rapidly among Nepalese farmers and entrepreneurs, especially in hilly areas [25,26,32]. This increase is largely driven by consumers’ growing preference for organic products, which they are willing to purchase at a premium price [26]. Many indigenous farming practices are already based on ecological principles and combining the best of traditional knowledge with support from recent scientific research can offer farmers an opportunity for success [33].
Organic farming has a great potential in the Dolakha district owing to its favorable climatic and environmental conditions [34]. However, in the conditions of climate change, farmers cannot fully rely on traditional crops and practices, which may no longer prove effective in the new conditions. Climatic modeling and modeling of land suitability for various crops for organic farming in Nepal can help farmers to choose the proper crops while considering the expected extent of climate change, especially the shifts in temperature, length of growing season and precipitation. Land suitability can be assessed using Land Suitability Analysis (LSA), a method of land evaluation, which allows identifying suitable areas for individual crops based on their main limiting factors [35]. Selection of a suitable site is one of the precursors to better agricultural production. Numerous suitability studies [36,37,38,39,40] have been conducted in Nepal for various cash crops.
Interpretation of model outputs and map analyses can serve as a guide, but traditional knowledge and skills, proven by the long-term orientation of local people to agricultural production and the transmission of local knowledge, will still have an irreplaceable place in organic agriculture. Thus, the preferences of local people and their local knowledge need to be taken into consideration as well. Nepal, as many other developing countries, is highly dependent on agriculture; the majority of its population (65%) is involved in it [41]. In Nepal, the traditional farming system has developed a unique diversity center of globally important crop varieties, including cold-tolerant rice, naked barley, barley, buckwheat, amaranth, bean, and minor millets such as proso millet, foxtail millet, and finger millet [42,43]. These crops are hardy, are cultivated in marginal lands with minimal external inputs, and are widely adapted and tolerant to cold and drought stress [14]. They also have a capacity to withstand climatic stresses and disease epidemics [44] and play a vital role in food and nutrition security. Thus, the local people’s choice of crops, experience with planting, and knowledge of the local crop varieties and their suitability for individual sites/wards is of the highest importance.
Considering the overall benefits of organic agriculture, this project aimed to contribute to the development of a sustainable organic agriculture model for mountain farmers in Nepal. The main goal was to identify suitable crops for individual wards within the study area under changing climatic conditions. In this study, suitable crops are defined as those that best resist changing bio-climatic conditions and align with local farmers’ preferences.

2. Materials and Methods
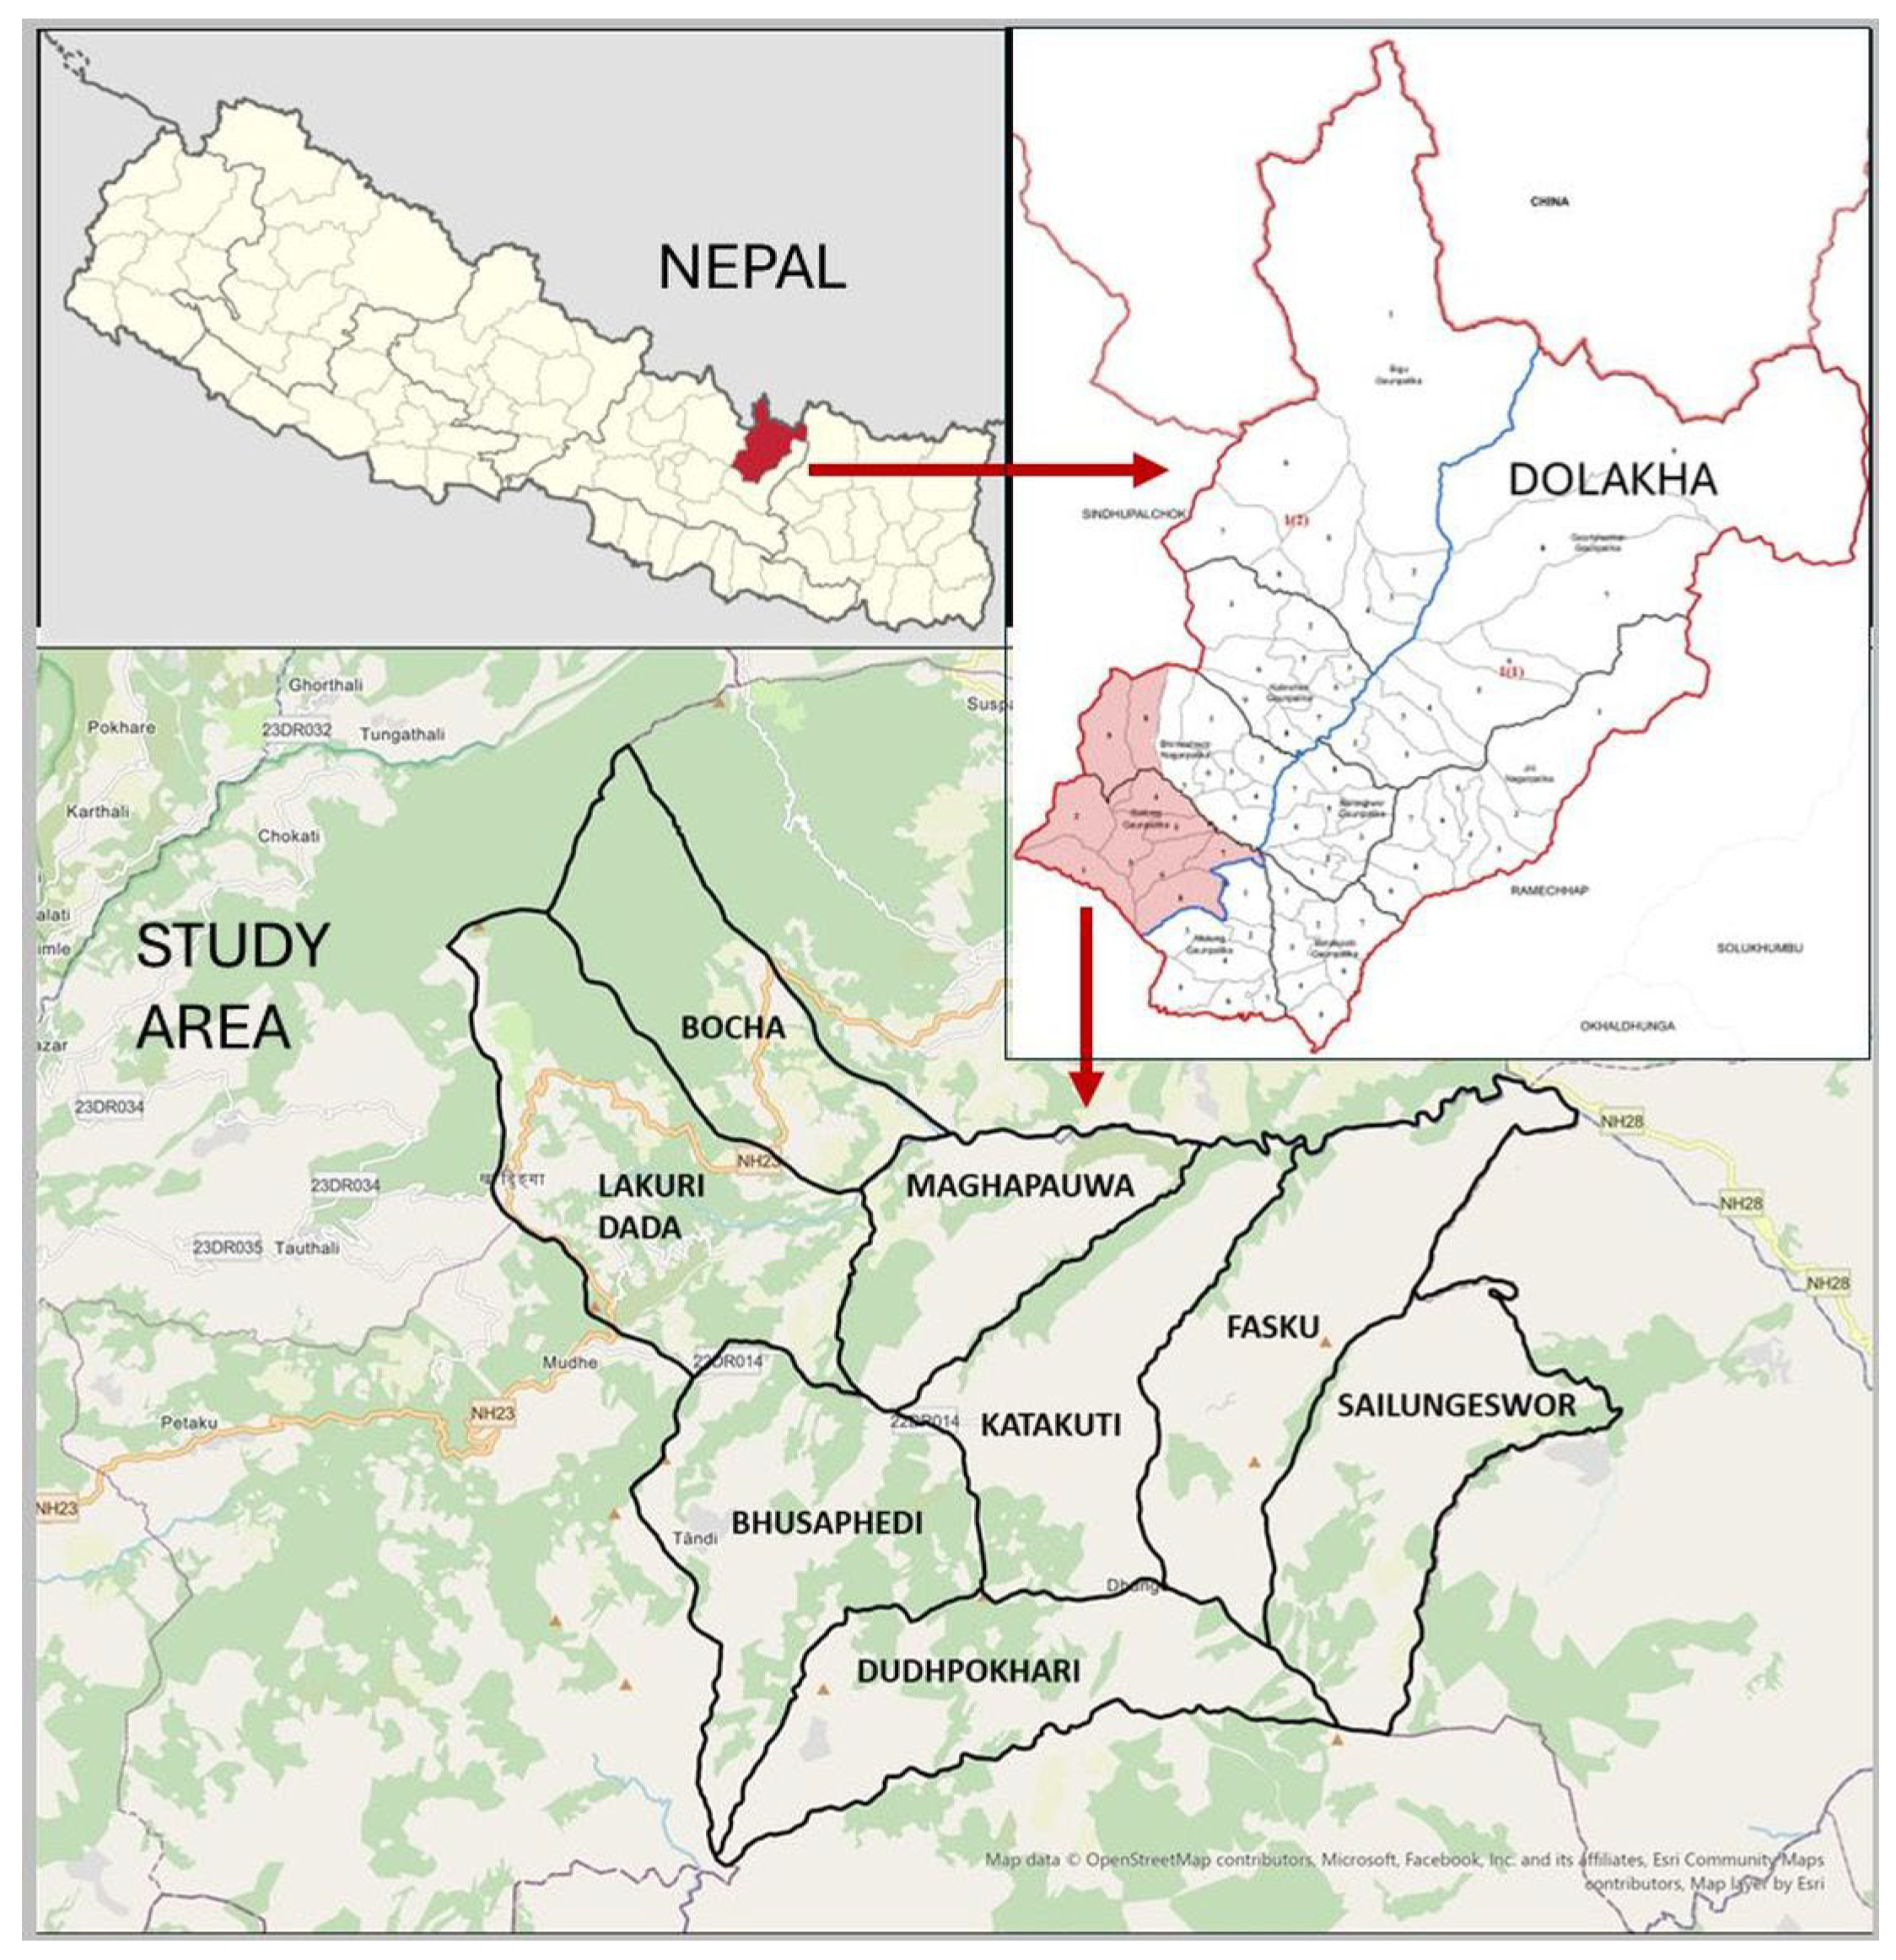
2.1. Study Area

The study was carried out in Dolakha district, in the northeast part of Nepal. It covers two wards (formerly Village Development Committees) of Bhimeshwor Municipality, Bocha and Lakuri Dada, along with all six wards of Sailung Rural Municipality, Dudhpokhari, Bhusafeda, Maghapauwa, Katakuti, Fasku and Sailungeswor (Figure 1).
The climate of Dolakha consists of subtropical, warm-temperate, cool-temperate, subalpine, and alpine climates, the last three are not included in the study area. Depending on the altitudinal gradient, the climate within the study area can be categorized as sub-tropical and warm temperate. The average annual air temperature ranges from 3 °C to 22 °C and the average annual rainfall is about 2000 mm per year. During the winter season, the temperature falls below 0 °C and some high-altitude hilltops receive snowfall.
The study area is located in the mid-hills of Nepal. Dramatic geographic differences have created diverse macro- and microclimatic environments; therefore, the district is rich in diverse flora and fauna.
A relatively small share of the land (cca 12–13%) is used for agriculture, while ca 3% of the area is covered by shrubs. Forest covers 52.7% of the whole study area; however, there are differences among the wards; for example, Bocha and Lakuri Dada are more forested than Fasku and Katakuti. Table 1 shows shares of land use/land cover categories in the study area. The infrastructure is not so well developed; thus, in some areas, the connection to the market can be complicated.
The total population of the Dolakha district is 186,557 people (99,554 women and 87,003 men) with a population density of 87 people per square kilometer. There are in total 45,688 households and an average household size of 4.08 persons [43]. The majority of the population is Hindu (71.05%), while 28.59% are Buddhist and 0.36% are classified as “other”. The most common occupation of the district’s population is agriculture and livestock (67.2%), followed by industry and commerce (17%), service (0.3%), and other [45]. According to the Nepal Human Development Report [46], Nepal’s Human Development Index (HDI) value is 0.601—placing the country in the Medium human development category and positioning it at 146 out of 193 countries and territories.
Rural Reconstruction Nepal (RRN) is operating in the area. It is a Nepali non-governmental, non-profit, social development organization, committed to driving positive change and empowerment in Nepal’s rural communities. In Dolakha, it supports agricultural know-how, craft, education, innovation, and necessary infrastructure to promote processing and outcome of agricultural products.

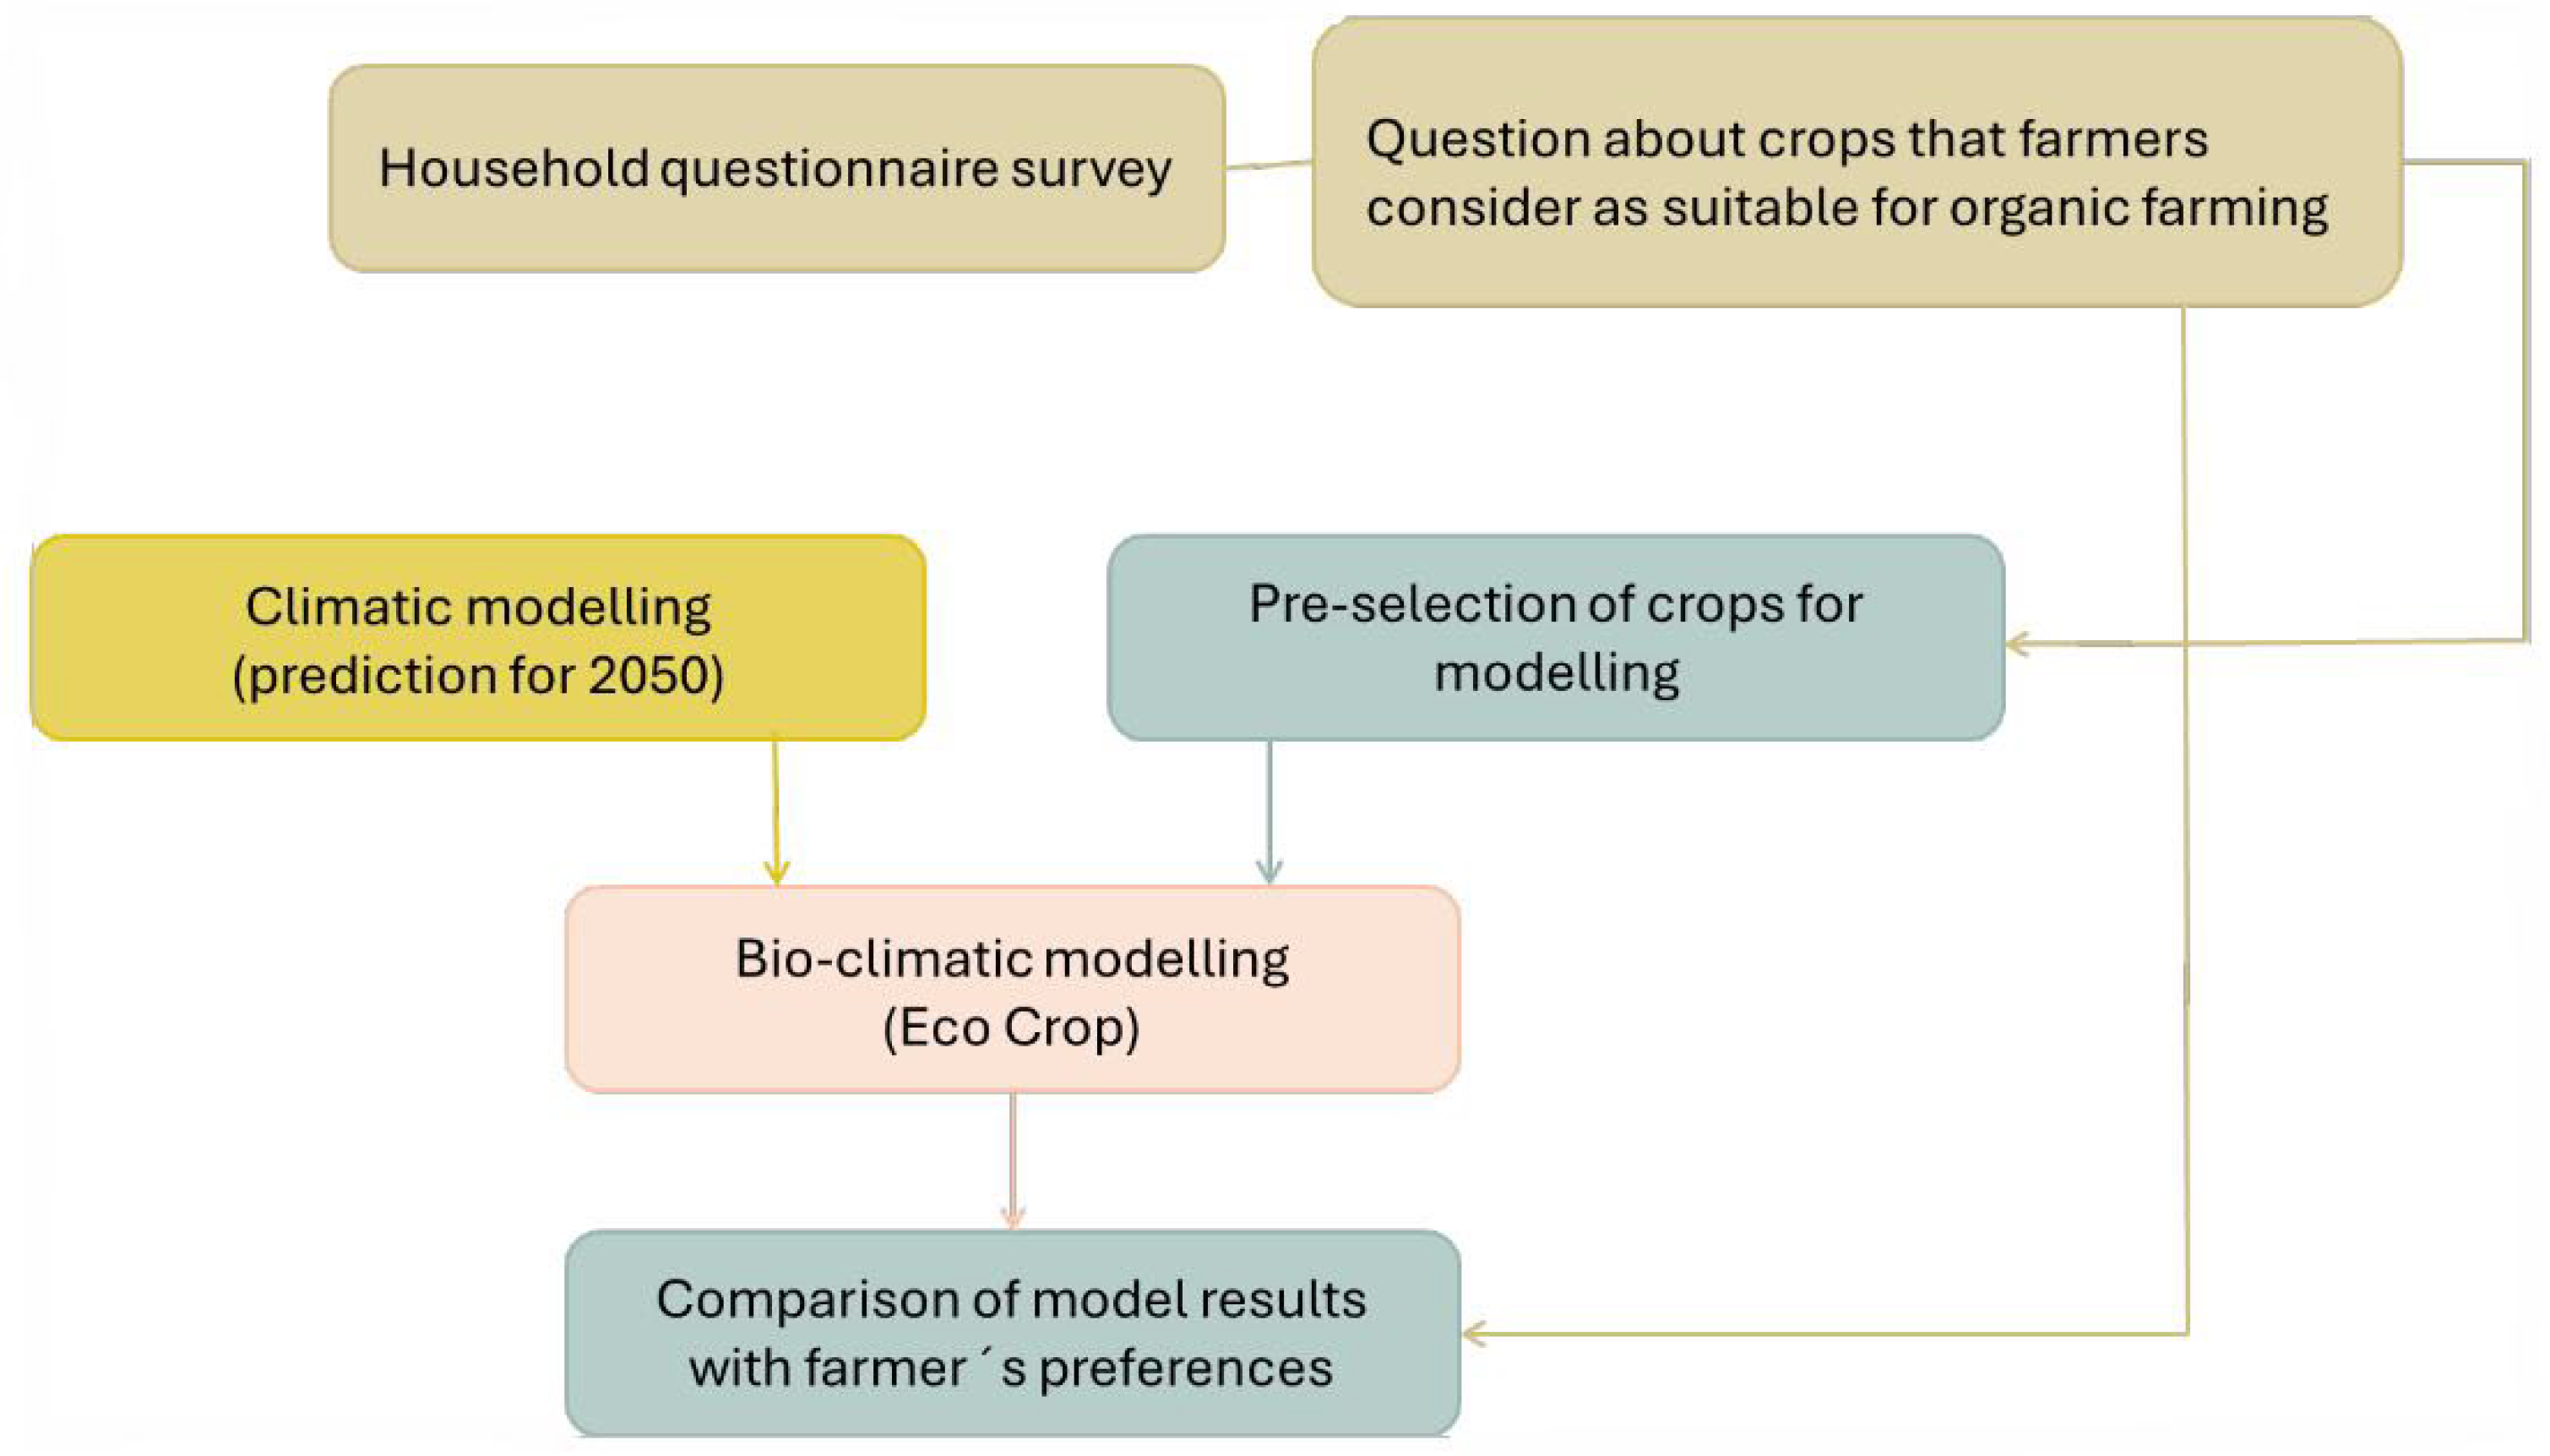
2.2. Research Concept

For the whole study area, climate modeling was conducted to predict bio-climatic conditions over a 50-year period. The crops that came into consideration for the given location were pre-selected based on a questionnaire survey of local farmers’ opinions. Subsequently, the Eco-Crop model developed by Hijmans [47] was applied to selected crops to assess their suitability under both current and future climatic conditions. Suitability maps were generated for each selected crop, considering (a) current climatic conditions and (b) predicted climatic conditions in 50 years. In the final step, the results from household surveys of local farmers were analyzed. Their outcomes pertaining to suitable crops for organic farming in individual wards were then compared with the results obtained from the models (see Figure 2).

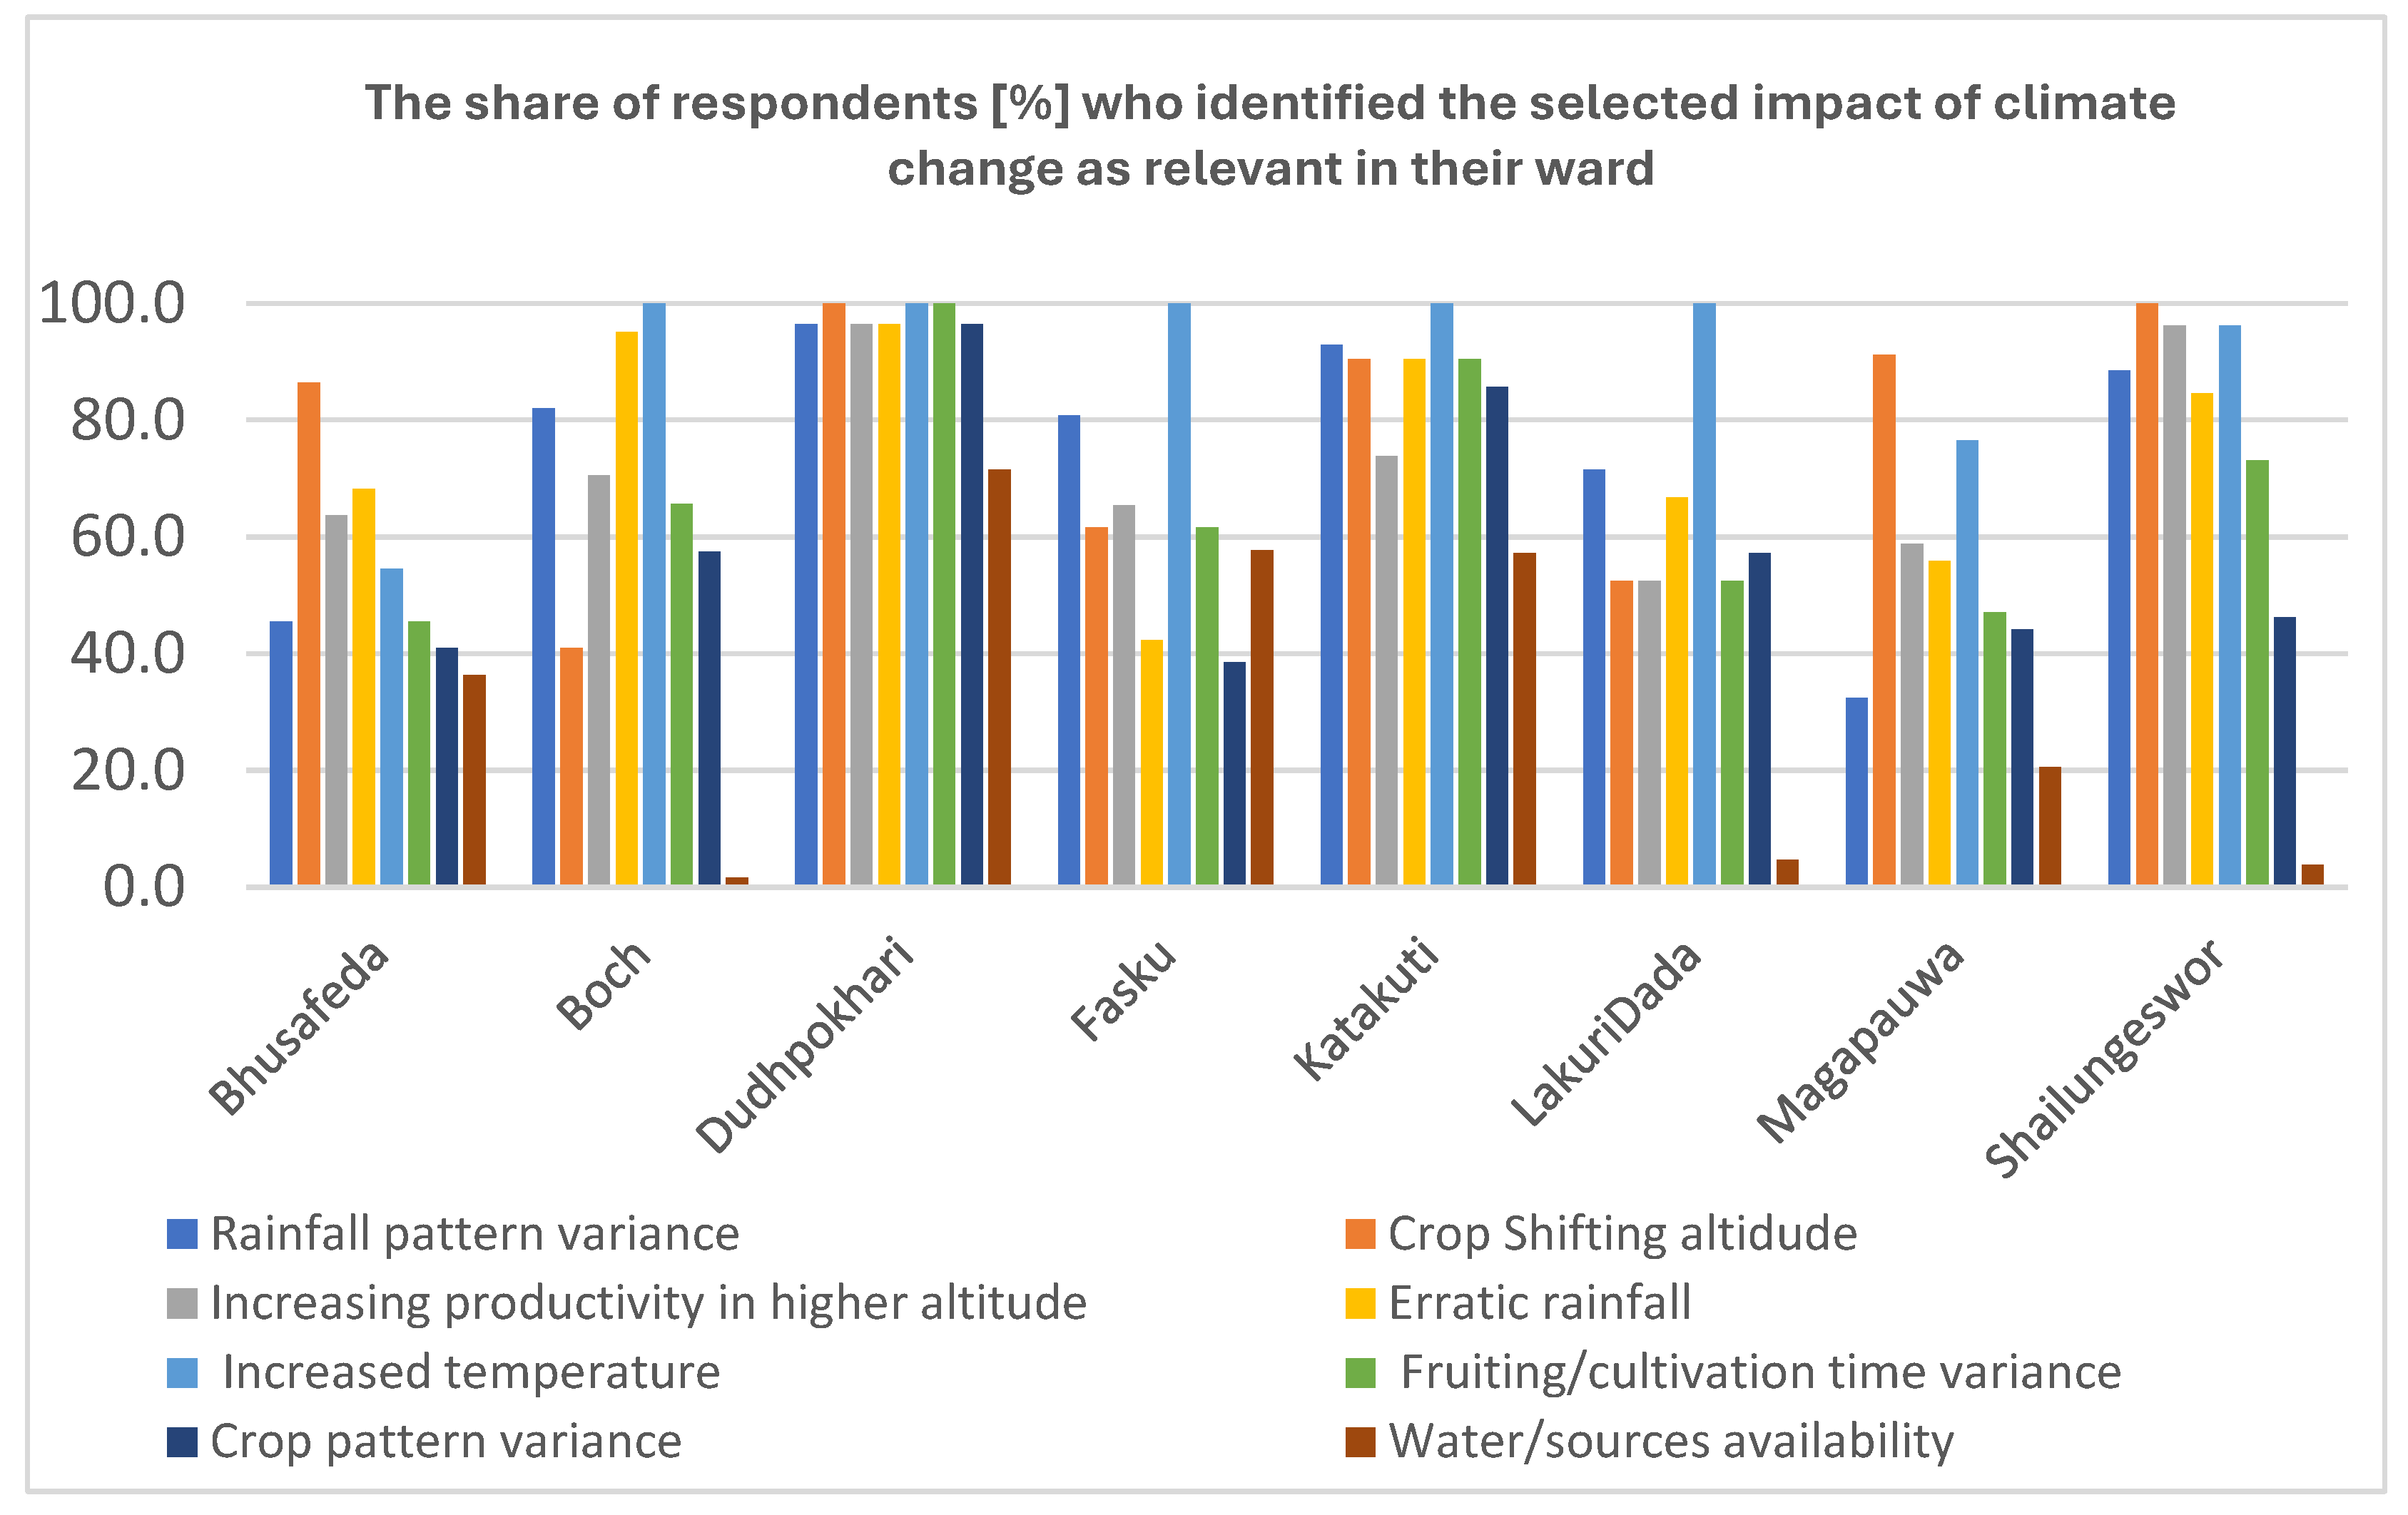
2.3. The Questionnaire Survey
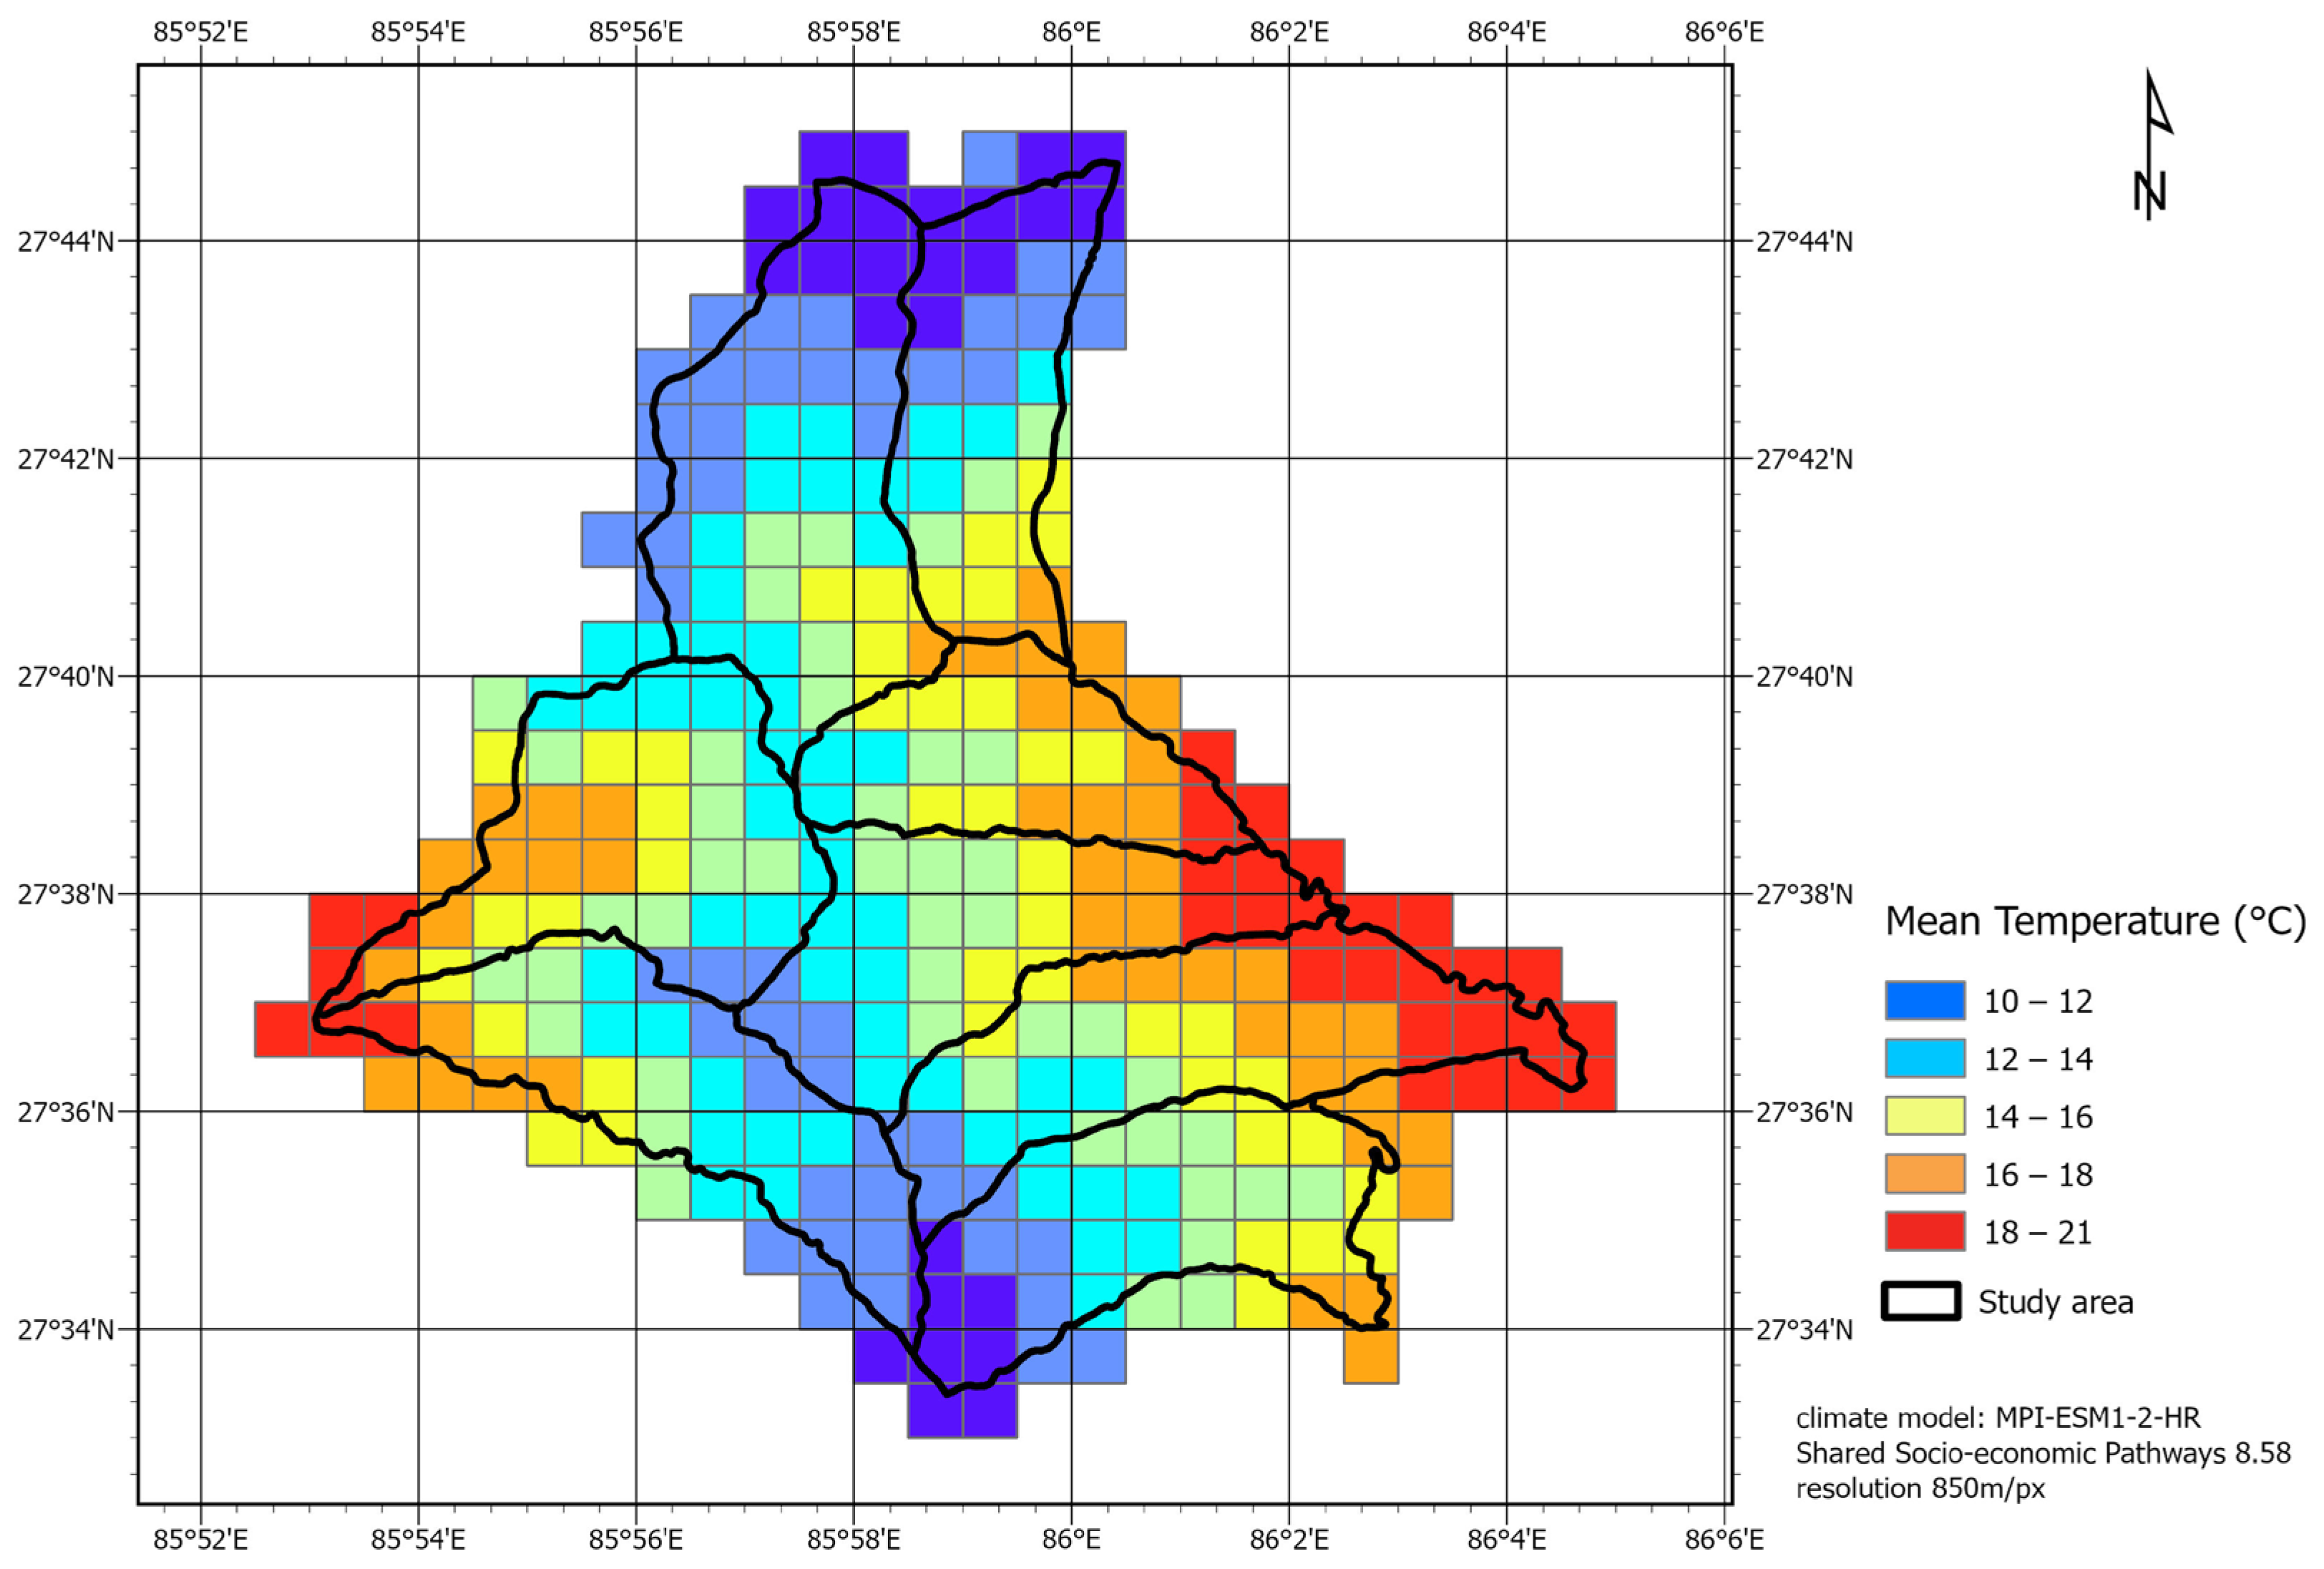
Studied crops were pre-selected using the questionnaire survey among local small-scale farmers. A household survey with 260 respondents from eight wards was carried out. The number and percentage of respondents in the household survey are given in Figure 3.
A structured questionnaire investigation was conducted in Dolakha district for the household survey during the year 2022. The actual course of the questionnaire investigation and primary data processing were carried out by RRN (Rural Reconstruction Nepal) workers, in whom local farmers, based on long-term assistance in the region, have confidence. Eight enumerators were trained to conduct the household survey. Structured questionnaires were initially developed in English and translated into the local language (Nepali). They used KOBO tools [48] for mobile data collection with a smart mobile application and spent more than two months in the field collecting information.
The questionnaire consists of a total of 77 questions divided into four main sections: Basic Information, Agricultural Traditional Tools, Agriculture Farming, and Land Abandonment. The entire questionnaire included a mix of closed, open, and semi-open (selective) questions of various types (single choice, multiple choice, dichotomous).
For our study, only some parts of this survey were used, specifically, information from 9 questions in the Basic Information section, 2 questions from the Agricultural Traditional Tools section concerning the use of pesticides and fertilizers, and 4 questions in the Agricultural Farming section informing about (i) the major type of farming (traditional vs. intensified), (ii) organic farming certification, (iii) proposed selection of suitable crops for organic/traditional farming, and (iv) observed effect of climate change. The nature of the questions used is detailed in the Supplementary Materials, Section SI.
All respondents of the questionnaire were literate, with 51% having no formal education beyond literacy. Additionally, 24% had completed primary school, 16% had attained secondary education, 7% had completed high school, and 2% held a university degree. Age groups in the farming region were represented evenly, the age of the respondents ranged from 20 to 73; the average age was 45.
The respondents were small farmers; the average number of household members was 5 and the average size of their cultivated land was 0.59 ha, ranging between 0.10 and 2.54 ha. Almost all indicated agriculture as a main source of income; the majority of them were also subsistence farmers. As a part of this questionnaire, key information about types of agriculture in their locality and the major crops grown there was given. It was challenging to indicate how many of them are organic farmers. None of them have certified organic products. Only 1.5% stated that they do not use pesticides or fertilizers at all. However, 50% of respondents indicated “traditional/organic farming” as their major type of farming. The list of crops that were chosen for modeling was obtained based on the crops proposed by respondents of the questionnaire as suitable for organic farming; to avoid misunderstandings concerning the term “organic farming”, the formulation of the question was as follows: “What are the agricultural crops that are suitable to be grown in a traditional way or without using chemical fertilizer or pesticides?”. Each crop, that was at least in one of the eight wards recommended by at least 50% of respondents as suitable was included in the list of modeled crops.

2.4. Climate Data

For predictive modeling of climate and bioclimatic parameters for the year 2050 in the Dolakha region, we used data from the WorldClim database (https://www.worldclim.org (accessed on 20 May 2022)). The data available in the database are CMIP6 downscaled future climate projections. The downscaling and calibration (bias correction) were conducted with WorldClim v2.1 as the baseline climate. The available data provide monthly values of minimum air temperature, maximum air temperature, and precipitation, and were processed for 23 global climate models (GCMs) and for four Shared Socioeconomic Pathways (SSPs). Based on inter-comparison, partial results, and a literature search, data from the GCM model MPI-ESM1-2-HR and for the SSP5-8.5 scenario, providing average data, were selected and used for the area of interest.
Data, monthly averages, were downloaded for two time periods:
  • Current condition—long-term average for the period from 1970 to 2022; data source: WorldCim 2.1/CMIP6 (http://www.worldclim.org/version2 (accessed on 20 May 2022))
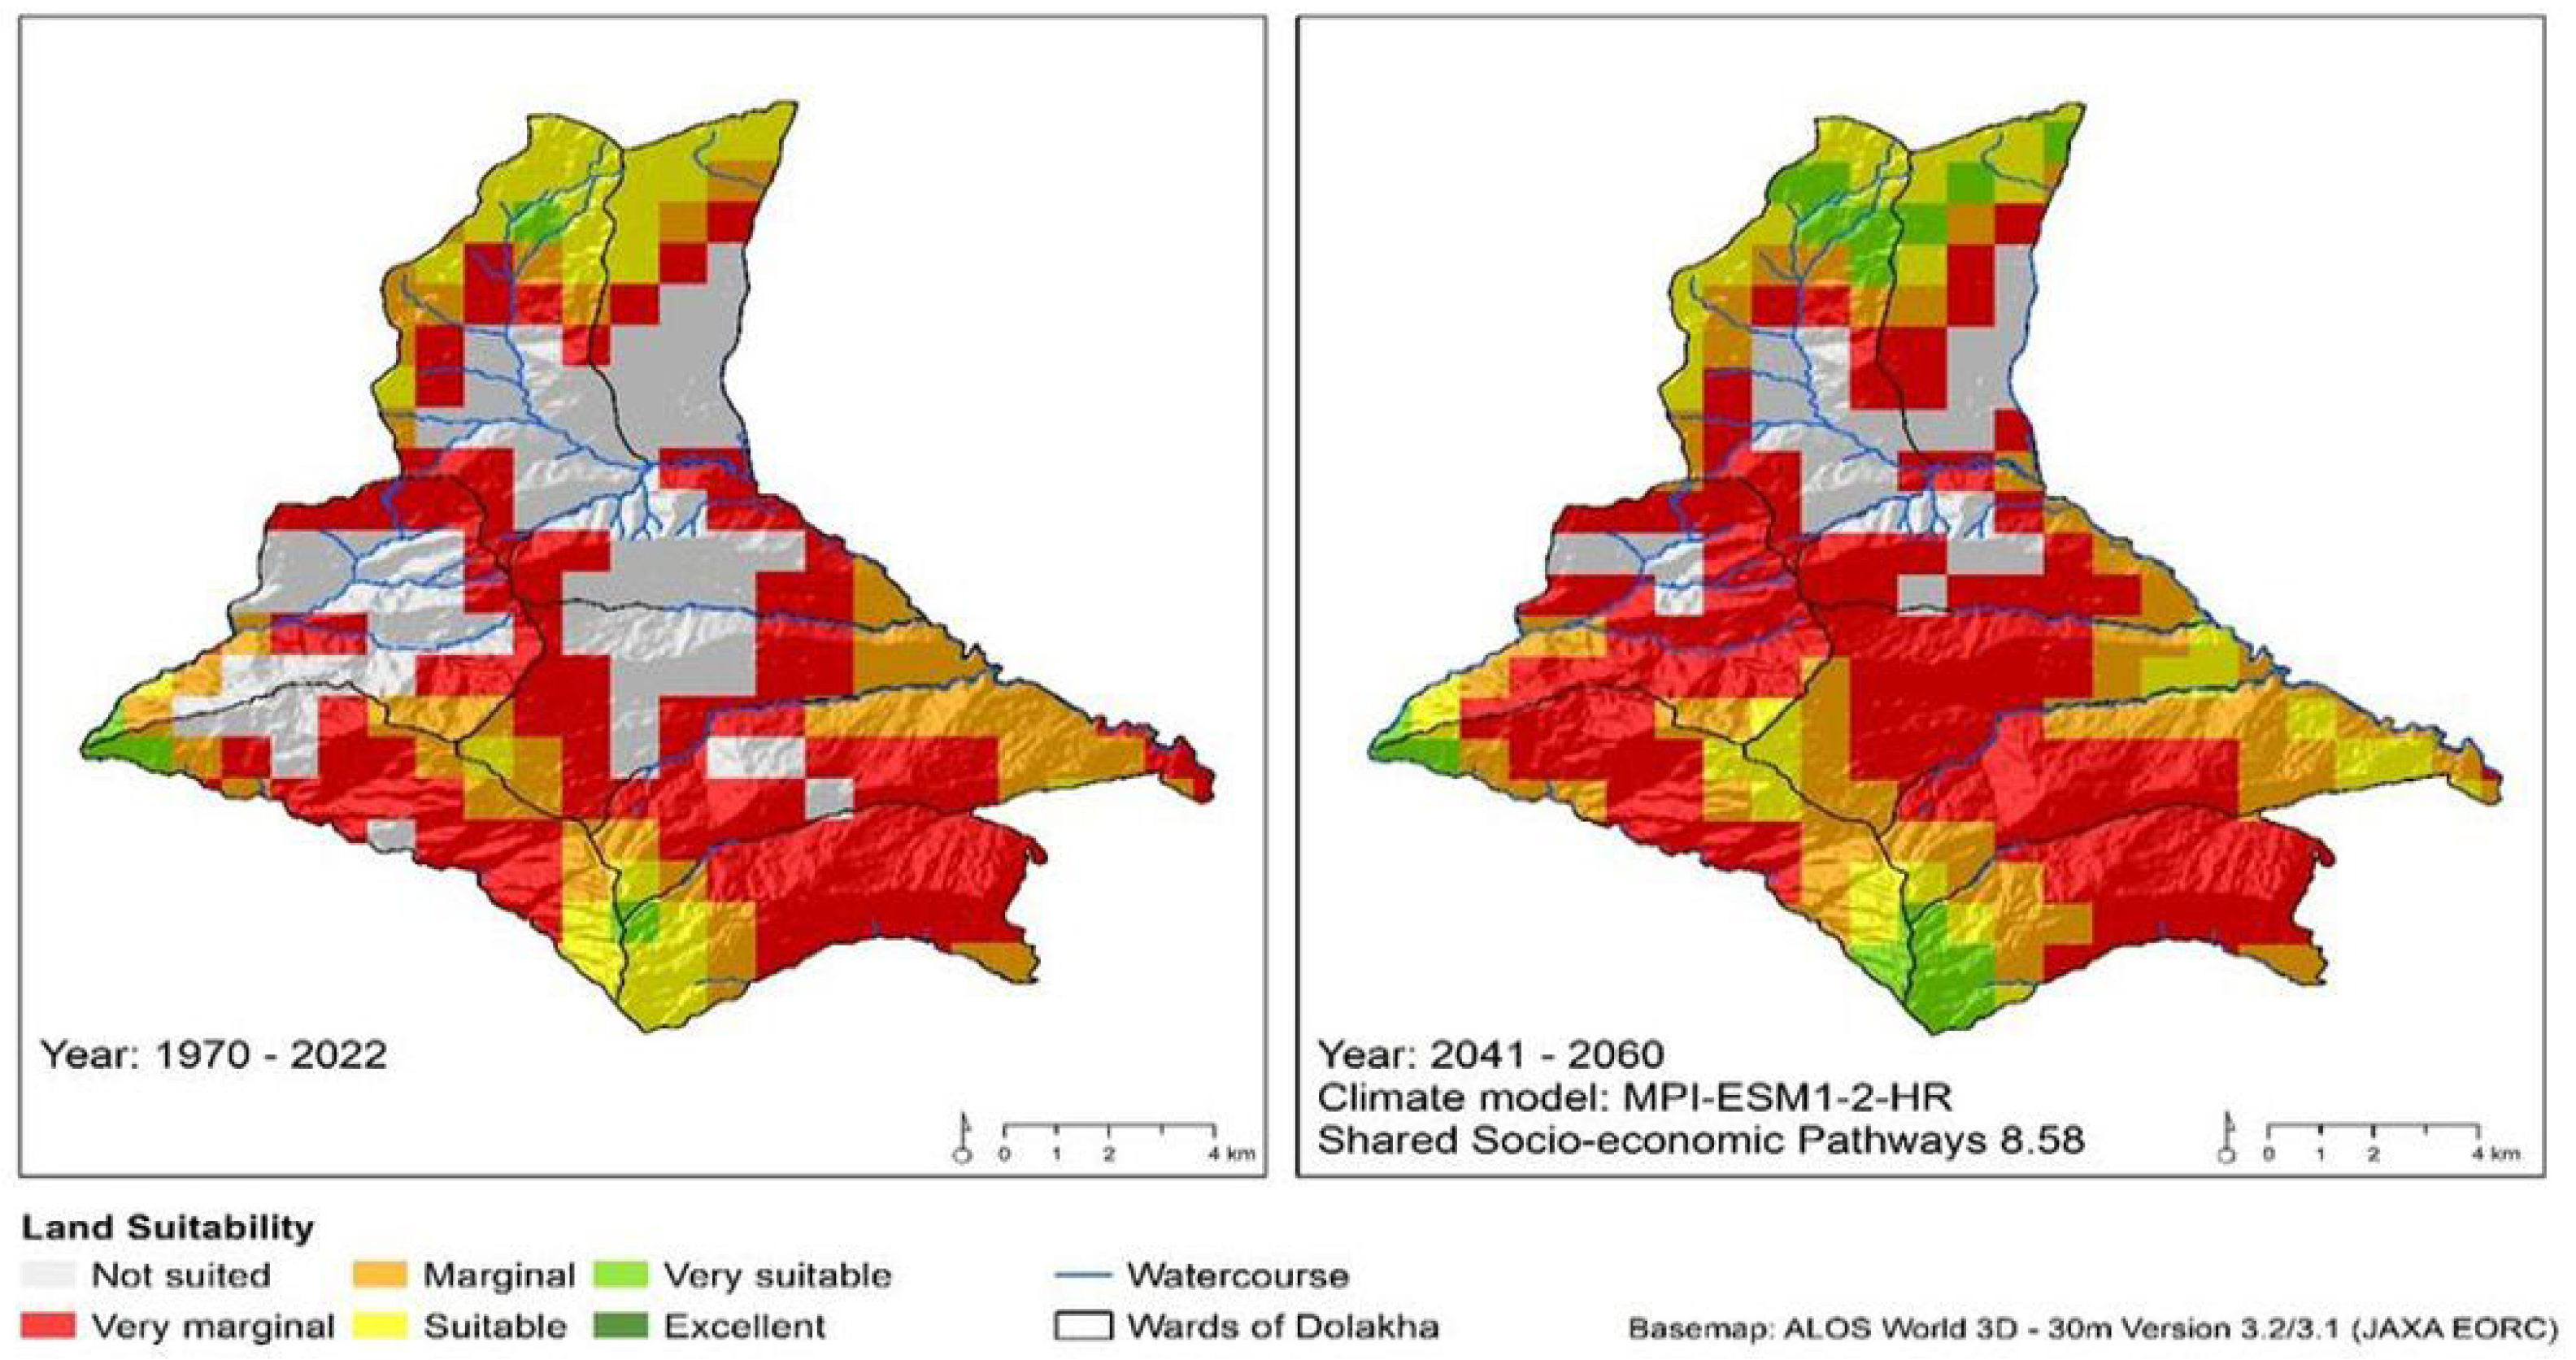
  • Future condition—prediction for the period 2041–2060; climate model MPI-ESM1-2—HR/CMIP 6, RCP (SSPS) 858
Data were processed in spatial resolutions of 30 s. Then, the downloaded files were processed into the required data structure of the DivaGIS–Bioclim model, in which the necessary files for bioclimatic modeling were created.
Niche models may be based on various sources representing either monthly averages of temperature and precipitation or bioclimatic variables, a set of 19 variables representing monthly, seasonal, quarterly, and minimal variations in precipitation and temperature required for plant growth.
The climate data must be generally in a grid. Each grid cell is a possible location for the occurrence of a species, allowing various model algorithms to easily determine, for example, the number of species or climatic conditions for a species’ growth (see Figure 4).

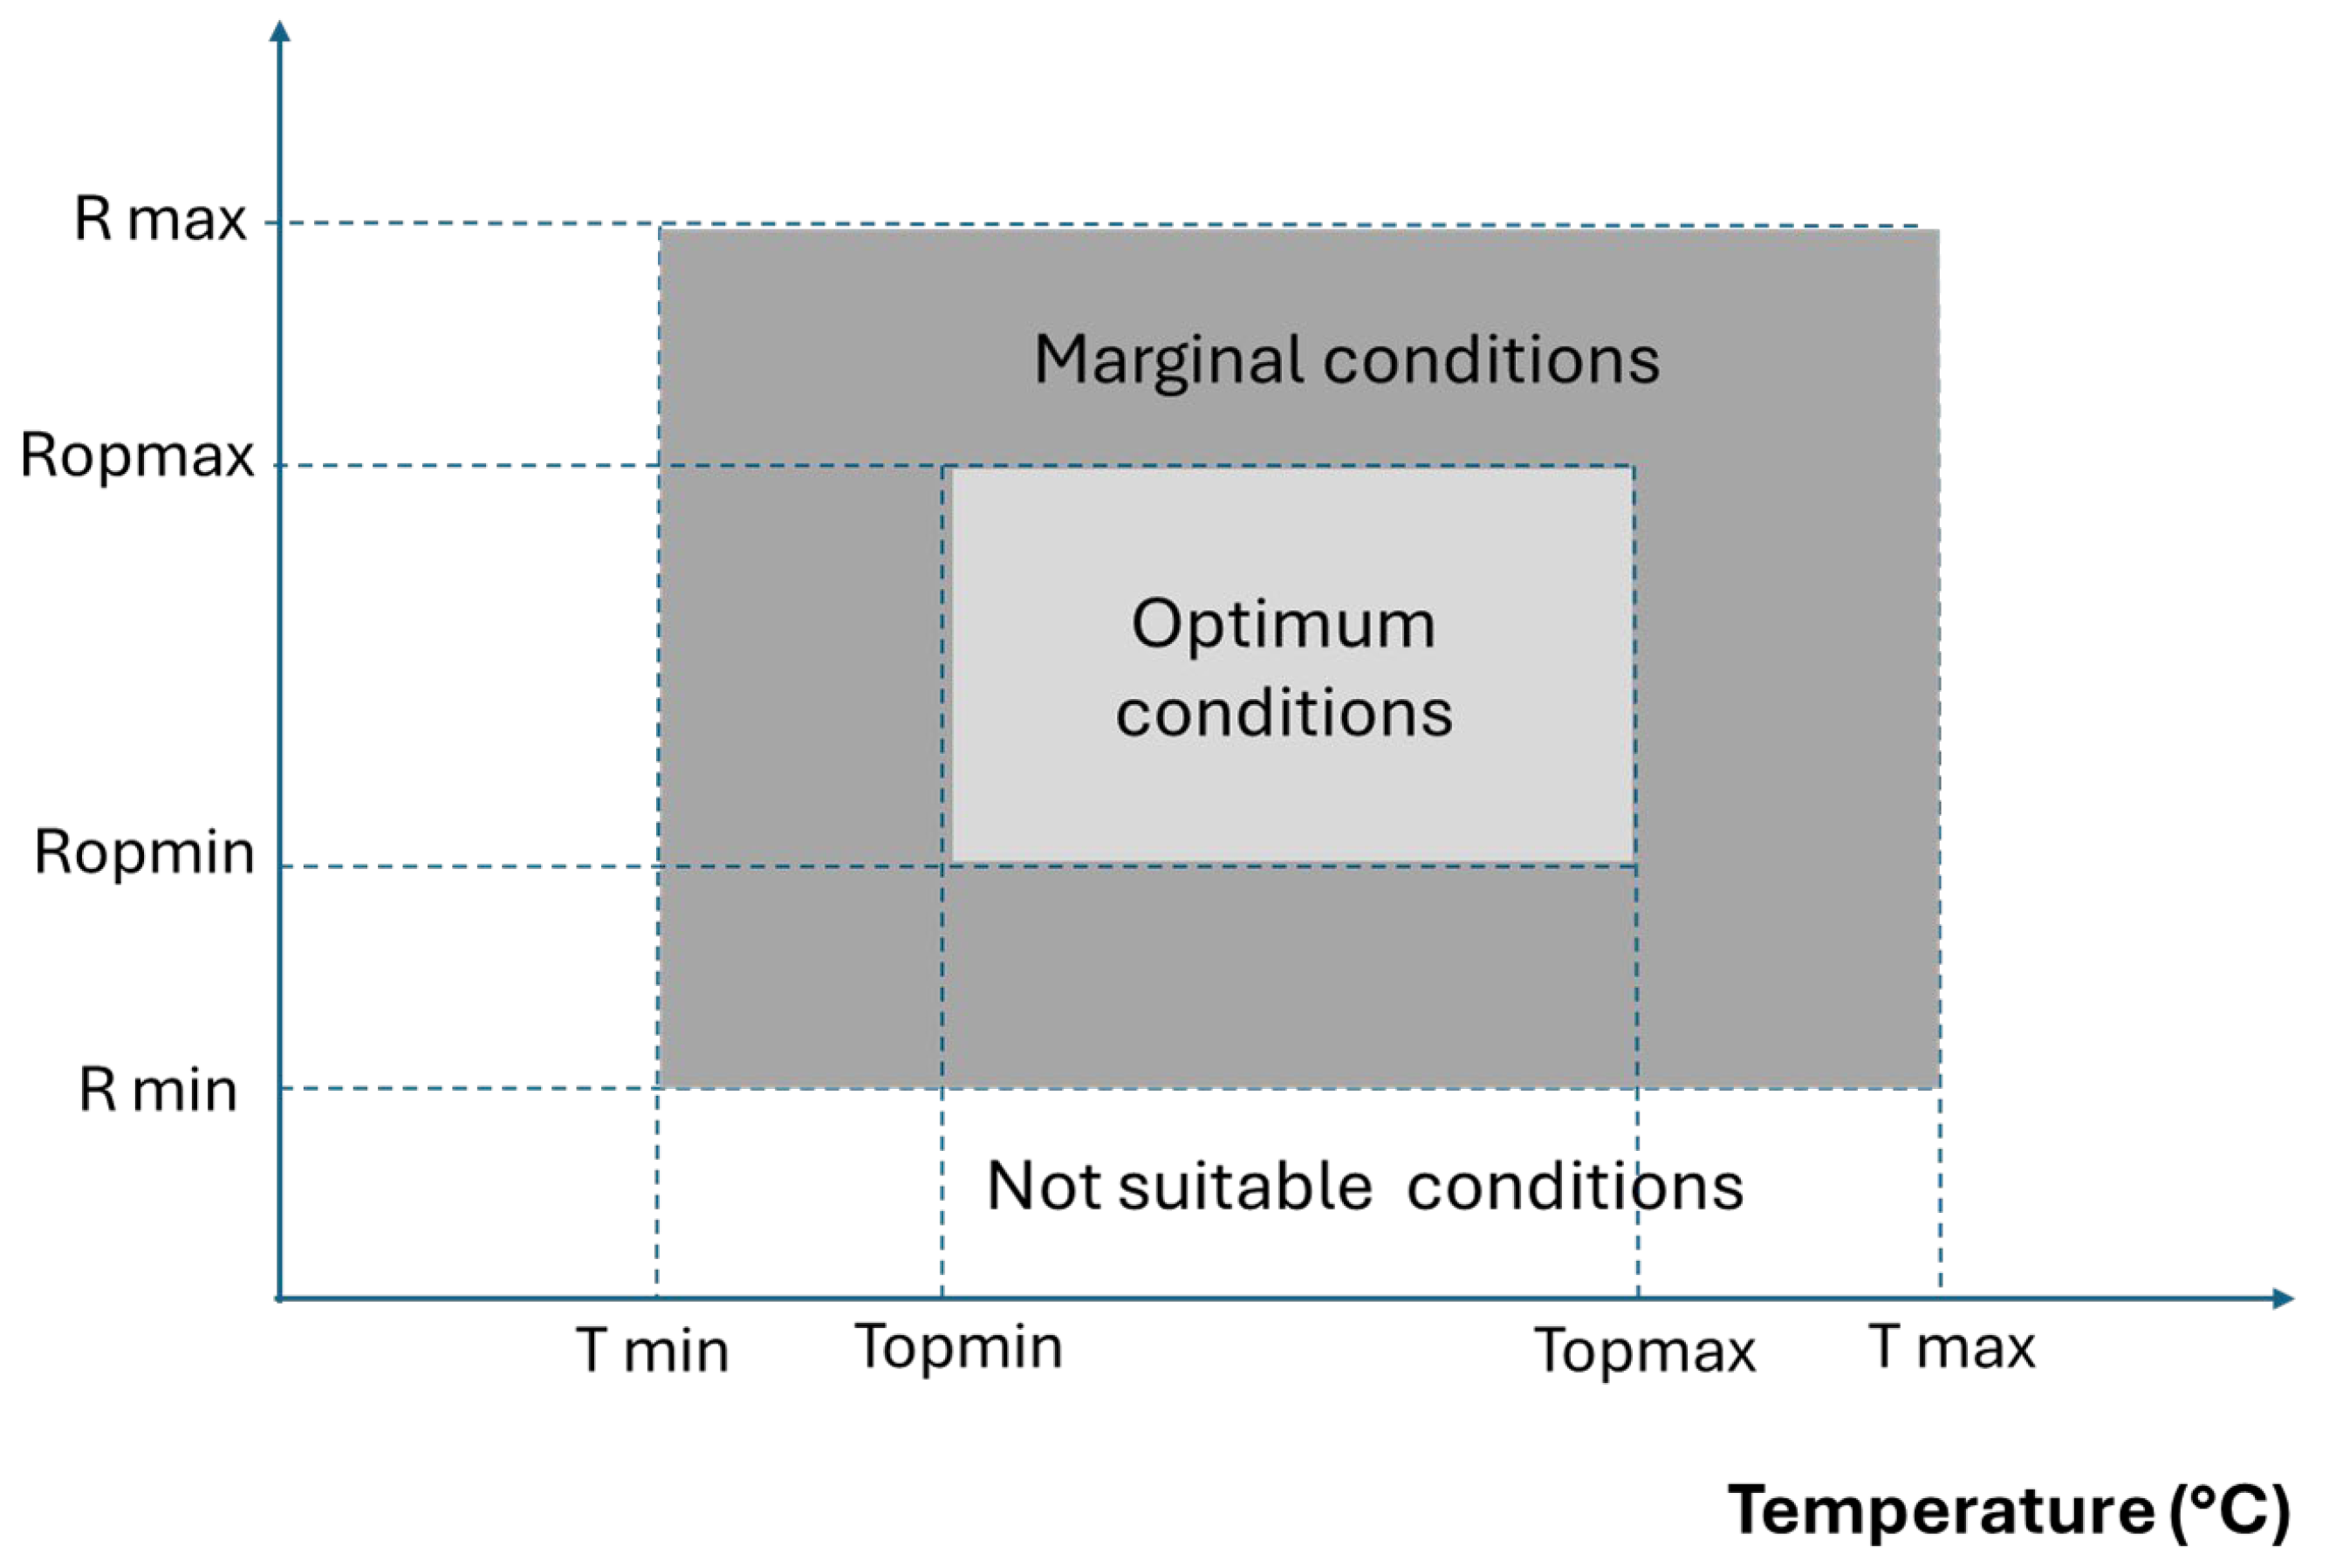
2.5. Modeling of Change in Suitability of Growth Conditions for the Selected Crops

For modeling of site suitability for various crops, the EcoCrop model was utilized, originally developed by Hijmans [47] and subsequently refined and described in more detail by Ramirez-Villegas [49]. It is a simple niche-based model that ranks suitability from 0 to 1 based on a set of crop-specific parameters that define the climate range. In EcoCrop, site-specific suitability is calculated separately for temperature and precipitation, and an overall suitability is the product of these two values. Using a given growing season duration, the model calculates temperature- and precipitation-based suitability values for 12 potential growing seasons and then selects the best growing season, i.e., the one with the highest suitability values. In each potential growing season, the temperature and precipitation suitability values are calculated according to a piecewise trapezoidal response curve.
The EcoCrop module in Diva-GIS (ver. 7.5) is linked to the EcoCrop database and utilizes the FAO database to predict and extrapolate crop suitability and adaptation in different geographical regions of the world. The prediction and map projection of the suitability condition is based on a set of precipitation and temperature conditions considering the growth of each species. The EcoCrop database is a compilation of basic biophysical and bioclimatic requirements of crops, especially temperature and precipitation, soil type, and soil pH for over 2000 species. The database is freely available and is operated and maintained by the Food and Agriculture Organization of the United Nations (FAO).
We revised these default values based on the literature search and the knowledge of local experts (via RRN) and adjusted them in the model if necessary. It was especially important to consider the subspecies of crops grown in the area.
Suitability scores depend on specified climatic ranges and length of growing season (see Figure 5). The tool uses a range of temperature and precipitation conditions that can be easily retrieved by entering the scientific or common name of an existing crop.
The main climate variables of both current and future conditions were as follows:
  • Current and future precipitation (minimum, lowest value of optimum range, highest value of optimum range, and maximum)
  • Current and future air temperatures (minimum, lowest value of optimum range, highest value of optimum range, and maximum)
  • Length of growing period (minimum length, maximum length, mean length)
It is possible to derive up to 19 bioclimatic variables, some of which are very important for species distribution and crop suitability modeling. Twelve potential growing seasons with equal chances for each season were calculated.
Model results are generally an ordinal score of suitability based on defined temperature and precipitation ranges. Prediction is calculated pixel by pixel (1 km sq) and suitability score is in range (0–100). Conditions that fall outside of these ranges are rated “0” and considered unsuitable, while the highest values are designated as most suitable [49].

2.6. Comparison with the Results of the Questionnaire Survey

Based on the bioclimatic modeling results, the three most suitable crops wereselected for each ward, specifically those with the highest proportion of the ward falling within the categories of “excellent” and “very suitable”. These crops were selected for current conditions and for future (modeled) conditions in 2050. This selection of the most suitable crops was compared with the results of the questionnaire survey. The percentage of respondents endorsing the same crop as suitable for traditional/organic farming was determined; based on this, the level of agreement/match between the results of modeling and the questionnaire was derived and divided into following categories: very high agreement/match—more than 80%; rather high agreement/match—50–80%; moderate agreement/match—20–50%; low agreement/match—less than 20%).

2.7. Statistical Analysis

The questionnaire data were exported from the KOBO application in a digital format. Further processing was carried out in the MS Excel/Microsoft 365 environment. The key information obtained from the survey was number and share of respondents (calculated (i) for individual wards and (ii) for whole study area) who selected individual crops as suitable for traditional/organic farming without use of pesticides and fertilizers. These data were further used for comparison with bio-climatic modeling results. Contingency Tables and the Statistics module—Descriptive Statistics in MS Excel were used to obtain the results.
Regarding climatic data, input data for both the current and predicted periods in the required structure and scope were obtained from the WorldClim database. Their processing and the subsequent derivation of the necessary bioclimatic variables took place in the Bioclim module, which is implemented and documented in Diva GIS 7.5 software [50]. The bioclimatic modeling itself was carried out in the EcoCrop module within the same environment. All spatial analyses and statistical processing of spatial data were completed using ArcGIS Pro 3.2, utilizing system toolboxes: Extract, Overlay, Statistics, Map Algebra, and Zonal Statistics. Detailed descriptions of individual toolboxes and their functions are available in the ArcGIS documentation [51].

3. Results

3.1. The Questionnaire Survey About Crops Grown in the Study Area

Based on the results of the household survey, the most widespread and suitable organic crops were identified. A total of 260 questionnaires were processed, and preferences were assessed while maintaining the connection to the relevant ward.
All crops, typically labeled with their local names, were assigned scientific names and then cross-referenced with the EcoCrop database. For crops not listed in the database, their requirements were sourced from relevant literature. Crops for which necessary information about their life needs could not be obtained were excluded from the modeling. The final list of selected crops for modeling is presented in Table 2.

3.2. Climate Modeling

Data downloaded from WorldClim were utilized to generate raster information for the necessary bio-climatic parameters for the study area in 2050 within a GIS environment. These parameters include Annual Mean Temperature, Annual Precipitation, Mean Temperature in the Warmest Quarter, and Precipitation of the Driest Month.
Prediction of annual mean temperature is illustrated in Figure 6. Bioclimatic parameters for current climate conditions and the predicted state in 2050 (for the area at the border of Lakuri Dada, Bhusaphedi, and Magapauwa) are listed in Table 3.

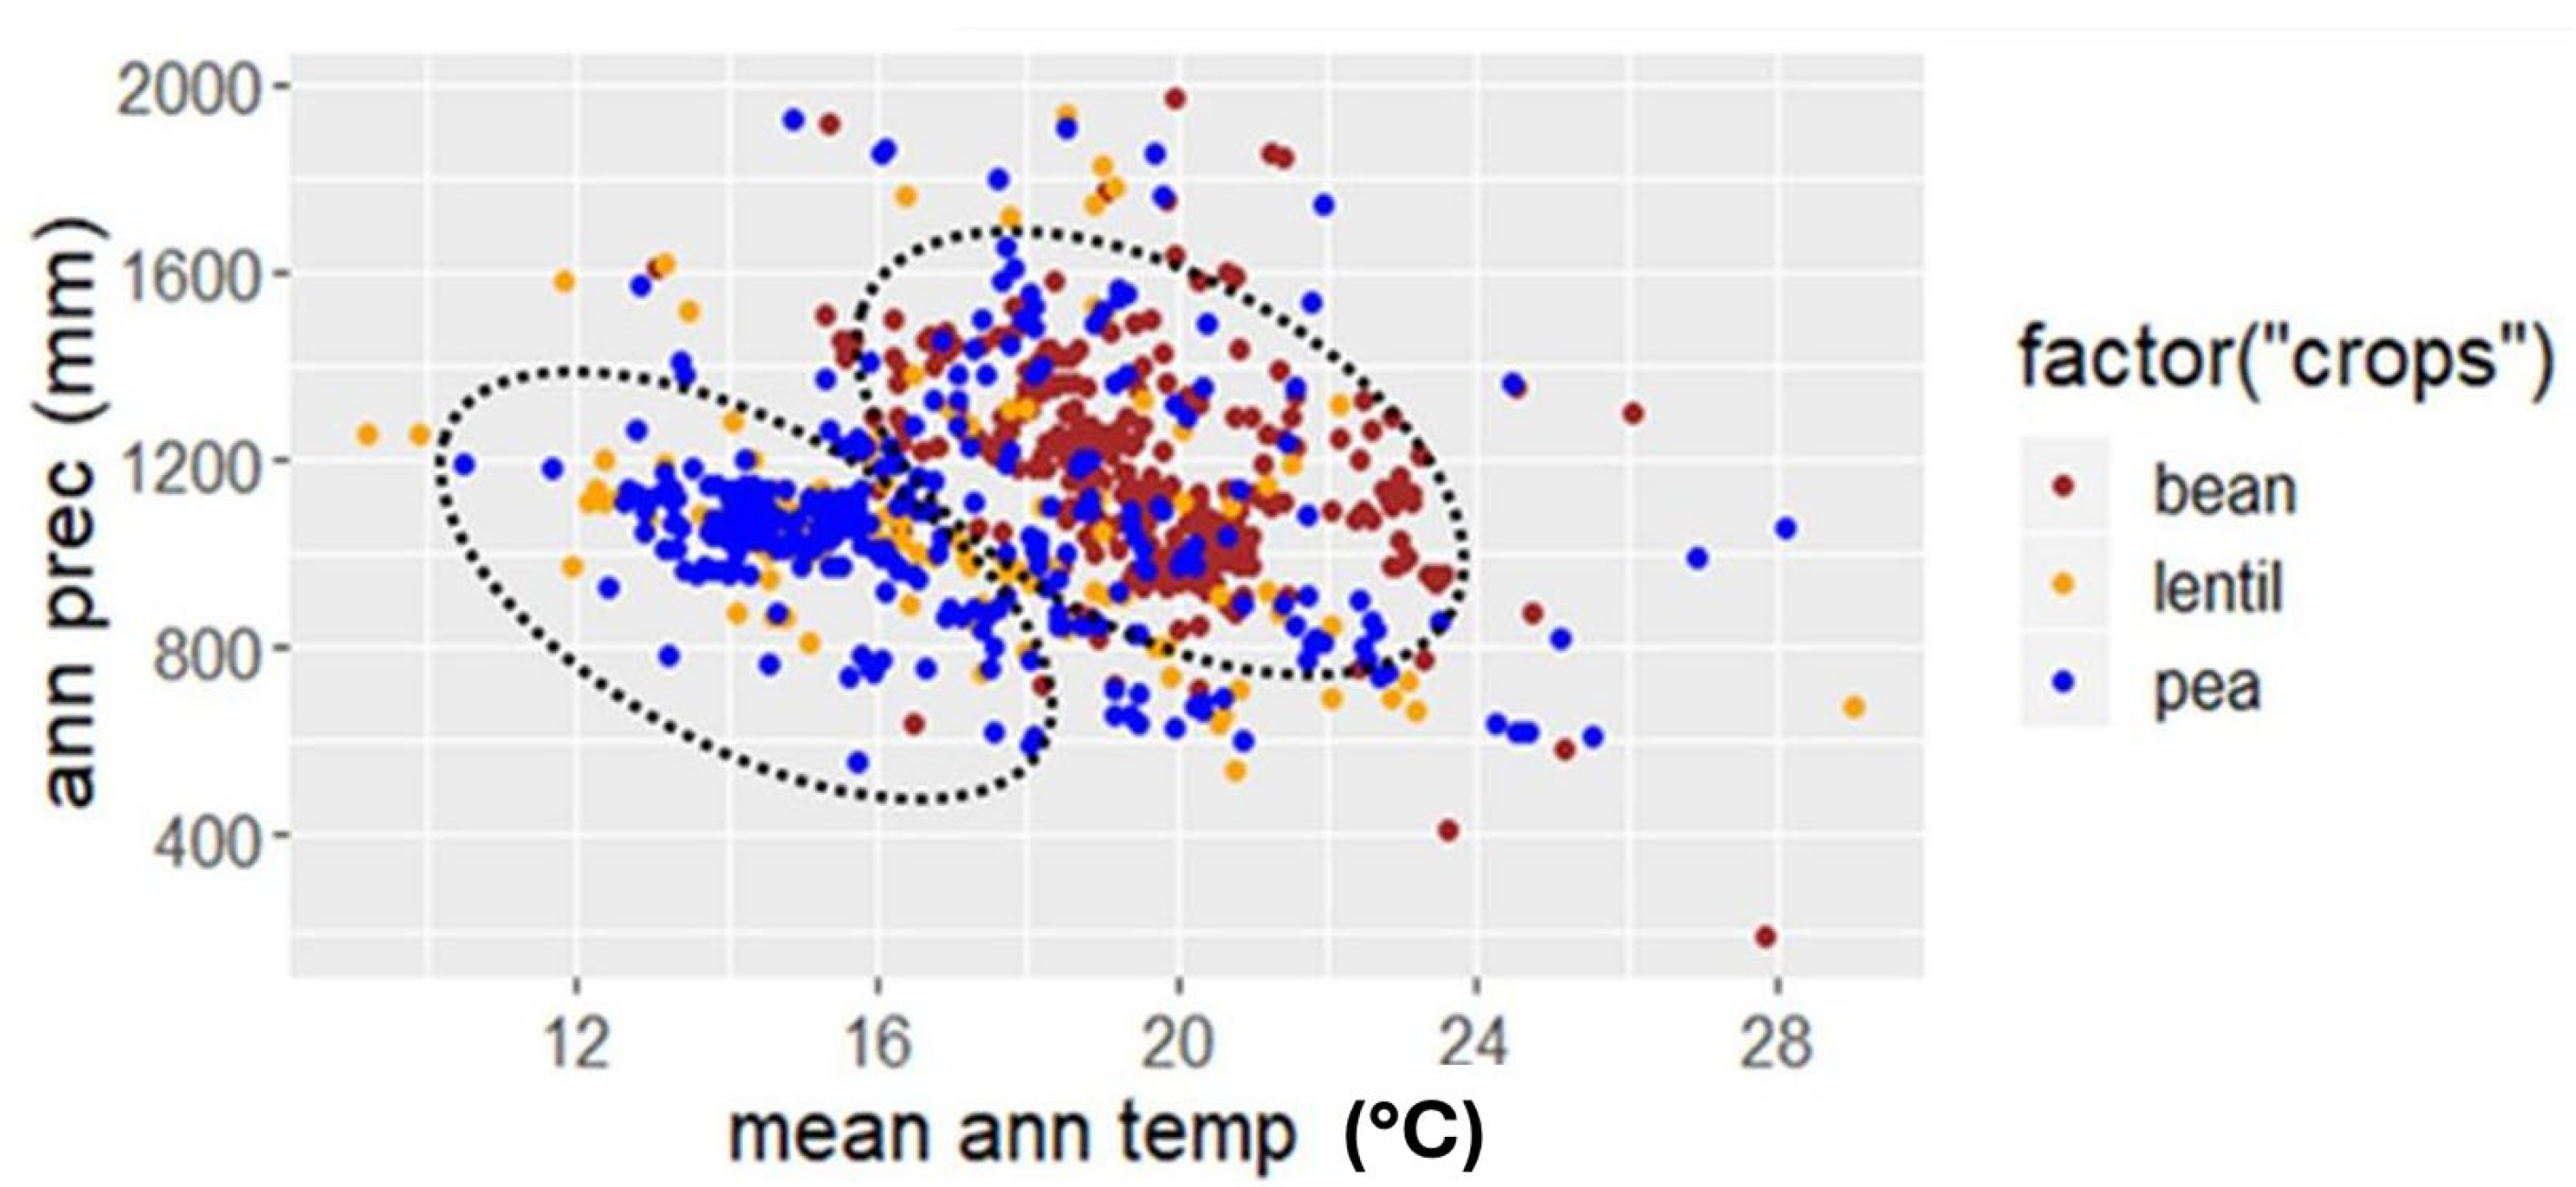
3.3. Bioclimatic Modeling

Modeling was conducted for current climate conditions and predicted conditions in 2050 for each of the 20 pre-selected crops. Conditions were evaluated separately for each ward. Basic cultivars of crops were considered in accordance with FAO databases and strategies.
The results are presented in tables, with each table corresponding to a specific ward. These tables display the area of each ward classified into one of six suitability categories (not suited, very marginal, marginal, suitable, very suitable, and excellent) for selected crops. An example of the suitability results for Bhusafedi Ward is provided in Table 4. Detailed results for all eight wards are available in the Supplementary Materials (Section SIII, Tables S5–S13).
For all wards, the suitability of the modeled climatic conditions for the majority of the modeled crops was at least slightly better in the modeled conditions in 2050; this improvement varied for different crops. The share of crops for which the future climatic conditions were modeled as better suited than the current climatic conditions ranged between 75 and 100% in individual wards, the rest of the crops (mostly cereals) had the same results for both current and future conditions. Some crops were regarded as “very marginal” or “marginal” in most wards in current conditions but in a future climate they were classified as “suitable” or “very suitable” (ginger, tree tomato, soya bean in Fasku, Katakuti, Magapauwa, and in Sailungeswor also onion). These results indicate that climate change could enhance growing conditions for many crops, particularly in mountainous regions.
Another set of results includes a map of the entire study area, showing bioclimatic modeling of land suitability for selected crops in current and modeled future climatic conditions. Figure 7 illustrates these results for one selected crop: chilies. The figures with maps for the five most suitable crops (beans, garlic, colocasia, local radish, and finger millet) and a sample of other four selected crops (two with medium suitability and two with low suitability) are shown in the Supplementary Materials, Section SII, Figures S5–S14; the rest of maps for all 20 modeled crops are available upon request. The maps clearly indicate that the most suitable areas for most of the pre-selected crops are located in the northern and southern regions of the study area.
The summary of modeled outputs for all wards is shown in Table 5. The three most suitable crops are selected out of the 20 modeled crops for each ward—those for which the highest area of the ward falls into the two best categories of suitability—excellent and very suitable.
According to the model, the most successful crops under current climate conditions were beans and colocasia, which were suitable in nearly all wards, followed by garlic, local radish, and finger millet. The same crops are predicted to be suitable also in the predicted climate in 2050, some having even better results (mainly colocasia, partly beans), while some have slightly worse result, at least in some wards (garlic, local radish) or similar (finger millet).

3.4. Comparison of Model Results with Survey of Local People/Farmers Preferences

Farmers’ views on the impact of climate change in their wards, as summarized in Figure 8, showed broad awareness of climate change across all regions. The highest recognition of climate change effects was in Dudhpokhari, Katakuti, and Shailungeswor. Over 90% of respondents in six of the eight wards identified rising temperatures as a major concern. The second most commonly reported effect was the shifting altitude of crops, closely related to temperature changes. In contrast, water resource availability was considered a less significant issue, with only a majority in three of the eight wards noting it. The highest expected impact (mainly increased temperature and shifted altitude of crop suitability) corresponds with the modeled data.
Local farmers’ preferences for suitable crops in traditional and organic farming highlighted several favorites, with garlic, mustard, buckwheat, spinach, finger millet, and colocasia being the most favored, in that order based on the share of respondents who suggested them as suitable.
Table 5 presents the three crops best suited to the bio-climatic conditions of each ward, as determined by the EcoCrop model, and compares these to the crops selected as suitable by local respondents. The alignment between the model results and the preferences of local residents and farmers varied across wards. In Katakuti, over 97% of respondents agreed with the model’s crop selection, indicating high alignment. In contrast, in Sailungeswor, the share of respondents who selected the same crops ranged between 0 and 65.4%, reaching in average 23.1%, indicating moderate alignment.
On average, 54.1% of respondents identified the same crops as those selected as best based on modeled crop suitability by the EcoCrop for current conditions, and 60.2% did match crops selected as the best based on modeled crop suitability under future conditions. Generally, most of the crops identified as “best suited” by the model were also considered suitable by local farmers. The exception was beans, which the model rated as very suitable or excellent in all eight wards. However, in most wards, except for Katakuti, where almost all farmers agreed, the preference for beans was moderate or low. Another exception was in Sailungeswor, for which Colocasia was selected by the model as a suitable crop for both current and future climatic conditions; however, none of the respondents selected this crop as suitable for organic farming (see Table 5).
Some crops chosen by local people (respondents of the questionnaire) as suitable were, according to the model results, categorized as “not suited” or “very marginal”. This was the case for buckwheat in most of the wards (except Lakuri Dada) and colocasia in Sailungeswor. Also, wheat has not very good results in the suitability model, although in some wards it was regarded as “suitable” (Lakuri Dada) or at least “marginal” (Bocha).

4. Discussion

Climate change poses a significant risk on the Nepal countryside and local people. It adds stress to soils and exacerbates existing risks to livelihoods, biodiversity, human and ecosystem health, infrastructure, and food systems [52,53], causing an urgent need for studies that support the development of organic farming and help to adjust it to the coming climatic conditions. Organic farming contributes to enhanced environmental sustainability, which is essential for long-term agricultural viability. We propose integrating it with other sustainable practices to boost productivity and resilience. A diversified approach combining organic methods with innovative technologies can help meet nutritional needs while minimizing environmental harm.
We also recognize that organic food is often more expensive, limiting accessibility. Despite this, we consider that organic farming can be economically viable in certain contexts due to reduced input costs, improved soil fertility, and higher market prices. Additionally, the growing demand for organic products offers economic opportunities for farmers.
Numerous land suitability studies have been conducted worldwide for various cash crops. Kumar et al. [40] used Frequency Ratio and Analytic Hierarchy Process (AHP) involving remote sensing (RS) and geographic information system (GIS) to identify the potential land for agriculture in the Himalayan region. Similarly, Karna [39] conducted land suitability analysis to identify the potential sites for agricultural use in Saptari district, Nepal, using AHP, Multi Criteria Evaluation (MCE), and GIS. Acharya and Yang [54] carried out suitability analysis to find good locations for vine growing based on topographic (elevation, slope, aspect), soil (soil texture, soil pH, and soil drainage), and climate variables (daily maximum and minimum temperatures, precipitation, extreme minimum winter temperature, and growing degree days). Another study of multi-criteria land suitability for agriculture in hilly areas was carried out by Zolekar and Bhagat [55], using the RS and GIS approaches. In hilly areas, physical-geographical parameters such as slope, soil depth, soil erosion, soil moisture, water-holding capacities, texture, and nutrient availability play a fundamental role in agriculture.
Previous studies primarily focused on a limited number of crops. In contrast, our study aimed to be more comprehensive, covering a wide range of crops in the Dolakha region. We modeled the suitability of 20 crops, selected based on a household survey that identified these as most suitable for organic farming.
The selection of a suitable model and the future climate scenario significantly impact the result; thus, we tried to choose the most relevant option. The CMIP6 models incorporate new RCP scenarios that adhere to various socioeconomic assumptions. These are the SSP (Shared Socioeconomic Pathways) emission scenarios, specifically SSP1-2.6, SSP2-4.5, SSP4-6.0, and SSP5-8.5 [56]. A pessimistic scenario, SSP5-8.5, was chosen due to current pessimistic projections (https://www.e-education.psu.edu/meteo469/node/145 (accessed on 22 September 2024)). In selecting models, we, along with a professional climatologist, considered available options. Based on existing sensitivity analyses [57] and the requirement for high spatial resolution, the MPI family model was chosen. It is one of the few models that offers global predictions in high resolution (HR). In terms of temperature sensitivity, it ranks among the medium-sensitive models. Based on these criteria, the MPI-ESM1-2-HR model was selected.
Specification of current climate data was derived from the climatic normal. The current standard climate normal is based on the 1981–2010 period. However, the 1961–1990 normal remains a valid reference for assessing long-term climate changes. Due to ongoing climate changes, WMO recommends recalculating climate normals for operational purposes every ten years. For the current state, we used the extended climate normal for the period 1970–2020; data have been re-analyzed by an international group of experts and are available in the global database WorldClim 2.1, which also covers the Nepal region (https://www.worldclim.org/data/worldclim21.html (accessed on 22 September 2024)) [58].
The future climate was modeled for 2050. Standardized climate normals are also implemented within the CMIP5 and CMIP6 prediction models (https://wcrp-cmip.org/cmip6/ (accessed on 22 September 2024)). In accordance with IPCC recommendations, predictions are made for the years 2030, 2050, 2070, and 2100. Each of these years is covered by a corresponding 20-year interval (e.g., for 2050, the interval is 2041–2060). The year 2050 was selected in consultation with the RRN. The year 2030 is deemed less relevant as changes are already underway, while 2070 is considered too distant for dissemination to target groups (e.g., farmers). Verified data for these periods are publicly available within the WorldClim dataset.
Although a pessimistic scenario, SSP5-8.5, was chosen, it suggested lower temperature increase (less than 1 °C) than given by Ahmed [4], listed in the introduction, who indicate 2.3–2.9 °C increase by 2050. The difference in values arises mainly from the fact that this high increment value presents average values for all of Nepal, which naturally exhibit spatial variability. In contrast, our climatic values represent data for one specific location within the study area of Dolakha (a spatial raster of values exists for the entire study area). In addition, these extreme values are based on work published in 2011 and represent data for one specific location within the study area of Dolakha (a spatial raster of values exists for the entire study area). At that time, models from the CMIP5 family were used, whereas we are now working with models and scenarios from the CMIP6 family. However, the use of a longer time period for a current climate calculation (1970–2020/2022) could also impact this result, showing lower climate change.
Plant-simulation models require a thorough knowledge of how individual crops respond to detailed soil and environmental conditions. This extensive knowledge is readily available only for most spread crops. Applying the models to lesser known and potential alternative crops that could be introduced into agricultural production systems is problematic because the specific edaphic (climate and soil) requirements are unknown. Crop models such as CERES-Maize [59] and SOYGRO [60] rely on detailed plant physiological, accurate soil, and weather data at various stages of crop development to calculate the growth and development of specific crops. Input variables include site latitude and longitude, planting date, plant density, solar radiation, daily temperature, daily precipitation, soil albedo, soil thickness, and soil water-holding capacity, as well as physiological/genetic variables that determine plant development and response to the environment. These models, in conjunction with appropriate long-term climate data, provide yield estimates for a site that can be used to evaluate the suitability of different sites for the crop.
However, having so many crops selected and given the limited information available to describe the climatic and soil conditions required for many such crops, a simple model was necessary. The model presented here incorporates crop and climate variables—such as daily maximum and minimum air temperatures, precipitation, winter minimum temperatures, and the length of the growing season—to assess the suitability of regions in the Dolakha district for 20 crops. Crop requirements were linked to the geographic distribution of climate characteristics to determine the distributional suitability of eight wards in Dolakha for each crop.
Application of the EcoCrop model to the Dolakha district demonstrates its effectiveness in evaluating numerous crops using limited climate data. Furthermore, the model can be extended to any geographic area globally with appropriate climate data. The results of the proposed bioclimatic model align with current conditions (1970–2022) and forecast scenarios (2041–2060). According to the results, the most suitable areas for the majority of pre-selected crops are located in the northern and southern parts of the study area, which are characterized by lower temperatures during the hottest month and higher precipitation during the driest month.
Our results indicate that most of the selected crops would benefit from the projected climatic conditions for 2050. The anticipated increase in temperature and extension of the growing seasons due to climate change could positively impact crop growth, especially in mountainous areas. However, it is important to note that our crop selection was influenced by farmers who might have already considered climate change in their choices because, according to our result, most of them are aware of climate change effects. Additionally, the EcoCrop model relies on a limited set of variables. Factors such as year-round precipitation distribution, or sufficient water resources, which are crucial for successful cultivation in climate change conditions, were not included, suggesting that we should be careful about considering only the positive impact of climate change on all selected crops. Therefore, more detailed physiological models would be beneficial for this analysis. Furthermore, the study did not consider potential changes in pests, diseases, and weeds due to climate change, which could affect crop viability.
The study on sustainable organic farming crops in Nepal under climate change conditions has several other limitations. It did not account for edaphic factors (soil-related parameters) or slope characteristics, which can significantly influence crop suitability and productivity. This omission may result in an overestimation of suitability in areas with poor soils or steep slopes. Additionally, the EcoCrop model relies on a limited set of variables. Factors such as year-round precipitation distribution, soil quality, or sufficient water resources, which are crucial for successful cultivation in climate change conditions, were not included, suggesting that we should be careful about considering only the positive impact of climate change on all selected crops. Therefore, more detailed physiological models would be beneficial for this analysis. The accuracy of the EcoCrop model depends on the quality of climate data and its ability to simulate crop responses to climate change, but uncertainties in climate projections and crop physiology remain. Its focus on the Dolakha district limits its applicability to other regions in Nepal. Lastly, predictions for 2050 based on current climate models may not fully capture the dynamic nature of climate change, affecting the long-term relevance of the findings. These limitations should be taken into account when applying the results to farming practices and policymaking.
We should also deal with the fact that the study area is geomorphologically very diverse, which significantly impacts the variable microclimate. These microclimatic variations are also challenging to capture when modeling a wider area characterized by average climate data. This limitation must be considered when applying the results in practice. Another important limitation to consider when using the modeling results is the wide variability of local crop varieties and their potentially different requirements. Nepal is renowned for its extraordinary agricultural crop diversity, which is among the highest in the world. The traditional farming system in Nepal has developed unique crop species and varieties, including cold-tolerant rice, naked barley, buckwheat, amaranth, beans, and minor millets such as proso millet, foxtail millet, and finger millet [43]. Many local crop varieties exhibit greater tolerance to cold or drought compared to widely grown varieties [14]. They are also highly adaptable to marginal and variable climatic conditions, possessing an above-average capacity to withstand climatic stresses [44]. In the EcoCrop model, mostly the most widely spread varieties of crops are considered in their database; thus, the real need of local varieties cannot be considered.
These limitations of the models were considered when we incorporated a survey of local farmers/households into the study to gain insight into local experiences with the success of growing individual crops. As these respondents were small-scale farmers, with half of them farming in a traditional, close to organic way on at least some part of their land, their opinions on crop suitability were taken as relevant. The results of respondents’ preferences were compared with the modeling results. It is important to note that the average alignment between model results and the household survey concerning the suitability of the best crops, as described in Section 2.4 and Section 3.4, is around 55–57%, which indicates “rather high agreement”. However, in certain instances, the results were quite contradictory. For example, some crops identified by the model as “excellent” and “very suitable” were considered suitable by only a minority of local farmers, with beans being a notable case. Several factors could explain this discrepancy: limitations in soil quality or variations in microclimatic conditions that could not be considered in the model, but also a limited tradition of growing this crop in certain wards, susceptibility of the crop to pests and diseases, or low commercial attractiveness due to challenging harvesting processes or low market prices. In some cases, the opposite situation also emerged; a crop was identified by the model as “not suitable” yet was considered suitable by local farmers. This result can be explained by the high diversity of local crop varieties, which are well-adapted to local climate variations compared to widely cultivated varieties for which the ecological requirements are defined in EcoCrop database. Additionally, preferences could be influenced by the commercial attractiveness of certain species, even if the actual growing conditions are not optimal.
This study provides information at the local level that could be used by farmers in selecting their cropland. By incorporating climate change projections and modeling crop suitability for the predicted climate in 2050, it enables more informed crop choices and enhances the region’s adaptability to climate change. However, the earlier described limitations of the model should be carefully considered. The results are also valuable to other researchers for various applications.
Digital data (modeling outputs) for all crops are available on request from the study authors. It is essential to note that this study considered current land use/land cover, current climate conditions, and predicted climate conditions for 2050, providing preliminary results. Future studies are recommended to include a broader range of factors such as topography, soil properties, irrigation facilities, and socioeconomic considerations influencing sustainable land use. The report of FAO [61] emphasizes the challenges in assessing the success likelihood of organic farming, suggesting the need to consider various aspects and requiring experience with the organic farming concept.

5. Conclusions

Given Nepal’s agricultural vulnerability to degradation and climate change, adopting organic farming and selecting resilient crops is essential for sustainable food production. This study utilized climatic and bio-climatic modeling to identify suitable crops for organic farming across eight wards in Dolakha district, Nepal.
The results suggest that in the mountainous regions of Dolakha, future climatic conditions in 2050, expressed by higher temperatures and extended growing seasons, could improve the viability of the selected crops; most of the crops are associated with increased suitability area in future climatic conditions. However, it is important to recognize that not all climate change-related factors are captured by the EcoCrop model used in this study. This result may also reflect the pre-selection of crops deemed promising for organic farming by local farmers, whose choices may evolve as climatic conditions change.
The model highlighted the northern and southern parts of the study area as the most suitable for the majority of pre-selected crops, characterized by lower temperatures during the hottest months and higher precipitation during the driest months.
The modeling results were compared with the preferences of local farmers. The EcoCrop model identified beans, local radish, garlic, colocasia, and finger millet as the most suitable crops for the majority of the district’s wards. While most model-selected crops were also favored by farmers, exceptions included beans which were less preferred by local farmers in most areas. In summary, 54.1% of respondents identified crops that aligned with model predictions for current conditions, and 60.2% for future conditions.
These findings, supplemented by detailed results presented in the Supplementary Materials—including maps and tables that illustrate the locations of suitability categories for individual crops—are valuable for local farmers, planners, and local authorities. They support the promotion and implementation of successful organic farming by guiding the selection of appropriate crops. The results help identify crops that are currently suitable and those that may thrive under future climate conditions, aiding regional adaptation to climate change. While these findings provide a useful framework for crop selection, maintaining a diverse range of crops is also crucial to enhance resilience against climate change. Additionally, these results offer a valuable reference for other researchers. Future studies should aim to incorporate a broader range of factors to improve the accuracy and precision of the modeling.

Supplementary Materials

The following supporting information can be downloaded at: https://www.mdpi.com/article/10.3390/land13101610/s1, Figure S1: Projected annual precipitation in 2050 in study areas in Dolakha district; Figure S2: Mean temperature of warmest quarter in 2050 in study areas in Dolakha District; Figure S3: Projected precipitation of driest month in 2050 in study area in Dolakha District, Nepal; Figure S4: Projected annual temperate in 8 selected wards, Dolakha District in 2050; Figures S5–S14: Results of bioclimatic modelling of land suitability for cultivation—maps covering all 8 wards showing distribution of suitability categories for individual selected crops (a sample of maps for 5 most successful crops and selection of 2 medium-successful crops and 2 unsuccessful crops, sorted by suitability for cultivation. Maps for all 20 crops are available upon request); Table S1: Projected annual precipitation in 2050, areas of individual categories of precipitation referring to Figure S1; Table S2: Mean temperature of warmest quarter in 2050, areas of individual categories of temperature range referring to Figure S2; Table S3: Projected precipitation of driest month in 2050, area of individual categories of precipitation range referring to Figure S3; Table S4: Projected annual temperate in 2050, area of individual categories of mean temperature range referring to figure S4; Tables S5–S13: Modelling of suitability of 20 selected crops in 8 wards showing area of the ward (km2) belonging to individual categories of land suitability for actual climatic conditions (left part) and prediction of future climatic conditions in 2050 (right part).

Author Contributions

Conceptualization, V.P. and P.C.; methodology, V.P. and P.C.; software, V.P.; formal analysis, R.K., C.K. and M.P.; investigation, R.K. and C.K.; resources, V.P. and C.K.; data curation, V.P. and J.J.; writing—original draft preparation M.P.; writing—review and editing, V.P. and P.C.; visualization, V.P.; supervision, P.C.; project administration, J.J. and C.K.; funding acquisition, C.K. All authors have read and agreed to the published version of the manuscript.

Funding

This study was carried out within the project “Smallholders Empowerment by Enterpreneurship in (Agriculture) Development in Dolakha, Nepal (SEED) continuation, N-NPL-2019-0331.

Data Availability Statement

The data will be available on request.

Acknowledgments

The authors would like to especially thank Ratna Karki and other staff members for all their support and significant help in obtaining the necessary data and organizing the questionnaire survey in Dolakha district, Nepal.

Conflicts of Interest

The authors declare no conflicts of interest.

References

  1. Malla, G. Climate Change and Its Impact on Nepalese Agriculture. J. Agric. Environ. 2008, 9, 62–71. [Google Scholar] [CrossRef]
  2. Eriksson, M. The Changing Himalayas: Impact of Climate Change on Water Resources and Livelihoods in the Greater Himalayas; International Centre for Integrated Mountain Development (ICIMOD): Kathmandu, Nepal, 2009; ISBN 978-92-9115-111-0. [Google Scholar]
  3. Sharma, M.; Dahal, S. Assessment of Climate Change Impacts Local Adaptation Measures in the Livelihoods of Indigenous Community in the Hills of Sankhuwasabha District, Nepal. In Understanding Climate Change Impact in Nepal: Some Case Studies; Nepal Climate Change Knowledge Management Center, Nepal Academy of Science and Technology: Khumaltar/Lalitpur, Nepal, 2011. [Google Scholar]
  4. Ahmed, M. Assessing the Costs of Climate Change and Adaptation in South Asia; Asian Development Bank: Mandaluyong, Philippines, 2014. [Google Scholar]
  5. Guo, X.; Tian, L. Spatial Patterns and Possible Mechanisms of Precipitation Changes in Recent Decades over and around the Tibetan Plateau in the Context of Intense Warming and Weakening Winds. Clim. Dyn. 2022, 59, 2081–2102. [Google Scholar] [CrossRef]
  6. Garnaut, R. Removing Climate Change as a Barrier to Economic Progress. Econ. Analysis Policy 2013, 43, 31–47. [Google Scholar] [CrossRef]
  7. Nelson, G.C.; Shively, G.E. Modeling Climate Change and Agriculture: An Introduction to the Special Issue. Agric. Econ. 2014, 45, 1–2. [Google Scholar] [CrossRef]
  8. Pokhrel, D.M.; Thapa, G.B. Are Marketing Intermediaries Exploiting Mountain Farmers in Nepal? A Study Based on Market Price, Marketing Margin and Income Distribution Analyses. Agric. Syst. 2007, 94, 151–164. [Google Scholar] [CrossRef]
  9. Bandara, J.S.; Cai, Y. The Impact of Climate Change on Food Crop Productivity, Food Prices and Food Security in South Asia. Econ. Anal. Policy 2014, 44, 451–465. [Google Scholar] [CrossRef]
  10. Shrestha, D.P.; Zinck, J.A.; Van Ranst, E. Modelling Land Degradation in the Nepalese Himalaya. Catena 2004, 57, 135–156. [Google Scholar] [CrossRef]
  11. Dahal, K.R. Climate Change and Organic Agriculture in Nepal: A Review. Nepal. J. Agric. Sci. 2012, 10, 138–152. [Google Scholar]
  12. Chalise, D.; Kumar, L.; Kristiansen, P. Land Degradation by Soil Erosion in Nepal: A Review. Soil Syst. 2019, 3, 12. [Google Scholar] [CrossRef]
  13. Thapa, P. Spatial Estimation of Soil Erosion Using RUSLE Modeling: A Case Study of Dolakha District, Nepal. Environ. Syst. Res. 2020, 9, 15. [Google Scholar] [CrossRef]
  14. Magar, D.B.T.; Bal, K.J. Factors Influencing Cultivation and Promotion of Traditional Crops in the Mountains: A Case of Jumla District, Nepal. Tradit. Crop Biodivers. Mt. Food Nutr. Secur. Nepal 2020, 125-137, 125–137. [Google Scholar]
  15. Atreya, K.; Subedi, B.P.; Ghimire, P.L.; Khanal, S.C.; Pandit, S. A Review on History of Organic Farming in the Current Changing Context in Nepal. Arch. Agric. Environ. Sci. 2020, 5, 406–418. [Google Scholar] [CrossRef]
  16. Gafsi, M.; Favreau, J.L. Appropriate Method to Assess the Sustainability of Organic Farming Systems. In Proceedings of the 9th European IFSA Symposium, Vienna, Austria, 4–7 July 2010. [Google Scholar]
  17. Niggli, U.; Schmid, H.; Fliessbach, A. Organic Farming and Climate Change; International Trade Centre (ITC): Geneva, Switzerland, 2008. [Google Scholar]
  18. Moudry, J.; Moudry, J. Environmental Aspects Of Organic Farming. In Organic Agriculture Towards Sustainability; Pilipavicius, V., Ed.; InTech: London, UK, 2014; ISBN 978-953-51-1340-9. [Google Scholar]
  19. Manna, M.C.; Rahman, M.M.; Naidu, R.; Bari, A.S.M.F.; Singh, A.B.; Thakur, J.K.; Ghosh, A.; Patra, A.K.; Chaudhari, S.K.; Subbarao, A. Organic Farming: A Prospect for Food, Environment and Livelihood Security in Indian Agriculture. In Advances in Agronomy; Elsevier: Amsterdam, The Netherlands, 2021; Volume 170, pp. 101–153. ISBN 978-0-12-824591-0. [Google Scholar]
  20. Mäder, P.; Berner, A. Development of Reduced Tillage Systems in Organic Farming in Europe. Renew. Agric. Food Syst. 2012, 27, 7–11. [Google Scholar] [CrossRef]
  21. Stolze, M.; Piorr, A.; Häring, A.M.; Dabbert, S. (Eds.) The Environmental Impacts of Organic Farming in Europe; Organic Farming in Europe Economics and Policy; Universität Hohenheim, Institut für Landwirtschaftl Betriebslehre: Stuttgart/Hohenheim, Germany, 2000; ISBN 978-3-933403-05-6. [Google Scholar]
  22. Van Mansvelt, J.D.; Stobbelaar, D.J.; Hendriks, K. Comparison of Landscape Features in Organic and Conventional Farming Systems. Landsc. Urban Plan. 1998, 41, 209–227. [Google Scholar] [CrossRef]
  23. Seufert, V.; Ramankutty, N.; Foley, J.A. Comparing the Yields of Organic and Conventional Agriculture. Nature 2012, 485, 229–232. [Google Scholar] [CrossRef] [PubMed]
  24. Ho, M.; Ching, L.L. Mitigating Climate Change through Organic Agriculture and Localized Food Systems, ISIS Report 31/1/08 2008. Available online: http://www.i-sis.org.uk/mitigatingClimateChange.php (accessed on 5 August 2023).
  25. Pokhrel, D.M.; Pant, K.P. Perspectives of Organic Agriculture and Policy Concerns in Nepal. J. Agric. Environ. 2009, 10, 103–115. [Google Scholar] [CrossRef]
  26. Acharya, A.; Ghimire, P.; Wagle, A. An Overview of Organic Farming in Nepal. Sustain. Food Agric. 2020, 1, 109–112. [Google Scholar] [CrossRef]
  27. Atreya, K. Probabilistic Assessment of Acute Health Symptoms Related to Pesticide Use under Intensified Nepalese Agriculture. Int. J. Environ. Health Res. 2008, 18, 187–208. [Google Scholar] [CrossRef]
  28. Parajuli, S.; Shrestha, J.; Ghimire, S. Organic Farming in Nepal: A Viable Option for Food Security and Agricultural Sustainability. Arch. Agric. Environ. Sci. 2020, 5, 223–230. [Google Scholar] [CrossRef]
  29. Atreya, K.; Subedi, B.P.; Ghimire, P.L.; Khanal, S.C.; Charmakar, S.; Adhikari, R. Agroforestry for Mountain Development: Prospects, Challenges and Ways Forward in Nepal. Arch. Agric. Environ. Sci. 2021, 6, 87–99. [Google Scholar] [CrossRef]
  30. The Tenth Plan, National Planning Commission (NPC), Government of Nepal 2003. Available online: https://npc.gov.np/images/category/10th_eng.pdf (accessed on 9 September 2024).
  31. Willer, H.; Lernoud, J. (Eds.) The World of Organic Agriculture; Research Institute of Organic Agriculture (FiBL): Frick, Switzerland; IFOMA-Organics International: Bonn, Germany, 2019. [Google Scholar]
  32. Burlakoti, R.R.; Lynch, D.; Halde, C.; Beach, T.; Dahal, S.; Debnath, S.C. Organic Agriculture Project in Nepal: An International Twinning Partnership Program Initiative. Can. J. Plant Sci. 2012, 92, 997–1003. [Google Scholar] [CrossRef]
  33. Borron, S. Building Resilience for an Unpredictable Future: How Organic Agriculture Can Help Farmers Adapt to Climate Change; Food and Agriculture Organization of the United Nations: Rome, Italy, 2006. [Google Scholar]
  34. Gauchan, D.; Palikhey, E.; Sthapit, S.; Joshi, B.K.; Manandhar, H.K.; Jarvis, D.I. Organic Farming and Marketing of Traditional Crops in Nepal Mountains: Gaps, Issues and Opportunities for Improvement. In Traditional Crop Biodiversity for Mountain Food and Nutrition Security in Nepal; 2020; NAGRC: Entebbe, Uganda; pp. 163–173. [Google Scholar]
  35. Halder, B.; Bandyopadhyay, J.; Banik, P. Assessment of Hospital Sites’ Suitability by Spatial Information Technologies Using AHP and GIS-Based Multi-Criteria Approach of Rajpur–Sonarpur Municipality. Model. Earth Syst. Environ. 2020, 6, 2581–2596. [Google Scholar] [CrossRef]
  36. Aksha, S.K.; Resler, L.M.; Juran, L.; Carstensen, L.W. A Geospatial Analysis of Multi-Hazard Risk in Dharan, Nepal. Geomat. Nat. Hazards Risk 2020, 11, 88–111. [Google Scholar] [CrossRef]
  37. Anaya Romero, M.; Pino Mejías, R.; Moreira Madueno, J.M.; Munoz Rojas, M.; de la Rosa, D. Analysis of Soil Capability versus Land Use Change by Using CORINE Land Cover and MicroLEIS. Int. Agrophysics 2011, 25, 395–398. [Google Scholar]
  38. Daccache, A.; Keay, C.; Jones, R.J.A.; Weatherhead, E.K.; Stalham, M.A.; Knox, J.W. Climate Change and Land Suitability for Potato Production in England and Wales: Impacts and Adaptation. J. Agric. Sci. 2012, 150, 161–177. [Google Scholar] [CrossRef]
  39. Karna, B.K.; Shobha, S.; Hriday, L.K. Land Suitability Analysis for Potential Agriculture Land Use in Sambhunath Municipality, Saptari, Nepal. Geogr. Base 2021, 8, 13–30. [Google Scholar] [CrossRef]
  40. Kumar, A.; Pramanik, M.; Chaudhary, S.; Negi, M.S. Land Evaluation for Sustainable Development of Himalayan Agriculture Using RS-GIS in Conjunction with Analytic Hierarchy Process and Frequency Ratio. J. Saudi Soc. Agric. Sci. 2021, 20, 1–17. [Google Scholar] [CrossRef]
  41. Joshi, B.K.; Gorkhali, N.A.; Pradhan, N.; Ghimire, K.H.; Gotame, T.P.; Kc, P.; Mainali, R.P.; Karkee, A.; Paneru, R.B. Agrobiodiversity and Its Conservation in Nepal. J. Nepal Agric. Res. Counc. 2020, 6, 14–33. [Google Scholar] [CrossRef]
  42. Hawkes, J.G.; Damania, A.B.; Valkoun, J.; Willcox, G.; Qualset, C.O. Back to Vavilov: Why Were Plants Domesticated in Some Areas and Not in Others? International Center for Agricultural Research in the Dry Areas: Aleppo, Syria, 1998. [Google Scholar]
  43. UNEP; GEF. Integrating Traditional Crop Genetic Diversity into Technology: Using a Biodiversity Portfolio Approach to Buffer against Unpredictable Environmental Change in Nepal Himalayas; United Nation Environment Program (UNEP): Nairobi, Kenya; Global Environment Facility (GEF): Washington, DC, USA; Bioversity International: Kathmandu, Nepal, 2013. [Google Scholar]
  44. Jarvis, D.I.; Hodgkin, T.; Brown, A.H.; Tuxil, J.D.; Noriega, I.; Smale, M.; Sthapit, B. Crop Genetic Diversity in the Field and on the Farm: Principles and Applications in Research Practices; Yale University Press: New Haven, CT, USA, 2016. [Google Scholar]
  45. CBS. Statistical Pocket Book of Nepal. Available online: https://cbs.gov.np/wp-content/upLoads/2022/01/Nepal-Statistical-Pocket-Book-2020.pdf (accessed on 18 May 2024).
  46. NPC. Nepal Human Development Report (2014); Beyond Geography, Unlocking Human Potential; Government of Nepal: Kathmandu, Nepal, 2014. [Google Scholar]
  47. Hijmans, R.J.; Guarino, L.; Cruz, M.; Rojas, E. Computer Tools for Spatial Analysis of Plant Genetic Resources Data: 1. DIVA-GIS. Plant Genet. Resour. Newsl. 2001, 1, 15–19. [Google Scholar]
  48. Pham, P.; Vinck, P. KOBO Toolbox. Available online: https://www.kobotoolbox.org/ (accessed on 22 September 2024).
  49. Ramirez-Villegas, J.; Jarvis, A.; Läderach, P. Empirical Approaches for Assessing Impacts of Climate Change on Agriculture: The EcoCrop Model and a Case Study with Grain Sorghum. Agric. For. Meteorol. 2013, 170, 67–78. [Google Scholar] [CrossRef]
  50. Hijmans, R.J.; Jarvis, A.; Guarino, L. Diva-GIS Exercise 2-Modeling the Distribution of Wild Peanuts (Arachis Spp.). Manual. 2005. Available online: https://herbarium.millersville.edu/471/DIVA-GIS5_manual.pdf (accessed on 22 September 2024).
  51. Esri. ArcGIS Pro Help 2024; Esri: Redlands, CA, USA, 2024; Available online: https://pro.arcgis.com/en/pro-app/latest/help/main/welcome-to-the-arcgis-pro-app-help.htm (accessed on 22 September 2024).
  52. Faure, M.G.; Peeters, M. (Eds.) Climate Change Liability; New Horizons in Environmental and Energy Law; Edward Elgar: Cheltenham, UK, 2011; ISBN 978-1-84980-286-4. [Google Scholar]
  53. Sujakhu, N.M.; Ranjitkar, S.; He, J.; Schmidt-Vogt, D.; Su, Y.; Xu, J. Assessing the Livelihood Vulnerability of Rural Indigenous Households to Climate Changes in Central Nepal, Himalaya. Sustainability 2019, 11, 2977. [Google Scholar] [CrossRef]
  54. Acharya, T.D.; Yang, I.T. Vineyard Suitability Analysis of Nepal. Int. J. Environ. Sci. 2015, 6, 13–19. [Google Scholar]
  55. Zolekar, R.B.; Bhagat, V.S. Multi-Criteria Land Suitability Analysis for Agriculture in Hilly Zone: Remote Sensing and GIS Approach. Comput. Electron. Agric. 2015, 118, 300–321. [Google Scholar] [CrossRef]
  56. Douglas, H.C.; Harrington, L.J.; Joshi, M.; Hawkins, E.; Revell, L.E.; Frame, D.J. Changes to Population-Based Emergence of Climate Change from CMIP5 to CMIP6. Environ. Res. Lett. 2023, 18, 014013. [Google Scholar] [CrossRef]
  57. Eyring, V.; Bony, S.; Meehl, G.A.; Senior, C.A.; Stevens, B.; Stouffer, R.J.; Taylor, K.E. Overview of the Coupled Model Intercomparison Project Phase 6 (CMIP6) Experimental Design and Organization. Geosci. Model Dev. 2016, 9, 1937–1958. [Google Scholar] [CrossRef]
  58. Fick, S.E.; Hijmans, R.J. WorldClim 2: New 1km Spatial Resolution Climate Surfaces for Global Land Areas. Int. J. Climatol. 2017, 37, 4302–4315. [Google Scholar] [CrossRef]
  59. Jones, C.A.; Kiniry, J.R.; Dyke, P. CERES-A Simulation Model of Growth and Development; Texas A & M University Press: College Station, TX, USA, 1986. [Google Scholar]
  60. Wilkerson, G.G.; Jones, J.W.; Boote, K.J.; Ingram, K.T.; Mishoe, J.W. Modeling Soybean Growth for Crop Management. Trans. ASAE 1983, 26, 0063–0073. [Google Scholar] [CrossRef]
  61. FAO. The State of Food Insecurity in the World 2010; Addressing Food Insecurity in Protracted Crises; FAO: Rome, Italy, 2010. [Google Scholar]
Figure 1. Area of interest in the Dolakha district.
Land 13 01610 g001
Figure 2. Scheme of the research concept.
Land 13 01610 g002
Figure 3. Number and percentage of respondents in household survey in 2022.
Land 13 01610 g003
Figure 4. Crop climate niche—example of processing results for three selected species.
Land 13 01610 g004
Figure 5. EcoCrop model; suitability score depends on specified climatic ranges and length of growing season (Rmin—minimal precipitation; Ropmin—lowest value of precipitation optimum range; Ropmax—highest value of precipitation optimum range; Rmax—maximal precipitation; Tmin—minimal temperature; Topmin –lowest value of the temperature optimum range; Topmax—highest value of temperature optimum range; Tmax—maximal temperature).
Land 13 01610 g005
Figure 6. Projected annual temperate in 8 selected wards, Dolakha District in 2050.
Land 13 01610 g006
Figure 7. Bioclimatic model of land suitability for cultivation of chilies (Capsicum frutescens L.) in the study area including all 8 wards.
Land 13 01610 g007
Figure 8. Impact of climate change in individual wards of Dolakha region, results of the questionnaire survey.
Land 13 01610 g008
Table 1. Land use/land cover in the study area.
Category of Land Use/Land CoverArea (%)Area (km2)
Farmland12.5121.79
Forest52.6691.7
Grasslands and Meadows1.212.1
Orchard00.004
Quarry0.150.26
Residential/buildings3.195.56
Scrub2.995.2
Other/not classified (a mix of scattered greenery and bare soil)27.2947.53
Sum100174.144
Table 2. Selected crops for modeling (based on the questionnaire survey).
Scientific Name Used in EcoCropCrop NameCrop Type
Brassica nigraMustardOil seeds
Zea mays L. s. MaysMaizeCereals
Hordeum vulgare L.BarleyCereals
Eleusine coracana (L.) GaertnMillets (finger millet) (kodo)Cereals
Fagopyrum esculentum MoenchBuckwheatCereals
Triticum aestivumWheatCereals
Brassica oleracea L.v capi.CabbageVegetables
Brassica oleracea L.v botr.CauliflowerVegetables
Spinacia oleracea L.Spinach (broadleaf)Vegetables
Allium cepaOnionVegetables
Raphanus sativus L. (C.R.)Local radish (rato mula)Vegetables
Cyphomandra betacea (Cav.)Tree tomatoVegetables
Solanum tuberosumPotatoTubers
Dioscorea bulbiferaYamTubers
Colocasia affinisColocasiaTubers
Capsicum frutescensChiliesSpices
Allium sativumGarlicSpices
Zingiber officinalisGingerSpices
Phaseolus vulgaris L.BeansLeguminous crops
Glycine max (L.) MerrillSoyabeanLeguminous crops
Table 3. Bioclimatic parameters for actual climate normal (1970–2022) and the predicted state in 2050 (for the area at the border of Lakuri Dada, Bhusaphedi, and Magapauwa).
Bioclimatic VariablesActual Climate NormalPrediction for 2050
BIO1 = Annual Mean Temperature15.716.6
BIO2 = Mean Monthly Range1110.5
BIO3 = Isothermality (BIO2/BIO7) (×100)47.750
BIO4 = Temperature Seasonality (standard deviation × 100)429413.9
BIO5 = Max Temperature of Warmest Month2425
BIO6 = Min Temperature of Coldest Month24
BIO7 = Temperature Annual Range (BIO5-BIO6)2221
BIO8 = Mean Temperature of Wettest Quarter19.620.5
BIO9 = Mean Temperature of Driest Quarter1011.5
BIO10 = Mean Temperature of Warmest Quarter19.820.7
BIO11 = Mean Temperature of Coldest Quarter9.310.8
BIO12 = Annual Precipitation20502031
BIO13 = Precipitation of Wettest Month553553
BIO14 = Precipitation of Driest Month109
BIO15 = Precipitation Seasonality (Coefficient of Variation)115.2114.6
BIO16 = Precipitation of Wettest Quarter13801337
BIO17 = Precipitation of Driest Quarter3633
BIO18 = Precipitation of Warmest Quarter13801329
BIO19 = Precipitation of Coldest Quarter4339
Table 4. Modeling of suitability of 20 selected crops (area of the ward belonging to individual categories of land suitability) for actual climatic conditions and prediction of future climatic conditions in 2050. Ward Bhusaphedi. The three categories that indicate suitable areas for growing, areas suitable, very suitable or excellent, are highlighted by the colors beige, light green, and dark green, respectively.
NameScientific NameArea of the Ward (km2) Belonging into the Individual Category of SuitabilityArea of the Ward (km2) Belonging into the Individual CATEGORY of Suitability
Actual Climatic ConditionsPredicted Climatic Conditions for 2050
Oil Seeds<Not Suited>Very MarginalMarginalSuitableVery SuitableExcellent<Not Suited>Very MarginalMarginalSuitableVery SuitableExcellent
MustardBrassica nigra---22.5921.559----20.1693.9180.063
Cereals crops
MaizeZea mays subsp. Mays23.5700.2730.308---22.9870.8560.308---
Finger milletEleusine coracana----23.8430.308----23.5700.580
BuckwheatFagopyrum esculentum24.151-----24.151-----
WheatTriticum Aestivum24.151-----24.151-----
BarleyHordeum vulgare12.78610.7840.581---3.16919.8181.164---
Spices
ChiliesCapsicum frutescens12.0108.1593.4010.2730.308-3.16915.8043.6191.2510.308-
GarlicAllium Sativum---3.16920.4010.581----21.8712.280
GingerZingiber officinalis23.019975--1.131--12.52816--11.3150.308-
Tubers/Blub Crops
ColocasiaColocasia affinisesculenta v. Ant. ---0.00013.28710.863----1.52322.628
PotatoSolanum tuberosum13.54510.0250.581---3.16920.4010.581---
YamDioscorea alata, Dioscorea bulbifera L. 23.020---0.5500.58114.297---2.8646.990
Vegetables
Local radish (rato mula)Raphanus sativus L. ---8.61414.9570.581----23.5700.581
Spinach—broad leafSpinacia oleracea23.8430.308----23.8430.308----
OnionAllium cepa L. v. Cepa --20.1693.982-----14.3059.2650.581
CabbageBrassica oleracea var. Capitata --20.1693.982----19.9644.187--
CauliflowerBrassica oleracea var. Botrytis 20.1693.6740.308---19.1634.4070.580---
Tree TomatoCyphomandra betacea (Cav.) 20.8922.6790.581---4.6788.8607.3542.9510.308-
Leguminous crops
BeansPhaseolus vulgaris-----24.151-----24.151
SoyabeanGlycine max23.5700.273-0.308--22.5920.9790.2720.2450.063-
Table 5. Summary of the suitability modeling results according to the EcoCrop model (selection of three best suited crops for each ward in current and future climatic conditions) and the level of their suitability according to the questionnaire survey findings.
WardArea of Agricultural Land (km2)Actual SuitabilitySuitability According RespondentsPrediction of Future SuitabilitySuitability According Respondents
CropExcellentVery SuitableShare of Respondents from Selected Ward Indicating This Crop as Suitable for Organic Farming (%)CropExcellentVery SuitableShare of Respondents from Selected Ward Indicating This Crop as Suitable for Organic Farming (%)
Area (km2)% from Agricultural LandArea (km2)% from Agricultural Land Area (km2)% from Agricultural Land Area (km2)% from Agricultural Land
Bhusaphedi24.15Beans24.15100.000.000.0018.10Beans24.15100.000.000.0018.10
Colocasia10.8644.9813.2955.0268.20Colocasia22.6393.691.526.3168.20
Finger millet0.311.2823.8498.7272.73Garlic2.289.4421.8790.5663.40
Bocha17.92Beans13.5575.632.0211.2931.10Beans14.3880.243.5419.7631.10
Local radish4.4524.817.2640.5247.50Local radish5.2129.058.0044.6347.50
Colocasia4.0422.556.9438.7191.80Colocasia8.2746.156.1134.0991.80
Dudhpokhari21.46Beans21.0297.930.442.077.10Beans21.4199.740.060.267.10
Colocasia5.9027.4712.8059.63100.00Colocasia13.3762.287.8036.36100.00
Local radish1.898.8018.6086.6621.40Garlic5.5625.8915.9174.1196.40
Fasku24.27Beans24.1599.490.000.0034.60Beans24.1599.490.000.0034.60
Local radish0.120.5124.1599.4953.80Garlic5.1021.0319.1778.9780.77
Garlic1.877.7022.4092.3080.77Yam13.7256.511.707.0165.38
Katakuti21.77Beans21.77100.000.000.0097.60Beans21.77100.000.000.0097.60
Colocasia10.5248.3310.6748.9895.20Colocasia17.8381.873.9518.1395.20
Garlic0.582.6721.0796.7997.62Garlic3.7517.2218.0282.7897.62
LakuriDada27.69Beans22.8082.343.5012.6433.30Beans24.7489.352.9510.6533.30
Local radish6.2622.6112.7145.8971.43Colocasia13.8049.8510.9339.4947.62
Finger millet0.000.0024.0186.7147.60Garlic4.4816.1923.2083.8195.24
Magapauwa15.66Beans15.66100.000.000.0052.90Beans15.66100.000.000.0052.90
Colocasia11.4072.804.2627.2097.10Colocasia15.66100.000.000.0097.10
Finger millet0.000.0015.66100.0071.40Yam9.5160.690.000.0135.29
Sailungeswor21.24Beans18.1485.403.1014.603.80Beans0.572.7020.6797.303.80
Local radish3.1014.6018.1485.4065.40Colocasia13.1461.856.9232.600.00
Colocasia6.2229.2610.9051.340.00Garlic17.9484.473.3015.5384.62
Disclaimer/Publisher’s Note: The statements, opinions and data contained in all publications are solely those of the individual author(s) and contributor(s) and not of MDPI and/or the editor(s). MDPI and/or the editor(s) disclaim responsibility for any injury to people or property resulting from any ideas, methods, instructions or products referred to in the content.

