Article

Dynamics of the Interaction between Freeze–Thaw Process and Surface Energy Budget on the Permafrost Region of the Qinghai-Tibet Plateau

1
School of Geographic Science and Tourism, Nanyang Normal University, Nanyang 473061, China
2
Cryosphere Research Station on the Qinghai-Tibet Plateau, Key Laboratory of Cryospheric Science and Frozen Soil Engineering, Northwest Institute of Eco-Environment and Resources, Chinese Academy of Sciences, Lanzhou 730000, China
*
Author to whom correspondence should be addressed.
Land 2024, 13(10), 1609; https://doi.org/10.3390/land13101609
Submission received: 2 September 2024 / Revised: 29 September 2024 / Accepted: 1 October 2024 / Published: 3 October 2024
(This article belongs to the Special Issue Impact of Climate Change on Land and Water Systems)

Abstract

:
Exploring the complex relationship between the freeze–thaw cycle and the surface energy budget (SEB) is crucial for deepening our comprehension of climate change. Drawing upon extensive field monitoring data of the Qinghai-Tibet Plateau, this study examines how surface energy accumulation influences the thawing depth. Combined with Community Land Model 5.0 (CLM5.0), a sensitivity test was designed to explore the interplay between the freeze–thaw cycle and the SEB. It is found that the freeze–thaw cycle process significantly alters the distribution of surface energy fluxes, intensifying energy exchange between the surface and atmosphere during phase transitions. In particular, an increase of 65.6% is observed in the ground heat flux during the freezing phase, which subsequently influences the sensible and latent heat fluxes. However, it should be noted that CLM5.0 has limitations in capturing the minor changes in soil moisture content and thermal conductivity during localized freezing events, resulting in an imprecise representation of the complex freeze–thaw dynamics in cold regions. Nevertheless, these results offer valuable insights and suggestions for improving the parameterization schemes of land surface models, enhancing the accuracy and applicability of remote sensing applications and climate research.

1. Introduction

The freeze–thaw process, which is characterized by phase transitions of soil moisture driven by temperature fluctuations, is an important feature of the active layer (AL) in permafrost regions [1]. These transitions involve the absorption and release of heat, leading to significant variations in thermal conductivity and heat capacity that strongly influence near-surface thermodynamic and hydraulic properties. In turn, these changes affect hydrological processes, the surface albedo, surface energy budget (SEB), ecosystems, and ultimately climate change [2,3,4,5].
Studies have found that the freeze–thaw process enhances the exchange of energy between the surface and the atmosphere, significantly impacting latent heat flux [6]. Guo et al. [7] simulated the SEB process at BJ station using the SHAW model and concluded that the daily freeze–thaw process of the land surface affects the variation of surface energy fluxes, and this impact is more significant during the freezing period. Additionally, freeze–thaw processes also affect the spatiotemporal variability of soil moisture and thermal conditions [8]. The phase transitions of water in this process also influence soil moisture transport and SEB, further affecting atmospheric circulation and thus regional and global climate change [8,9]. Freeze–thaw processes also have a certain impact on surface snow processes and the growth cycle of vegetation [10]. In summary, freeze–thaw processes affect land-atmosphere interaction in energy and water cycles by changing soil moisture content, soil thermal regime, surface albedo, and soil evaporation, thereby influencing atmospheric circulation and having an impact on regional climate [11]. At the same time, changes in regional climate also influence freeze–thaw processes [12,13]. It can be seen that freeze–thaw processes in permafrost regions and regional climate change are mutually coupled. Studying the interaction between freeze–thaw processes and surface energy-water exchange can promote a better understanding of their impact on climate change [14,15].
In permafrost regions, near-surface meteorological elements and surface energy fluxes undergo significant diurnal variations [16]. The freeze–thaw process constitutes the most fundamental dynamic in the AL of permafrost, with the fluctuation in the ice-to-unfrozen water ratio during freeze–thaw cycles profoundly affecting soil water and heat characteristics. Consequently, the freeze–thaw process exerts a significant influence on energy-water processes and surface non-adiabatic heating, rendering them a pivotal research focus on the exploration of land surface processes and climate change [17]. In particular, the freezing of water and release of heat in autumn and winter, and the melting of ice and absorbance of heat in spring and summer reduce the annual soil temperature range, meaning that the AL has variable thermal and water resistance in the process of land-atmosphere heat exchange [18,19]. Numerous investigations have revealed that under different freeze–thaw conditions, there are notable differences in the surface-atmosphere hydroclimatic interactions [20,21]. Besides, energy-water exchanges between the land surface and atmosphere also affect the freeze–thaw cycle process in the AL [9,22], leading to abnormal non-adiabatic heating of the land surface and subsequent changes in atmospheric circulation. The interaction and feedback between permafrost, the ecological environment, and human activity are thus crucial targets of global climate change research.
The Qinghai-Tibet Plateau (QTP), a representative region of the high-altitude cryosphere in the Northern Hemisphere, is known to respond strongly and sensitively to climate change [23,24]. Over the past four decades since 1980, the QTP has witnessed a pronounced rise in near-surface air temperature, averaging between 0.40 °C and 0.52 °C per decade. This rate far surpasses the global mean warming trend of 0.19 °C per decade [25]. Notably, the warming trend in winter is particularly significant, reaching 0.66 °C per decade, approximately double the rate observed in summer [26,27]. As a consequence, permafrost temperatures have risen, the active layer thickness (ALT) has increased, and the overall area of permafrost has decreased [28,29,30], signifying varying degrees of permafrost degradation [31]. The degradation of permafrost has profoundly transformed near-surface energy exchange dynamics and energy-water interactions between the ground and the atmosphere. This transformation has triggered the release of greenhouse gasses into the atmosphere. Studies have shown that, for every 0.04 ppm increase in carbon dioxide content in the atmosphere, the temperature rises by approximately 0.012 °C [32], creating a feedback loop that amplifies global warming trends [33,34]. With the continuous warming of the QTP, precipitation has been showing an increasing trend, as indicated by research from Zhang et al. [35]. Meanwhile, human activities in the region have also intensified, as noted by Liu et al. [36], further influencing the hydrothermic conditions of the AL. The latest field observation data also suggest that the ALT along the Qinghai-Tibet Highway has been increasing at a rate of 2.84 cm yr−1 from 1981 to 2021 [29,37]. In addition, since 2004, the soil moisture content at the bottom of the AL has been increasing, while changes in the shallow layer have been minimal or slightly decreased, as monitored by Zhao et al. [38]. These alterations in hydrothermic conditions not only affect the freeze–thaw process but also significantly impact the patterns of seasonal variability in SEB and the overall ecological environment in cold regions, as emphasized by Ma et al. [9]. Therefore, accurately grasping the changes in SEB and freeze–thaw conditions is crucial for understanding and responding to climate change.
This study primarily endeavors to do the following: (1) explore the interaction between the freeze–thaw cycle and the SEB; and (2) investigate how the accumulation of radiation flux influences the thawing depth. The structure of the manuscript is outlined as follows: In Section 2, a comprehensive depiction of the study area and the data utilized is provided. It also introduces the model employed and outlines the experimental designs. Section 3 presents the findings pertaining to the interaction between the freeze–thaw dynamics and the SEB. Moving forward, Section 4 discusses the pivotal processes that intertwine soil hydrothermic conditions with SEB regimes. Section 5 summarizes the conclusions of the paper, discusses the limitations of the study, and also provides an outlook for future research.

2. Material and Methods

2.1. Study Area and Data

In this study, the core data were derived from five field sites positioned within the permafrost zones of the QTP: XDT, BLH, TGL, TSH, and LDH (depicted in Figure 1). These sites encompass a diverse array of subsurface environments representative of the permafrost regions over the QTP. Specifically, the XDT site, situated at the northern perimeter of the permafrost zone at an elevation of 4538 m, exemplifies a warm permafrost-type area characterized by an alpine meadows landscape, with vegetation coverage of 80–90% [39]. This site experiences an annual average air temperature of approximately −3.6 °C and an annual precipitation of 396 mm. The ALT at XDT is approximately 1.54 m. Moving centrally, the BLH site is situated upstream, showcasing an alpine marsh meadow ecosystem with vegetation coverage between 60% and 80%. This site registers an annual average air temperature of roughly −3.0 °C and annual rainfall of 415 mm, accompanied by an ALT of 2.4 m. TGL site, perched at an altitude of 5100 m and located at the TGL Mountain pass in the QTP’s interior, stands as the highest field observation site within the permafrost zone, classifying it as cold permafrost [40]. Its gentle, open terrain is dominated by alpine steppe vegetation, covering 30% to 40% of the area [40]. This site experiences an annual average air temperature of approximately −4.9 °C, an annual average atmospheric pressure of around 538 hPa, and an annual precipitation of 436.7 mm. The ALT here reaches 3.4 m [41]. LDH site, which is positioned at the southernmost edge of the QTP permafrost zone at 4808 m above sea level, features an alpine marsh meadow landscape. It experiences a notably warmer annual average air temperature of approximately 1.5 °C and annual precipitation of 449.3 mm, with an ALT of roughly 1.2 m. TSH is situated along the western perimeter of the permafrost region, an area that is simultaneously remote and inaccessible, and that has the lowest temperatures and minimal annual precipitation. For a comprehensive overview of each site’s specifics, including location and vegetation, refer to Table 1.
The field monitoring data used in this study mainly includes automatic meteorological monitoring site data and AL hydrothermic data. The meteorological data were provided by the automatic meteorological gradient tower observation, including air temperature, air pressure, atmospheric humidity, wind speed at three layers (2, 5, and 10 m), precipitation, upward longwave/shortwave radiation flux, downward longwave/shortwave radiation flux, snow depth, and soil heat flux (0.05, 0.1, and 0.2 m). The AL data includes soil temperature and moisture data levels across various soil depths. The meteorological data were systematically recorded using a Campbell Scientific Inc. (Logan, UT, USA) CR1000/CR3000 data acquisition system. The soil temperature was precisely measured at various depths, employing a 105T/109 thermocouple probe with an accuracy of ±0.1 °C to ±0.2 °C. Furthermore, soil moisture content was quantitatively assessed using a Hydra soil moisture sensor, which was interfaced with the CR10X/CR1000/CR3000 data logger for continuous and accurate monitoring. The instrumentation, equipment, and error ranges for each variable are detailed in Table 2.

2.2. Model

2.2.1. Model Description

The Community Earth System Model (CESM) is a sophisticated coupled earth system model, featuring the CLM model as its land surface module. The CLM model comprehensively incorporates four main processes: biogeochemical, biophysical-chemical, hydrological, and dynamic vegetation processes. It is currently one of the land surface process models with the most comprehensive consideration of physical processes and the greatest development potential. The latest version of the CLM model, CLM5.0 has significantly improved its simulation performance compared to previous versions. CLM5.0 adjusts some parameterization schemes and model structures, with improvements mainly focused on soil hydrology, surface turbulent fluxes, snow accumulation, vegetation, carbon-nitrogen cycles, and runoff [42]. CLM5.0 introduces a soil resistance scheme for the depth of the dry soil layer, improves the soil evaporation parameterization scheme, and enhances its simulation performance [43]. In CLM5.0, the soil is divided into 25 layers (0.01 m, 0.04 m, 0.09 m, 0.16 m, 0.28 m, 0.40 m, 0.58 m, 0.80 m, 1.06 m, 1.36 m, 1.70 m, 2.08 m, 2.50 m, 2.99 m, 3.58 m, 4.27 m, 5.06 m, 5.95 m, 6.94 m, 8.03 m, 9.80 m, 13.33 m, 19.48 m, 28.87 m, and 42.00 m) [44]. The first 20 layers are involved in hydrological and biogeochemical processes, while the bottom five layers are identified as bedrock and are only included in thermodynamic calculations [45]. In land surface process models, evaporation is crucial for water balance, and its changes are closely related to SEB, soil moisture content, etc. These improvements enable CLM5.0 to provide more accurate simulations of the global soil energy-water exchange process [46,47].

2.2.2. Experimental Design

Previous studies have shown that the default parameterization scheme in the CLM5.0 model can lead to the overestimation of the sensible heat flux and the underestimation of the latent heat flux over the QTP [16]. This study utilizes the improved CLM5.0 (SP5 scheme) reported by Ma et al. [16] to quantitatively explore the impact of the freeze–thaw process on the exchange process of surface energy and water. The freeze–thaw scheme in CLM5.0 is shown in Equations (1) and (2):
T i n + 1 > T f   a n d   w i c e , i > 0                   i = s n l + 1 , , N l e v g r n d                   m e l t i n g ,
              T i n + 1 < T f   a n d   w l i q , i > 0                                       i = s n l + 1 ,   ,   0                                         T i n + 1 < T f   a n d     w l i q , m a x , i                                       i = 1 ,   ,   N l e v g r n d                                       f r e e z i n g
where T means the soil temperature, Tf is the phase transition temperature (i.e., 0 °C), Wice is the soil ice content, Wliq is the soil water content, and Wliq,max is the unfrozen water content in the frozen soil. When T > Tf and Wice > 0, the frozen soil thaws; When T < Tf and Wliq < Wliq,max, the soil freezes.
In this study, a sensitivity test (TEST experiment) was artificially designed to remove the freeze–thaw process. This experiment assumes that when the soil temperature (T) drops below the phase transition temperature (Tf), the soil will not undergo a freezing process, the freeze–thaw mechanism in the model is artificially removed, while other parameterization schemes remain unchanged (e.g., snowmelt processes still exist). For comparison, we also designed a control experiment (CTL experiment). CTL experiment includes the soil freeze–thaw process, and all other settings are the same as the TEST experiment, representing a normal simulation experiment.

3. Results

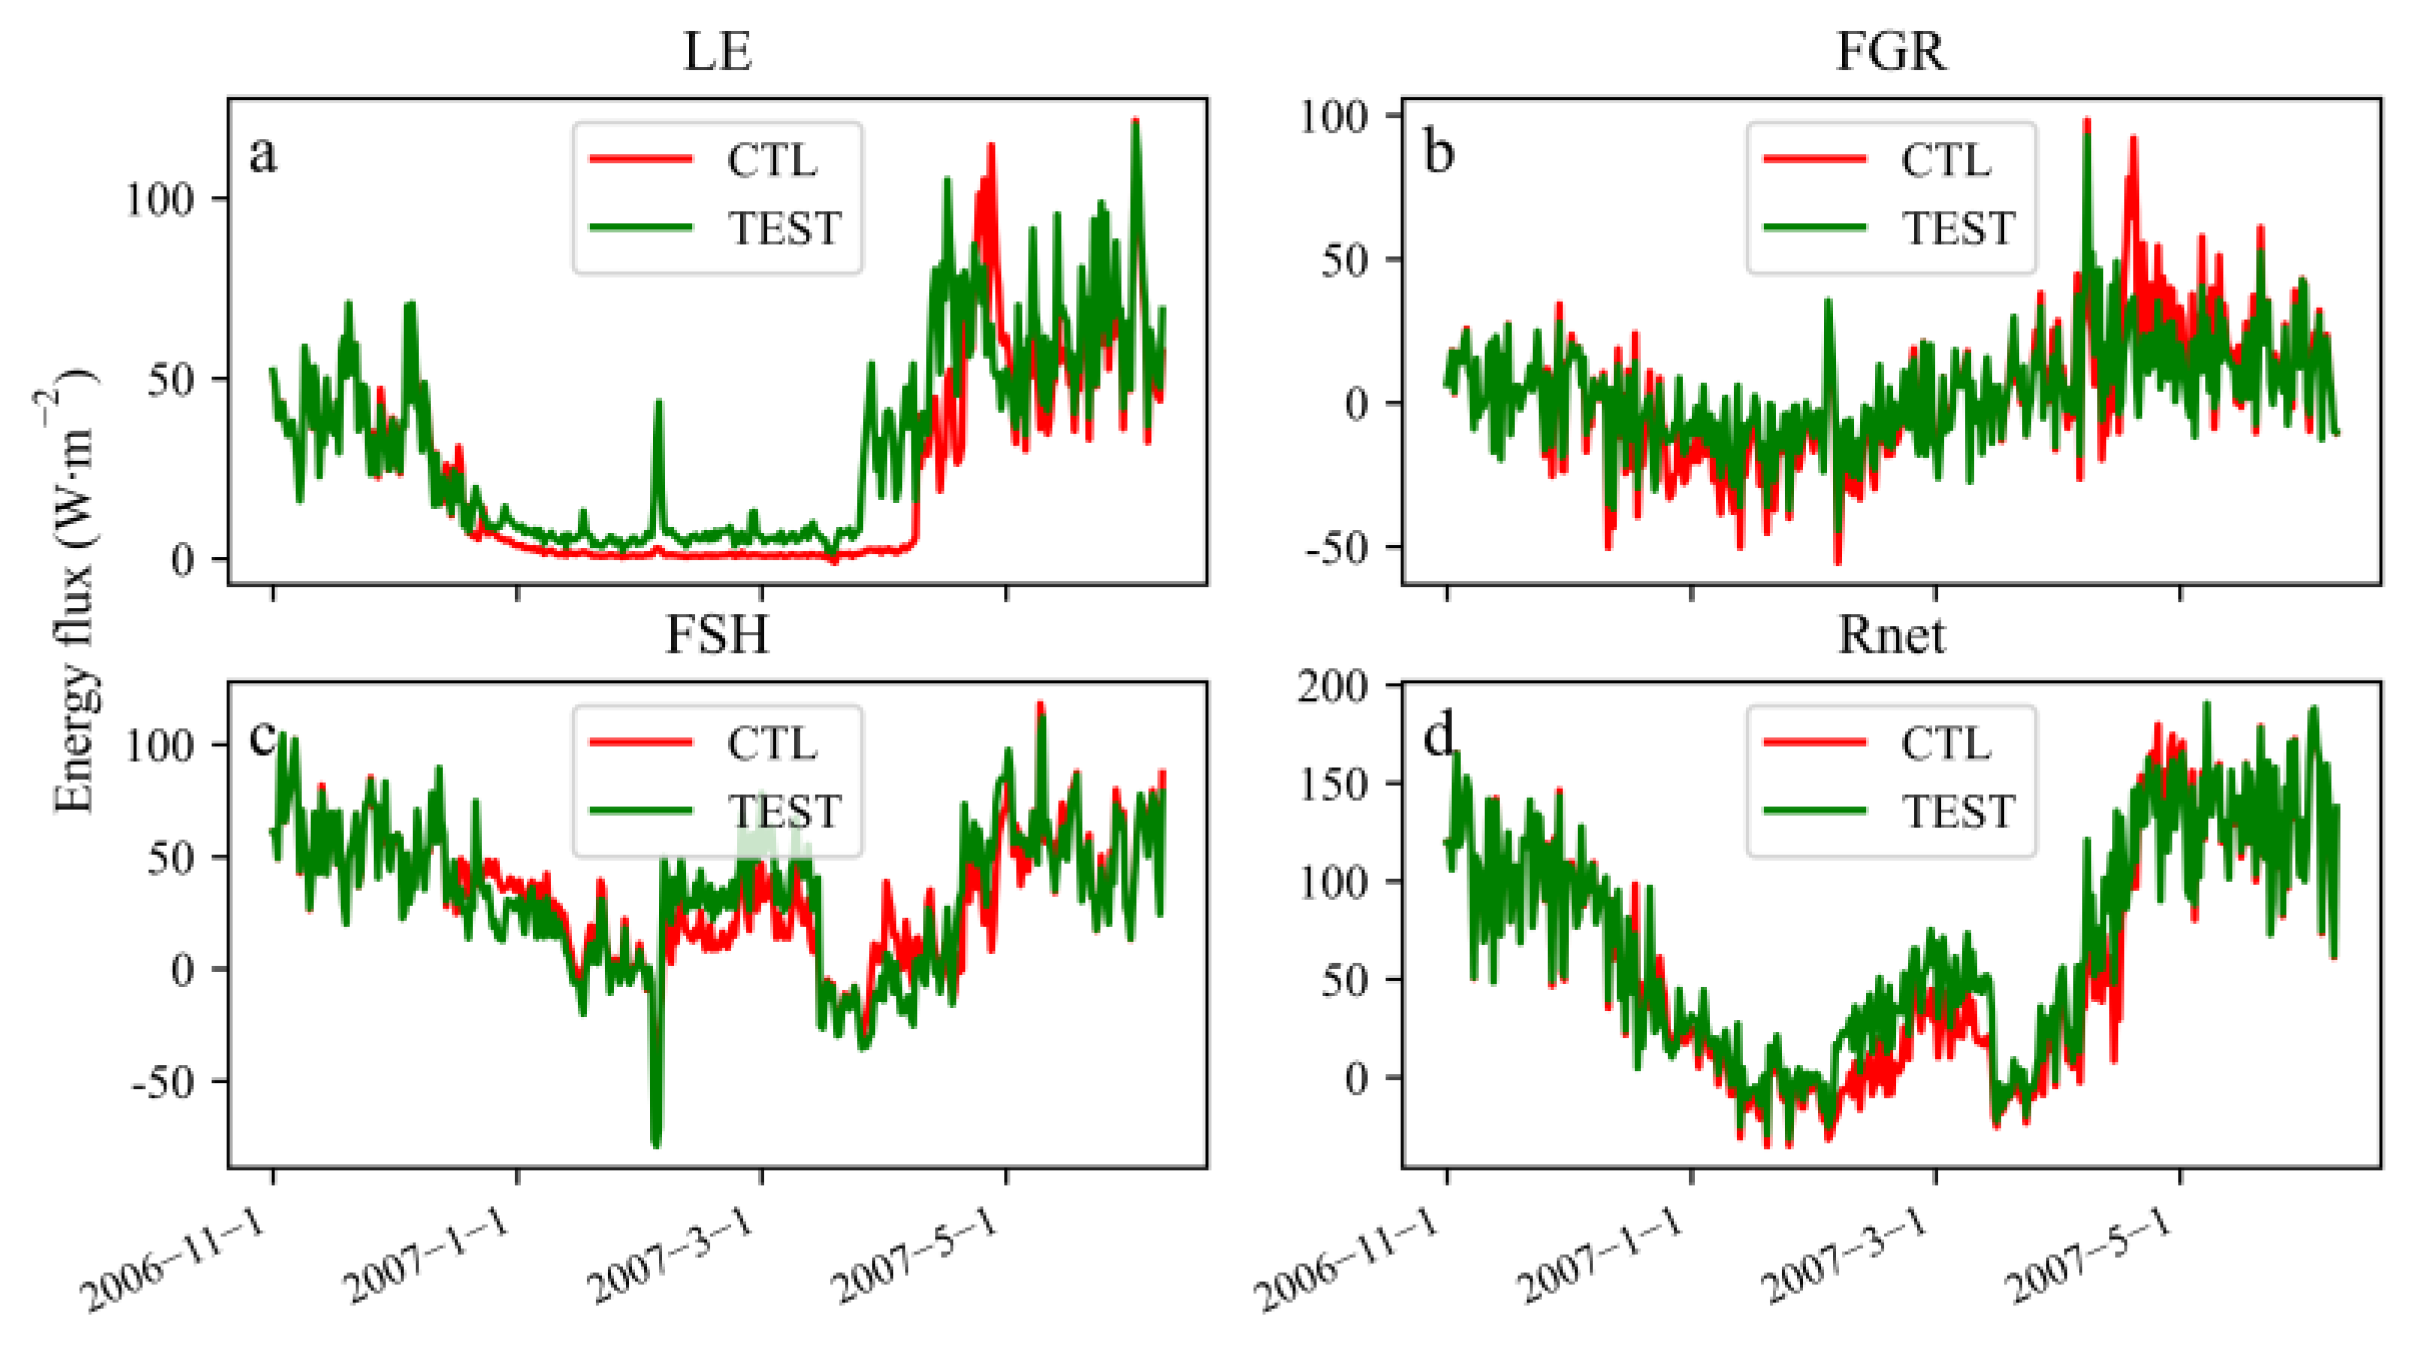
3.1. The Influence of the Freeze–Thaw Process on the Surface Energy Flux

Figure 2 provides a comprehensive comparison of soil moisture dynamics under conditions with and without a freeze–thaw cycle. The three columns of subgraphs from left to right represent the TGL site, BLH site, and XDT site, respectively. The four rows from top to bottom represent the soil depths of 5, 10, 20, and 40 cm, respectively. The blue line shows the time series of soil liquid moisture content that includes the freeze–thaw cycle process (CTL), while the orange line represents the soil liquid moisture content when the freeze–thaw cycle is removed (TEST). Notably, the CTL experiment exhibited a characteristic “U”-shaped profile in soil moisture variation across a single freeze–thaw cycle. April to August is the thawing stage of the freeze–thaw cycle process. During this period, as net radiation flux increases and air temperature rises, energy is transferred from the atmosphere to the soil, causing solid water in the soil to gradually melt over time. This leads to a gradual increase in the liquid water content of the soil at different depths. Subsequently, from August to October, it enters the fully thawed stage, resulting in the stable maintenance of a higher level of liquid water content in the soil, which persists for an extended period. October to December is the freezing stage of the freeze–thaw cycle process. During this period, net radiation flux decreases, air temperatures drop, and soil moisture transitions from liquid to solid over time, leading to a decrease in soil liquid water content and maintaining it at a lower level. Observing the soil liquid water content at different depths across the three stations, it is evident that as the depth increases, the soil liquid water content gradually decreases, and its fluctuation range also gradually narrows. This phenomenon was consistent at all three stations. For the TEST experiment, the soil liquid water content fluctuates less within a freeze–thaw cycle. During the thawing stage, the soil liquid water content of the TEST experiment was highly consistent with that of the CTL experiment, and the pattern of change in the soil moisture both with and without the freeze–thaw process exhibited remarkable similarity for three sites: BLH, XDT, and TGL. Specifically, the BLH site emerges as having the highest soil moisture content, while the lowest was observed at the XDT site. However, during the freezing phase, the soil liquid moisture content exhibits a pronounced difference when comparing the CTL experiment to the TEST experiment. A notable deviation arises due to the TEST experiment’s artificial elimination of the freezing process. Consequently, soil moisture remains stable and does not exhibit the expected decline. By the end of the complete freezing period, the soil moisture content in the TEST experiment remained virtually unchanged. In contrast, in mid-April of the subsequent year, the soil in the CTL experiment begins thawing, marked by a precipitous increase in soil moisture, gradually reverting to pre-freezing levels. Interestingly, the middle soil layer (40 cm depth) lags behind the shallow layer (5 cm depth) in its freezing and thawing patterns by approximately one month, highlighting the depth-dependent nature of these processes. Collectively, the observed changes in soil moisture verified the efficacy of the experiment in achieving its intended objectives.
Removing the freeze–thaw process will inevitably cause a response in soil temperature. The changes in soil temperature for different soil depths at BLH, XDT, and TGL in the TEST and CTL experiments are summarized in Figure 3. It can be observed that the soil temperature variations in both experimental groups exhibited a V-shaped distribution at different depths, and this phenomenon was consistent across all three sites. In summary, the soil temperature changes induced by the test that removes the freeze–thaw process (TEST) were more pronounced during the freezing period. During the complete thawing process, the difference in soil temperature between the TEST and CTL experiments was very small, almost completely overlapping. However, during the freezing process, the soil temperature in the CTL experiment was higher than in the TEST experiment, and this phenomenon is most pronounced at the BLH site. During the complete freezing process, for the BLH site, the soil temperature in the CTL experiment was higher than in the TEST experiment, while the other two sites exhibited the opposite trend. It can be observed that at the BLH site, the soil released heat to the outside environment during the freezing process, which slowed down the rate at which soil temperature decreased. The soil temperature in the CTL experiment was higher than in the TEST experiment, and this phenomenon was in line with our expectations. However, the soil temperatures simulated by the two experimental groups at the TGL and XDT sites exhibited an opposite trend. We have further analyzed this trend and believe that it is mainly caused by the following reasons. Firstly, compared to the BLH site, the soil moisture content at the TGL and XDT was lower, so the impact of the release of heat during the freezing process on the soil temperature may have been smaller. Secondly, combining the simulation results [16], it can be seen that the CLM5.0 model simulates the soil moisture during the freezing stage at the BLH site relatively accurately compared to the measured values, while there is a notable underestimation of shallow soil moisture during the freezing period at the TGL and XDT sites, which may have affected the accuracy of the freeze–thaw cycle process simulation. Additionally, the thermal conductivity of ice is approximately fourfold greater than the thermal conductivity of water. Theoretically, the thermal conductivity during the freezing stage should be greater than that during the unfrozen stage [48]. However, Li et al. [40] found that when the initial soil moisture content is less than a threshold value (e.g., 0.195 m3 m−3 in the TGL region), there may be an abnormal change in thermal conductivity during the freezing stage. This phenomenon has also been verified at other sites of the QTP, such as at Fenghuoshan [49]. In this study, both the TGL and XDT sites belong to this phenomenon. However, CLM5.0 is unable to accurately reflect this change in thermal conductivity when the soil moisture content is low, thus it produces the opposite trend in thermal conductivity during the freezing period [50]. Combining the above reasons, the model’s inability to capture the subtle changes in soil moisture and thermal conductivity leads to an inaccurate description of the complex freeze–thaw cycle in permafrost regions.
Furthermore, we also analyzed the impact of the freeze–thaw process on surface energy fluxes. Figure 4, Figure 5 and Figure 6 present the trends in the surface energy fluxes at the TGL, BLH, and XDT sites in the CTL and TEST experiments. It is evident that the freeze–thaw process in the AL not only affected the soil temperature but also significantly influenced the surface energy fluxes and radiation fluxes. As can be seen from the figures, the trends at the three sites in the two experiments were relatively consistent. Taking the TGL site as an example, we calculated the impact of different freeze–thaw stages on the energy and radiation fluxes (Table 3). According to the analysis of Ma et al. [19], we know that the soil heat flux in permafrost regions is negative in cold seasons, indicating that heat is transferred from the land surface to the atmosphere, while in warm season it is positive, indicating that energy is transferred from the atmosphere to the land surface. During the freezing stage, the absolute value of the ground heat flux in the CTL experiment is greater than in the TEST experiment, increasing by 6.2 W m−2, with a change rate of 65.6%. At this stage, the change in the net radiation is relatively low. During this phase, if there is no freeze–thaw process, the sensible heat flux would decrease, while the latent heat flux would increase. This is primarily because, when the freeze–thaw process is absent, soil moisture remains in the form of liquid water, thus favoring the evaporation process and increasing the latent heat flux. Meanwhile, the absence of the freezing process also reduces the release of heat, resulting in lower soil temperatures and, consequently, a lower sensible heat flux.
During the complete freezing stage, the absolute value of the soil heat flux remains higher in the CTL experiment than in the TEST experiment, with a numerical difference of 1.5 W m−2 and a change rate of 43.7%. This indicates that the release of energy during soil freezing actually increased the heat transfer from the soil to the atmosphere, enhancing turbulent motion and evaporation. During this period, sensible heat exchange was primarily enhanced. In the thawing stage, the soil heat flux in the CTL experiment was still higher than in the TEST experiment, with a difference of 4.4 W m−2 and a change rate of 27%. This suggests that the heat absorbed by the soil during the thawing phase was mainly used to transfer heat to the lower soil layers, resulting in a decrease in the sensible and latent heat fluxes. Additionally, during the complete thawing stage, the differences in the energy and radiation fluxes between the two experiments were very small. Collectively, these results indicate that the freeze–thaw cycle affects the distribution of SEB through the absorption and release of energy during phase transitions, thus altering the energy and matter exchange between the land surface and the atmosphere.

3.2. The Effect of Surface Energy Accumulation on Freeze–Thaw Processes

The intricate dynamics of the freeze–thaw cycle within permafrost regions encompass a multitude of intricate physical and chemical interactions, which profoundly influence the SEB, as evidenced by recent studies [9,19,22]. In contrast, the accumulation of surface energy flux has a reciprocal influence, modulating the freeze–thaw process of the AL [9], and enhancing the energy exchange interface between the terrestrial system and the atmosphere. Drawing upon the robust analytical framework of CLM5.0, our previous investigations have quantitatively illuminated the significant impact of the freeze–thaw process on the fluctuations within the SEB. In this study, we delve further into this intricate interplay, using observational data to understand the influence of surface energy accumulation on the thawing process of the AL. Soil temperature, which is the most tangible indicator of changes in soil thermal state, was our primary focus. Seasonal variability in solar radiation at the soil surface leads to fluctuations in the net radiation, which subsequently initiates an annual pattern of soil heat flux variations. These heat flux changes, acting as a pivotal factor, orchestrate the freeze–thaw cycles within the AL, highlighting the intricate coupling between solar energy input and soil thermal dynamics [9]. The initiation and progression of the thawing process of AL is primarily associated with the influx of solar radiation energy, which penetrates deep into the soil profile [51]. Typically, the thawing process occurs across the permafrost region of the northern QTP from April to September. Consequently, we confine our study to this period, examining the influence of surface energy accumulation on the thawing depth (TD) of the AL.
Figure 7 presents the relationship between the TD and the net radiation accumulation at the four sites: TGL, LDH, TSH, and XDT sites. The change in the surface energy flux had a prominent impact on the TD of the AL. Assuming that the surface energy accumulation value is 0 W m−2 when the AL just begins to thaw, as the surface energy value accumulates, the thawing depth of the AL gradually increases, and the correlation between TD and the variation in energy flux accumulation (x) can be mathematically modeled through a power function.
TD = a · xb,
where a and b serve as regression coefficients that define the specific relationship.
The regression relationship between the TD of the AL and the net radiation accumulation at each site was very significant. Because the thawing of the AL soil is an endothermic and unidirectional process, the accumulation of surface energy has a significant impact on the thawing depth of the AL [9,52]. Contrasting the thawing process, the freezing of the AL occurs in a bidirectional manner, stemming from the concerted influence of surface energy fluxes and the cold source situated at the base of the AL [22].

4. Discussion

Recent global climate trends have indicated a pronounced warming, with the QTP serving as a keen indicator, exhibiting an even more substantial warming trend that underscores its sensitivity to climate change [53]. Due to this warming and a consequent increase in wetting, the permafrost of the QTP has been degraded [54,55]. On the other hand, changes in permafrost also have important feedback on the climate system [56]. Figure 8 summarizes the interaction between the freeze–thaw process of the AL and the SEB. It can be observed that soil moisture and temperature are coupled and influence each other [57], while the freeze–thaw process has a significant impact on soil moisture and heat, while also impacting surface energy fluxes, thus influencing the regional climate [9,58]. Starting from mid-April, the soil temperature gradually rises due to the increase in net radiation received by the surface, resulting in positive ground heat fluxes and initiating the thawing process in the shallow soil layers. As energy is transferred from the atmosphere to the soil, the deeper soil layers also enter the thawing stage by mid-to-late May. During this process, the latent heat flux begins to increase due to the augmentation of soil liquid moisture content and precipitation, gradually dominating the SEB. Conversely, during the freezing stage (mid-to-late September), the soil temperature gradually decreases with the reduction of net radiation, causing the ground heat flux to turn negative and initiating soil freezing. As the liquid water content diminishes and the rainy season ends, the latent heat flux rapidly decreases, allowing the sensible heat flux to regain its dominant position in the SEB. Without the freeze–thaw process, the distribution of surface energy fluxes would undergo significant changes. Based on the analysis of the previous CLM5.0 single-point experiments (Table 3), it is known that the freeze–thaw cycle enhances the energy exchange between the surface and the atmosphere through the release and absorption of energy during phase changes, primarily by increasing the ground heat flux, which then influences the sensible heat fluxes and the latent heat fluxes.
Variations in the type of permafrost and soil properties also significantly influence the changes in SEB. In this study, the TGL site, situated in the southwestern hinterland of TGL Mountain on the QTP, is described as cold permafrost [40]. Conversely, the XDT site, positioned adjacent to the northern QTP’s permafrost fringe [39], boasts significant soil moisture levels and falls under the category of warm permafrost. These distinct permafrost types result in differing surface energy-moisture exchange mechanisms, wherein warm permafrost demonstrates a heightened intensity of surface processes compared to cold permafrost [21]. The effect of latent heat in warm permafrost can slow down the increase in the temperature of the permafrost, meaning that a more rapid rise in shallow soil temperatures is observed in cold permafrost regions [59]. Additionally, the soil properties at the TGL and XDT sites also differ significantly. The soil composition at XDT exhibits a notable distinction from that of the TGL site, as reported by Yao et al. [21]. Specifically, the XDT site is characterized by a reduced gravel content (Table 4). This soil profile favors the retention of soil moisture, a phenomenon that is crucial for maintaining soil water availability and regulating hydrological processes. Furthermore, the increased sand and silt fractions contribute to enhanced soil thermal conductivity, which is instrumental in modulating soil temperature dynamics and potentially influences the SEB. Consequently, the surface hydrothermic exchange processes are more robust at XDT compared to TGL. The complexity of these hydrothermic processes poses challenges in accurately simulating surface energy fluxes [19,60].

5. Conclusions and Prospect

Studying the SEB characteristics of the QTP and its interaction with the freeze–thaw cycle process of the AL is of great significance for understanding climate change. This study employs the CLM5.0 model to investigate the impact of freeze–thaw processes on surface energy and water exchange. Furthermore, based on measured data from five sites, an analysis is conducted to assess the influence of net radiation accumulation on the thawing process. The findings of the study indicated that the freeze–thaw cycle process modifies the distribution of SEB. Through the release and absorption of energy during the phase transition of soil moisture, the energy transfer between the land and the atmosphere is intensified. Notably, the most significant change occurs in the ground heat flux, with a variation range of up to 65.6%, which subsequently alters the sensible and latent heat fluxes. In addition, this study also found that the limitations of CLM5.0 to capture the intricate changes of soil moisture and thermal conductivity during the freezing process at individual sites in permafrost regions make its description of the complex freeze–thaw cycle process of permafrost inaccurate. This study thus provides useful insights for subsequent research on land surface processes on the QTP, laying a foundation for a better understanding of climate change.
However, this study has a number of limitations that should be noted. This study primarily relied on measured data and model simulations to verify the interaction mechanisms between the freeze–thaw process and the SEB. Nevertheless, due to the complex and diverse underlying surfaces of the QTP, particularly the harsh environment in the western region, the absence of measured data presents a limitation for conducting rigorous validation, the generalizability of the conclusions drawn by this study in areas with significantly different underlying surface conditions needs to be verified.

Author Contributions

Conceptualization, J.M. and R.L.; methodology, J.M. and H.L.; software, J.M. and H.L.; validation, J.M., H.L. and R.L.; formal analysis, J.M. and H.L.; investigation, J.M.; resources, T.W. and X.W.; data curation, J.M., J.S. and Y.Q.; writing—original draft preparation, J.M.; writing—review and editing, J.M. and R.L.; visualization, H.L.; supervision, G.H., S.W., Y.X., W.L. and S.T.; project administration, J.M., T.W. and R.L.; funding acquisition, J.M., T.W. and R.L. All authors have read and agreed to the published version of the manuscript.

Funding

This work was supported by the West Light Foundation of the Chinese Academy of Sciences (xbzg-zdsys-202304), National Key Research and Development Program of China (2023YFC3206300), National Natural Science Foundation of China (U23A2062, 32361133551), Gansu Provincial Science and Technology Program (22ZD6FA005), the PhD Special Project of Nanyang Normal University (No. 2024ZX005), and the Natural Science Foundation of Gansu Province (24JRRA101).

Data Availability Statement

The data employed in this research may be acquired upon making a reasonable request to the corresponding author.

Acknowledgments

We are deeply appreciative of the developers of CESM (accessed on 1 January 2022), which is accessible free of charge at http://www.cesm.ucar.edu/models/.

Conflicts of Interest

The authors disclose no competing interests or conflicts of interest in relation to this study.

References

  1. Dobiński, W. Permafrost active layer. Earth Sci. Rev. 2020, 208, 103301. [Google Scholar] [CrossRef]
  2. Cheng, G.; Jin, H. Permafrost and groundwater on the Qinghai-Tibet Plateau and in northeast China. Hydrogeol. J. 2013, 21, 5. [Google Scholar] [CrossRef]
  3. Qin, J.; Ding, Y.; Han, T.; Chang, Y.P.; Shi, F.; You, Y. The hydrothermal changes of permafrost active layer and their impact on summer rainfall-runoff processes in an alpine meadow watershed, northwest china. Res. Cold Arid. Reg. 2022, 14, 361–369. [Google Scholar] [CrossRef]
  4. Wilson, R.; Fitzhugh, L.; Whiting, G.; Frolking, S.; Harrison, M.; Dimova, N.; Burnett, W.; Chanton, J.P. Greenhouse gas balance over thaw-freeze cycles in discontinuous zone permafrost. J. Geophys. Res. Biogeosci. 2017, 122, 387–404. [Google Scholar] [CrossRef]
  5. Congreves, K.; Wagner-Riddle, C.; Si, B.; Clough, T. Nitrous oxide emissions and biogeochemical responses to soil freezing-thawing and drying-wetting. Soil Biol. Biochem. 2018, 117, 5–15. [Google Scholar] [CrossRef]
  6. Guo, D.; Yang, M.; Wang, H. Characteristics of land surface heat and water exchange under different soil freeze/thaw conditions over the central Tibetan Plateau. Hydrol. Process. 2011, 25, 2531–2541. [Google Scholar] [CrossRef]
  7. Guo, X.; Yang, K.; Chen, Y. Weakening sensible heat source over the Tibetan Plateau revisited: Effects of the land–atmosphere thermal coupling. Theor. Appl. Climatol. 2011, 104, 1–12. [Google Scholar] [CrossRef]
  8. Zhang, M.; Zhou, Z.; Wen, Z.; Zhou, F.; Ma, Z.; Lei, B. Thermal–moisture dynamics and thermal stability of active layer in response to wet/dry conditions in the central region of the Qinghai–Tibet Plateau, China. Res. Cold Arid. Reg. 2023, 15, 27–38. [Google Scholar] [CrossRef]
  9. Ma, J.; Li, R.; Liu, H.; Huang, Z.; Wu, T.; Hu, G.; Xiao, Y.; Zhao, L.; Du, Y.; Yang, S. The surface energy budget and its impact on the freeze-thaw processes of active layer in permafrost regions of the Qinghai-Tibetan Plateau. Adv. Atmos. Sci. 2022, 39, 189–200. [Google Scholar] [CrossRef]
  10. Wang, C.; Yang, K.; Zhang, F. Impacts of soil freeze–thaw process and snow melting over Tibetan Plateau on Asian summer monsoon system: A review and perspective. Front. Earth Sci. 2020, 8, 133. [Google Scholar] [CrossRef]
  11. Wang, J.; Luo, S.; Li, Z.; Wang, S.; Li, Z. The freeze/thaw process and the surface energy budget of the seasonally frozen ground in the source region of the Yellow River. Theor. Appl. Climatol. 2019, 138, 1631–1646. [Google Scholar] [CrossRef]
  12. Chen, B.; Luo, S.; Lü, S.; Zhang, Y.; Ma, D. Effects of the soil freeze-thaw process on the regional climate of the Qinghai-Tibet Plateau. Clim. Res. 2014, 59, 243–257. [Google Scholar]
  13. Li, X.; Jin, R.; Pan, X.; Zhang, T.; Guo, J. Changes in the near-surface soil freeze–thaw cycle on the Qinghai-Tibetan Plateau. Int. J. Appl. Earth Obs. Geoinf. 2012, 17, 33–42. [Google Scholar] [CrossRef]
  14. You, Q.; Xue, X.; Peng, F.; Dong, S.; Gao, Y. Surface water and heat exchange comparison between alpine meadow and bare land in a permafrost region of the Tibetan Plateau. Agric. For. Meteorol. 2017, 232, 48–65. [Google Scholar] [CrossRef]
  15. Zheng, D.; Van der Velde, R.; Su, Z.; Wen, J.; Wang, X.; Yang, K. Evaluation of Noah frozen soil parameterization for application to a Tibetan meadow ecosystem. J. Hydrometeorol. 2017, 18, 1749–1763. [Google Scholar] [CrossRef]
  16. Ma, J.; Li, R.; Liu, H.; Huang, Z.; Wu, T.; Wu, X.; Zhao, L.; Hu, G.; Xiao, Y.; Jiao, Y. Evaluation of CLM5. 0 for simulating surface energy budget and soil hydrothermal regime in permafrost regions of the Qinghai-Tibet Plateau. Agric. For. Meteorol. 2023, 332, 109380. [Google Scholar] [CrossRef]
  17. Yao, T.; Xue, Y.; Chen, D.; Chen, F.; Thompson, L.; Cui, P.; Koike, T.; Lau, W.K.-M.; Lettenmaier, D.; Mosbrugger, V. Recent third pole’s rapid warming accompanies cryospheric melt and water cycle intensification and interactions between monsoon and environment: Multidisciplinary approach with observations, modeling, and analysis. Bull. Am. Meteorol. Soc. 2019, 100, 423–444. [Google Scholar] [CrossRef]
  18. Wang, C.; Yang, K. A new scheme for considering soil water-heat transport coupling based on Community Land Model: Model description and preliminary validation. J. Adv. Model. Earth Syst. 2018, 10, 927–950. [Google Scholar] [CrossRef]
  19. Ma, J.; Li, R.; Huang, Z.; Wu, T.; Wu, X.; Zhao, L.; Liu, H.; Hu, G.; Xiao, Y.; Du, Y. Evaluation and spatio-temporal analysis of surface energy flux in permafrost regions over the Qinghai-Tibet Plateau and Arctic using CMIP6 models. Int. J. Digit. Earth 2022, 15, 1947–1965. [Google Scholar] [CrossRef]
  20. Yao, J.; Zhao, L.; Gu, L.; Qiao, Y.; Jiao, K. The surface energy budget in the permafrost region of the Tibetan Plateau. Atmos. Res. 2011, 102, 394–407. [Google Scholar] [CrossRef]
  21. Yao, J.; Gu, L.; Yang, C.; Chen, H.; Wang, J.; Ding, Y.; Li, R.; Zhao, L.; Xiao, Y.; Qiao, Y. Estimation of surface energy fluxes in the permafrost region of the Tibetan Plateau based on in situ measurements and the surface energy balance system model. Int. J. Climatol. 2020, 40, 5783–5800. [Google Scholar] [CrossRef]
  22. Hu, G.; Zhao, L.; Li, R.; Wu, X.; Wu, T.; Zou, D.; Zhu, X.; Jie, C.; Su, Y.; Hao, J. Dynamics of the freeze–thaw front of active layer on the Qinghai-Tibet Plateau. Geoderma 2023, 430, 116353. [Google Scholar] [CrossRef]
  23. Group, M.R.I.E.W. Elevation-dependent warming in mountain regions of the world. Nat. Clim. Change 2015, 5, 424–430. [Google Scholar]
  24. Wen, B.; An-Min, D.; Qing-Long, Y.; Die, H. Research progress on climate change and its impact on water resources over the Tibetan Plateau. Adv. Clim. Change Res. 2024, 20, 158. [Google Scholar]
  25. Li, R.; Wu, Q.; Li, X.; Sheng, Y.; Hu, G.; Cheng, G.; Zhao, L.; Jin, H.; Zou, D.; Wu, X. Characteristic, changes and impacts of permafrost on Qinghai-Tibet Plateau. Chin. Sci. Bull. 2019, 64, 2783–2795. [Google Scholar] [CrossRef]
  26. Duan, J.; Li, L.; Fang, Y. Seasonal spatial heterogeneity of warming rates on the Tibetan Plateau over the past 30 years. Sci. Rep. 2015, 5, 11725. [Google Scholar] [CrossRef]
  27. Zhang, G.; Nan, Z.; Wu, X.; Ji, H.; Zhao, S. The role of winter warming in permafrost change over the Qinghai-Tibet Plateau. Geophys. Res. Lett. 2019, 46, 11261–11269. [Google Scholar] [CrossRef]
  28. Li, R.; Ma, J.; Wu, T.; Wang, Q.; Wu, X.; Zhao, L.; Wang, S.; Hu, G.; Liu, W.; Jiao, Y. The spatiotemporal variations of freezing index and its relationship with permafrost degradation over the Qinghai–Tibet Plateau from 1977 to 2016. Theor. Appl. Climatol. 2024, 155, 985–998. [Google Scholar] [CrossRef]
  29. Guojie, H.; Lin, Z.; Zhe, S.; Defu, Z.; Yao, X.; Guangyue, L.; Erji, D.; Chong, W.; Yuanwei, W.; Xiaodong, W. Spatiotemporal characteristics and variability in the thermal state of permafrost on the Qinghai–Tibet Plateau. Permafr. Periglac. Process. 2024, 35, 143–156. [Google Scholar] [CrossRef]
  30. Zhang, Z.; Li, M.; Wen, Z.; Yin, Z.; Tang, Y.; Gao, S.; Wu, Q. Degraded frozen soil and reduced frost heave in China due to climate warming. Sci. Total Environ. 2023, 893, 164914. [Google Scholar] [CrossRef]
  31. Biskaborn, B.K.; Smith, S.L.; Noetzli, J.; Matthes, H.; Vieira, G.; Streletskiy, D.A.; Schoeneich, P.; Romanovsky, V.E.; Lewkowicz, A.G.; Abramov, A. Permafrost is warming at a global scale. Nat. Commun. 2019, 10, 264. [Google Scholar] [CrossRef] [PubMed]
  32. Dmitrenko, I.A.; Kirillov, S.A.; Tremblay, L.B.; Kassens, H.; Anisimov, O.A.; Lavrov, S.A.; Razumov, S.O.; Grigoriev, M.N. Recent changes in shelf hydrography in the Siberian Arctic: Potential for subsea permafrost instability. J. Geophys. Res. Ocean. 2011, 116. [Google Scholar] [CrossRef]
  33. Mu, C.; Abbott, B.W.; Norris, A.J.; Mu, M.; Fan, C.; Chen, X.; Jia, L.; Yang, R.; Zhang, T.; Wang, K. The status and stability of permafrost carbon on the Tibetan Plateau. Earth Sci. Rev. 2020, 211, 103433. [Google Scholar] [CrossRef]
  34. Schuur, E.A.; McGuire, A.D.; Schädel, C.; Grosse, G.; Harden, J.W.; Hayes, D.J.; Hugelius, G.; Koven, C.D.; Kuhry, P.; Lawrence, D.M. Climate change and the permafrost carbon feedback. Nature 2015, 520, 171–179. [Google Scholar] [CrossRef]
  35. Zhang, G.; Nan, Z.; Zhao, L.; Liang, Y.; Cheng, G. Qinghai-Tibet Plateau wetting reduces permafrost thermal responses to climate warming. Earth Planet. Sci. Lett. 2021, 562, 116858. [Google Scholar] [CrossRef]
  36. Liu, H.; Fan, J.; Zhou, K.; Xu, X.; Zhang, H.; Guo, R.; Chen, S. Assessing the dynamics of human activity intensity and its natural and socioeconomic determinants in Qinghai–Tibet Plateau. Geogr. Sustain. 2023, 4, 294–304. [Google Scholar] [CrossRef]
  37. Hu, G.; Zhao, L.; Wu, T.; Wu, X.; Li, R.; Zhu, X.; Zou, D.; Hao, J.; Li, W. Long-term soil temperature dynamics of the Kunlun Pass permafrost region on the Qinghai-Tibetan Plateau. Theor. Appl. Climatol. 2022, 149, 1043–1056. [Google Scholar] [CrossRef]
  38. Zhao, L.; Hu, G.; Zou, D.; Wu, X.; Ma, L.; Sun, Z.; Yuan, L.; Zhou, H.; Liu, S. Permafrost Changes and Its Effects on Hydrological Processes on Qinghai-Tibet Plateau. China Acad. J. 2019, 34, 1233–1246. [Google Scholar]
  39. Zhao, L.; Zou, D.; Hu, G.; Wu, T.; Du, E.; Liu, G.; Xiao, Y.; Li, R.; Pang, Q.; Qiao, Y. A synthesis dataset of permafrost thermal state for the Qinghai–Tibet (Xizang) Plateau, China. Earth Syst. Sci. Data 2021, 13, 4207–4218. [Google Scholar] [CrossRef]
  40. Li, R.; Zhao, L.; Wu, T.; Wang, Q.; Ding, Y.; Yao, J.; Wu, X.; Hu, G.; Xiao, Y.; Du, Y. Soil thermal conductivity and its influencing factors at the Tanggula permafrost region on the Qinghai–Tibet Plateau. Agric. For. Meteorol. 2019, 264, 235–246. [Google Scholar] [CrossRef]
  41. Li, R.; Zhao, L.; Ding, Y.; Wu, T.; Xiao, Y.; Du, E.; Liu, G.; Qiao, Y. Temporal and spatial variations of the active layer along the Qinghai-Tibet Highway in a permafrost region. Chin. Sci. Bull. 2012, 57, 4609–4616. [Google Scholar] [CrossRef]
  42. Lawrence, D.M.; Fisher, R.A.; Koven, C.D.; Oleson, K.W.; Swenson, S.C.; Bonan, G.; Collier, N.; Ghimire, B.; van Kampenhout, L.; Kennedy, D. The Community Land Model version 5: Description of new features, benchmarking, and impact of forcing uncertainty. J. Adv. Model. Earth Syst. 2019, 11, 4245–4287. [Google Scholar] [CrossRef]
  43. Swenson, S.; Lawrence, D. Assessing a dry surface layer-based soil resistance parameterization for the Community Land Model using GRACE and FLUXNET-MTE data. J. Geophys. Res. Atmos. 2014, 119, 10, 210–299, 312. [Google Scholar] [CrossRef]
  44. Lawrence, D.; Fisher, R.; Koven, C.; Oleson, K.; Swenson, S.; Vertenstein, M.; Andre, B.; Bonan, G.; Ghimire, B.; van Kampenhout, L. Technical description of version 5.0 of the Community Land Model (CLM). NCAR Tech. Note 2018, 329. [Google Scholar]
  45. Lawrence, D.M.; Slater, A.G. Incorporating organic soil into a global climate model. Clim. Dyn. 2008, 30, 145–160. [Google Scholar] [CrossRef]
  46. Deng, M.; Meng, X.; Lyv, Y.; Zhao, L.; Li, Z.; Hu, Z.; Jing, H. Comparison of soil water and heat transfer modeling over the Tibetan Plateau using two Community Land Surface Model (CLM) versions. J. Adv. Model. Earth Syst. 2020, 12, e2020MS002189. [Google Scholar] [CrossRef]
  47. Luo, Q.; Wen, J.; Hu, Z.; Lu, Y.; Yang, X. Parameter sensitivities of the Community Land Model at two alpine sites in the three-river source region. J. Meteorol. Res. 2020, 34, 851–864. [Google Scholar] [CrossRef]
  48. Domine, F.; Barrere, M.; Sarrazin, D. Seasonal evolution of the effective thermal conductivity of the snow and the soil in high Arctic herb tundra at Bylot Island, Canada. Cryosphere 2016, 10, 2573–2588. [Google Scholar] [CrossRef]
  49. Du, Y.; Li, R.; Zhao, L.; Yang, C.; Wu, T.; Hu, G.; Xiao, Y.; Zhu, X.; Yang, S.; Ni, J. Evaluation of 11 soil thermal conductivity schemes for the permafrost region of the central Qinghai-Tibet Plateau. Catena 2020, 193, 104608. [Google Scholar] [CrossRef]
  50. Yang, S.; Li, R.; Wu, T.; Wu, X.; Zhao, L.; Hu, G.; Zhu, X.; Du, Y.; Xiao, Y.; Zhang, Y. Evaluation of soil thermal conductivity schemes incorporated into CLM5. 0 in permafrost regions on the Tibetan Plateau. Geoderma 2021, 401, 115330. [Google Scholar] [CrossRef]
  51. Li, R.; Zhao, L.; Wu, T.; Ding, Y.; Xin, Y.; Zou, D.; Xiao, Y.; Jiao, Y.; Qin, Y.; Sun, L. Temporal and spatial variations of global solar radiation over the Qinghai–Tibetan Plateau during the past 40 years. Theor. Appl. Climatol. 2013, 113, 573–583. [Google Scholar] [CrossRef]
  52. Li, R.; Zhao, L.; Wu, T.; Ding, Y.; Xiao, Y.; Hu, G.; Zou, D.; Li, W.; Yu, W.; Jiao, Y. The impact of surface energy exchange on the thawing process of active layer over the northern Qinghai–Xizang Plateau, China. Environ. Earth Sci. 2014, 72, 2091–2099. [Google Scholar] [CrossRef]
  53. Zhang, M.; Li, R.; Pei, W.; Zhou, Y.; Li, G.; Yang, S. Permafrost Degradation Risk Evaluation in the Qinghai-Tibet Plateau Under Climate Change Based on Machine Learning Models. J. Geophys. Res. Atmos. 2024, 129, e2023JD039611. [Google Scholar] [CrossRef]
  54. Guo, D.; Wang, H. Simulation of permafrost and seasonally frozen ground conditions on the Tibetan Plateau, 1981–2010. J. Geophys. Res. Atmos. 2013, 118, 5216–5230. [Google Scholar] [CrossRef]
  55. Ran, Y.; Li, X.; Cheng, G. Climate warming over the past half century has led to thermal degradation of permafrost on the Qinghai–Tibet Plateau. Cryosphere 2018, 12, 595–608. [Google Scholar] [CrossRef]
  56. Langer, M.; Von Deimling, T.S.; Westermann, S.; Rolph, R.; Rutte, R.; Antonova, S.; Rachold, V.; Schultz, M.; Oehme, A.; Grosse, G. Thawing permafrost poses environmental threat to thousands of sites with legacy industrial contamination. Nat. Commun. 2023, 14, 1721. [Google Scholar] [CrossRef]
  57. Zhao, Y.; Yu, B.; Yu, G.; Li, W. Study on the water-heat coupled phenomena in thawing frozen soil around a buried oil pipeline. Appl. Therm. Eng. 2014, 73, 1477–1488. [Google Scholar] [CrossRef]
  58. Wang, J.; Wu, Q.; Yuan, Z.; Kang, H. Soil respiration of alpine meadow is controlled by freeze–thaw processes of active layer in the permafrost region of the Qinghai–Tibet Plateau. Cryosphere 2020, 14, 2835–2848. [Google Scholar] [CrossRef]
  59. Wang, S.; Li, R.; Wu, T.; Zhao, L.; Wu, X.; Hu, G.; Yao, J.; Ma, J.; Liu, W.; Jiao, Y. Evaluating the Impact of Soil Enthalpy upon the Thawing Process of the Active Layer in Permafrost Regions of the Qinghai–Tibet Plateau Using CLM5. 0. Remote Sens. 2022, 15, 249. [Google Scholar] [CrossRef]
  60. Mazhar, U.; Jin, S.; Duan, W.; Bilal, M.; Ali, M.A.; Farooq, H. Spatio-temporal trends of surface energy budget in Tibet from satellite remote sensing observations and reanalysis data. Remote Sens. 2021, 13, 256. [Google Scholar] [CrossRef]
Figure 1. General view of the QTP and locations of the sites studied: (XDT, BLH, TGL, LDH, and TSH site), the background color is altitude (km).
Land 13 01609 g001
Figure 2. The simulation results for the soil liquid moisture under two groups of tests (blue line: with freeze–thaw process experiment; orange line: without freeze–thaw process experiment) at three sites (left column: TGL station; middle column: BLH station; right column: XDT station) for different soil depths (first row: 5 cm; second row: 10 cm; third row: 20 cm; fourth row: 40 cm), (a) TGL, 5 cm; (b) BLH, 5 cm; (c) XDT, 5 cm; (d) TGL, 10 cm; (e) BLH, 10 cm; (f) XDT, 10 cm; (g) TGL, 20 cm; (h) BLH, 20 cm; (i) XDT, 20 cm; (j) TGL, 40 cm; (k) BLH, 40 cm; and (l) XDT, 40 cm.
Land 13 01609 g002
Figure 3. The simulation results for the soil temperature under two groups of experiments (blue line: with freeze–thaw process experiment; orange line: without freeze–thaw process experiment) at three sites (left column: TGL site; middle column: BLH site; right column: XDT site) for different soil depths (first row: 10 cm; second row: 50 cm; third row: 80 cm; fourth row: 210 cm), (a) TGL, 10 cm; (b) BLH, 10 cm; (c) XDT, 10 cm; (d) TGL, 50 cm; (e) BLH, 50 cm; (f) XDT, 50 cm; (g) TGL, 80 cm; (h) BLH, 80 cm; (i) XDT, 80 cm; (j) TGL, 210 cm; (k) BLH, 210 cm; and (l) XDT, 210 cm.
Land 13 01609 g003
Figure 4. Time series of SEB (Unit: Wm−2) (a) latent and (c) sensible heat flux, (b) ground heat flux, and (d) net radiation flux in CTL (red line) and TEST (green line) experiments at TGL site.
Land 13 01609 g004
Figure 5. The same as Figure 4, but for BLH site.
Land 13 01609 g005
Figure 6. The same as Figure 4, but for XDT site.
Land 13 01609 g006
Figure 7. Net radiation flux accumulation effects on AL thawing depth at (a) TGL, (b) LDH, (c) TSH, and (d) XDT site.
Land 13 01609 g007
Figure 8. Schematic diagram of the interaction between the AL freeze–thaw process and SEB.
Land 13 01609 g008
Table 1. Overview of the study sites.
Study SiteLongitude (°E)Latitude (°N)Altitude (m)Vegetation TypeStudy Period
TGL91°01′32°58′5100Alpine meadow2006.1.1–2007.12.31
XDT94°08′35°43′4538Alpine meadow2011.1.1–2013.12.31
BLH92°55′34°49′4656Alpine meadow2009.1.1–2010.12.31
LDH91°44′31°49′4808Alpine wet meadow2017.1.1–2017.12.31
TSH79°33′35°22′4844Alpine dessert2016.1.1–2017.12.31
Table 2. Observation items and corresponding equipment information.
Observation ItemsInstrumentation and EquipmentMonitoring FrequencyError Range
Air temperatureHMP45C, Vaisala30 min±0.5 °C
Air humidityHMP45C, Finland30 min±3% RH
Wind05103_L/RM, Campbell, USA30 min±0.3 m/s
PrecipitationT-200B Precipitation Gauge30 min±0.1 mm
Upward longwave/shortwave radiation fluxCM3, Kipp & Zonen, The Netherlands30 min±10%
Downward longwave/shortwave radiation fluxCM3, Kipp & Zonen, The Netherlands30 min±10%
Soil temperature105T/10930 min±0.1 °C
Soil moistureCS61630 min±2.5%
Table 3. The comparison of SEB (W m−2) in CTL and TEST experiments during freeze–thaw process at TGL site.
Energy FluxTest Name8.01–8.238.24–10.710.8–12.612.7–4.94.10–7.31
Thawing Stage
(W·m−2)
Complete Thawing
Stage (W·m−2)
Freezing Stage
(W·m−2)
Complete Freezing
Stage (W·m−2)
Thawing Stage
(W·m−2)
Rn *CTL113.6399.424.315.85113.66
TEST113.5999.2926.3521.47118.22
G0 *CTL8.674.04−15.53−5.0320.56
TEST8.624.79−9.38−3.516.16
H *CTL65.5954.732.7917.4541.64
TEST65.554.4225.2515.683.36
LE *CTL39.3740.47.061.151.94
TEST39.4640.1210.469.3760.5
* Rn: net radiation flux; G0: ground heat flux; H: sensible heat flux; LE: latent heat flux.
Table 4. Measured soil texture data at TGL and XDT sites.
Depth (cm) TGL XDT
Sand (%)Clay (%)Gravel (%)Sand (%)Clay (%)Gravel (%)
9757268212
167012128016
266513118213
40855277622
Disclaimer/Publisher’s Note: The statements, opinions and data contained in all publications are solely those of the individual author(s) and contributor(s) and not of MDPI and/or the editor(s). MDPI and/or the editor(s) disclaim responsibility for any injury to people or property resulting from any ideas, methods, instructions or products referred to in the content.

