Article

Dynamics of Built-Up Areas and Challenges of Planning and Development of Urban Zone of Greater Lomé in Togo, West Africa

by
Têtou-Houyo Blakime
1,
Kossi Adjonou
2,*,
Kossi Komi
3,4,
Atsu K. Dogbeda Hlovor
2,
Kodjovi Senanou Gbafa
1,
Jean-Bosco Benewinde Zoungrana
5,
Botolisam Polorigni
2 and
Kouami Kokou
2
1
Polytechnic School of Lome, University of Lome, Lome 01 BP 1515, Togo
2
Forestry Research Laboratory (LRF), Faculty of Science, University of Lome, Lome 01 BP 1515, Togo
3
Regional Center of Excellence on Sustainable Cities in Africa (CERViDA-DOUNEDON), University of Lome, Lome 01 BP 1515, Togo
4
Research Laboratory on Spaces, Exchanges and Human Security (LaREESH), University of Lome, Lome 01 BP 1515, Togo
5
WASCAL Master Research Programme in Informatics for Climate Change, University Joseph KI-ZERBO, Ouagadougou 03 BP 7021, Burkina Faso
*
Author to whom correspondence should be addressed.
Land 2024, 13(1), 84; https://doi.org/10.3390/land13010084
Submission received: 16 November 2023 / Revised: 25 December 2023 / Accepted: 26 December 2023 / Published: 11 January 2024
(This article belongs to the Special Issue Smart Land Use Planning II)

Abstract

:
The expansion of African cities leads to the occupation of peripheral urban areas without respecting planning rules. The Greater Lomé (Togo) is no exception to this phenomenon of high-speed horizontal spreading, which causes recurrent flooding. The objective of this research is to understand the spatio-temporal changes in the dynamics of built-up areas in Greater Lomé. The methodology used is based on the analysis of Landsat images from the years 2007, 2012, 2016, and 2020 coupled with direct field observations and a literature review. The results showed an increase in residential areas to the detriment of the other land use/cover types. Estimated at 15,481 ha in 2007, the built-up area reached 35,521 ha in 2020, an increase of 33% to the detriment of vegetation and cultivation areas. This increase was marked by constructions in the floodplain of the Zio River. The field surveys revealed an increase in the density of most of the agglomerations. From 1863 ha in 2007, they increased to 14,485 ha in 2020, an increase of 12,622 ha or approximately 33%. These results indicate that attention needs to be paid to both the planning and control of the development of spaces in the outlying areas of Greater Lomé.

1. Introduction

Urban sprawl, broadly defined as dispersed, excessive, and wasteful urban growth, characterized by the excessive use of land for the building of single-family houses in the suburbs [1], is increasingly observed in recent years in African cities. This urban explosion has placed the problem of the surge of populations on the urban outskirts at the center of debates on the city. While the developed countries are collapsing in the face of the crisis in the suburbs marked by violence and bad living, the population of the countries of the South exerts strong pressure on the outskirts of cities [2], since the actual infrastructure built without any official urban plan do not provide for any urban service let alone the preservation of the surrounding ecology [3]. The main cause of these pressures is the rapid increase in local populations [4] combined with the absence of city extension policies or the implementation of certain master plans [5].
Africa’s high population growth rate makes the demographic explosion one of the most important causes of land use changes in African cities. The latter is characterized by a peri-urban ring, which is a transition between the rural environment and the urban environment [6,7,8]. Under the weight of vertiginous demographic growth, the peri-urban zone is receding, giving way to an urbanized area and, in turn, transforming its periphery, which was once rural. The urbanization of peripheral zones appears to be the essential form of growth for West African cities. It is manifested everywhere by a sprawl of residential areas, which sometimes pushes the limits of the city to considerable distances from the urban center [9]. Despite multifaceted consequences, such as the housing and transport crisis, precarious employment, and a lack of sanitation [10], climatic factors in general and heat islands in particular [11] are considered today as consequences of a reduction in vegetation cover in residential areas.
Many studies on the dynamics of land use and land cover in urban areas have been performed during the last decades in various parts of the world. For instance, in Latin America, ref. [12] analyzed the land cover dynamics along the urban–rural gradient of the Port-au-Prince agglomeration (Republic of Haiti) from 1986 to 2021 and found that the landscape has undergone significant changes because of the “high demand for housing” while in Asia, ref. [13] estimated, determined the patterns, and identified the potential drivers of land-use changes during 1995–2015 in an urbanizing tropical watershed in Indonesia. They found, among other results, a major change from agricultural to urban areas in the study area. In Europe, the relationships between the spatial and temporal dynamics of land use and land cover (LULC), the hydro-geomorphological processes, and their impacts were evaluated by [14]. They showed a highlighted increase in artificial areas for the period 1958–2018. In West Africa, land use and land cover dynamics were analyzed in Calabar Metropolis (Nigeria) by [15] using a combined approach of remote sensing and a geographic information system. Their studies showed an increased trend in built-up areas from 2002 to 2016. Moreover, by analyzing the global satellite data of 120 cities, ref. [16] found that cities “fragmented” a large area of landscapes. With the urban extension that can be observed everywhere in the world, the monitoring of territorial dynamics has taken an important place in the context of urban planning. It then appeared necessary to have reliable, precise, and continuously updated data on the evolution of the territory [17,18].
However, little has been done to understand land use and land cover dynamics in the urban areas of Greater Lomé. Thus, the main objective of this work is to understand the spatial and temporal dynamics of built-up areas in Greater Lomé with a view to providing guidelines for sustainable urban planning in the study area. Specifically, it aims to analyze (i) land use and land cover changes in relation to the evolution of buildings as well as (ii) trends in the annual rate and change matrix of LULC.
The city of Lomé is today the largest city in Togo whose development exceeds all forecasts. The observation is the strong spatial growth due to demographic pressure and the need for city dwellers to find housing. The majority of housing is built through the informal sector in the city center or on its outskirts, which gives rise to spontaneous outlying districts. The urban policies of Togo are those where the public power of urbanization is out of phase with the occupation of spaces by the population. In Lomé, the development of outlying districts was the work of customary landowners outside of any control by the state and local authorities. It was favored by the housing problems, which continue to worsen. These owners did not comply with the subdivision procedures provided for by law, in particular, obtaining the agreement of the minister in charge of town planning before any fragmentation [19,20]. This should help to monitor compliance with planning and has resulted in a dramatic increase in the area of the city. Thus, since the 1970s, the extension of Greater Lomé towards its peripheral margins has started attracting the attention of researchers, who have not hesitated to develop research themes within the framework of numerous scientific works. The literature indicates that an increase in the population results in accelerated demand for natural resources, resulting in ecosystem and landscape degradation [21].
Finally, it is important to note that the ecosystem and associated landscapes provide important services, such as oxygen production, carbon sequestration, flood control, food, and cultural services. These landscapes provide urban dwellers with opportunities for tourism and recreation [22]. This growth is characterized by the extension of the outskirts described as an “unfinished landscape” where facilities are lacking [23,24].

2. Materials and Methods
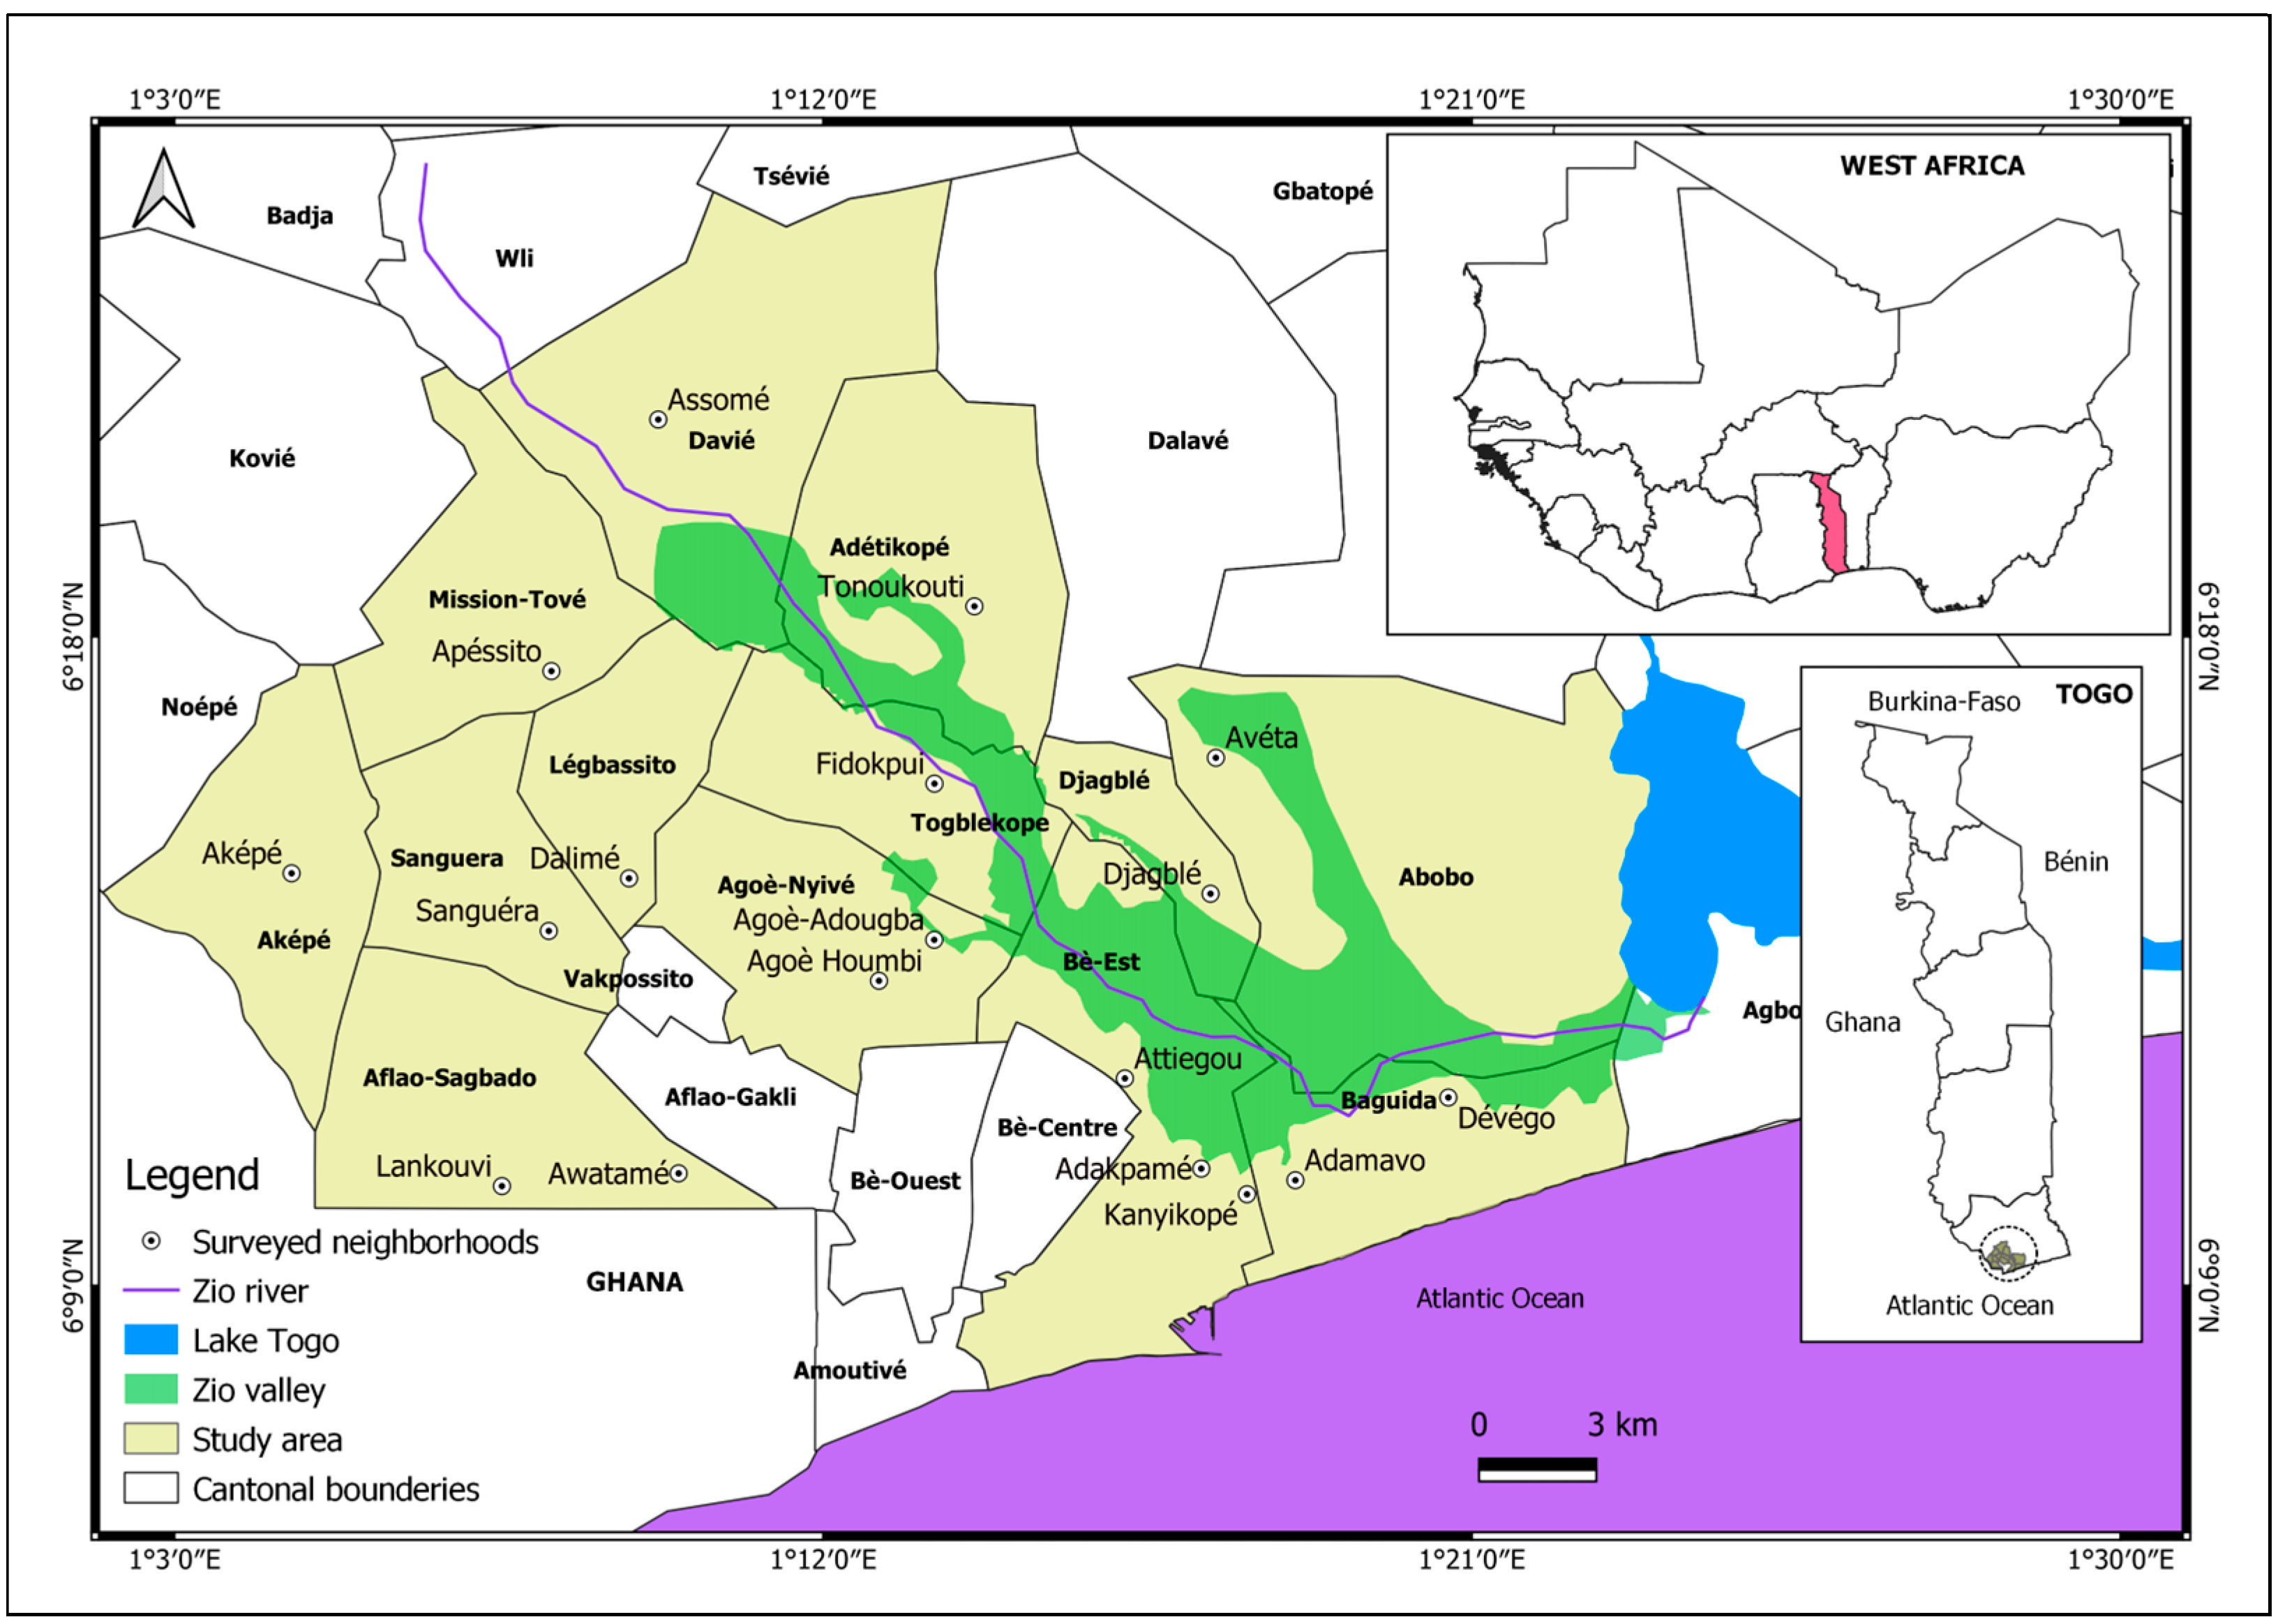
2.1. Study Area

This study was performed in the agglomeration and the peripheral areas of Greater Lomé, the capital town of Togo. The study area is located between 6°06′–6°25′ North latitudes and 1°15′–1°45′ East longitudes (Figure 1). It is composed of 152 neighborhoods [25] and has a population of 2,188,376 [26]. The district of Greater Lomé has an area of 61,315 ha and is composed of two prefectures (six communes for the Agoènyivé prefecture and seven communes for the Gulf prefecture) as well as a few localities of the Zio and Avé prefectures (Djagblé, Aveta, and Akepe).

2.2. Data Acquisition

The data used in this study were derived from Landsat images (30 m × 30 m resolution) at the end of the dry season (January–February) in order to obtain satellite images with very low cloud cover (less than 10%). These satellite images were obtained from the Center for Earth Resources Observation and Science (https://earthexplorer.usgs.gov/, accessed on 1 January 2020). The images without cloud cover and characteristics not affected by seasonality were considered in this study. The use of data from the same season has the advantage of providing homogeneous spectral and radiometric characteristics. It reduces the seasonal variation in the spectral reflectance of the different land cover types [27,28]. The level-2 products (surface reflectance) of the Landsat 7 and Landsat 8 satellites from 2012, 2016, and 2020 were selected in order to obtain geometric, radiometric, and atmospheric corrected data (Table 1). Moreover, the Landsat images were used for data analysis for several reasons: (i) the availability of several images up to 2002, (ii) open-source data, (iii) good spectral resolution, and (iv) the spatial resolution (30 m) is sufficient to distinguish forest/non-forest classes and, thus, limits the amount of data to be processed. In addition, Landsat images have good radiometric and geometric qualities to carry out land use dynamics analyses [29].

2.3. Determination of Building Occupancy Classes

The land use and land cover (LULC) classes were defined in two stages. Initially, two LULC classes were defined: built-up areas and other land occupations, such as water bodies and vegetated areas. Secondly, it was useful to differentiate in each class the “housing zone”: three (03 subclasses (Table 2).

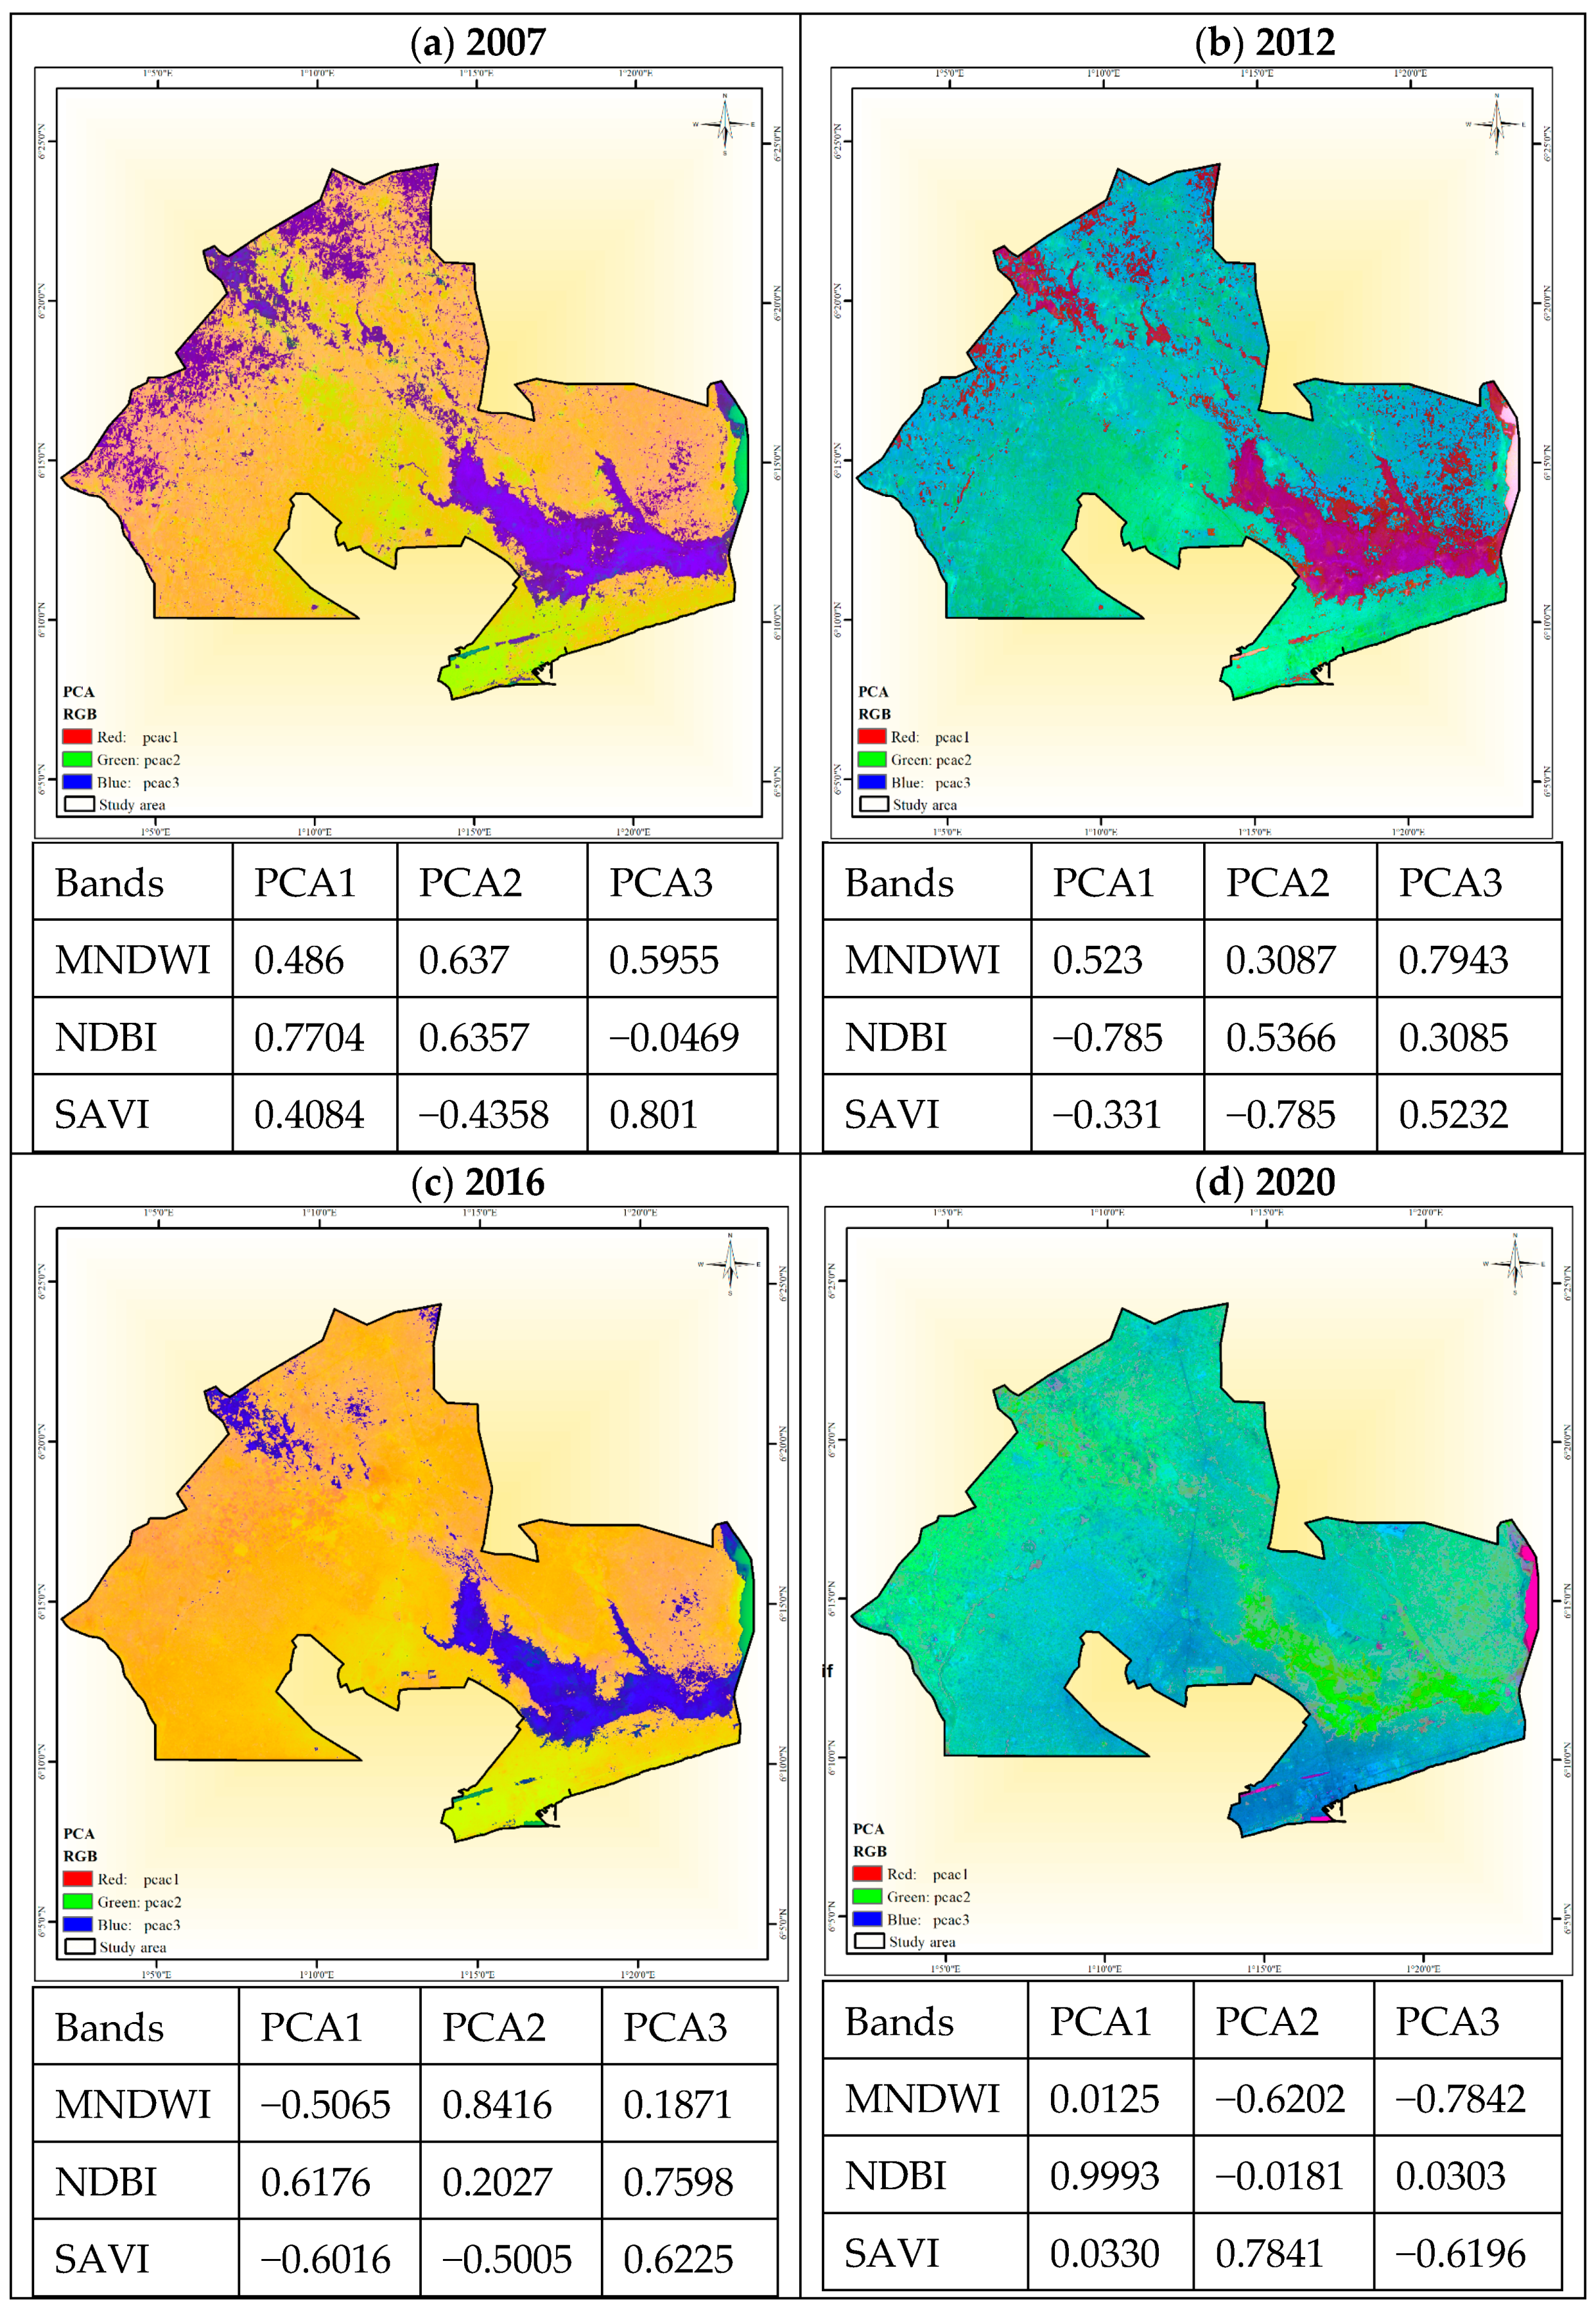
2.4. Processing of Satellite Data and Classification

The classification was performed using the Random Forest (RF) algorithm based on 312 reference data (occupation classes). This algorithm was selected for its good predictive abilities of land cover [30,31] and for temporal analysis [32]. Moreover, the RF provides means to estimate missing values and perform multiple types of data analysis, including regression, classification, and unsupervised learning [33].
In order to maximize the band information and improve the discrimination of the land use and land cover (LULC) classes, a principal component analysis (PCA) was calculated on the indices derived from the primary channels of the satellite images. The PCA was then used to perform a classification based on the training plots collected during the field survey. These indices included the normalized building difference index (NDBI), the soil adjustment vegetation index (SAVI), and the normalized humidity difference index (MNDWI) [34].
The NDBI values vary between −1.0 and +1.0. The highest value represents built-up areas, the lowest value indicates vegetation, and the negative value signifies water bodies. In NDBI methods, it is assumed that all positive NDVI and NDBI values represent vegetation and built-up areas. This approach is prone to many errors. Consequently, the Built-Up Index (BU) minimizes this error by subtracting the NDVI from the NDBI.
The Soil Adjustment Vegetation Index (SAVI) is a transformation technique used to minimize the influence of soil brightness from spectral vegetation indices involving red and near-infrared (NIR) wavelengths. The SAVI is calculated using the following Equation (1):
SAVI = ((NIR − Red)/(NIR + Red + L)) × (1 + L)
where L denotes a correction factor for soil brightness. To take into account the ground brightness for most land use and land cover types, L types are defined as 0.5.
The normalized humidity difference index (MNDWI) is a remote-sensing-based indicator that is sensitive to changes in leaf water content [35]. The MNDWI mitigates the errors of the NDWI by extracting the water content from remote sensing data. The Modified Normalized Difference Index for water uses the green and Short-Wave Infrared Red (SWIR) bands to highlight the characteristics of open water dominated by built-up areas. It removes noise from built-up areas, vegetation, and soil. The NDWI value ranges from −1.0 to +1.0. In general, positive values above 0.5 indicate bodies of water, while lower values of 0–0.2 indicate built-up areas and negative values indicate vegetation.
Using the three (03) different indices (NDBI, SAVI, and MNDWI), a PCA was carried out for the 4 years considered in this study, namely 2007, 2012, 2016, and 2020. The results of this analysis were used to assess the quality of the classification (Figure 2).

2.5. Accuracy Assessment

An evaluation of the quality of the classifications is performed by computing the confusion matrix [36] and the Kappa (K) coefficient expressed as the probability of correct classification [37,38]. The Kappa (K) coefficient, developed by Cohen [39], is a powerful and widely used statistical measure to assess the inter-raster agreement between variables [40]. The Kappa coefficient is extensively used because each element in the classification error matrix contributes to its calculation [41]. It lies between 0 and 1. The latter indicates total agreement and is often multiplied by 100 to give a percentage measure of the classification accuracy. Moreover, the Kappa values are subdivided into 3 groups: strong agreement (Kappa > 80%), moderate agreement (40% ≤ Kappa ≤ 80%), and poor agreement (Kappa < 40%) [41].
A stratified random sampling method was used in the accuracy assessment based on the observed data and a visual interpretation (expert knowledge). In addition, 300 points were generated for each of the classified images. Each point had specific color and pixel values, which were considered reference values. All the points that were randomly generated were then identified by the user and assigned to different LULC classes.
As suggested by [42], the overall accuracy of the two maps must be multiplied in order to evaluate the overall accuracy of the overlaid classification and verify the mis- classified errors. Furthermore, [42] emphasises the need not to proceed with the analysis when the computed accuracy is not acceptable. To determine whether the comparison is still useful, the accuracy value should always be compared to a previously defined threshold of acceptance. In this study, we adopted the accuracy threshold of 75% used by [42] for the final product of the two overlaid classifications.

2.6. Change Detection

The classified maps were compared using a change matrix in Orfeo ToolBox (version 8.1.2) and QGIS software (version 3.30) in order to obtain the changes in the different classes for the different periods considered in this study [43]. Moreover, the results of the LULC area distribution were used to compute the LULC trends, net change, percent change, and rate of LULC between the years 2007 and 2012, 2012 and 2016, and 2020 as well as for the periods 2007 and 2020. In order to calculate the percentage change (%), the initial and final LULC area coverages were compared using the following Equation (2):
R a t e   o f   c h a n g e ( % ) = ( P r e s e n t   L U L C   a r e a P r e v i o u s   L U L C   a r e a ) / ( P r e v i o u s   L U L C   a r e a ) × 100
To obtain the annual rate of change for each LULC type, the rate of change of the final year was subtracted from the one of the initial year and then divided by the total number of years using the following Equation (3):
A n n u a l   R a t e   o f   C h a n g e = ( F i n a l   Y e a r I n i t i a l   Y e a r ) / ( t o t a l   n u m b e r   o f   Y e a r s )
A post-classification change matrix was further used to analyze these changes. This post-classification change detection technique provides important information about the spatial distribution of LULC [44]. A land use change matrix displaying the LULC was generated from the classified images of 2007, 2012, 2016, and 2020. Finally, a change matrix from 2007 to 2020 was generated to assess the overall changes in the LULC classes between 2007 and 2020 for Greater Lomé.

3. Results

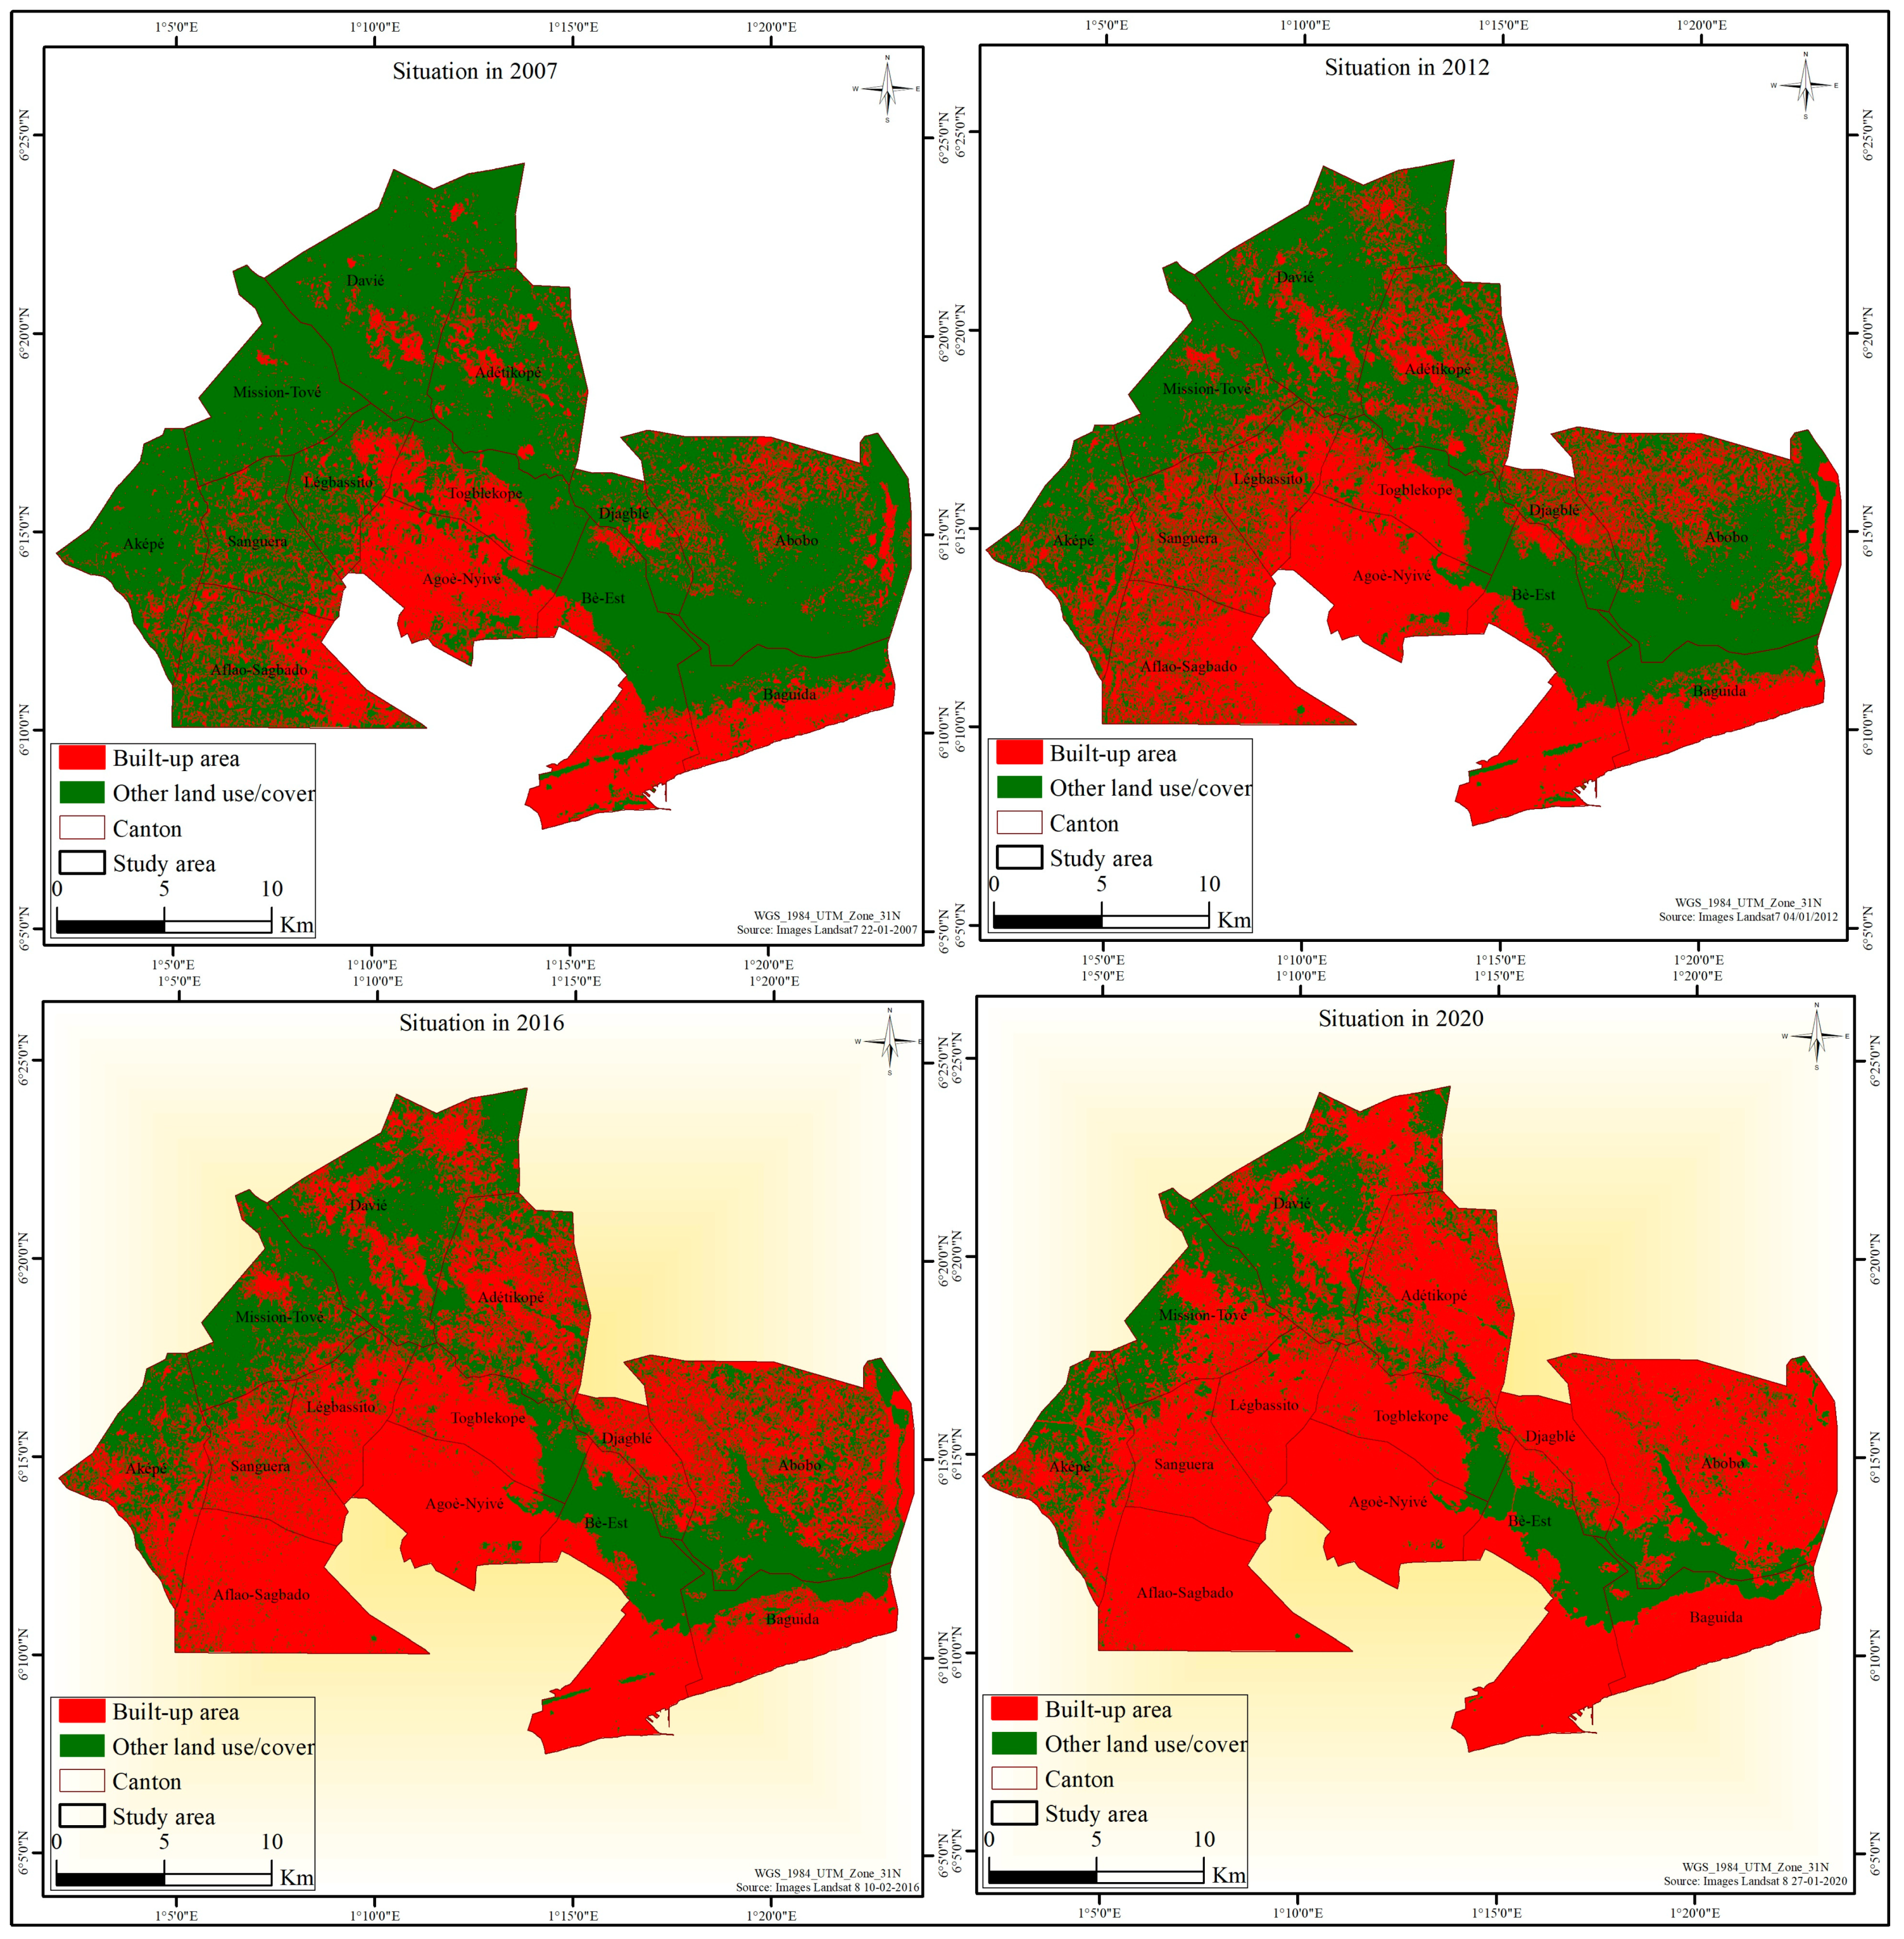
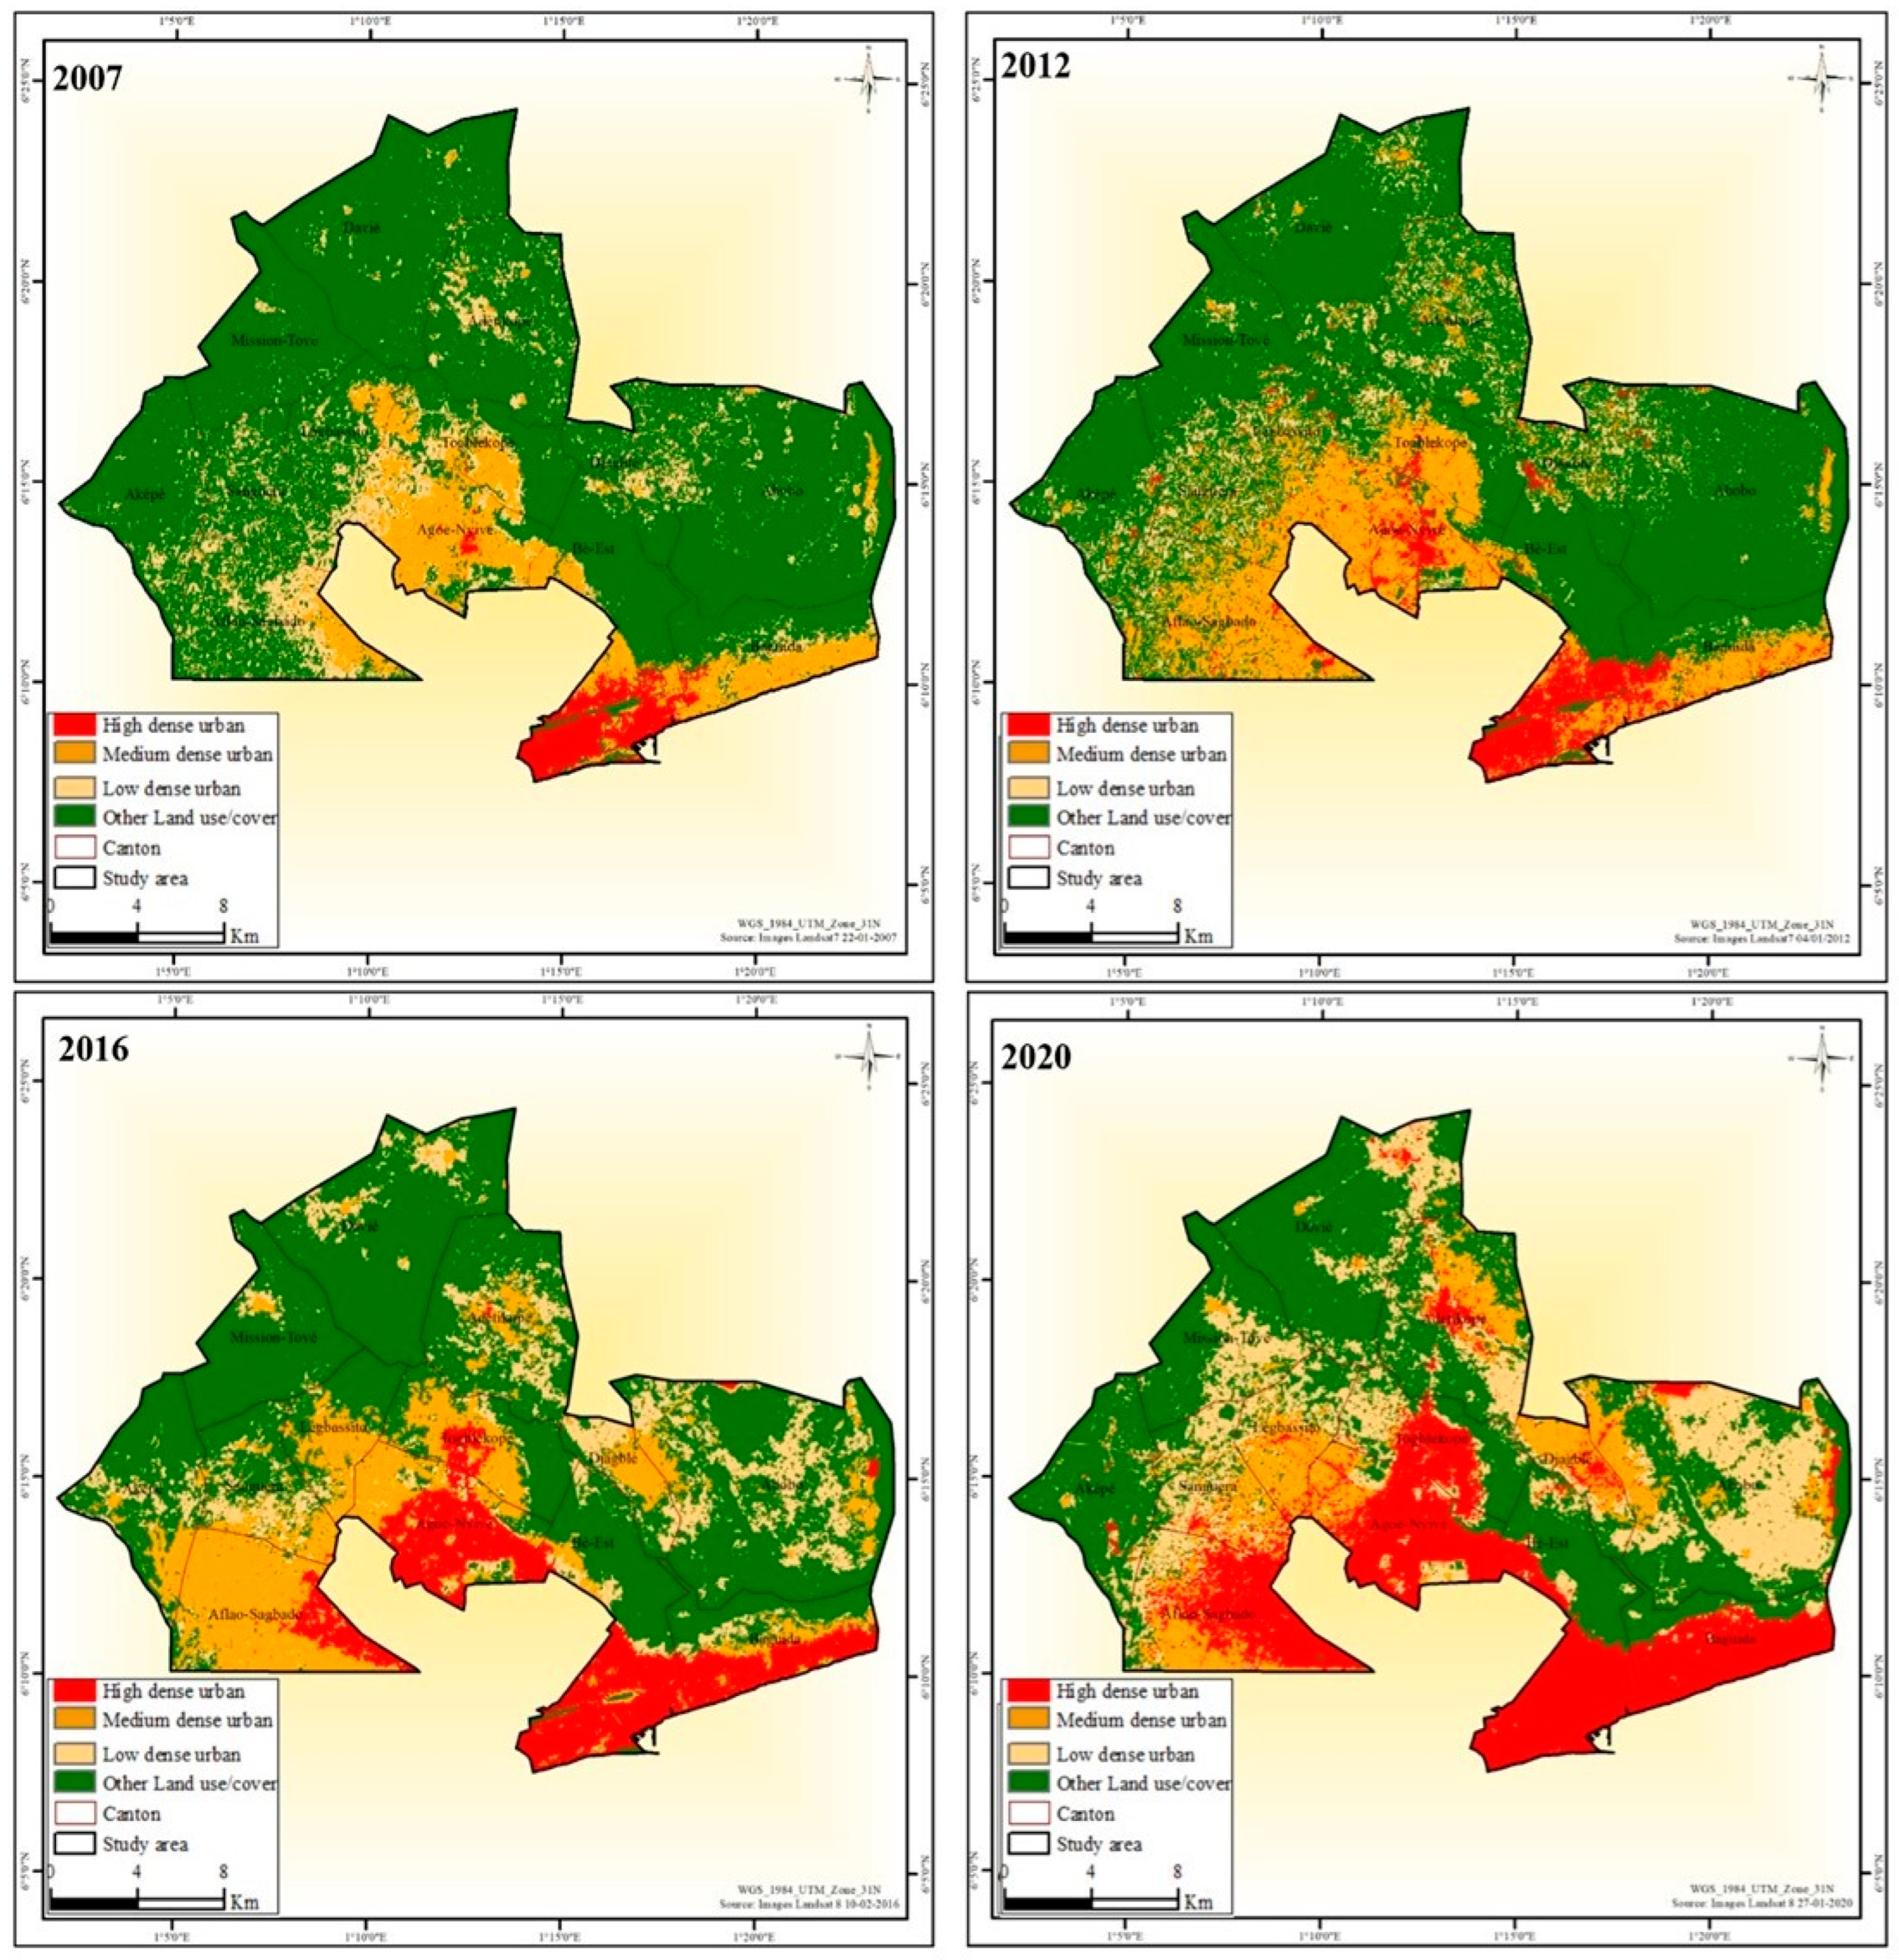
3.1. Land Use/Cover Dynamics in Relation to the Evolution of Buildings

The outskirts of the city of Lomé have undergone a remarkable change in LULC in relation to the evolution of buildings. The results of the pixel-level accuracy assessment are presented in Table 3.
Since the overall accuracy values are between 91% and 95%, we can confirm that the classification is quite good for an analysis of the dynamics of land use in relation to the evolution of buildings (Table 3).
In general, the proportion of the urbanized zone has increased from 2007 to 2020 to the detriment of the vegetation and agricultural zones of land use (Table 4). This progression is pronounced as one advances in time (Figure 3).
The analysis of the spatial distribution of built-up areas showed that the moderately built-up areas (areas with moderate density) have increased at the expense of the sparsely built-up areas (low-density areas) in some localities, such as Aflao Gakli, Togblékopé, Agoè-Nyivé, Adétikopé, and Djablé, which were peripheral areas at this period. At the same time, new sparsely built areas (low-density areas) appeared in these localities in addition to those that appeared in the outermost areas of greater Lomé, such as the Mission de Tové, Davié, Aképé, and Abobo during the same period. This situation compensates for the lightly built-up areas that have evolved into moderately built-up areas. The medium and low-density classes also increased slightly (Figure 4).
In addition, the analysis of the LUCLC dynamics showed that the proportions of highly dense built-up areas increased significantly between 2007 and 2020, increasing from 1863 hectares to 14,485 hectares. From 2012 to 2016, the proportion of highly built-up, moderately built-up, and weakly built-up areas has increased, respectively, from 5956 to 6299 ha, 8207 to 10,674 ha, and 6761 to 8649 ha (Table 5).
It appears that from 2007 to 2020, there were significant conversions from other land cover classes (water, bare soil, vegetated areas, crops, and pasture) to those of built-up areas as a whole. On the other hand, there were no significant conversions of built-up areas into other classes of land use during the entire study period, and these have evolved over time from downtown Lomé to the peripheral areas of Greater Lomé. A gradual regression of green spaces was observed throughout the study area. This situation is largely due to the progression of urbanized spaces to the detriment of woodlots, fields, etc. These maps show that land use trends progress in the direction of urban sprawl. At the same time, we are witnessing the densification of buildings from the city center to the outskirts of Greater Lomé. The minimal conversions that were observed from built-up areas to other LULC classes can be justified for places where houses have been washed away by floods, rendering these places uninhabitable and subsequently occupied by vegetation.
Some direct observations during the fieldwork have enabled the identification of dwellings in some flood-prone areas of the Zio River (Figure 5). These houses were abandoned by the owners and remain dilapidated during the rainy season (Figure 6).
Other areas that appeared to be lowlands but built by the population have also been listed. The inhabitants of these houses are forced to leave their homes during the rainy season and return to them during the dry season when the waters recede.

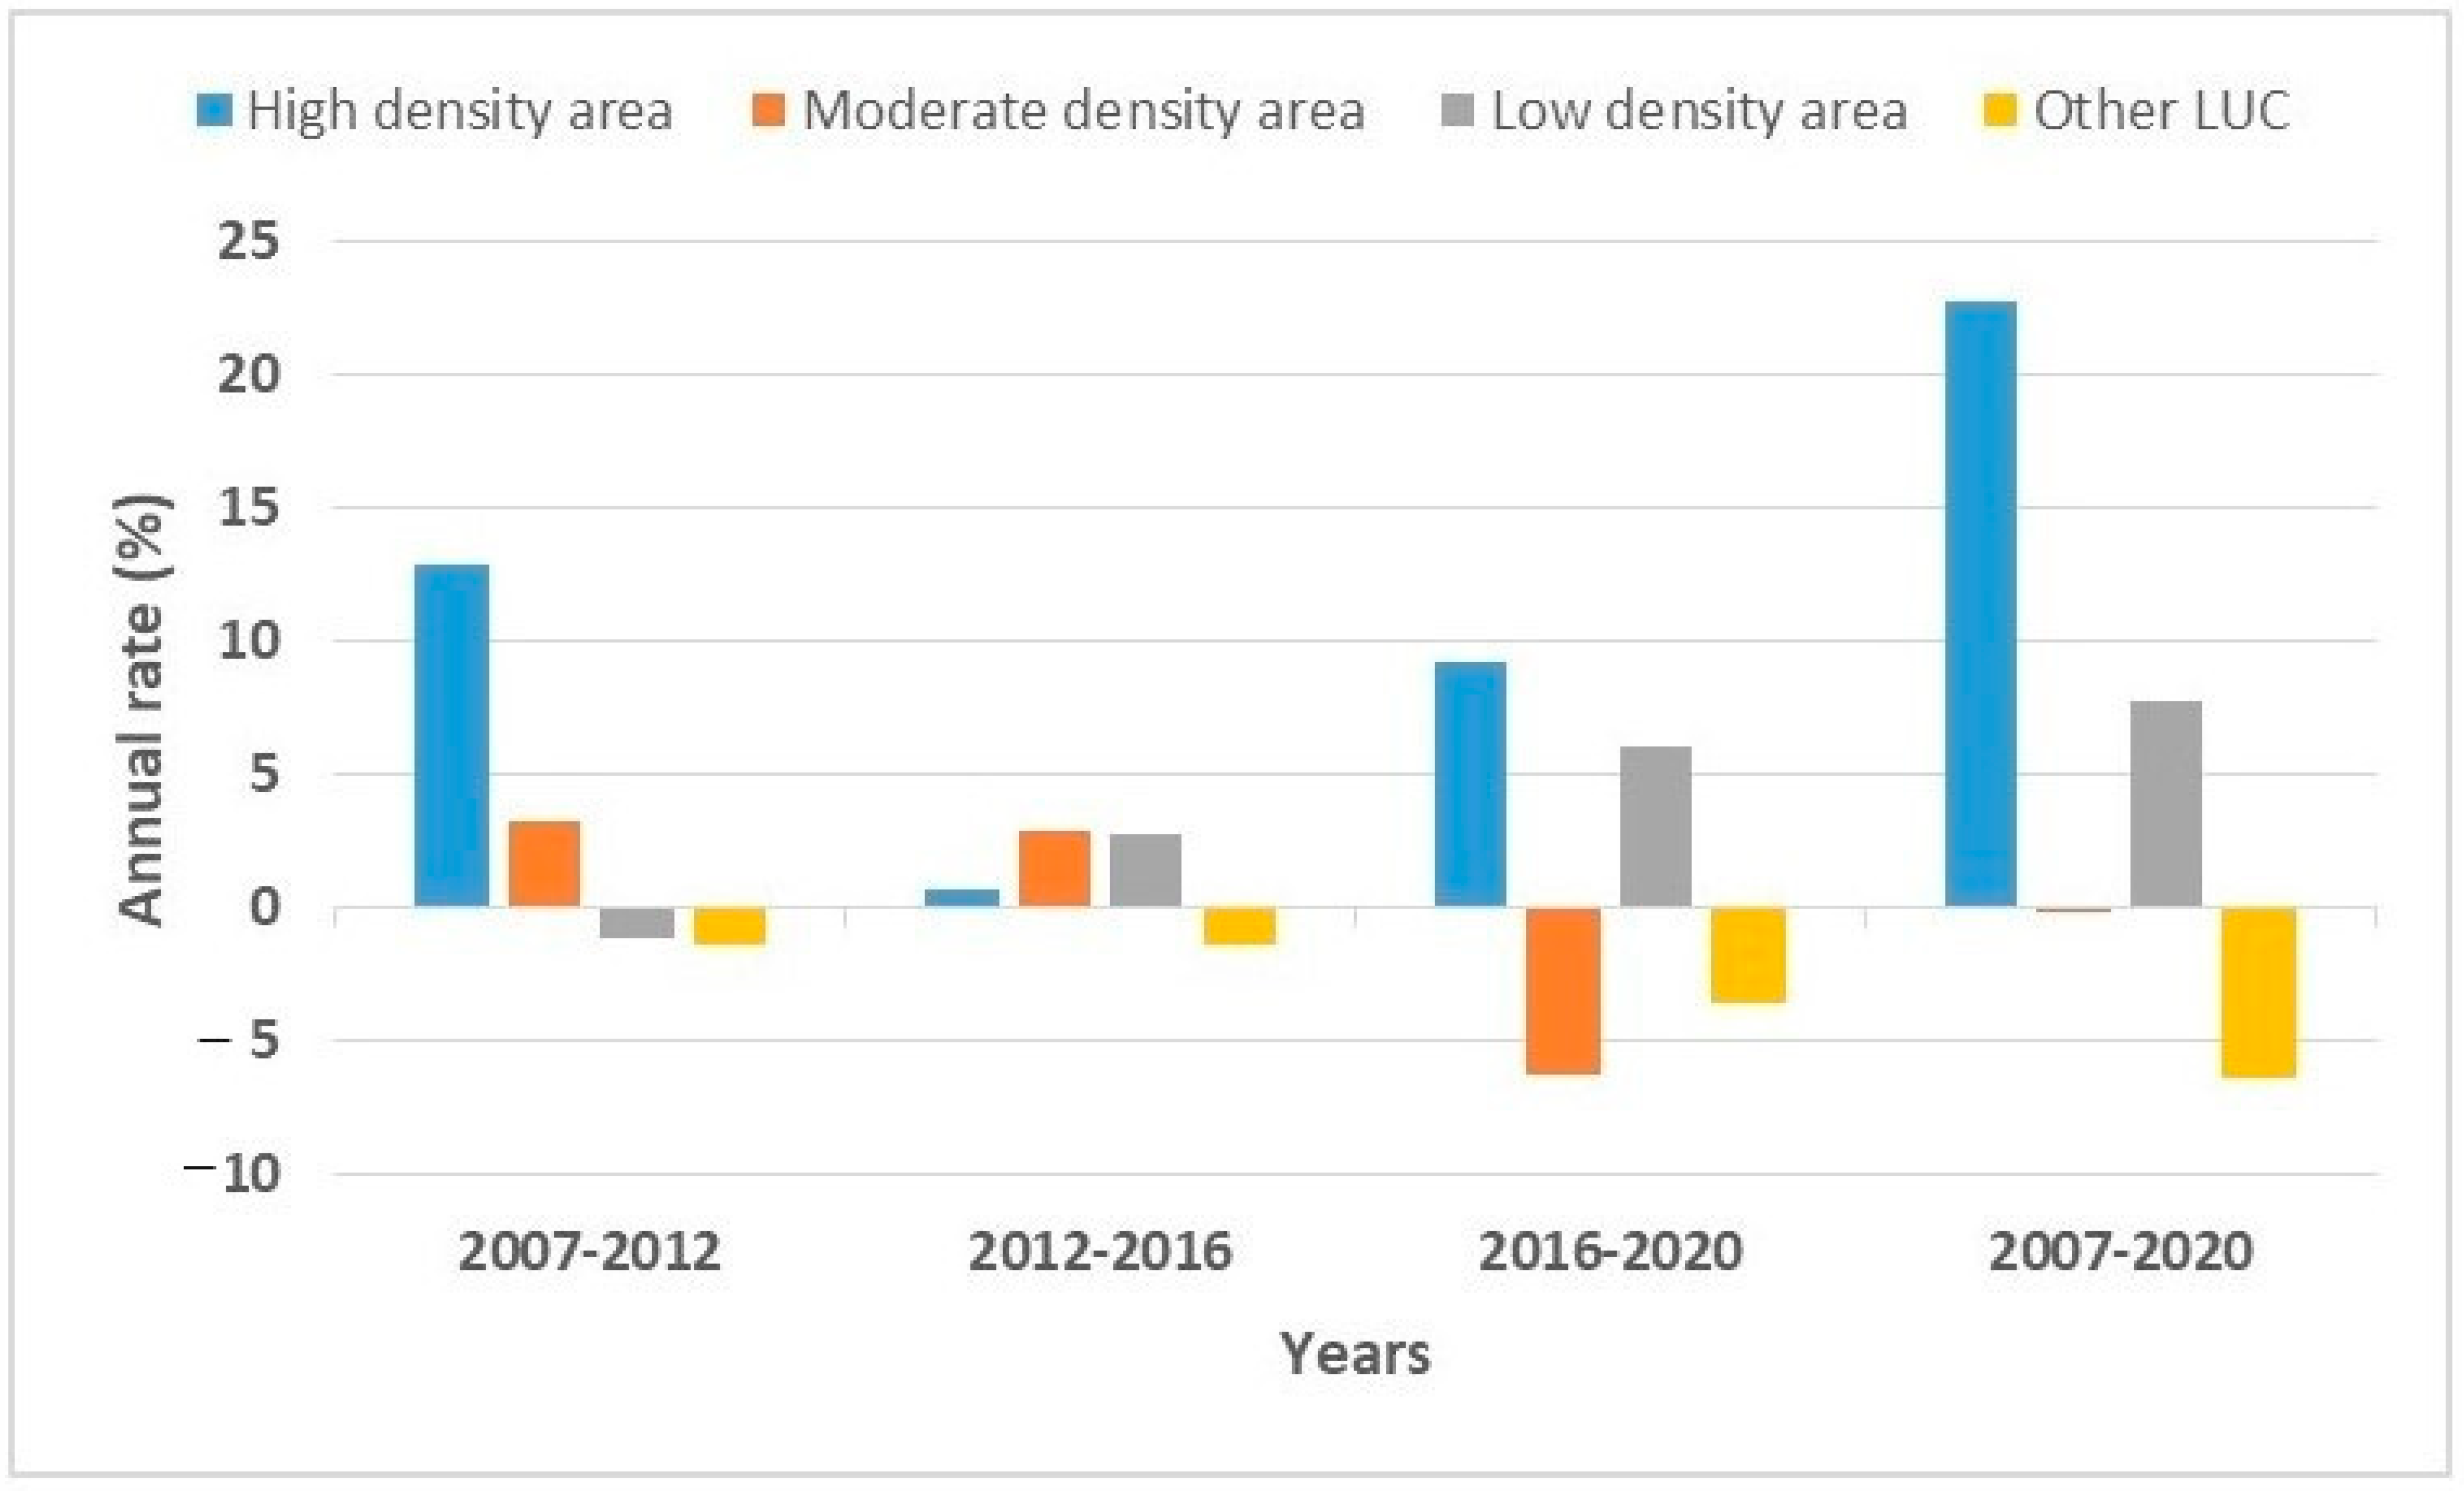
3.2. Trends in Annual Rate and Change Matrix of Land/Cover in Greater Lomé

The study revealed that there was an increase in the “High-density area” during the years 2007–2020, which shows an increase in the rate of change (22.79 ha/year) (Figure 7). The same trend of increase was observed in the “Low-density area” for the same period (2007–2020), with an estimated rate of change of 7.72 ha/year, except for the years 2007–2012 when a regression was observed (−1.12 ha/year).
The maximum change rate (−6.39 ha/year) was recorded for “Other classes” during the period 2007–2020. The “Moderate-density areas” were characterized by trends, with an increase in the built-up areas from 2007 to 2016 and an annual rate of change estimated at 3.23 ha/year (2007–2012) and 2.92 ha/year (2012–2016), respectively. However, the 2016–2020 period was marked by a regression in this land use, with an estimated annual rate of −6.29 ha/year. In summary, for the areas characterized by “Moderate-density area”, the overall regression was estimated at −0.14 ha/year during the period 2007–2020 (Figure 7).
The LULC change matrix of Greater Lomé during the period 2007–2020 showed the conversion of one LULC class to another type of LULC. The increase in the magnitude of the “High-density area” from 2007 to 2020 is mainly due to the conversion of the “Moderate-density area” and “Other classes” (Table 6). The “Low-density areas” are the main land use/cover classes that converted to “High-density areas” from 2007 to 2012, resulting in a net increase of 1.62 ha/year of “High-density area”. The decrease in “Other classes” of LULC is attributed to the conversion of this land use/cover type to other major classes (i.e., “High-density area”, “Moderate-density area”, and “Low-density area” (Table 6).

4. Discussion

This study revealed that the changes in LULC concern three (03) categories: dense zone (heavily built-up area), moderate-density zone (moderately built-up area), and low-density zone (weakly built-up area). Indeed, as one progresses from the countryside towards the center of a city, one can observe a tightening of the plot design, a convergence and densification of the communication networks, and a change in the assignments of which the most spectacular is undoubtedly the densification of buildings [45]. Similar results were obtained during the study of landscape dynamics in the upper Ouémé basin (Benin Republic) using Landsat imagery [46]. Land use and land cover change is one of the major driving forces of global environmental change and is of major concern because of its impacts on various sectors of the economy [47]. These changes take place temporally and spatially such as the extent of area and the intensity of LULC. It appears that human activities have caused an increase in land utilization, change, and alteration [7]. Some large areas of Greater Lomé and mainly natural vegetation have been turned into “high-density” and “low-density” areas due to an increase in pressure from building activities. This pressure leads to a considerable loss of biodiversity due to the destruction of many natural habitats. This confirms the idea that the Earth’s surface is affected by the presence of anthropogenic activities in specific areas [48,49], exacerbated by the anthropocentric perspective of several societies [50]. The increase in the built-up area observed during the study period is a result of the construction of some buildings, roads, and infrastructure development as well as the high demand for land for settlements by the growing population in Greater Lomé. The population increase is mainly due to a high influx of people from other parts of the country for jobs and income generation opportunities [7].
The rapid urbanization of Greater Lomé has also led to a reduction in the proportion of land and degraded vegetation in peripheral areas in favor of buildings. It is recognized that the extension of urban areas can be influenced, among other things, by the configuration of space, in particular their accessibility and availability [51]. In addition, ref. [52], through his study on the spatio-temporal analysis of the dynamics of landscape conversion along the urban–rural gradient in Lubumbashi, revealed that the increase in the proportion of buildings to the detriment of vegetation in the landscape of peri-urban areas makes building space more limited in these areas. This could lead to land saturation, probably followed by land conflicts.
In the outlying areas as well as in the city center of Greater Lomé, the extent of the phenomenon of urbanization is considerable. The needs regarding housing and equipment accumulate from year to year. Like the results of this study, those of [53] on the Mediterranean coast of north-eastern Morocco showed the importance of socio-economic and political factors in the artificialization of the peri-urban spaces. Indeed, urban expansion is causing a decline and relocation of agricultural activities, in particular market gardening and tree farms, a large part of whose production is intended for the market of Greater Lomé. The strong urban expansion is likely to aggravate the problems of mobility, particularly those of the populations of the outlying districts whose individual means of transport are limited. In fact, there is an imbalance in the spatial distribution of infrastructure, equipment, and services between the north, west, and east of downtown Greater Lomé. These environments constitute peripheral zones where the urban extension continues.
The observation of the geomorphological landscape of Togblé, Adétikopé clearly shows that most of the agglomerations established in the alluvial plain regularly suffer from seasonal flooding. The modification of the natural conditions of runoff caused by each human development has consequences on the dynamics of the watercourse. Clearly, the hydrology of the Zio is deeply affected by its decimetric variations, with the consequence of increasing hydrological risks, in particular the frequency of floods. Despite the frequency of these risks, the lack of recent and continuous discharge data is a serious handicap for the detailed analysis of the impacts of LULC changes on flood risk in this area. Also, the current discontinuous series of flows has enabled flood frequency analysis of the Zio River. Gracius [54], in his study on the analysis of vulnerability to flood risk and land-use planning in the Commune of Cap-Haïtien, showed that this phenomenon of peri-urbanization could lead to an upsurge in flooding.
To these harmful practices, which have repercussions on the ecology of the river, in this case, the morpho-dynamics of the bed, several other human activities are added, which constitute, in reality, factors of aggravation of the floods, particularly the construction of houses and buildings in the bed of the Zio River. The same is true for the surrounding lowlands, which change the initial geomorphological characteristics of the plain. This aspect has been mentioned by other authors, particularly the development of human activities likely to alter the environment, which remains much more evident at a distance closer to urban centers [51]. This urbanization profoundly modifies the natural conditions of the water flow, which can cause flooding in these environments.
Scientific information on the spatial dynamics of built-up areas integrating the temporal dimension in Greater Lomé is, therefore, of great importance for decision-makers evaluating urban land use and planning decisions and for the scientific community discovering the causes and effects of land use changes on the management of urban spaces in Togo. However, in this study, spatial resolution is a key factor that can affect image quality and mapping accuracy. The mapping of built-up areas from medium spatial resolution Landsat images can, therefore, limit class discrimination and affect classification accuracy. These medium spatial resolution images may not be able to provide accurate information on the density or distribution of buildings in this area, even though the PCA were calculated on images composed of indices derived from the primary image channels, maximized band information, and eliminated noise. Indeed, the quality of the classifications was assessed by calculating the confusion matrix [36] and the Kappa K index proposed by [39]. The Kappa index is expressed as the probability of correct classification on a scale of 0 to 1.
The Random Forest (RF) algorithm was used for mapping on the basis of over 300 training pixels, where classes were determined during the field survey. The validation of the classification was based on control points collected in the field. The Random Forest (RF) algorithm, developed by [30] was chosen for its good land use prediction capabilities [31] in the case of temporal analysis [32]. Several authors have shown that land cover classifications using RF outperform classifications using other types of algorithms, such as maximum likelihood classification [32]. The RF provides an algorithm for estimating missing values and the flexibility to perform several types of data analysis, including regression, classification, survival analysis, and unsupervised learning [33].
This is a non-parametric supervised classification algorithm that combines the decision tree algorithm with an aggregation technique. It is included in the “Random Forest” package of the “R” software. (version 4.3.1). The algorithm randomly selects a sample of observations and a sample of variables several times to produce a large number of small classification trees. These small trees are then grouped together and a majority voting rule is applied to determine the final category [30]. In order to maximize the band information and eliminate noise so that the discrimination of the classes studied can be improved, a PCA was calculated on the images composed of indices derived from the primary channels of the satellite images and the main bands used. The indices used included the Normalized Built-up Difference Index (NDBI), the Soil Adjustment Vegetation Index (SAVI), and the Normalized Moisture Difference Index (MNDWI) [55].

5. Conclusions

This study has highlighted the interest in using Landsat images to study the evolution of human habitats in urban and peri-urban areas in order to improve the understanding of their dynamics over time. A meticulous choice of satellite images and the method of classification enabled the obtainment of a clear and relevant rendering. The results showed that the dynamics of land use along the urban–rural gradient were characterized in 13 years (between 2007 and 2020) by a clear progression of buildings to the detriment of vegetation in the peri-urban zones. They provided a good understanding of the dynamics of these changes and indicated a strong dynamic in the landscape structure of Greater Lomé, marked by a rapid extension of built-up areas. Furthermore, the results of this study showed a marked extension in the peripheral areas of Greater Lomé, particularly towards the north and west, to the detriment of agricultural and wooded areas. In addition, towards the east, an evolution of the buildings was observed, but it was not continuous. The presence of the lower Zio valley, which constituted a green band on the images, caused the discontinuity of the evolution of the buildings in the east of the study area. However, the observation of the satellite images showed that the evolution of the buildings has narrowed this band of discontinuity, which was more stretched in 2020 than in 2016.
Finally, direct observations of the entire study area showed that the minimal conversions observed for built-up areas to other land use classes could be justified, for the most part, in places where houses have been washed away by floods. These places, which have become uninhabitable, were subsequently occupied by vegetation. It becomes necessary to carry out studies on the effects of the occupation of the lower Zio Valley on the dynamics of floods in Greater Lomé in order to better understand the problems and suggest solutions for mitigating their negative consequences, which have become more severe.

Author Contributions

Conceptualization, T.-H.B. and K.A.; methodology, K.A.; software, A.K.D.H.; validation, K.A., K.K. (Kossi Komi), and A.K.D.H.; formal analysis, K.A.; investigation, K.S.G.; resources, K.K. (Kossi Komi); data curation, A.K.D.H.; writing—original draft preparation, K.K. (Kossi Komi); writing—review and editing, J.-B.B.Z.; visualization, B.P.; supervision, K.K. (Kouami Kokou); project administration, K.A.; funding acquisition, K.A. All authors have read and agreed to the published version of the manuscript.

Funding

This study received financial support from The Regional Centre of Excellence on Sustainable Cities in Africa (CERViDA-DOUNEDON) through the funding of the project entitled “Opportunity Study for the Restoration of the Forest Landscape to Fight Against Urban Heat Islands (UHI) in the Context of Climate Change in the Greater Lome, Maritime Region”( grant N°5955 crédit IDA) and the WASCAL (West African Science Service Centre on Climate Change and Adapted Land Use) through the FURIFLOOD project.

Data Availability Statement

Data is contained within the article.

Acknowledgments

The authors are grateful to CERViDA_DOUNEDON, the Association of African Universities (AUA), and the World Bank as well as the WASCAL for funding this research.

Conflicts of Interest

The authors declare no conflicts of interest.

References

  1. Fang, H.; Gu, Q.; Xiong, W.; Zhou, L.-A. Demystifying the Chinese housing boom. NBER Macroecon. Annu. 2016, 30, 105–166. [Google Scholar] [CrossRef]
  2. Biakouye, K.A. Lomé Au-Delà de Lomé: Étalement Urbain et Territoires Dans une Capitale d’Afrique Sub-Saharienne. Ph.D. Thesis, University of Paris, Paris, France, 17 November 2014. Available online: https://www.theses.fr/2014PA100138 (accessed on 10 October 2023).
  3. Benítez, A.; Prieto, M.; González, Y.; Aragón, G. Effects of tropical montane forest disturbance on epiphytic macrolichens. Sci. Total Environ. 2012, 441, 169–175. [Google Scholar] [CrossRef] [PubMed]
  4. Fodé, S.; Kouami, K.; Mohamed, D.; Youssouf, C.; Sidiki, K.; Souleymane, K. Analyse Diachronique, Grâce Aux Images Landsat, de la Dynamique Spatiale des Forêts Sacrées du Haut Bassin du Niger en République de Guinée. Rev. Fr. Photogramm. Télédétect. 2022, 223, 250–266. [Google Scholar] [CrossRef]
  5. Surya, B.; Salim, A.; Hernita, H.; Suriani, S.; Menne, F.; Rasyidi, E.S. Land Use Change, Urban Agglomeration, and Urban Sprawl: A Sustainable Development Perspective of Makassar City, Indonesia. Land 2021, 10, 556. [Google Scholar] [CrossRef]
  6. Fashae, O.A.; Tijani, M.N.; Adekoya, A.E.; Tijani, S.A.; Adagbasa, E.G.; Aladejana, J.A. Comparative Assessment of the Changing Pattern of Land cover along the Southwestern Coast of Nigeria using GIS and Remote Sensing techniques. Sci. Afr. 2022, 17, e01286. [Google Scholar] [CrossRef]
  7. Tiamgne, X.T.; Kalaba, F.K.; Nyirenda, V.R. Land use and cover change dynamics in Zambia’s Solwezi copper mining district. Sci. Afr. 2021, 14, e01007. [Google Scholar] [CrossRef]
  8. Nse, O.U.; Okolie, C.J.; Nse, V.O. Dynamics of land cover, land surface temperature and NDVI in Uyo City, Nigeria. Sci. Afr. 2020, 10, e00599. [Google Scholar] [CrossRef]
  9. Coutard, O.; May, N.; Veltz, P. La Ville Éclatée: Enjeux, Logistiques et Modalités d’une Régularisation Économique, Sociale et Territoriale; Paris, France, 1996. Available online: https://medias.vie-publique.fr/data_storage_s3/rapport/pdf/974055800.pdf (accessed on 1 October 2023).
  10. Förster, T.; Ammann, C. Les villes africaines et le casse-tête du développement. Acteurs et capacité d’agir dans la zone grise urbaine. Int. De Polit. Dév. 2018, 10, 1–23. [Google Scholar] [CrossRef]
  11. Polorigni, B.; Radji, R.; Kokou, K. Perceptions, tendances et préférences en foresterie urbaine: Cas de la ville de Lomé au Togo. Eur. Sci. J. 2014, 10, 261–277. [Google Scholar]
  12. Salomon, W.; Useni Sikuzani, Y.; Sambieni, K.R.; Kouakou, A.T.M.; Barima, Y.S.S.; Théodat, J.M.; Bogaert, J. Land Cover Dynamics along the Urban–Rural Gradient of the Port-au-Prince Agglomeration (Republic of Haiti) from 1986 to 2021. Land 2022, 11, 355. [Google Scholar] [CrossRef]
  13. Wiwoho, B.S.; Phinn, S.; McIntyre, N. Two Decades of Land-Use Dynamics in an Urbanizing Tropical Watershed: Understanding the Patterns and Drivers. ISPRS. Int. J. Geo-Inf. 2023, 12, 92. [Google Scholar] [CrossRef]
  14. Barros, J.L.; Tavares, O.A.; Santos, P.P. Land use and land cover dynamics in Leiria City: Relation between peri-urbanization processes and hydro-geomorphologic disasters. Nat. Hazards 2021, 106, 757–784. [Google Scholar] [CrossRef]
  15. Awuh, M.E.; Officha, M.C.; Okolie, A.O.; Enete, I.C. Land-Use/Land-Cover Dynamics in Calabar Metropolis Using a Combined Approach of Remote Sensing and GIS. J. Geogr. Inf. Syst. 2018, 10, 398–414. [Google Scholar] [CrossRef]
  16. Angel, S.; Parent, J.; Civco, D.L. The fragmentation of urban landscapes: Global evidence of a key attribute of the spatial structure of cities, 1990–2000. Environ. Urban. 2012, 24, 249–283. [Google Scholar] [CrossRef]
  17. Herold, D.; Couclelis, H.; Clarke, K.C. The role of spatial metrics in the analysis and modeling of urban land use change. Comput. Environ. Urban Syst. 2005, 29, 369–399. [Google Scholar] [CrossRef]
  18. Almeida, C.M.D.; Monteiro, A.M.V.; Câmara, G.; Soares-Filho, B.S.; Cerqueira, G.C.; Pennachin, C.L.; Batty, M. GIS and remote sensing as tools for the simulation of urban land-use change. Int. J. Remote Sens. 2005, 26, 759–774. [Google Scholar] [CrossRef]
  19. Mohamed, M. Le Centre-Ville de Lomé, Évolution de la Situation Foncière et de la Trame Urbaine; ORSTOM: Lomé, Togo, 1983; 99p, Available online: https://www.documentation.ird.fr/hor/fdi:04087 (accessed on 11 February 2023).
  20. Dziwonou, Y. Croissance Urbaine et Mécanismes Fonciers. Contribution à L’élaboration d’une Géomatique Cadastrale: Le Cas de la Ville de Lomé. Ph.D. Thesis, Géographie Urbaine et Aménagement, Université de Lomé, Lomé, Togo, 2000; 579p. Available online: https://www.theses.fr/1987TOU20006 (accessed on 1 March 2023).
  21. Gondo, R.; Kolawole, O.D.; Mfundisi, K.B. Land use and land cover changes along the Boteti-Thamalakane River system in Ngamiland District, Botswan. Sci. Afr. 2023, 20, e01595. [Google Scholar]
  22. Tian, P.; Li, J.; Gong, H.; Pu, R.; Cao, L.; Shao, S.; Shi, Z.; Feng, X.; Wang, L.; Liu, R. Research on Land Use Changes and Ecological Risk Assessment in Yongjiang River Basin in Zhejiang Province, China. Sustainability 2019, 11, 2817. [Google Scholar] [CrossRef]
  23. Lambony, G. A Travers Images et Pratiques: Le Fait Citadin en Afrique Noire. Etude Comparée de Lomé (Togo) et de Harare (Zimbabwe). Ph.D. Thesis, EHESS, Paris, France, 1993; 592p. [Google Scholar]
  24. Gbafa, K.S.; Tiem, S.; Kokou, K. Characterization of rainwater drainage infrastructure in the city of Lomé (Togo, West Africa). Eur. Sci. J. 2017, 13, 478–496. [Google Scholar] [CrossRef]
  25. Guézéré, A. Oléyia (Taxi Moto) Acteurs Et Usagers d’un Mode de Transport Artisanal Récent à Lomé. Ph.D. Thesis, Université de Lomé, Lomé, Togo, 2008; 455p. [Google Scholar]
  26. INSEED. Résultats Définitifs du RGPH-5 de Novembre 2022, République Togolaise. 2023. Available online: https://hcte-suisse.ch/wp-content/uploads/2023/04/Depliant-Resultats-Definitifs_RGPH5_02Avril2023.pdf (accessed on 9 September 2023).
  27. Liu, J.; Heiskanen, J.; Aynekulu, E.; Pellikka, P.K.E. Seasonal variation of land cover classification accuracy of landsat 8 images in Burkina Faso. In Proceedings of the 36th International Symposium on Remote Sensing of Environment (ISRSE 2015), Berlin, Germany, 11–15 May 2015; Volume XL-7/W3. [Google Scholar]
  28. Ozcan, O.; Aksu, G.A.; Erten, E.; Musaoglu, N.; Cetin, M. Degradation monitoring in Silvo-pastoral systems: A case study of the Mediterranean region of Turkey. Adv. Space Res. 2019, 63, 172–189. [Google Scholar] [CrossRef]
  29. Gutman, G.; Byrnes, R.A.; Masek, J.; Covington, S.; Justice, C.; Franks, S.; Headley, R. Towards monitoring land-cover and land-use changes at a global scale: The global land survey 2005. Photogramm. Eng. Remote Sens. 2008, 74, 6–10. [Google Scholar]
  30. Breiman, L. Random Forests. Mach. Learn. 2001, 45, 5–32. [Google Scholar] [CrossRef]
  31. Gislason, P.O.; Benediktsson, J.A.; Sveinsson, J.R. Random forests for land cover classification. Pattern recognition. Letters 2006, 27, 294–300. [Google Scholar]
  32. Schneider, A. Monitoring land cover change in urban and peri-urban areas using dense time stacks of Landsat satellite data and a data mining approach. Remote Sens. Environ. 2012, 124, 689–704. [Google Scholar] [CrossRef]
  33. Grinand, C.; Rakotomalala, F.; Gond, V.; Vaudry, R.; Bernoux, M.; Vieilledent, G. Estimating deforestation in tropical humid and dry forests in Madagascar from 2000 to 2010 using multi-date Landsat satellite images and the random forests classifier. Remote Sens. Environ. 2013, 139, 68–80. [Google Scholar] [CrossRef]
  34. Sun, H.; Forsythe, W.; Waters, N. Modeling urban land use change and urban sprawl: Calgary, Alberta, Canada. Netw. Spat. Econ. 2007, 7, 353–376. [Google Scholar] [CrossRef]
  35. Gao, B.-C. NDWI—A normalized difference water index for remote sensing of vegetation liquid water from space. Remote Sens. Environ. 1996, 58, 257–266. [Google Scholar] [CrossRef]
  36. Sari, I.L.; Weston, C.J.; Newnham, G.J.; Volkova, L. Assessing Accuracy of Land Cover Change Maps Derived from Automated Digital Processing and Visual Interpretation in Tropical Forests in Indonesia. Remote Sens. 2021, 13, 1446. [Google Scholar] [CrossRef]
  37. Hansen, M.; Loveland, T. A Review of large area monitoring of land cover change using Landsat data. Remote Sens. Environ. 2012, 122, 66–74. [Google Scholar] [CrossRef]
  38. Cabral, P. Délimitation d ‘aires urbaines à partir d ‘une image Landsat ETM+: Comparaison de méthodes de classification. Can. J. Remote Sens. 2007, 33, 422–430. [Google Scholar] [CrossRef]
  39. De Sherbinin, A.; Carr, D.; Cassels, S.; Jiang, L. Population and environment. Annu. Rev. Environ. Res. 2007, 32, 345–373. [Google Scholar] [CrossRef] [PubMed]
  40. Alam, A.; Bhat, M.; Maheen, M. Using Landsat satellite data for assessing the land use and land cover change in Kashmir valley. GeoJournal 2020, 85, 1529–1543. [Google Scholar] [CrossRef]
  41. Foody, G.M. Status of land cover classification accuracy assessment. Remote Sens. Environ. 2020, 80, 185–201. [Google Scholar] [CrossRef]
  42. Serra, P.; Pons, X.; Sauri, D. Post-classification change detection with data from different sensors: Some accuracy considerations. Int. J. Remote Sens. 2003, 24, 3311–3340. [Google Scholar] [CrossRef]
  43. Munsi, M.; Malaviya, S.; Oinam, G.; Joshi, P. A landscape approach for quantifying land-use and land-cover change (1976–2006) in middle Himalaya. Reg. Environ. Chang. 2009, 10, 145–155. [Google Scholar] [CrossRef]
  44. Shalaby, A.; Tateishi, R. Remote sensing and GIS for mapping and monitoring land cover and land-use changes in the Northwestern coastal zone of Egypt. Appl. Geogr. 2007, 27, 28–41. [Google Scholar] [CrossRef]
  45. Baudot, Y. Télédétection Aérospatiale et Analyse Géographique de la Population des Villes dans les Pays en Développement. Ph.D. Thesis, Faculté des Sciences, Université Catholique de Louvain, Ottignies-Louvain-la-Neuve, Belgium, 1994; p. 233. [Google Scholar]
  46. Louise, L.; Montpellier, H.; ESCAPE. Analyse Diachronique de la Dynamique Paysagère sur le Bassin Supérieur de l’Ouémé (Bénin) à Partir de l’imagerie Landsat et MODIS: Cas d’étude du Communal de Djougou; Rapport d’étude; Hydrosciences Montpellier: Montpellier, France, 2012. [Google Scholar]
  47. Matlhodi, B.; Kenabatho, P.K.; Parida, B.P.; Maphanyane, J.G. Evaluating Land Use and Land Cover Change in the Gaborone Dam Catchment, Botswana, from 1984–2015 Using GIS and Remote Sensing. Sustainability 2019, 11, 5174. [Google Scholar] [CrossRef]
  48. De Sherbinin, A.; Schiller, A.; Pulsipher, A. The Vulnerability of Global Cities to Climate Hazards. Environ. Urban. 2007, 19, 39–64. [Google Scholar] [CrossRef]
  49. Gurmessa, F. Forest loss and climate change in Ethiopia. Res. J. Agric. Environ. Manag. 2015, 4, 216–224. [Google Scholar]
  50. Emiru, T.; Naqvi, H.R.; Athick, M.A. Anthropogenic impact on land use land cover: Influence on weather and vegetation in Bambasi Wereda, Ethiopia. Spat. Inf. Res. 2018, 26, 427–436. [Google Scholar] [CrossRef]
  51. Bamba, I.; Barima, Y.S.S.; Bogaert, J. Influence de la densité de la population sur la structure spatiale d’un paysage forestier dans le bassin du Congo en, R.D. Congo. Trop. Conserv. Sci. 2010, 3, 31–44. [Google Scholar] [CrossRef]
  52. Useni, S.Y. Analyse Spatio-Temporelle des Dynamiques D’anthropisation Paysagère le long du Gradient Urbain-Rural à Lubumbashi (Haut-Katanga, République Démocratique du Congo. Ph.D. Thesis, Université de Lubumbashi, Lubumbashi, Democratic Republic of the Congo, 2017; 205p. [Google Scholar]
  53. Mouzouri, M.; Irzi, Z.; Brahimi, A. Etude de la Dynamique de L’occupation du sol da la Plaine Côtière de SAÏDIA (Littoral Méditerranéen du Nord-Est du Maroc) Durant la Période 2001–2009; Colloque International des Utilisateurs du SIG: Oujda, Marocco, 2016; pp. 287–292. [Google Scholar]
  54. Gracius, J.G. Vulnérabilités au Risque D’inondations et Aménagement du Territoire. Master’s Thesis, Spécialisation en Gestion des Risques Naturels de l’Université de Liège, Cap-Haïtien, Haïti, 2016; 70p. [Google Scholar]
  55. Rouse, J.W.; Haas, R.H.; Schell, J.A.; Deering, W.D. Monitoring Vegetation Systems, the Great Plains with ERTS; Nasa Special Publication; Nasa: Washington, DC, USA, 1974; Volume 351, p. 309. [Google Scholar]
Figure 1. Location of Greater Lomé.
Land 13 00084 g001
Figure 2. Principal Component Analysis results on index bands.
Land 13 00084 g002
Figure 3. Land use/cover in relation to the evolution of buildings in Greater Lomé.
Land 13 00084 g003
Figure 4. Dynamics of land use/cover centered on building subclasses.
Land 13 00084 g004
Figure 5. Constructions in the flood zone of the lower Zio Valley in Djagblé. Source: Fieldwork (2022).
Land 13 00084 g005
Figure 6. Houses located in the lowlands and flooded in Baguida. Source: Fieldwork (2022).
Land 13 00084 g006
Figure 7. Trends in land use/cover.
Land 13 00084 g007
Table 1. Characteristics of the images collected.
YearAcquisition DateSensor
202016 February 2020Landsat 8/OLI
201625 January 2017Landsat 8/OLI
201204 January 2012Landsat 7/ETM + (SLC-off)
200722 January 2007Landsat 7/ETM + (SLC-off)
Table 2. Land use and land cover classification applied in the study area.
No.Class NameDescription
1Dense zoneAreas covered by more than 90% of built-up area
2Moderate-density zoneAreas covered by built-up area between 75% and 90%
3Low-density zoneAreas that covered less than 75% of built-up area
4Other land use/land coverNatural vegetation, watering holes, cultivated areas
Table 3. Accuracy of the Random Forest classification.
YearKappa CoefficientOverall Accuracy
20200.9395.62%
20160.9294.34
20120.9193.45%
20070.8991.19%
Table 4. Evolution of buildings on the outskirts of district of Greater Lomé.
Occupation2007201220162020
Housing areaArea (ha)Rate (%)Area (ha)Rate (%)Area (ha)Rate (%)Area (ha)Rate (%)
15,48125.2520,92434.1225,62441.7935,52157.93
Other classes45,82674.7540,37765.8835,67850.2125,78342.17
Table 5. Land use/cover areas centered on the subclasses of buildings.
Type of OccupationArea in Hectares and Percentage
2007 (%)2012 (%)2016 (%)2020 (%)
Dense zone18633.0459569.72629910.2814,48523.63
Moderate-density zone613710.01820713.3910,67517.4160589.88
Low-density zone747912.20676111.03864914.1114,97824.43
Other land use/cover45,82674.7540,37765.8735,67958.2025,78342.06
Total area61,30510061,30110061,30210061,302100
Table 6. Land use and land cover change matrix in Greater Lomé 2007–2020.
YearsLULCDense Zone (Ha)Moderate-Density Zone (Ha)LowDensity Zone (Ha)Other Land Use/Cover (Ha)Total Areas (Ha)
2007–2012Dense zone (Ha) (ha)1196.64172.531.625508.996879.78
Moderate-density zone (ha)2716.293732.03537.33155.4910,141.11
Low-density zone (ha)419.581413.091286.821250.464369.95
Other land use/cover (ha)4158.54831.9654.3634,880.3139,925.17
Total areas (ha)8491.056149.611880.144,795.2561,316.01
2012–2016Dense zone (Ha) (ha)1410.84542.79221.856490.628666.1
Moderate-density zone (ha)1159.657468.112106.093851.1914,585.04
Low-density zone (ha)12.06775.441311.75109.262208.51
Other land use/cover (ha)4297.231354.77730.2629,474.135,856.36
Total areas (Ha)6879.7810,141.114369.9539,925.1761,316.01
2016–2020Dense zone (Ha) (ha)3503.611435.410.1810,121.415,060.6
Moderate-density zone (ha)818.373120.213.062017.85959.44
Low-density zone (ha)1513.538873.372205.182398.9514,991.03
Other land use/cover (ha)2830.591156.050.0921,318.2125,304.94
Total areas (ha)8666.114,585.042208.5135,856.3661,316.01
2007–2020Dense zone (Ha) (ha)2279.07357.756.312,417.4815,060.6
Moderate-density zone (ha)1645.29411.398.733894.035959.44
Low-density zone (ha)2648.885006.341857.155478.6614,991.03
Other land use/cover (ha)1917.81374.137.9223,005.0825,304.94
Total areas (ha)8491.056149.611880.144,795.2561,316.01
Disclaimer/Publisher’s Note: The statements, opinions and data contained in all publications are solely those of the individual author(s) and contributor(s) and not of MDPI and/or the editor(s). MDPI and/or the editor(s) disclaim responsibility for any injury to people or property resulting from any ideas, methods, instructions or products referred to in the content.

