
Unveiling the Spatio-Temporal Evolution and Key Drivers for Urban Green High-Quality Development: A Comparative Analysis of China’s Five Major Urban Agglomerations


Abstract
:1. Introduction
2. Literature Review
3. Materials and Methods
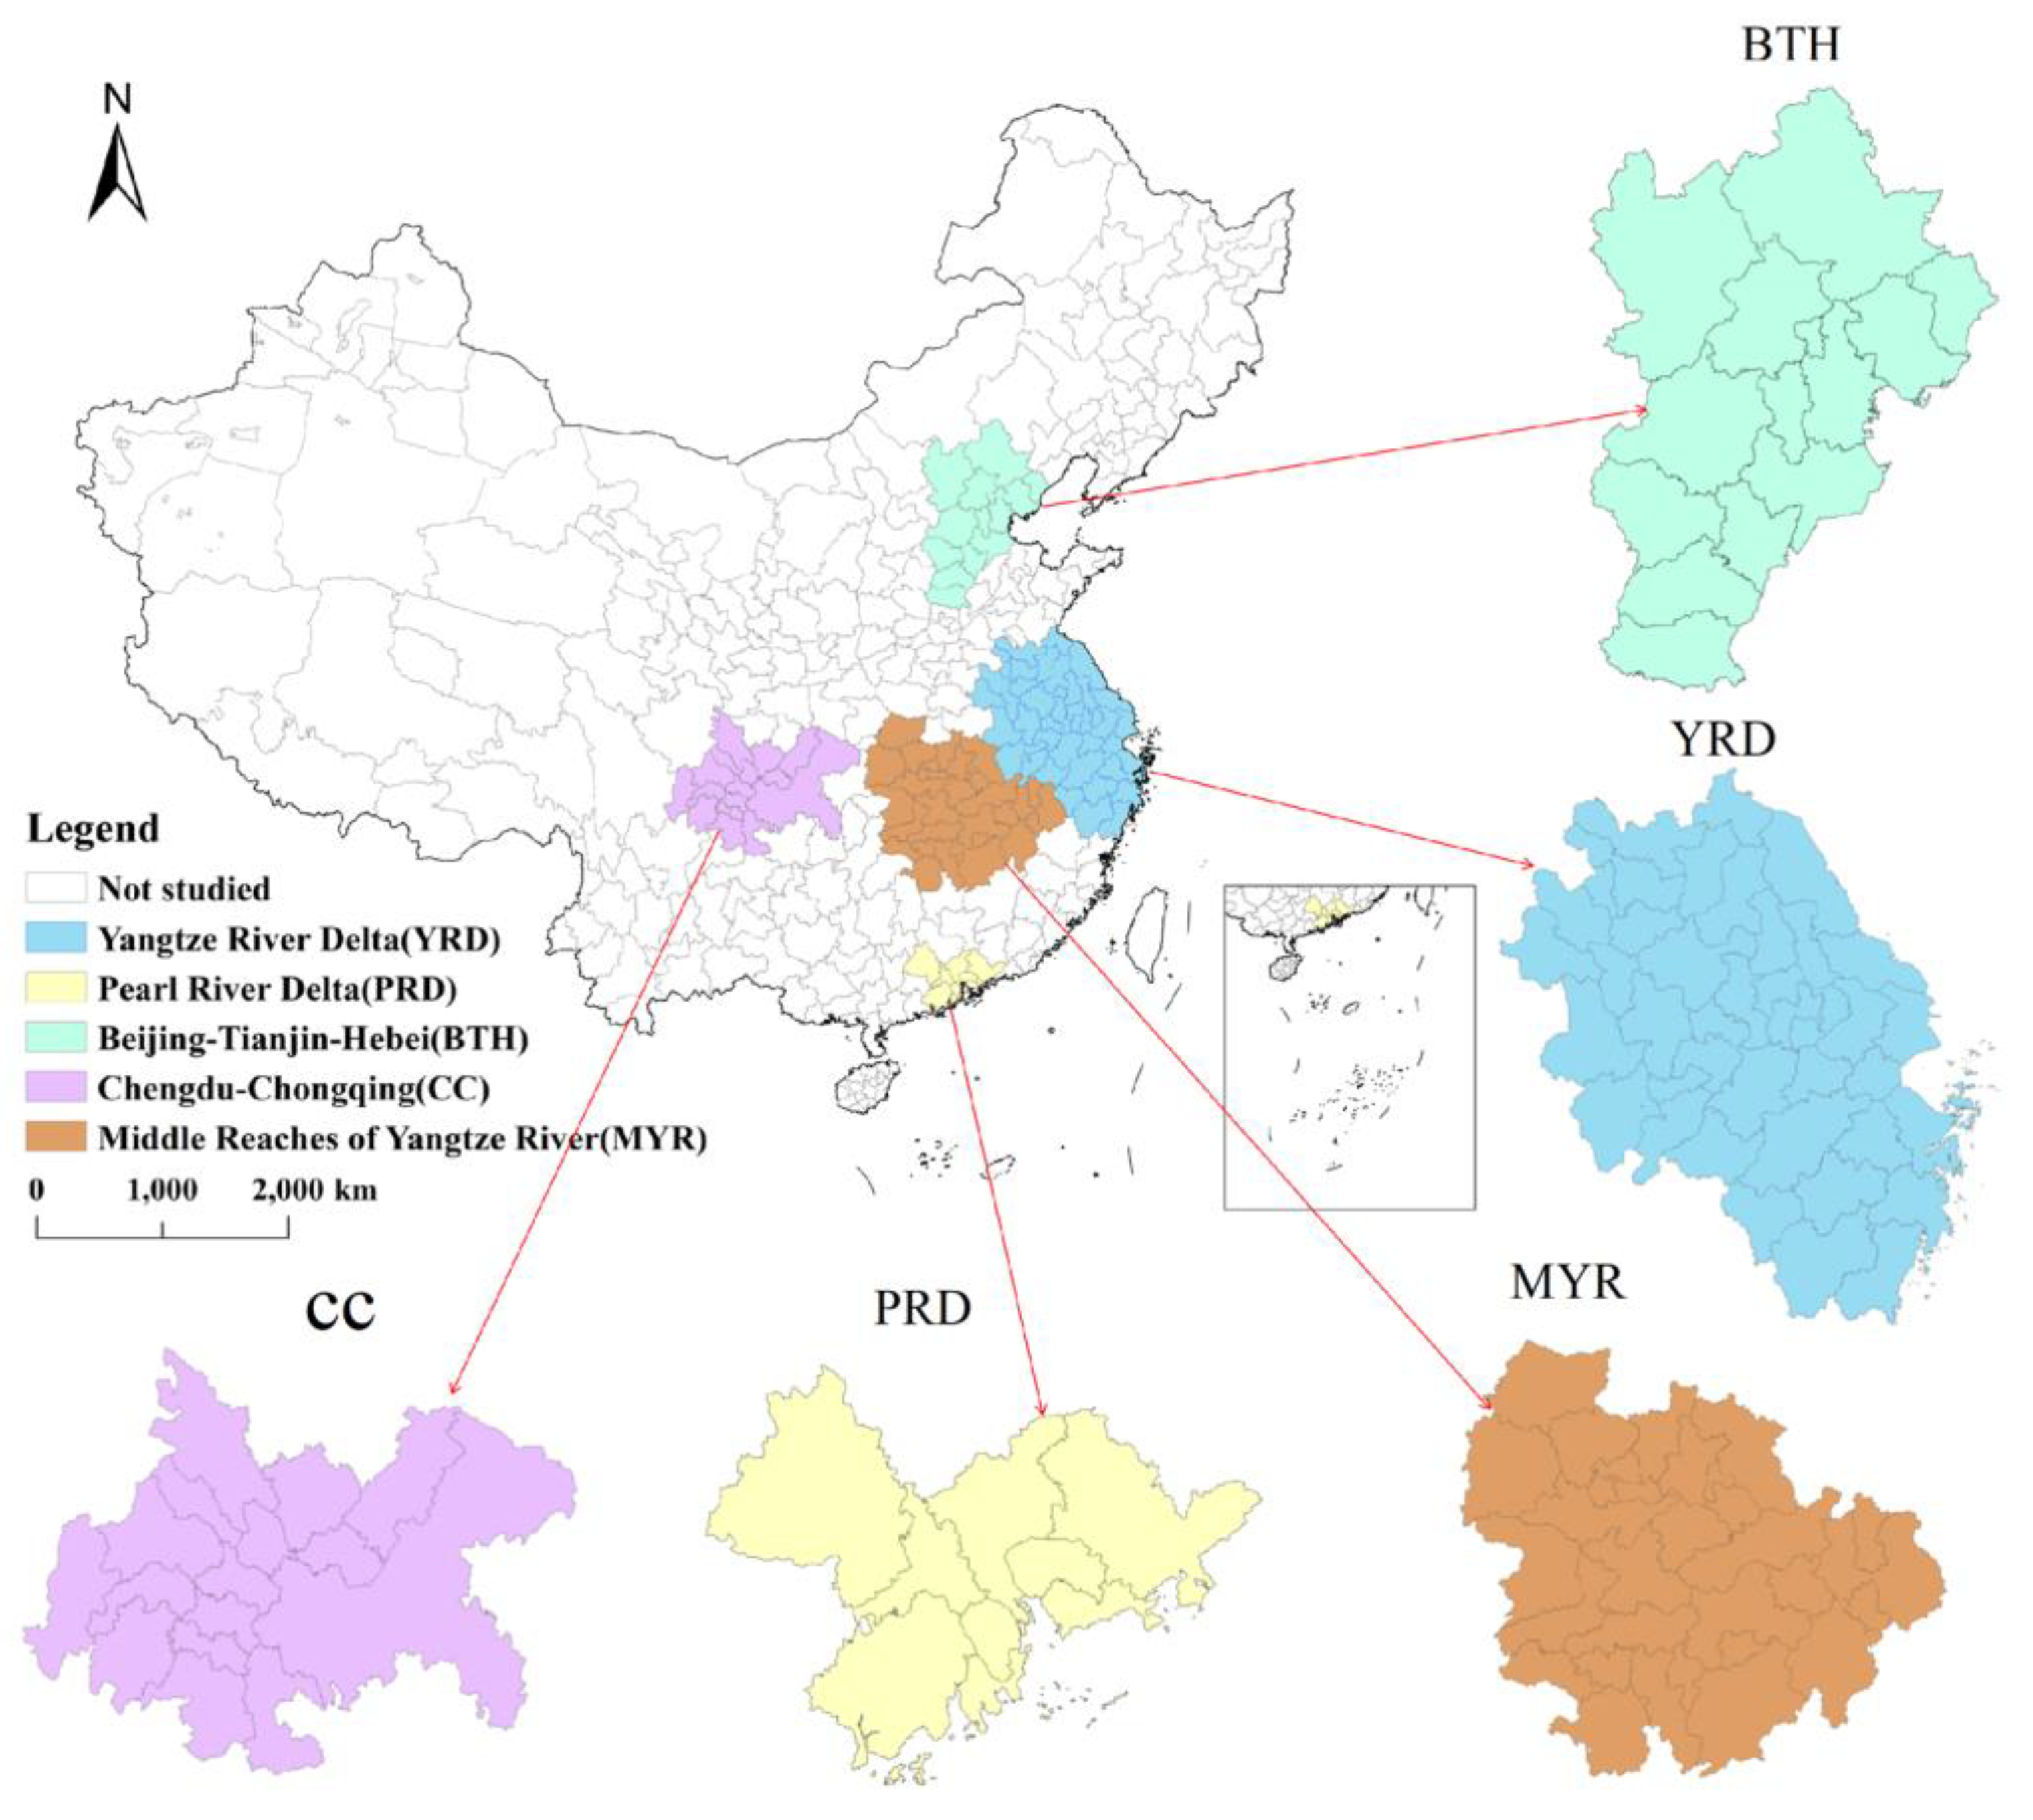
3.1. Study Area
3.2. Data Sources
3.3. Methods
3.3.1. Indicator System
3.3.2. Dagum Gini Coefficient
3.3.3. Kernel Density
3.3.4. Markov Chain
3.3.5. Geographical Detector

| Dimension Layer | Sub-Level | Explanation | Attributes | References |
|---|---|---|---|---|
| ED | Economic development level | Real GDP per capita | Positive | [26,49,57] |
| Fixed-asset investment | Per capita investment in fixed assets | Positive | [26] | |
| Logistics accessibility | Per capita road freight volume | Positive | [55] | |
| Intensity of social consumption | Total retail sales of consumer goods per capita | Positive | [52] | |
| Foreign trade dependence | Ratio of total exports and imports to GDP | Positive | [49,55] | |
| Foreign investment dependence | Actual utilized of foreign capital to GDP | Positive | [55] | |
| Upgradation of industrial structure | Value added of tertiary industry to value added of secondary industry | Positive | [52,56] | |
| Rationalization of industrial structure | New Theil index | Reverse | [52,55,70] | |
| SL | Basic education level | Number of primary and secondary school teachers per student | Positive | [27] |
| Transport infrastructure | Road mileage per unit area | Positive | [65] | |
| Public culture level | Number of library books per 10,000 people | Positive | [57] | |
| Average wage level | Average wage of urban employees | Positive | [66] | |
| Health and medicine level | Number of hospital beds per 10,000 people | Positive | [27,57] | |
| Internet penetration rate | Number of internet users per 100 people | Positive | [60] | |
| EE | Urban wastewater treatment rate | Concentrated treatment rate of wastewater treatment plants | Positive | [55,56] |
| Harmless treatment rate of garbage | Harmless treatment rate of household garbage | Positive | [55,56] | |
| Solid waste utilization rate | Comprehensive utilization rate of industrial solid waste | Positive | [52,55,56] | |
| Greening coverage in built-up areas | Area of landscaped green space to built-up area | Positive | [55,56,57] | |
| Air particulate pollution | Annual average of PM2.5 | Reverse | [52,75] | |
| Industrial SO2 emission | Industrial SO2 emission to industrial output value | Reverse | [52,55] | |
| Industrial wastewater discharges | Industrial wastewater discharge to industrial output value | Reverse | [52,55,56] | |
| Industrial dust emission | Industrial smoke (dust) emission to industrial output value | Reverse | [55,56] | |
| TI | Green innovation achievements | Number of green patent authorizations per 10,000 people | Positive | [52] |
| Intensity of science expenditure | Per capita science expenditure | Positive | [55,56] | |
| Intensity of education expenditure | Per capita expenditure on education | Positive | [55] | |
| Cultivation of innovative talents | Number of university students per 10,000 people | Positive | [56] | |
| Technological innovation achievements | Number of patent authorizations per 10,000 people | Positive | [52] |
4. Results
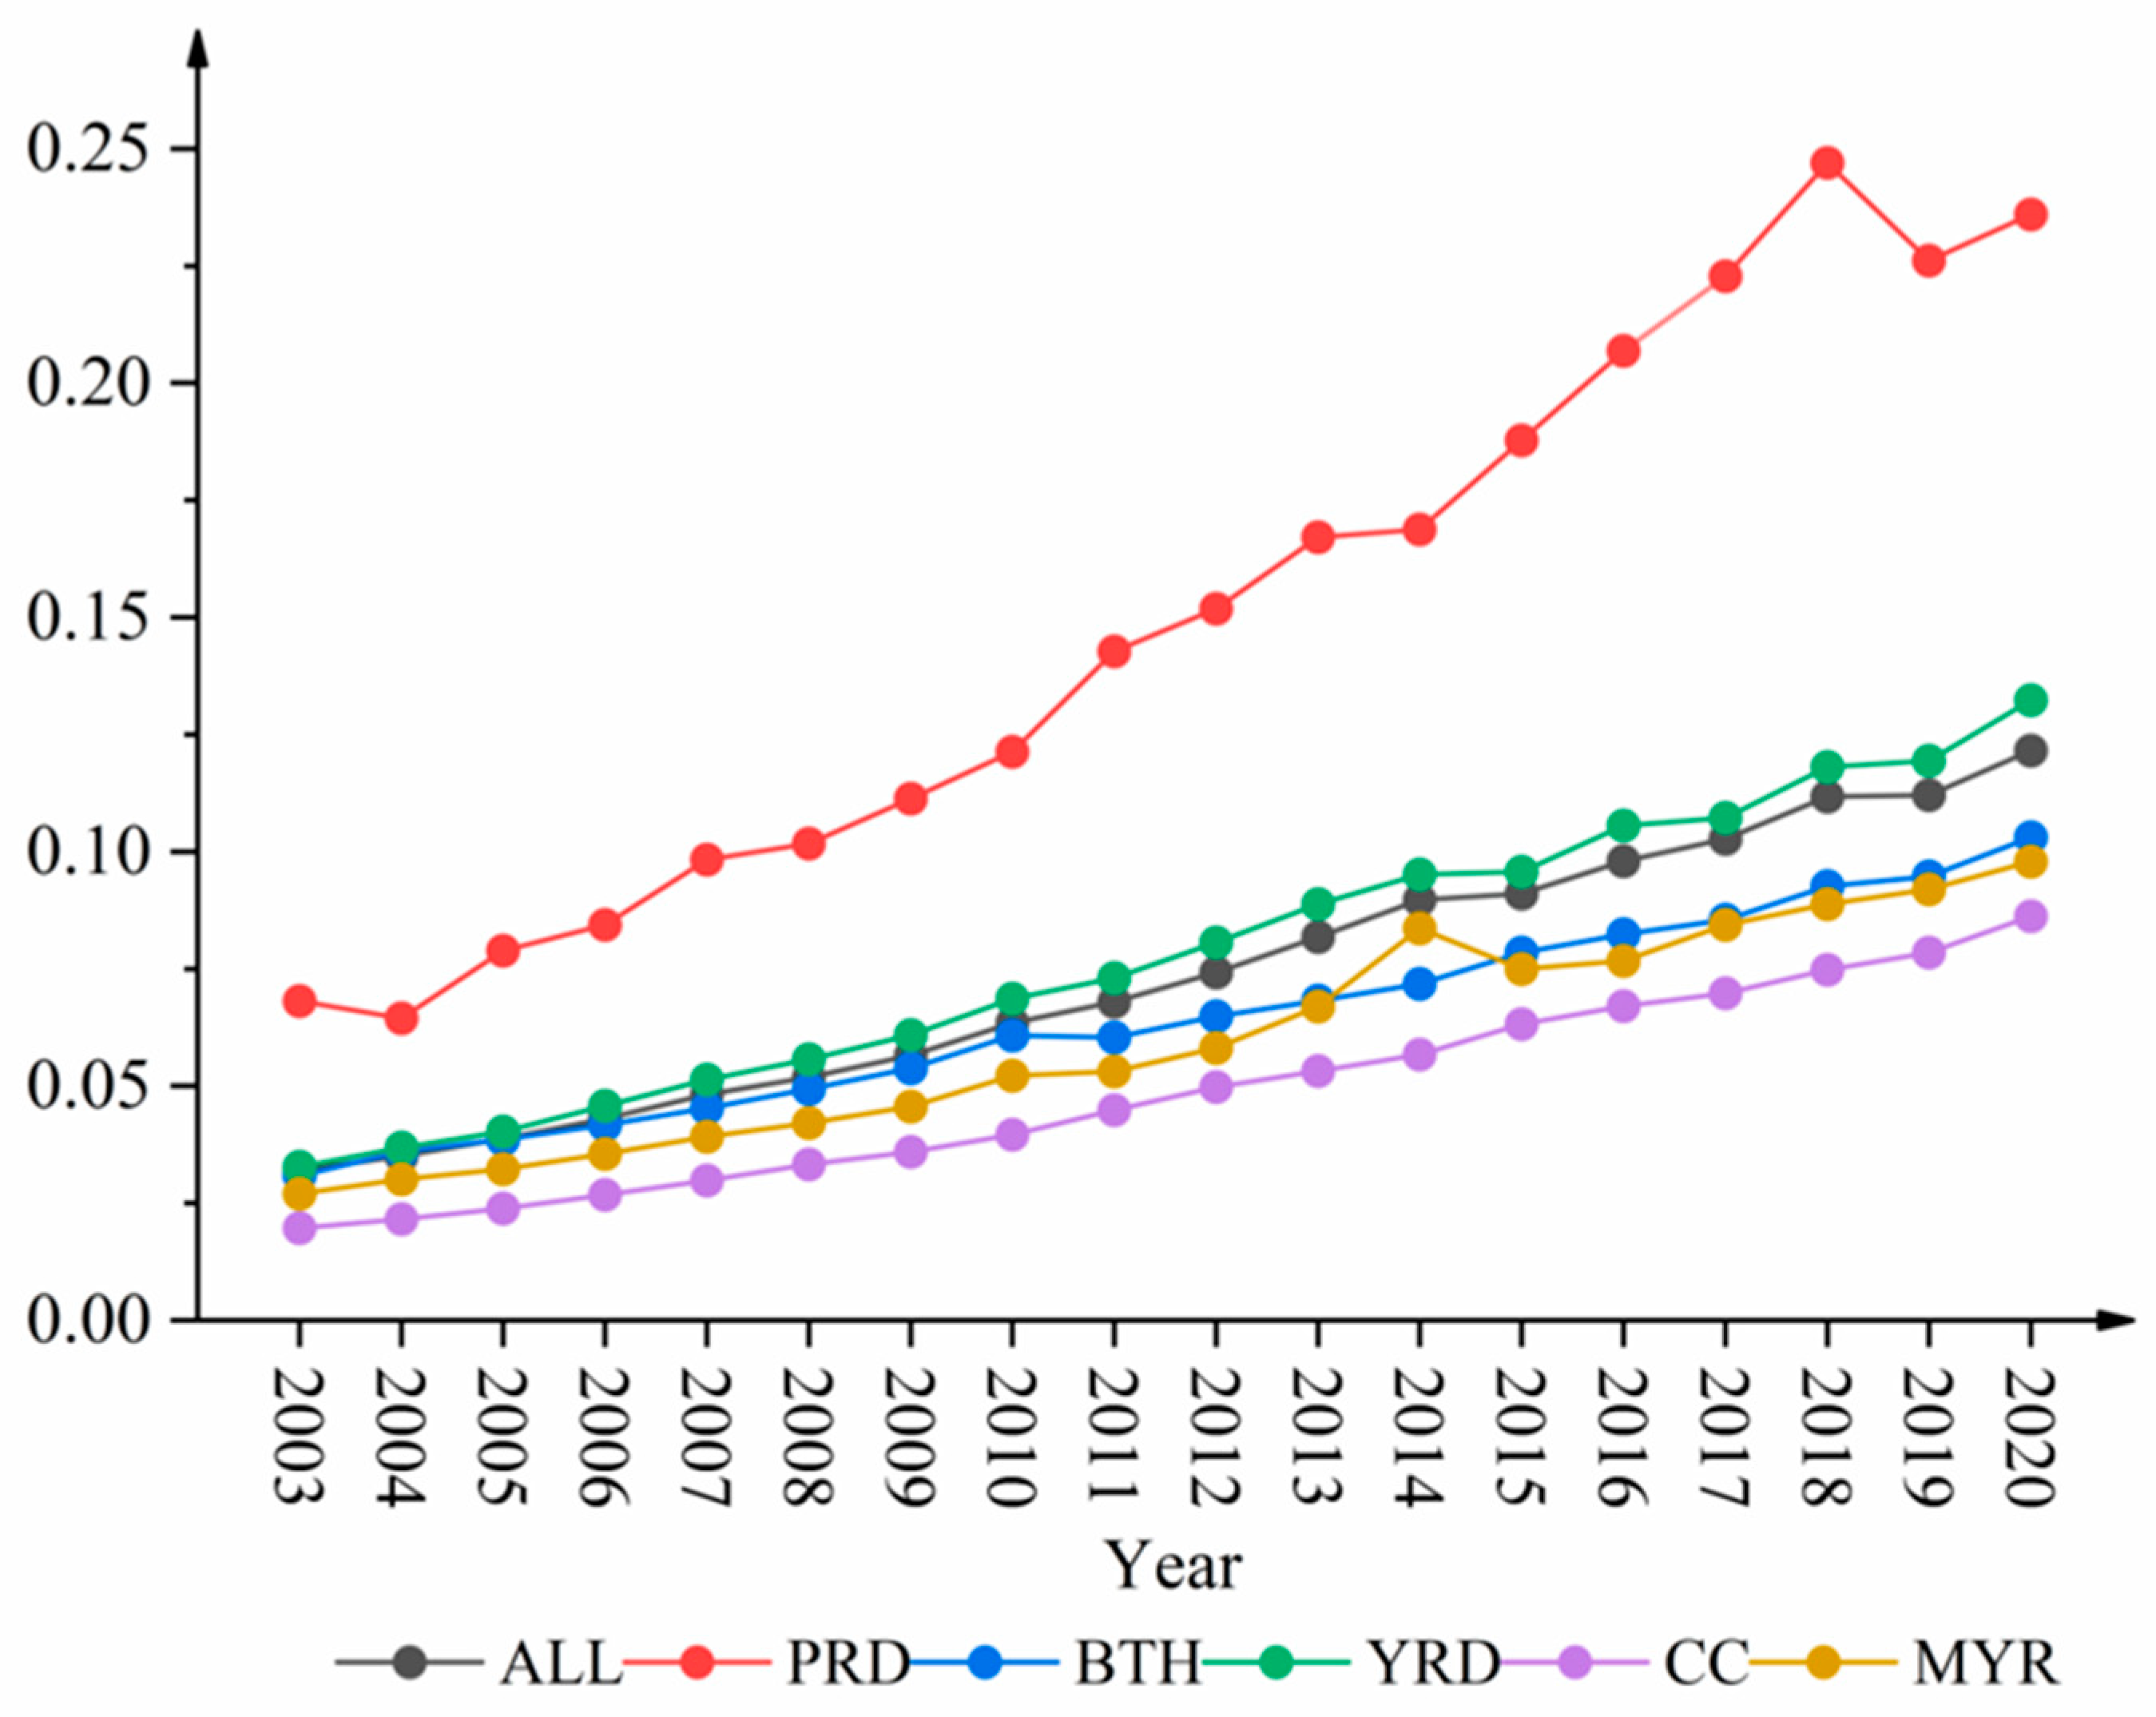
4.1. Level Measurement
4.2. Spatial Differences
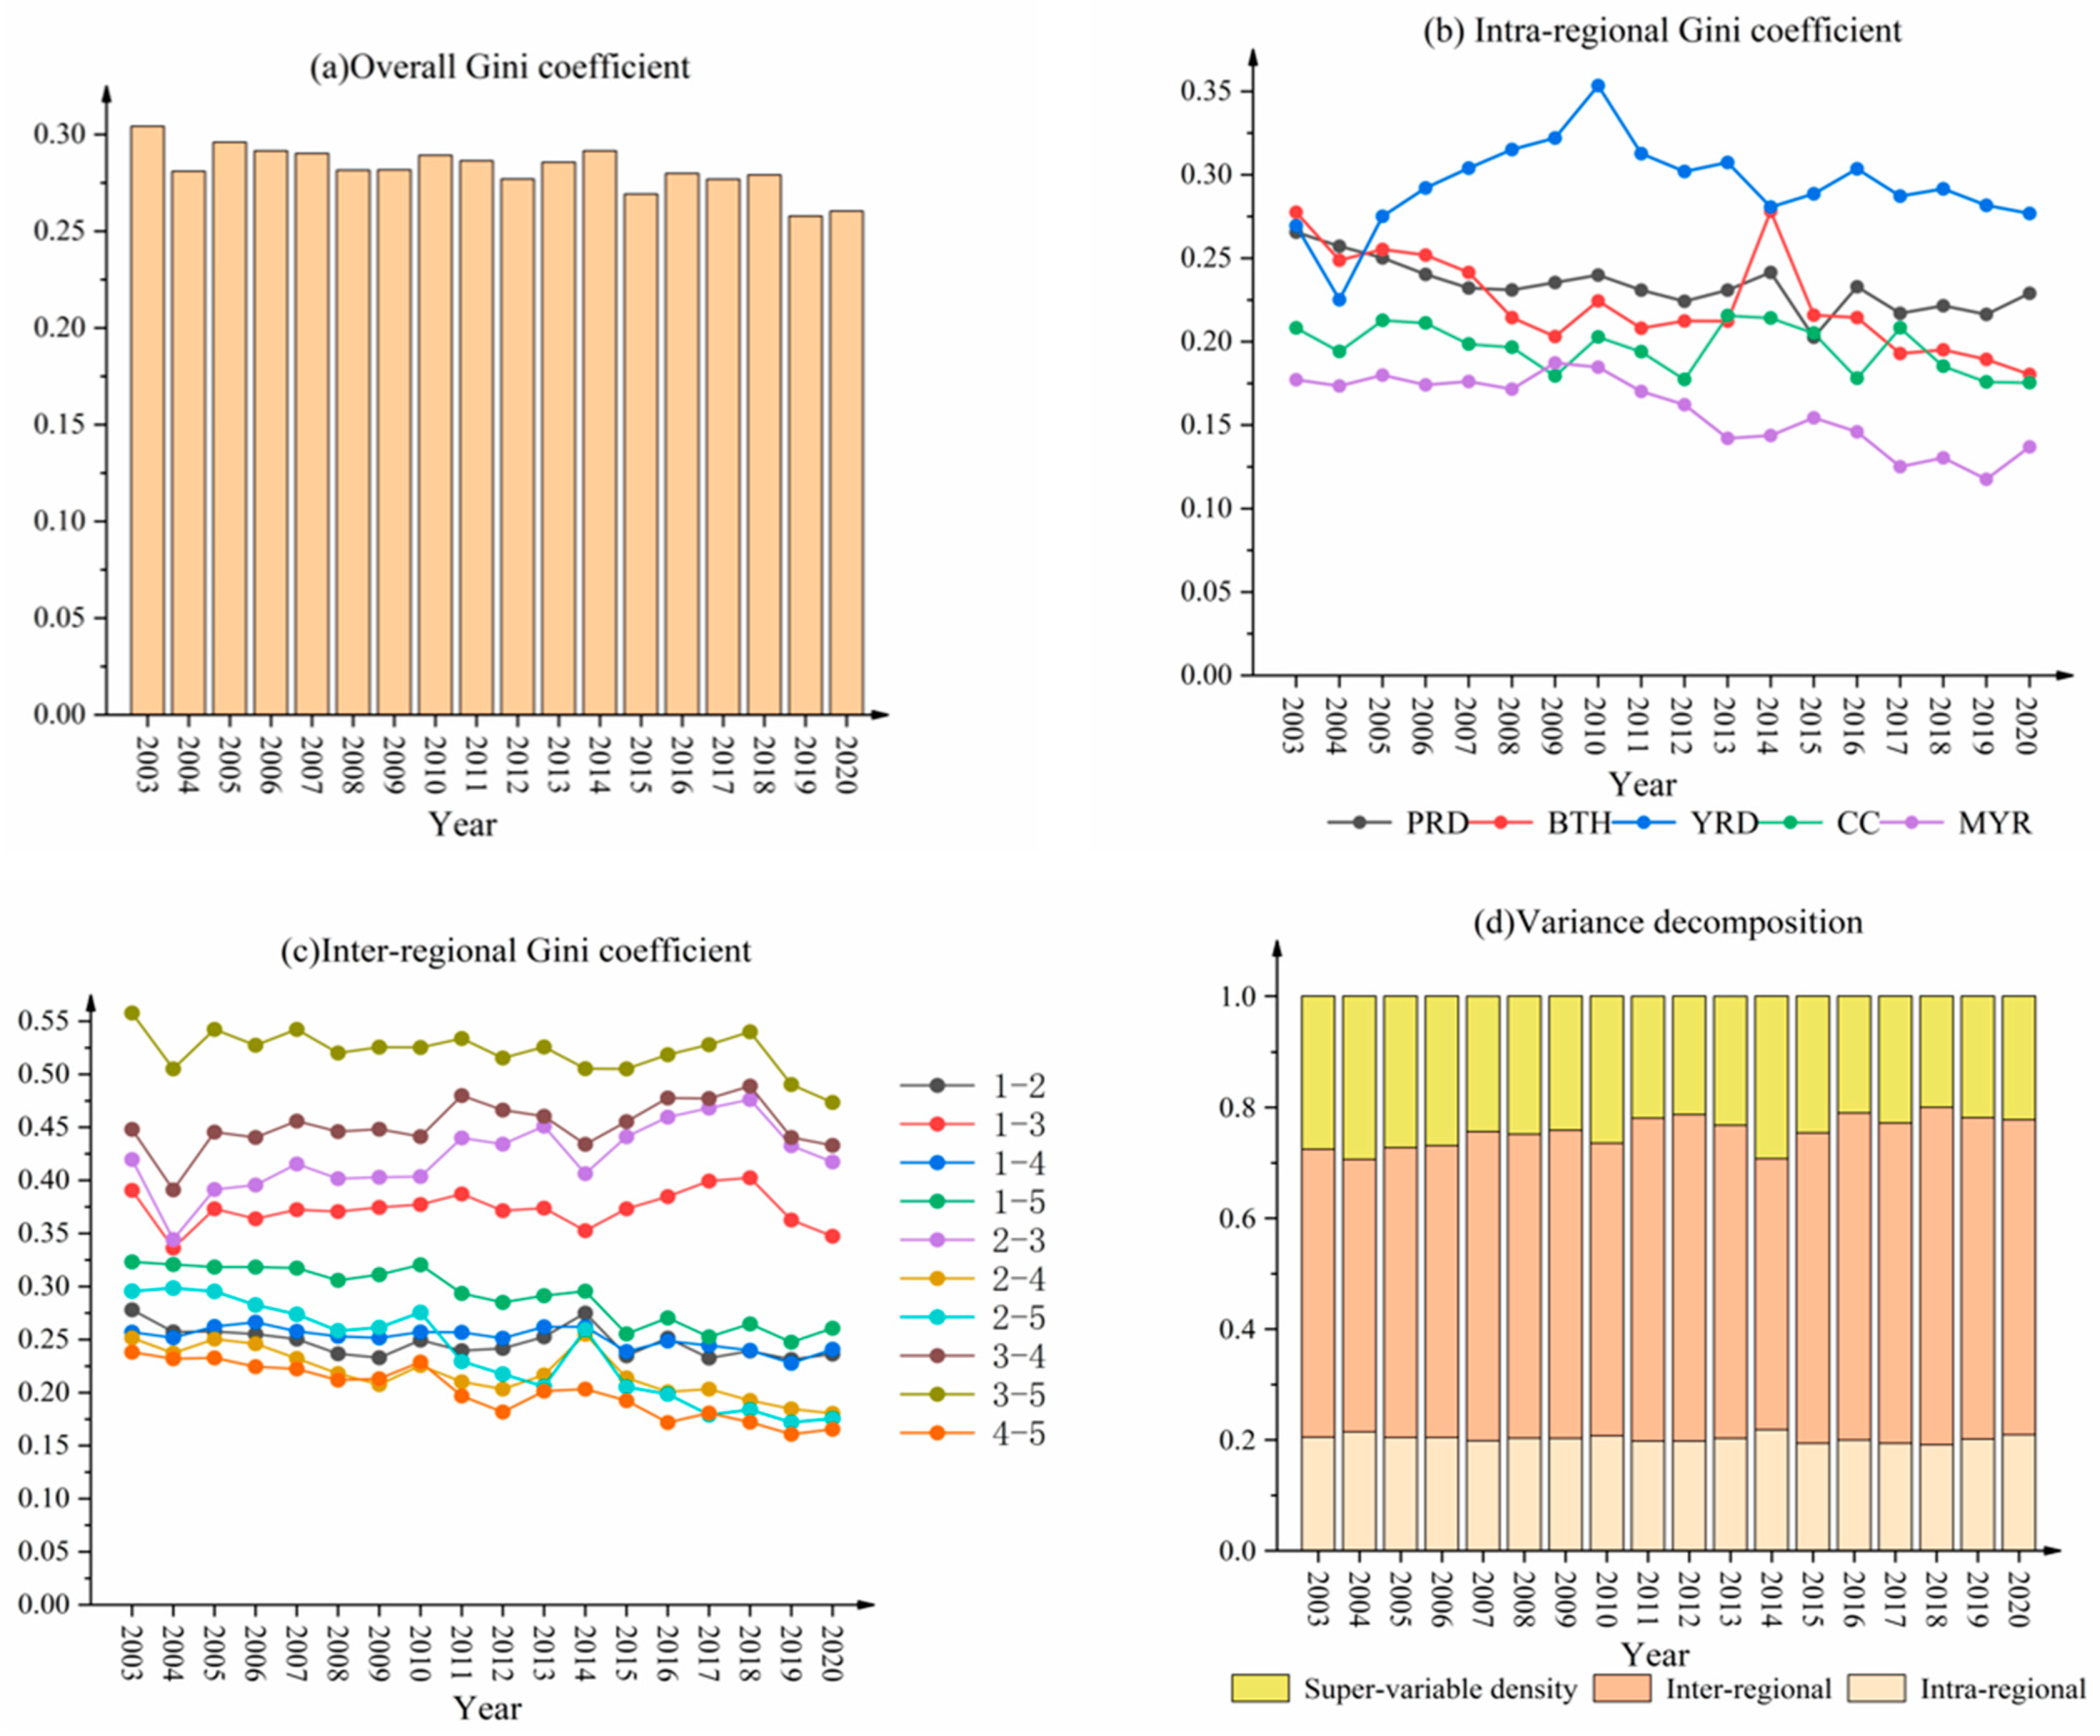
4.2.1. Overall Differences and Evolutionary Trends
4.2.2. Intra-Regional Differences and Evolutionary Trends
4.2.3. Inter-Regional Differences and Evolutionary Trends
4.2.4. Sources of Differences in the UGHQD Level and Their Contribution
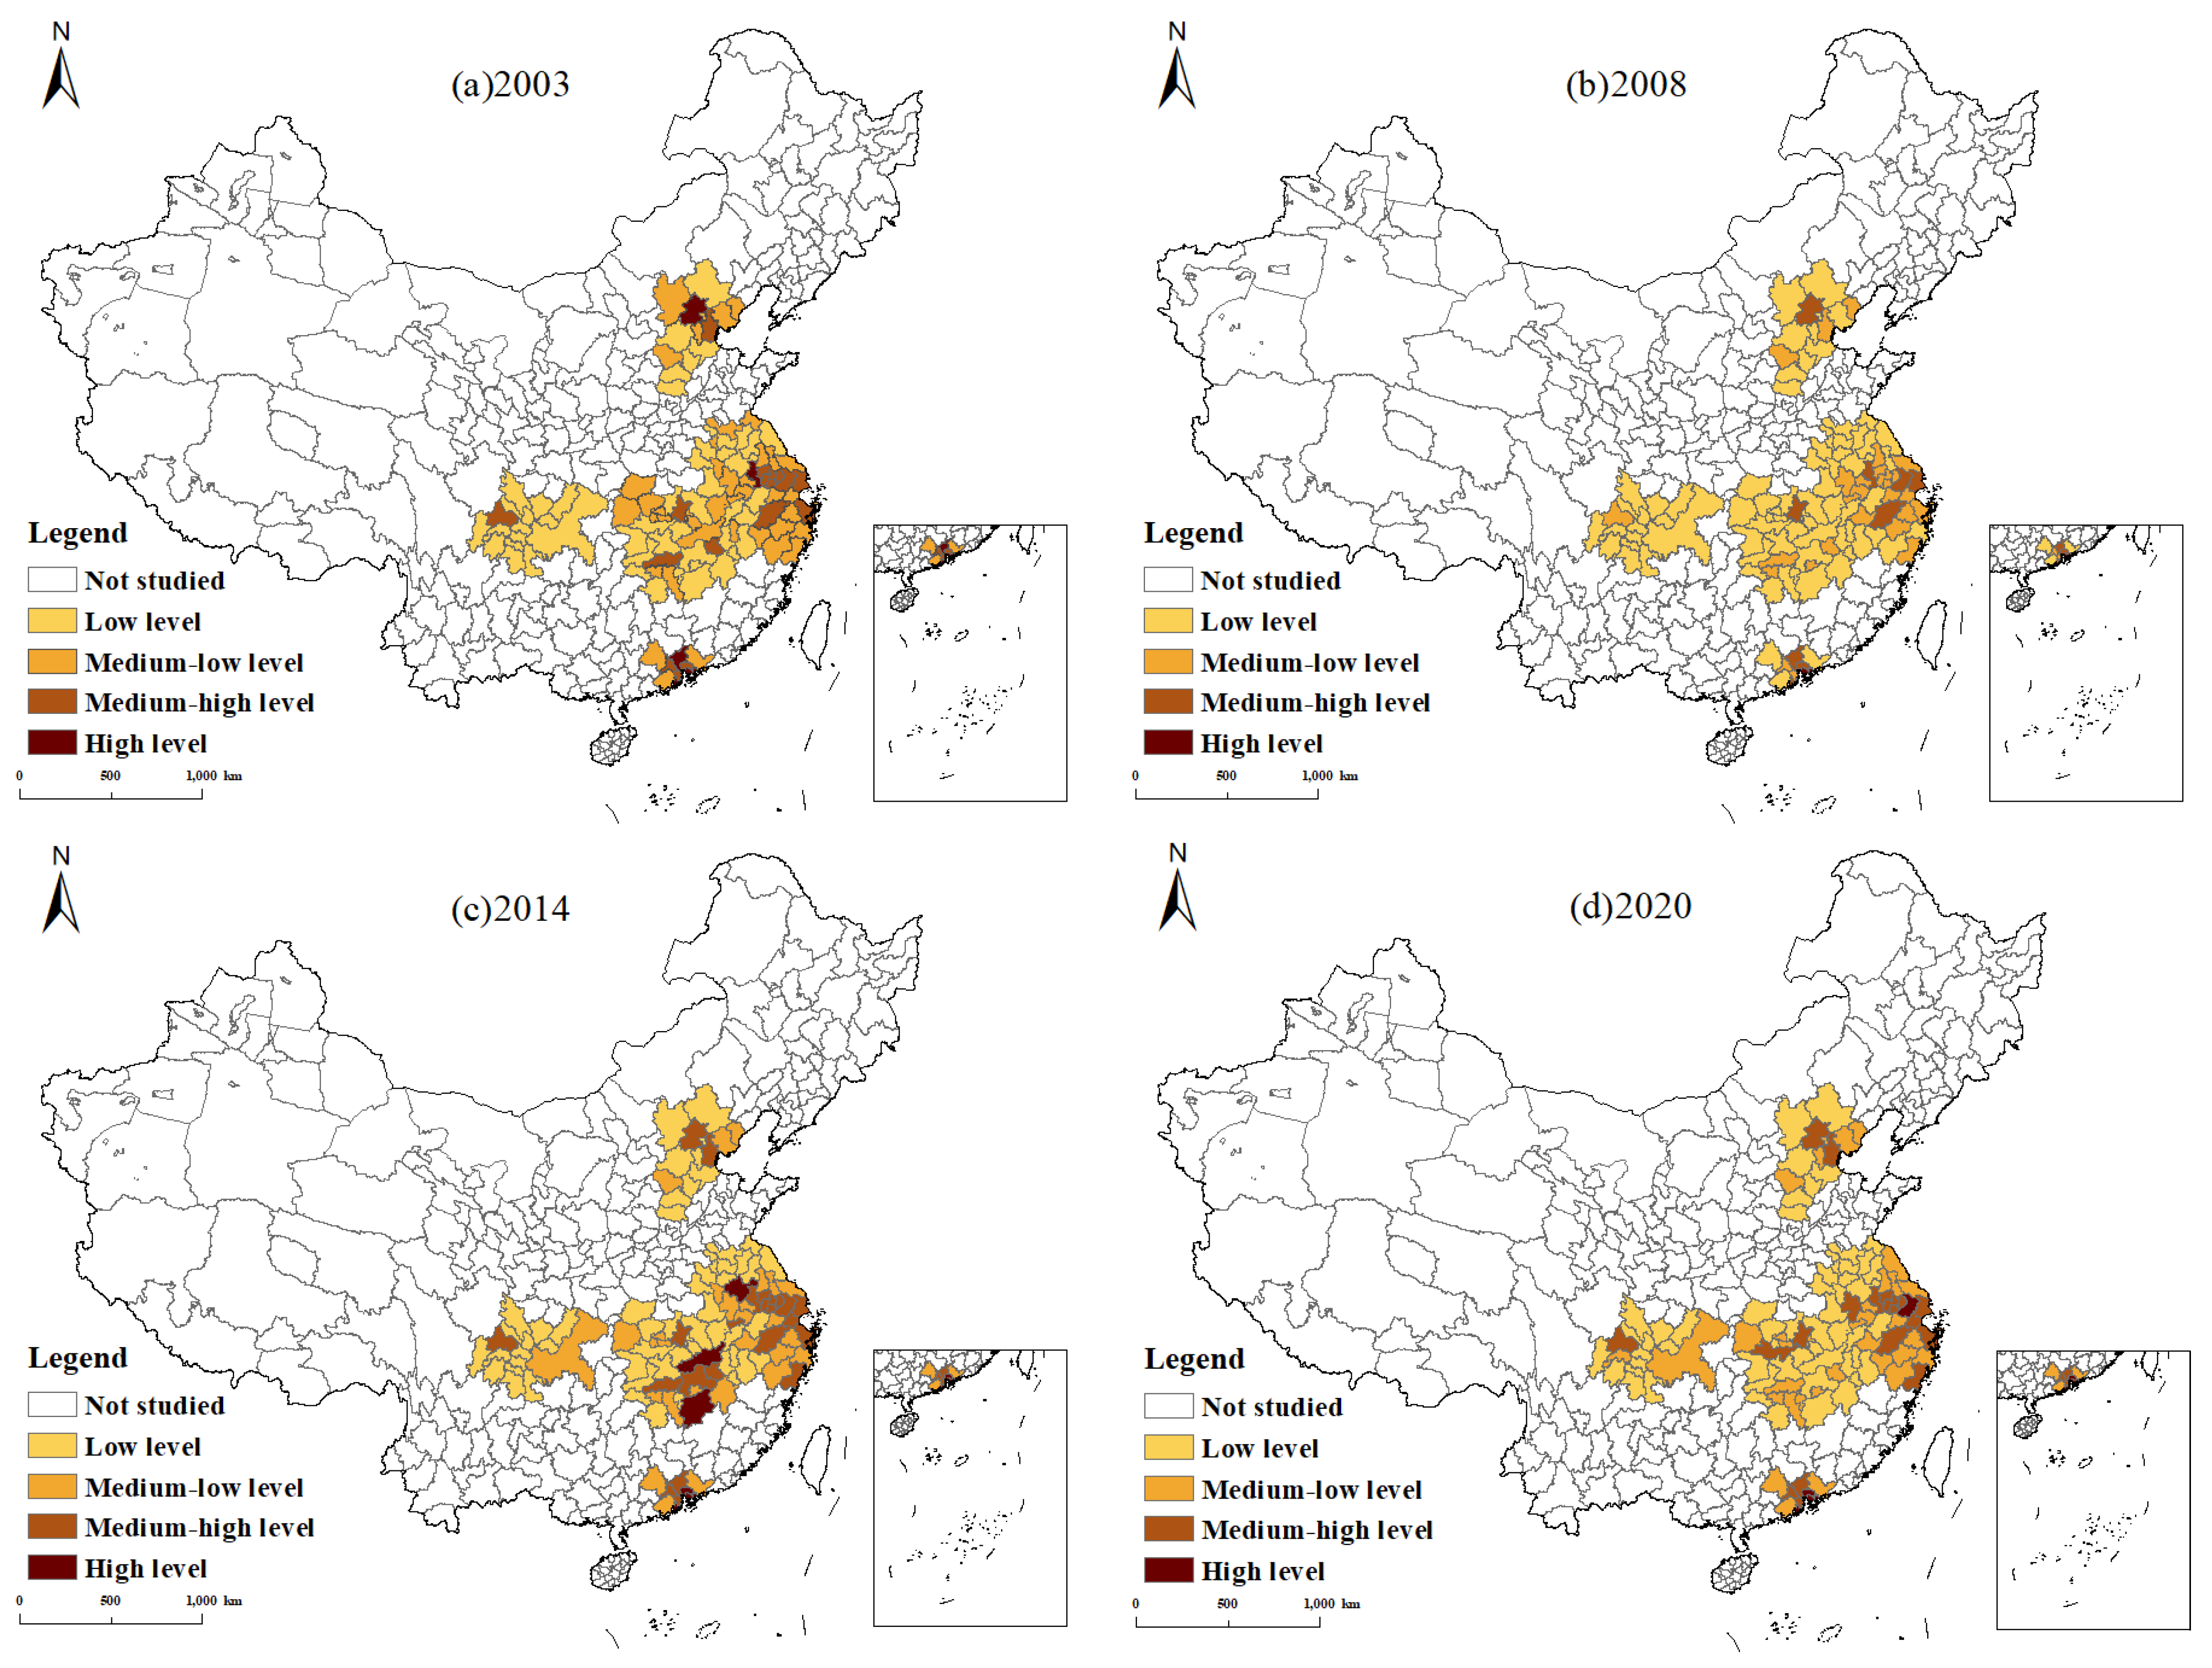
4.3. Dynamic Evolution
4.4. Transfer Probabilities
4.4.1. Traditional Markov Chain Analysis
4.4.2. Spatial Markov Chain Analysis
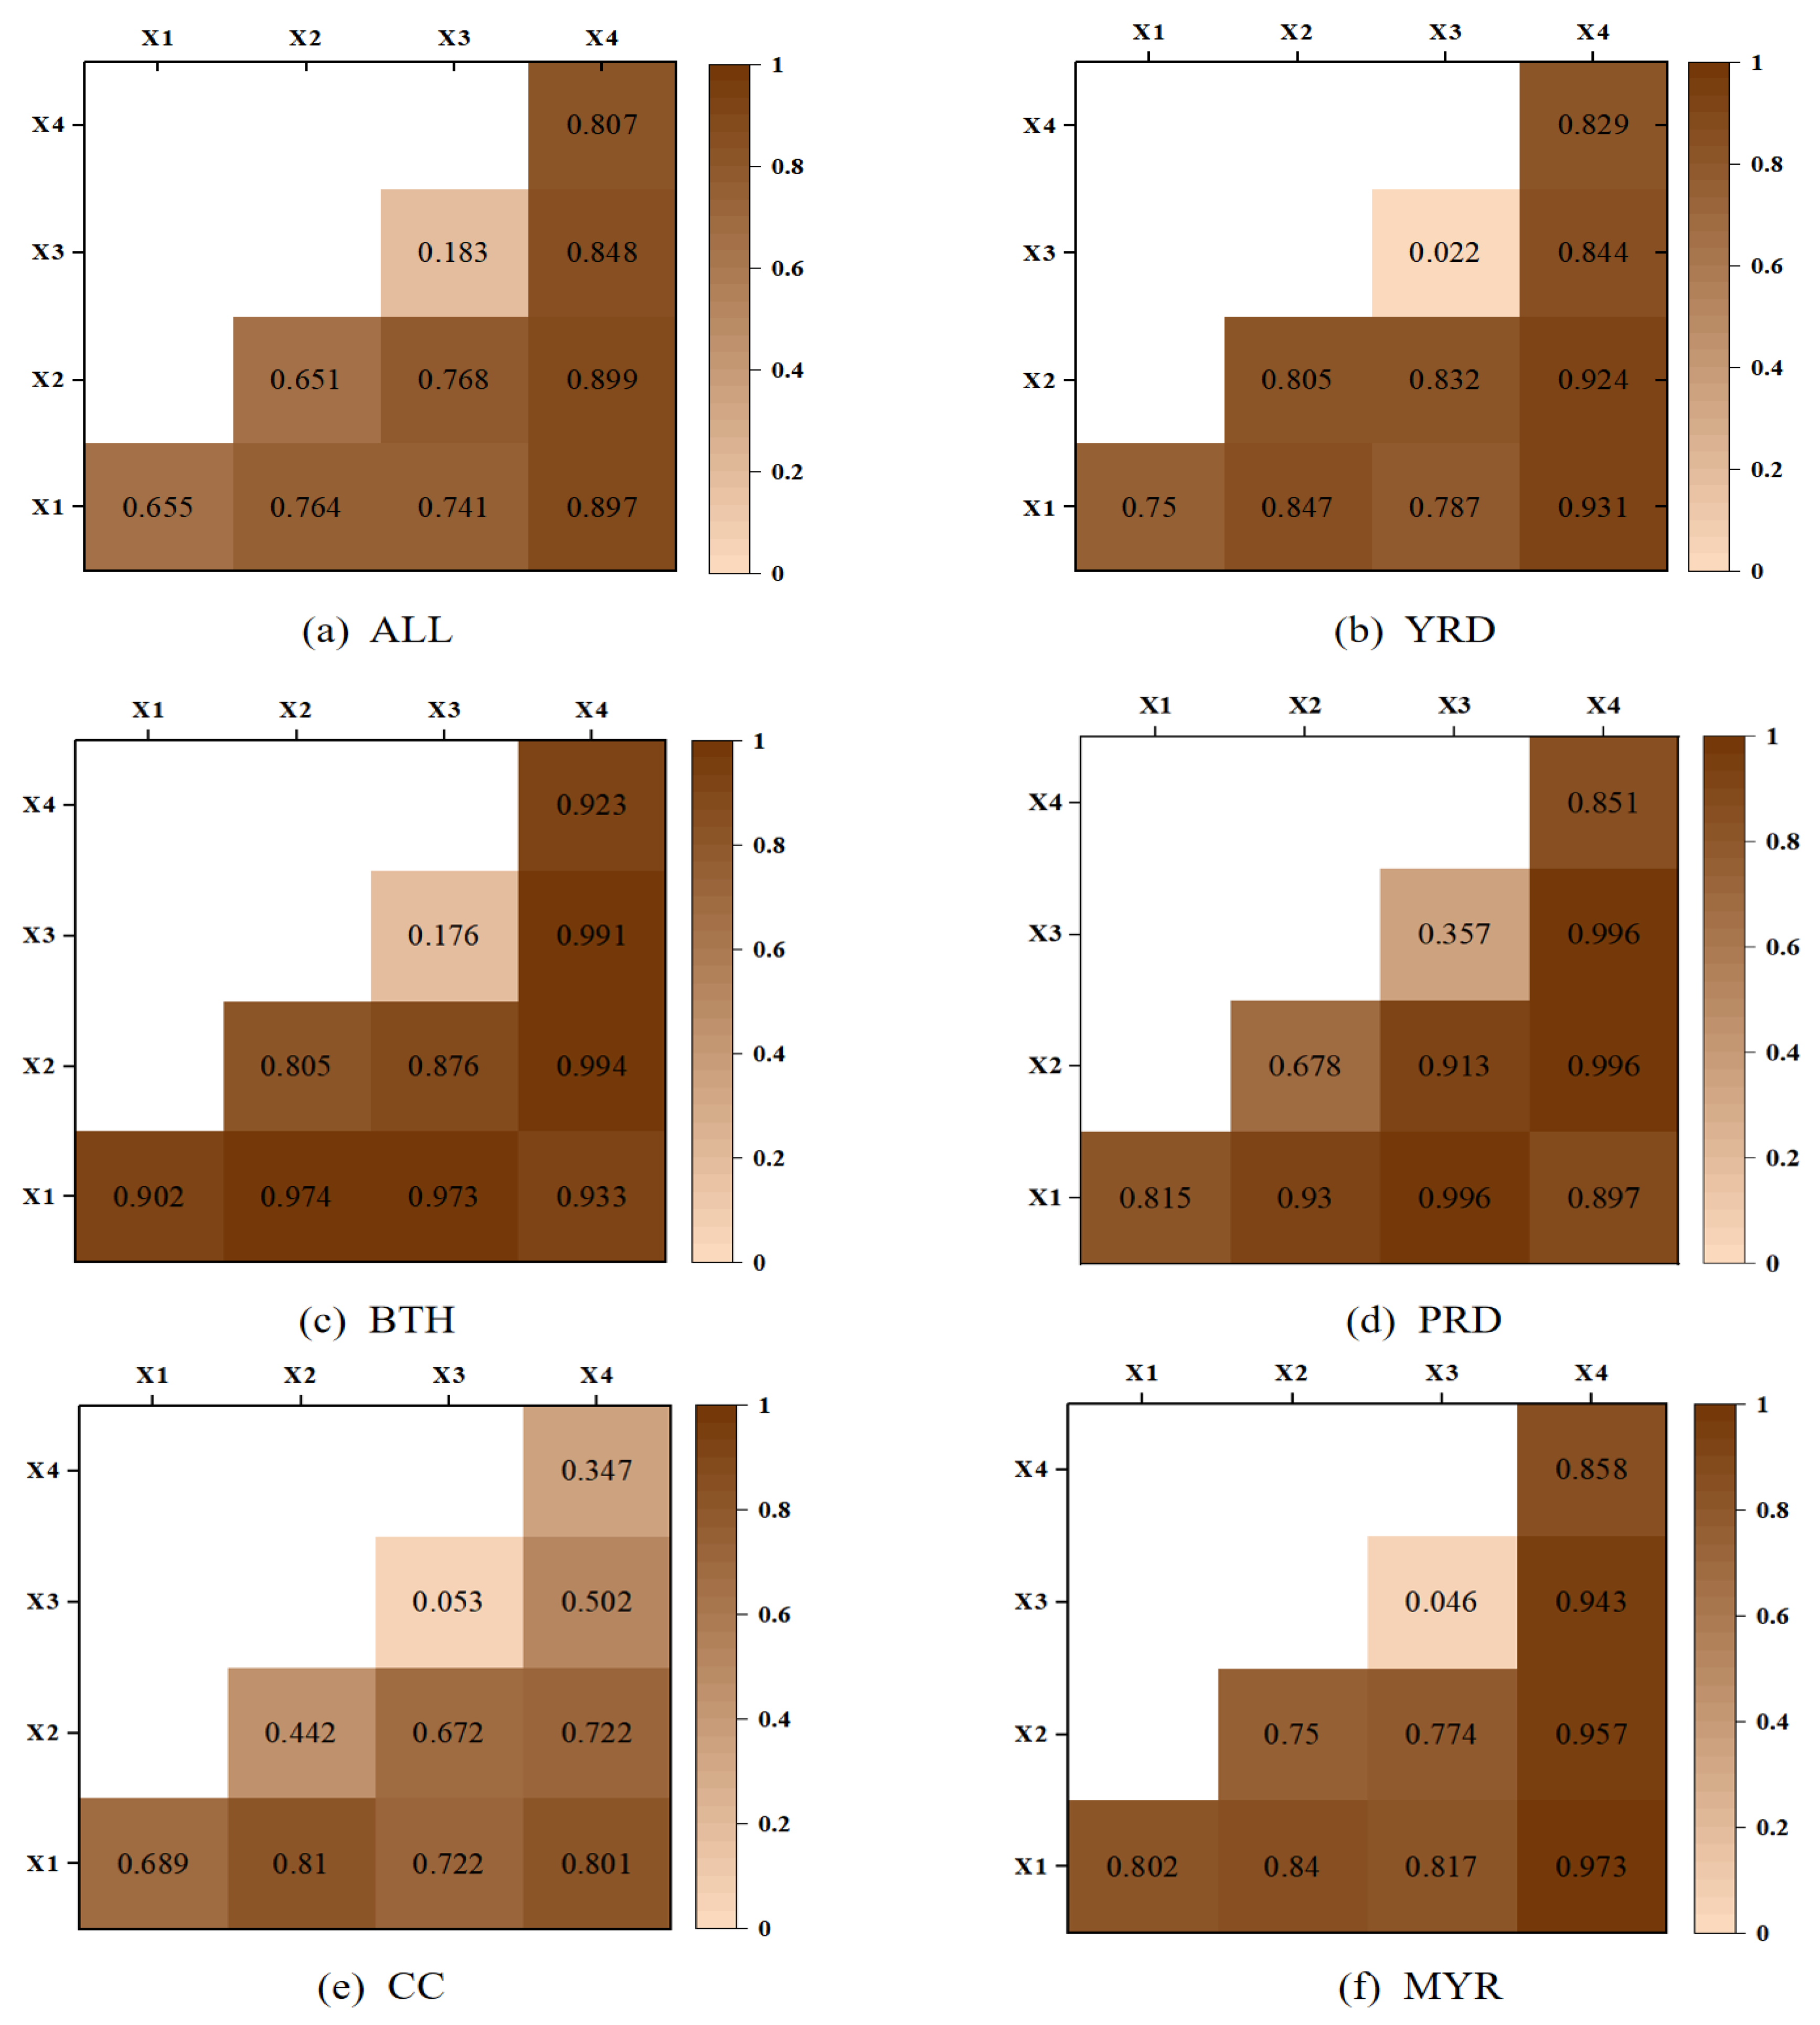
4.5. Driving Factors
4.5.1. Factor Detection Analysis
4.5.2. Interactive Detection Analysis
5. Discussion
6. Conclusions
- (1)
- The UGHQD levels of the five major urban agglomerations demonstrated a consistent upward trajectory during the period of 2003–2020. Coastal regions, specifically the PRD and YRD, consistently outperformed inland agglomerations. The Chengdu-Chongqing urban agglomeration, however, persistently lagged behind its counterparts, necessitating close scrutiny.
- (2)
- Significant spatial differences existed in the UGHQD levels among the urban agglomerations. Inter-regional differences among the sub-clusters primarily drove these differences. Coastal urban agglomerations consistently led in terms of UGHQD, creating a pronounced development gap when compared to the central and western urban agglomerations.
- (3)
- The spatio-temporal evolution of UGHQD levels in 107 cities within these five major urban agglomerations exhibited a trend of moving from a concentrated to a dispersed pattern. The dynamism of this distribution varied among different urban agglomerations. Additionally, the phenomenon of “club convergence” was observed in UGHQD levels, making it challenging to achieve a leap across different types. Upon accounting for spatial lag effects, the potential for upward mobility was more prominent in low-level areas.
- (4)
- Diverse driving factors underpinned UGHQD levels in the five major urban agglomerations. Among them, the impact of technological innovation (TI) notably surpassed other factors. Interactive detection analysis further revealed a prominent synergistic effect between technological innovation (TI) and other driving factors, affirming that technological innovation served as the primary driver behind the spatial differentiation of UGHQD.
Author Contributions
Funding
Data Availability Statement
Conflicts of Interest
References
- Chen, H.; Qi, S.; Tan, X. Decomposition and prediction of China’s carbon emission intensity towards carbon neutrality: From perspectives of national, regional and sectoral level. Sci. Total Environ. 2022, 825, 153839. [Google Scholar] [CrossRef] [PubMed]
- Wei, L.; Liu, Z. Spatial heterogeneity of demographic structure effects on urban carbon emissions. Environ. Impact Assess. Rev. 2022, 95, 106790. [Google Scholar] [CrossRef]
- Andiappan, V.; Foo, D.C.Y.; Tan, R.R. Process-to-Policy (P2Pol): Using carbon emission pinch analysis (CEPA) tools for policy-making in the energy sector. Clean Technol. Environ. Policy 2019, 21, 1383–1388. [Google Scholar] [CrossRef]
- Huang, M.; Ye, Q. The Marxist green development concept and green development in contemporary China: Comment on incompatibility theory between environment and development. Econ. Res. J. 2017, 52, 17–30. [Google Scholar]
- Xu, Y.; Wen, S.; Tao, C.Q. Impact of environmental tax on pollution control: A sustainable development perspective. Econ. Anal. Policy 2023, 79, 89–106. [Google Scholar] [CrossRef]
- Jansen, L. The challenge of sustainable development. J. Clean. Prod. 2003, 11, 231–245. [Google Scholar] [CrossRef]
- Wang, Y.; Guo, C.; Du, C.; Chen, X.; Jia, L.; Guo, X.; Chen, R.; Zhang, M.; Chen, Z.; Wang, H. Carbon peak and carbon neutrality in China: Goals, implementation path and prospects. China Geol. 2021, 4, 720–746. [Google Scholar] [CrossRef]
- Iftikhar, Y.; Wang, Z.; Zhang, B.; Wang, B. Energy and CO2 emissions efficiency of major economies: A network DEA approach. Energy 2018, 147, 197–207. [Google Scholar] [CrossRef]
- Zhu, X. Understanding China’s growth: Past, present, and future. J. Econ. Perspect. 2012, 26, 103–124. [Google Scholar] [CrossRef]
- Cui, X.; Cai, T.; Deng, W.; Zheng, R.; Jiang, Y.; Bao, H. Indicators for Evaluating High-Quality Agricultural Development: Empirical Study from Yangtze River Economic Belt, China. Soc. Indic. Res. 2022, 164, 1101–1127. [Google Scholar] [CrossRef]
- Kumar, R.R.; Stauvermann, P.J.; Patel, A. Exploring the link between research and economic growth: An empirical study of China and USA. Qual. Quant. 2016, 50, 1073–1091. [Google Scholar] [CrossRef]
- Wang, J. Revive China’s green GDP programme. Nature 2016, 534, 37. [Google Scholar] [CrossRef] [PubMed]
- Färe, R.; Grosskopf, S.; Norris, M. Productivity growth, technical progress, and efficiency change in industrialized countries: Reply. Am. Econ. Rev. 1997, 87, 1040–1044. [Google Scholar]
- Wang, X.; Wang, K.; Zhang, Y.; Gao, J.; Xiong, Y. Impact of Climate on the Carbon Sink Capacity of Ecological Spaces: A Case Study from the Beijing–Tianjin–Hebei Urban Agglomeration. Land 2023, 12, 1619. [Google Scholar] [CrossRef]
- Rahman, M.M.; Alam, K. Impact of industrialization and non-renewable energy on environmental pollution in Australia: Do renewable energy and financial development play a mitigating role? Renew. Energy 2022, 195, 203–213. [Google Scholar] [CrossRef]
- Peng, Y.; Chen, Z.; Lee, J. Dynamic convergence of green total factor productivity in Chinese cities. Sustainability 2020, 12, 4883. [Google Scholar] [CrossRef]
- Fang, C.; Yu, D. Urban agglomeration: An evolving concept of an emerging phenomenon. Landsc. Urban Plan. 2017, 162, 126–136. [Google Scholar] [CrossRef]
- Zhang, Q.; Xiao, Y.; Tang, X.; Huang, H. The spatial-temporal evolution and influencing factors of eco-efficiency in the five major urban agglomerations of China. Econ. Geogr. 2022, 42, 54–63. [Google Scholar] [CrossRef]
- Tian, Y.; Wang, R.; Liu, L.; Ren, Y. A spatial effect study on financial agglomeration promoting the green development of urban agglomerations. Sustain. Cities Soc. 2021, 70, 102900. [Google Scholar] [CrossRef]
- Li, L.; Hu, J. Ecological total-factor energy efficiency of regions in China. Energy Policy 2012, 46, 216–224. [Google Scholar] [CrossRef]
- Wang, Y.; Yao, L.; Xu, Y.; Sun, S.; Li, T. Potential heterogeneity in the relationship between urbanization and air pollution, from the perspective of urban agglomeration. J. Clean. Prod. 2021, 298, 126822. [Google Scholar] [CrossRef]
- Wang, Z.; Li, J.; Liang, L. Spatio-temporal evolution of ozone pollution and its influencing factors in the Beijing-Tianjin-Hebei Urban Agglomeration. Environ. Pollut. 2020, 256, 113419. [Google Scholar] [CrossRef] [PubMed]
- Zhibiao, L.; Yonghui, L. Structural transformation, TFP and high-quality development. China Econ. 2022, 17, 70–82. [Google Scholar] [CrossRef]
- He, X.; Shen, K. Modernized economic system, total factor productivity and high quality development. Shanghai J. Econ. 2018, 6, 25–34. [Google Scholar] [CrossRef]
- Chen, Y.; Zhu, M.; Lu, J.; Zhou, Q.; Ma, W. Evaluation of ecological city and analysis of obstacle factors under the background of high-quality development: Taking cities in the Yellow River Basin as examples. Ecol. Indic. 2020, 118, 106771. [Google Scholar] [CrossRef]
- Wang, R.; Wang, F. Exploring the role of green finance and energy development towards high-quality economic development: Application of spatial Durbin model and intermediary effect model. Int. J. Environ. Res. Public Health 2022, 19, 8875. [Google Scholar] [CrossRef]
- Zhu, K.; Song, D.; Zhang, L.; He, Y.; Zhang, S.; Liu, Y.; Tian, X. Evolving Trends and Influencing Factors of the Rural Green Development Level in Chongqing. Land 2023, 12, 1333. [Google Scholar] [CrossRef]
- Hickel, J.; Kallis, G. Is green growth possible? New Political Econ. 2020, 25, 469–486. [Google Scholar] [CrossRef]
- Zhou, G.; Zhang, Z.; Fei, Y. How to evaluate the green and high-quality development path? An FsQCA approach on the China pilot free trade zone. Int. J. Environ. Res. Public Health 2022, 19, 547. [Google Scholar] [CrossRef]
- Shi, X.; Li, L. Green total factor productivity and its decomposition of Chinese manufacturing based on the MML index: 2003–2015. J. Clean. Prod. 2019, 222, 998–1008. [Google Scholar] [CrossRef]
- Ma, D.; Zhu, Q. Innovation in emerging economies: Research on the digital economy driving high-quality green development. J. Bus. Res. 2022, 145, 801–813. [Google Scholar] [CrossRef]
- Schandl, H.; West, J. Resource use and resource efficiency in the Asia–Pacific region. Glob. Environ. Chang. 2010, 20, 636–647. [Google Scholar] [CrossRef]
- Barro, R.J. Quantity and Quality of Economic Growth; Banco Central de Chile: Santiago, Chile, 2002. [Google Scholar]
- Yamazaki, A. Jobs and climate policy: Evidence from British Columbia’s revenue-neutral carbon tax. J. Environ. Econ. Manag. 2017, 83, 197–216. [Google Scholar] [CrossRef]
- He, S.; Fang, B.; Xie, X. Temporal and Spatial Evolution and Driving Mechanism of Urban Ecological Welfare Performance from the Perspective of High-Quality Development: A Case Study of Jiangsu Province, China. Land 2022, 11, 1607. [Google Scholar] [CrossRef]
- Li, J.; Dong, K.; Dong, X. Green energy as a new determinant of green growth in China: The role of green technological innovation. Energy Econ. 2022, 114, 106260. [Google Scholar] [CrossRef]
- Melander, L.; Arvidsson, A. Green innovation networks: A research agenda. J. Clean. Prod. 2022, 357, 131926. [Google Scholar] [CrossRef]
- Ge, T.; Cai, X.; Song, X. How does renewable energy technology innovation affect the upgrading of industrial structure? The moderating effect of green finance. Renew. Energy 2022, 197, 1106–1114. [Google Scholar] [CrossRef]
- Michaelides, P.; Milios, J. TFP change, output gap and inflation in the Russian Federation (1994–2006). J. Econ. Bus. 2009, 61, 339–352. [Google Scholar] [CrossRef]
- Jefferson, G.H.; Rawski, T.G.; Zhang, Y. Productivity growth and convergence across China’s industrial economy. J. Chin. Econ. Bus. Stud. 2008, 6, 121–140. [Google Scholar] [CrossRef]
- Emrouznejad, A.; Yang, G. A survey and analysis of the first 40 years of scholarly literature in DEA: 1978–2016. Socio-Econ. Plan. Sci. 2018, 61, 4–8. [Google Scholar] [CrossRef]
- Wu, D.; Wang, Y.; Qian, W. Efficiency evaluation and dynamic evolution of China’s regional green economy: A method based on the Super-PEBM model and DEA window analysis. J. Clean. Prod. 2020, 264, 121630. [Google Scholar] [CrossRef]
- Guo, A.; Liu, P.; Zhong, F.; Yang, C.; Luo, X. Borrowing Size and Urban Green Development Efficiency in the City Network of China: Impact Measures and Size Thresholds. Land 2022, 11, 493. [Google Scholar] [CrossRef]
- Coto-Millán, P.; de la Fuente, M.; Fernández, X.L. Determinants of the European electricity companies efficiency: 2005–2014. Energy Strategy Rev. 2018, 21, 149–156. [Google Scholar] [CrossRef]
- Sun, P.; Liu, L.; Qayyum, M. Energy efficiency comparison amongst service industry in Chinese provinces from the perspective of heterogeneous resource endowment: Analysis using undesirable super efficiency SBM-ML model. J. Clean. Prod. 2021, 328, 129535. [Google Scholar] [CrossRef]
- Zhang, H.; Qin, Y.; Xu, J.; Ren, W. Analysis of the Evolution Characteristics and Impact Factors of Green Production Efficiency of Grain in China. Land 2023, 12, 852. [Google Scholar] [CrossRef]
- Jiang, H.; Jiang, P.; Wang, D.; Wu, J. Can smart city construction facilitate green total factor productivity? A quasi-natural experiment based on China’s pilot smart city. Sustain. Cities Soc. 2021, 69, 102809. [Google Scholar] [CrossRef]
- Zhao, X.; Nakonieczny, J.; Jabeen, F.; Shahzad, U.; Jia, W. Does green innovation induce green total factor productivity? Novel findings from Chinese city level data. Technol. Forecast. Soc. Chang. 2022, 185, 122021. [Google Scholar] [CrossRef]
- Chao, X.; Ren, B. The fluctuation and regional difference of quality of economic growth in China. Econ. Res. J. 2011, 46, 26–40. [Google Scholar]
- Wu, H.; Li, Y.; Hao, Y.; Ren, S.; Zhang, P. Environmental decentralization, local government competition, and regional green development: Evidence from China. Sci. Total Environ. 2020, 708, 135085. [Google Scholar] [CrossRef]
- Zhong, Z.; Chen, Z. Business environment, technological innovation and government intervention: Influences on high-quality economic development. Manag. Decis. 2023, 61, 2413–2441. [Google Scholar] [CrossRef]
- Liu, L.; Ding, T.; Wang, H. Digital economy, technological innovation and green high-quality development of industry: A study case of China. Sustainability 2022, 14, 11078. [Google Scholar] [CrossRef]
- Ma, S.; Huang, J. Analysis of the spatio-temporal coupling coordination mechanism supporting economic resilience and high-quality economic development in the urban agglomeration in the middle reaches of the Yangtze River. PLoS ONE 2023, 18, e0281643. [Google Scholar] [CrossRef] [PubMed]
- Pan, W.; Wang, J.; Lu, Z.; Liu, Y.; Li, Y. High-quality development in China: Measurement system, spatial pattern, and improvement paths. Habitat Int. 2021, 118, 102458. [Google Scholar] [CrossRef]
- Ren, P.; Liu, J. Theoretical connotation, evaluation criteria and path to realization of high quality green development. Inn. Mong. Soc. Sci. 2019, 40, 123. [Google Scholar] [CrossRef]
- Zheng, W.; Zhang, L.; Hu, J. Green credit, carbon emission and high quality development of green economy in China. Energy Rep. 2022, 8, 12215–12226. [Google Scholar] [CrossRef]
- Weng, Q.; Qin, Q.; Li, L. A comprehensive evaluation paradigm for regional green development based on “Five-Circle Model”: A case study from Beijing-Tianjin-Hebei. J. Clean. Prod. 2020, 277, 124076. [Google Scholar] [CrossRef]
- Xie, R.; Yuan, Y.; Huang, J. Different types of environmental regulations and heterogeneous influence on “green” productivity: Evidence from China. Ecol. Econ. 2017, 132, 104–112. [Google Scholar] [CrossRef]
- Chen, Y.; Tian, W.; Zhou, Q.; Shi, T. Spatiotemporal and driving forces of Ecological Carrying Capacity for high-quality development of 286 cities in China. J. Clean. Prod. 2021, 293, 126186. [Google Scholar] [CrossRef]
- Liu, L.; Gu, T.; Wang, H. The Coupling Coordination between Digital Economy and Industrial Green High-Quality Development: Spatio-Temporal Characteristics, Differences and Convergence. Sustainability 2022, 14, 16260. [Google Scholar] [CrossRef]
- Li, Z.; Yang, W.; Wang, C.; Zhang, Y.; Yuan, X. Guided High-Quality Development, Resources, and Environmental Forcing in China’s Green Development. Sustainability 2019, 11, 1936. [Google Scholar] [CrossRef]
- Zhou, X.; Wu, W. The measurement and analysis of the inclusive green growth in China. J. Quant. Tech. Econ. 2018, 8, 3–20. [Google Scholar] [CrossRef]
- Ke, N.; Lu, X.; Kuang, B.; Zhang, X. Regional disparities and evolution trend of city-level carbon emission intensity in China. Sustain. Cities Soc. 2023, 88, 104288. [Google Scholar] [CrossRef]
- Yang, J.; Zou, R.; Cheng, J.; Geng, Z.; Li, Q. Environmental technical efficiency and its dynamic evolution in China’s industry: A resource endowment perspective. Resour. Policy 2023, 82, 103451. [Google Scholar] [CrossRef]
- Tan, S.; Hu, B.; Kuang, B.; Zhou, M. Regional differences and dynamic evolution of urban land green use efficiency within the Yangtze River Delta, China. Land Use Policy 2021, 106, 105449. [Google Scholar] [CrossRef]
- Liu, Z.; Wakasi, R.A. A research of the regional disparities and distributional dynamic evolution of high-quality agricultural development in China. Quant. Tech. Econ. 2021, 6, 28–44. [Google Scholar] [CrossRef]
- Song, M.; Wu, J.; Song, M.; Zhang, L.; Zhu, Y. Spatiotemporal regularity and spillover effects of carbon emission intensity in China’s Bohai Economic Rim. Sci. Total Environ. 2020, 740, 140184. [Google Scholar] [CrossRef]
- Huang, Y.; Zhu, H.; Zhang, Z. The heterogeneous effect of driving factors on carbon emission intensity in the Chinese transport sector: Evidence from dynamic panel quantile regression. Sci. Total Environ. 2020, 727, 138578. [Google Scholar] [CrossRef]
- Wang, J.; Xu, C. Geodetector: Principle and prospective. Acta Geogr. Sin. 2017, 72, 116–134. [Google Scholar]
- Peng, W.; Kuang, T.; Tao, S. Quantifying influences of natural factors on vegetation NDVI changes based on geographical detector in Sichuan, western China. J. Clean. Prod. 2019, 233, 353–367. [Google Scholar] [CrossRef]
- Wang, G.; Peng, W.; Zhang, L. Estimate of population density and diagnosis of main factors of spatial heterogeneity in the metropolitan scale, western China. Heliyon 2023, 9, e16285. [Google Scholar] [CrossRef]
- Liu, X.; Zhang, P.; Shi, X. Industrial Agglomeration, Technological Innovation and High-quality Economic Development: Empirical Research based on China’s Five Major Urban Agglomerations. Reform 2022, 36, 68–87. [Google Scholar]
- Dagum, C. A New Approach to the Decomposition of the Gini Income Inequality Ratio. Empir. Econ. 1997, 22, 515–531. [Google Scholar] [CrossRef]
- Cui, X.; Zhang, J.; Huang, W.; Liu, C.; Shan, L.; Jiang, Y. Spatial Pattern and Mechanism of the Life Service Industry in Polycentric Cities: Experience from Wuhan, China. J. Urban Plan. Dev. 2023, 149, 05023015. [Google Scholar] [CrossRef]
- Cui, X.; Yang, S.; Zhang, G.; Liang, B.; Li, F. An Exploration of a Synthetic Construction Land Use Quality Evaluation Based on Economic-Social-Ecological Coupling Perspective: A Case Study in Major Chinese Cities. Int. J. Environ. Res. Public Health 2020, 17, 3663. [Google Scholar] [CrossRef]
- Zou, Z.; Yi, Y.; Sun, J. Entropy method for determination of weight of evaluating indicators in fuzzy synthetic evaluation for water quality assessment. J. Environ. Sci. 2006, 18, 1020–1023. [Google Scholar] [CrossRef]
- Li, D.; Yang, J.; Hu, T.; Wang, G.; Cushman, S.A.; Wang, X.; László, K.; Su, R.; Yuan, L.; Li, B.; et al. The seeds of ecological recovery in urbanization–Spatiotemporal evolution of ecological resiliency of Dianchi Lake Basin, China. Ecol. Indic. 2023, 153, 110431. [Google Scholar] [CrossRef]
- Zhang, S.; Wu, Z.; Wang, Y.; Hao, Y. Fostering green development with green finance: An empirical study on the environmental effect of green credit policy in China. J. Environ. Manag. 2021, 296, 113159. [Google Scholar] [CrossRef] [PubMed]
- Wang, F.; Wang, R.; He, Z. The impact of environmental pollution and green finance on the high-quality development of energy based on spatial Dubin model. Resour. Policy 2021, 74, 102451. [Google Scholar] [CrossRef]
- Ye, D.; Yang, L.; Zhou, M. Spatiotemporal Variation in Ecosystem Health and Its Driving Factors in Guizhou Province. Land 2023, 12, 1439. [Google Scholar] [CrossRef]
- Bai, L.; Jiang, L.; Yang, D.; Liu, Y. Quantifying the spatial heterogeneity influences of natural and socioeconomic factors and their interactions on air pollution using the geographical detector method: A case study of the Yangtze River Economic Belt, China. J. Clean. Prod. 2019, 232, 692–704. [Google Scholar] [CrossRef]


| Span of 1 Year | Span of 2 Years | Span of 3 Years | |||||||||||
|---|---|---|---|---|---|---|---|---|---|---|---|---|---|
| Region | Type | L | ML | MH | H | L | ML | MH | H | L | ML | MH | H |
| ALL | L | 0.817 | 0.180 | 0.000 | 0.002 | 0.668 | 0.328 | 0.000 | 0.004 | 0.521 | 0.467 | 0.006 | 0.006 |
| ML | 0.008 | 0.773 | 0.204 | 0.015 | 0.000 | 0.600 | 0.387 | 0.013 | 0.000 | 0.431 | 0.552 | 0.017 | |
| MH | 0.000 | 0.009 | 0.830 | 0.161 | 0.000 | 0.005 | 0.693 | 0.302 | 0.000 | 0.003 | 0.531 | 0.466 | |
| H | 0.002 | 0.010 | 0.019 | 0.969 | 0.000 | 0.008 | 0.017 | 0.975 | 0.000 | 0.003 | 0.023 | 0.974 | |
| YRD | L | 0.822 | 0.173 | 0.005 | 0.000 | 0.649 | 0.346 | 0.005 | 0.000 | 0.503 | 0.486 | 0.011 | 0.000 |
| ML | 0.000 | 0.785 | 0.210 | 0.006 | 0.000 | 0.593 | 0.401 | 0.006 | 0.000 | 0.393 | 0.595 | 0.012 | |
| MH | 0.000 | 0.017 | 0.821 | 0.162 | 0.000 | 0.019 | 0.658 | 0.323 | 0.000 | 0.021 | 0.483 | 0.497 | |
| H | 0.000 | 0.006 | 0.013 | 0.981 | 0.000 | 0.000 | 0.029 | 0.971 | 0.000 | 0.000 | 0.035 | 0.965 | |
| PRD | L | 0.829 | 0.171 | 0.000 | 0.000 | 0.707 | 0.268 | 0.024 | 0.000 | 0.585 | 0.366 | 0.049 | 0.000 |
| ML | 0.026 | 0.789 | 0.184 | 0.000 | 0.028 | 0.639 | 0.333 | 0.000 | 0.029 | 0.471 | 0.471 | 0.029 | |
| MH | 0.000 | 0.026 | 0.821 | 0.154 | 0.000 | 0.000 | 0.676 | 0.324 | 0.000 | 0.000 | 0.543 | 0.457 | |
| H | 0.000 | 0.000 | 0.029 | 0.971 | 0.000 | 0.000 | 0.067 | 0.933 | 0.000 | 0.000 | 0.080 | 0.920 | |
| BTH | L | 0.814 | 0.186 | 0.000 | 0.000 | 0.644 | 0.356 | 0.000 | 0.000 | 0.508 | 0.492 | 0.000 | 0.000 |
| ML | 0.000 | 0.793 | 0.207 | 0.000 | 0.000 | 0.603 | 0.397 | 0.000 | 0.000 | 0.414 | 0.586 | 0.000 | |
| MH | 0.000 | 0.000 | 0.855 | 0.145 | 0.000 | 0.000 | 0.729 | 0.271 | 0.000 | 0.000 | 0.561 | 0.439 | |
| H | 0.000 | 0.000 | 0.000 | 1.000 | 0.000 | 0.000 | 0.000 | 1.000 | 0.000 | 0.000 | 0.000 | 1.000 | |
| CC | L | 0.764 | 0.236 | 0.000 | 0.000 | 0.583 | 0.417 | 0.000 | 0.000 | 0.403 | 0.583 | 0.014 | 0.000 |
| ML | 0.028 | 0.764 | 0.208 | 0.000 | 0.014 | 0.569 | 0.403 | 0.014 | 0.000 | 0.389 | 0.569 | 0.042 | |
| MH | 0.000 | 0.000 | 0.764 | 0.236 | 0.000 | 0.000 | 0.571 | 0.429 | 0.000 | 0.000 | 0.413 | 0.587 | |
| H | 0.000 | 0.000 | 0.018 | 0.982 | 0.000 | 0.000 | 0.024 | 0.976 | 0.000 | 0.000 | 0.030 | 0.970 | |
| MYR | L | 0.802 | 0.198 | 0.000 | 0.000 | 0.619 | 0.365 | 0.008 | 0.008 | 0.444 | 0.532 | 0.016 | 0.008 |
| ML | 0.008 | 0.778 | 0.175 | 0.040 | 0.000 | 0.603 | 0.357 | 0.040 | 0.000 | 0.421 | 0.532 | 0.048 | |
| MH | 0.000 | 0.000 | 0.793 | 0.207 | 0.000 | 0.000 | 0.645 | 0.355 | 0.000 | 0.000 | 0.485 | 0.515 | |
| H | 0.000 | 0.010 | 0.058 | 0.932 | 0.000 | 0.012 | 0.047 | 0.942 | 0.000 | 0.000 | 0.056 | 0.944 | |
| Region | Neighborhood | Type | L | ML | MH | H | Region | Neighborhood | Type | L | ML | MH | H |
|---|---|---|---|---|---|---|---|---|---|---|---|---|---|
| YRD | Ⅰ | L | 0.897 | 0.103 | 0.000 | 0.000 | BTH | Ⅰ | L | 0.893 | 0.107 | 0.000 | 0.000 |
| ML | 0.000 | 0.913 | 0.087 | 0.000 | ML | 0.000 | 0.727 | 0.273 | 0.000 | ||||
| MH | 0.000 | 0.000 | 0.833 | 0.167 | MH | 0.000 | 0.000 | 1.000 | 0.000 | ||||
| H | 0.000 | 0.000 | 0.000 | 1.000 | H | 0.000 | 0.000 | 0.000 | 1.000 | ||||
| Ⅱ | L | 0.703 | 0.281 | 0.016 | 0.000 | Ⅱ | L | 0.769 | 0.231 | 0.000 | 0.000 | ||
| ML | 0.000 | 0.833 | 0.167 | 0.000 | ML | 0.000 | 0.917 | 0.083 | 0.000 | ||||
| MH | 0.000 | 0.047 | 0.814 | 0.140 | MH | 0.000 | 0.000 | 0.700 | 0.300 | ||||
| H | 0.000 | 0.000 | 0.000 | 1.000 | H | 0.000 | 0.000 | 0.000 | 1.000 | ||||
| Ⅲ | L | 0.500 | 0.500 | 0.000 | 0.000 | Ⅲ | L | 0.600 | 0.400 | 0.000 | 0.000 | ||
| ML | 0.000 | 0.721 | 0.265 | 0.015 | ML | 0.000 | 0.808 | 0.192 | 0.000 | ||||
| MH | 0.000 | 0.014 | 0.913 | 0.072 | MH | 0.000 | 0.000 | 1.000 | 0.000 | ||||
| H | 0.000 | 0.022 | 0.044 | 0.933 | H | 0.000 | 0.000 | 0.000 | 1.000 | ||||
| Ⅳ | L | 0.000 | 0.000 | 0.000 | 0.000 | Ⅳ | L | 0.000 | 0.000 | 0.000 | 0.000 | ||
| ML | 0.000 | 0.500 | 0.500 | 0.000 | ML | 0.000 | 0.667 | 0.333 | 0.000 | ||||
| MH | 0.000 | 0.000 | 0.706 | 0.294 | MH | 0.000 | 0.000 | 0.844 | 0.156 | ||||
| H | 0.000 | 0.000 | 0.000 | 1.000 | H | 0.000 | 0.000 | 0.000 | 1.000 | ||||
| PRD | Ⅰ | L | 0.923 | 0.077 | 0.000 | 0.000 | CC | Ⅰ | L | 0.907 | 0.093 | 0.000 | 0.000 |
| ML | 0.000 | 0.778 | 0.222 | 0.000 | ML | 0.125 | 0.750 | 0.125 | 0.000 | ||||
| MH | 0.000 | 0.250 | 0.750 | 0.000 | MH | 0.000 | 0.000 | 0.800 | 0.200 | ||||
| H | 0.000 | 0.000 | 0.000 | 0.000 | H | 0.000 | 0.000 | 0.000 | 0.000 | ||||
| Ⅱ | L | 0.800 | 0.200 | 0.000 | 0.000 | Ⅱ | L | 0.552 | 0.448 | 0.000 | 0.000 | ||
| ML | 0.083 | 0.583 | 0.333 | 0.000 | ML | 0.026 | 0.872 | 0.103 | 0.000 | ||||
| MH | 0.000 | 0.000 | 0.818 | 0.182 | MH | 0.000 | 0.000 | 0.667 | 0.333 | ||||
| H | 0.000 | 0.000 | 0.000 | 1.000 | H | 0.000 | 0.000 | 0.000 | 1.000 | ||||
| Ⅲ | L | 0.818 | 0.182 | 0.000 | 0.000 | Ⅲ | L | 0.000 | 0.000 | 0.000 | 0.000 | ||
| ML | 0.000 | 1.000 | 0.000 | 0.000 | ML | 0.000 | 0.625 | 0.375 | 0.000 | ||||
| MH | 0.000 | 0.000 | 0.810 | 0.190 | MH | 0.000 | 0.000 | 0.857 | 0.143 | ||||
| H | 0.000 | 0.000 | 0.000 | 1.000 | H | 0.000 | 0.000 | 0.000 | 1.000 | ||||
| Ⅳ | L | 0.500 | 0.500 | 0.000 | 0.000 | Ⅳ | L | 0.000 | 0.000 | 0.000 | 0.000 | ||
| ML | 0.000 | 0.900 | 0.100 | 0.000 | ML | 0.000 | 0.000 | 1.000 | 0.000 | ||||
| MH | 0.000 | 0.000 | 1.000 | 0.000 | MH | 0.000 | 0.000 | 0.655 | 0.345 | ||||
| H | 0.000 | 0.000 | 0.077 | 0.923 | H | 0.000 | 0.000 | 0.031 | 0.969 | ||||
| MYR | Ⅰ | L | 0.881 | 0.119 | 0.000 | 0.000 | MYR | Ⅲ | L | 0.625 | 0.375 | 0.000 | 0.000 |
| ML | 0.083 | 0.750 | 0.167 | 0.000 | ML | 0.000 | 0.788 | 0.135 | 0.077 | ||||
| MH | 0.000 | 0.000 | 0.625 | 0.375 | MH | 0.000 | 0.000 | 0.714 | 0.286 | ||||
| H | 0.000 | 0.000 | 0.000 | 1.000 | H | 0.000 | 0.000 | 0.036 | 0.964 | ||||
| Ⅱ | L | 0.746 | 0.254 | 0.000 | 0.000 | Ⅳ | L | 0.000 | 0.000 | 0.000 | 0.000 | ||
| ML | 0.000 | 0.848 | 0.130 | 0.022 | ML | 0.000 | 0.563 | 0.438 | 0.000 | ||||
| MH | 0.000 | 0.000 | 0.923 | 0.077 | MH | 0.000 | 0.000 | 0.819 | 0.181 | ||||
| H | 0.000 | 0.056 | 0.000 | 0.944 | H | 0.000 | 0.000 | 0.100 | 0.900 |
| Urban Agglomeration | Factor | q-Value | Urban Agglomeration | Factor | q-Value |
|---|---|---|---|---|---|
| ALL | X1 | 0.6550 *** | BTH | X1 | 0.9021 *** |
| X2 | 0.6513 *** | X2 | 0.8048 | ||
| X3 | 0.1834 * | X3 | 0.1760 | ||
| X4 | 0.8074 *** | X4 | 0.9232 *** | ||
| YRD | X1 | 0.7501 *** | CC | X1 | 0.6885 ** |
| X2 | 0.8055 *** | X2 | 0.4418 | ||
| X3 | 0.0218 | X3 | 0.0527 | ||
| X4 | 0.8290 *** | X4 | 0.3474 * | ||
| PRD | X1 | 0.8148 * | MYR | X1 | 0.8020 *** |
| X2 | 0.6784 | X2 | 0.7495 ** | ||
| X3 | 0.3574 | X3 | 0.0463 | ||
| X4 | 0.8515 ** | X4 | 0.8581 *** |
Disclaimer/Publisher’s Note: The statements, opinions and data contained in all publications are solely those of the individual author(s) and contributor(s) and not of MDPI and/or the editor(s). MDPI and/or the editor(s) disclaim responsibility for any injury to people or property resulting from any ideas, methods, instructions or products referred to in the content. |
© 2023 by the authors. Licensee MDPI, Basel, Switzerland. This article is an open access article distributed under the terms and conditions of the Creative Commons Attribution (CC BY) license (https://creativecommons.org/licenses/by/4.0/).
Share and Cite
Yu, T.; Huang, X.; Jia, S.; Cui, X. Unveiling the Spatio-Temporal Evolution and Key Drivers for Urban Green High-Quality Development: A Comparative Analysis of China’s Five Major Urban Agglomerations. Land 2023, 12, 1962. https://doi.org/10.3390/land12111962
Yu T, Huang X, Jia S, Cui X. Unveiling the Spatio-Temporal Evolution and Key Drivers for Urban Green High-Quality Development: A Comparative Analysis of China’s Five Major Urban Agglomerations. Land. 2023; 12(11):1962. https://doi.org/10.3390/land12111962
Chicago/Turabian StyleYu, Tonghui, Xuan Huang, Shanshan Jia, and Xufeng Cui. 2023. "Unveiling the Spatio-Temporal Evolution and Key Drivers for Urban Green High-Quality Development: A Comparative Analysis of China’s Five Major Urban Agglomerations" Land 12, no. 11: 1962. https://doi.org/10.3390/land12111962
APA StyleYu, T., Huang, X., Jia, S., & Cui, X. (2023). Unveiling the Spatio-Temporal Evolution and Key Drivers for Urban Green High-Quality Development: A Comparative Analysis of China’s Five Major Urban Agglomerations. Land, 12(11), 1962. https://doi.org/10.3390/land12111962