Article

How Can Drones Uncover Land Degradation Hotspots and Restoration Hopespots? An Integrated Approach in the Mount Elgon Region with Community Perceptions

1
Soil Physics and Land Management Group, Wageningen University, 6708PB Wageningen, The Netherlands
2
Department of Geography, Geo-Informatics and Climatic Sciences, Makerere University, Kampala P.O Box 7062, Uganda
3
Wageningen Environmental Research, Wageningen University and Research, 6708PB Wageningen, The Netherlands
*
Author to whom correspondence should be addressed.
Land 2024, 13(1), 1; https://doi.org/10.3390/land13010001 (registering DOI)
Submission received: 7 November 2023 / Revised: 12 December 2023 / Accepted: 14 December 2023 / Published: 19 December 2023

Abstract

:
Human-induced land degradation in biodiverse regions like Mount Elgon threatens vital ecosystems. This study employs drone mapping and community insights to assess land use changes, degradation, and restoration in Mount Elgon, Uganda. Drone monitoring (2020–2023) covered six sites, complemented by household surveys (n = 499), Focus Group Discussions (FDGs), and interviews. Drone imagery shows agriculture and planted forest as dominant land use types, gradually replacing tropical high forest, bushland, and grassland. Drone image results showed that smallholder subsistence farming is leading to and enhancing degradation. Landslides and encroachment into the park were detected in three of the six sites. Trenches were the most adopted Soil and Water Conservation (SWC) measure. The trench adoption varied by location and crop type, creating restoration potential, notably in Elgon, Nabyoko, and Shiteka. Interviews and FGDs revealed adoption of trenches, grass strips, and afforestation as remedies to land degradation. Complex interactions exists among land use, degradation, and SWC measures in the upper Manafwa watershed, underscoring the urgency of addressing landslides and encroachment into the forest. Community-based initiatives are vital for hands-on SWC training, emphasizing long-term benefits. Collaboration among government, local communities, and NGOs is crucial to enforce conservation and restore Mt. Elgon National Park, while encouraging diversified income sources can reduce land dependency and mitigate degradation risks.

1. Introduction

Natural landscapes are susceptible to both rapid and slowly occurring environmental changes [1,2]. These changes can stem from natural causes like earthquakes and mass movements, as well as human-induced factors [3,4]. Human activities, including intensive agriculture, deforestation, and human-induced bushfires, exert intense pressure on land and are unsustainable [5,6,7]. Such heavy reliance on nature for survival accelerates the decline in vegetation cover and the degradation of natural resources [8,9] leading to increased land degradation, which, in turn, exacerbates secondary hazards such as soil erosion, landslides, and flash floods [10,11]. Consequently, land degradation negatively affects both livelihood activities and conservation efforts.
Two significant concepts in the field of landscape conservation are the identification of “hotspots” of land degradation and the recognition of “hopespots” for remediation [1,2,12]. Areas that have undergone substantial negative environmental changes or consistently face such changes are categorized as hotspots [6,12,13]. In Sub-Saharan Africa (SSA), degradation hotspots are particularly prevalent within fragile ecosystems such as forests and mountainous landscapes [5,14]. The prevalence of land degradation, specifically deforestation and soil erosion, have adversely impacted agricultural productivity [15,16]. Farmers’ perspectives and local experiences, though underrepresented, offer valuable contributions to land degradation studies [17,18]. Conversely, areas where human actions lead to positive changes in landscape restoration are designated as hopespots [1,2,13]. Human interventions to restore degraded landscapes are being collaboratively implemented by the conservationists and local communities [19,20].
Hopespots result from intentional Soil and Water Conservation (SWC) measures like tree planting, terracing, mixed farming, and park conservation [21,22]. For instance, ambitious forest conservation projects and afforestation activities in China have led to the conversion of shrubs and cropland into forest land [23]. Lira at al. [2] reported a commitment to restoring 12 million hectares of forest cover by 2030 in the Atlantic forest of Brazil. These restoration programs have positive outcomes towards forest restoration, controlling soil erosion and enhancing crop productivity.
Conducting routine measurements and monitoring the efficiency of these measures is essential in tracking restoration efforts. Landscape monitoring traditionally relies on either field surveys or satellite data [24,25]. However, both methods have limitations, such as the challenge of obtaining up-to-date geospatial data, cloudy conditions affecting satellite imagery, and the time-intensive nature of field surveys [25,26]. Furthermore, the costs associated with landscape monitoring using traditional methods have, in the past decade, spurred the adoption of drones, commonly known as Unmanned Aerial Vehicle Systems (UAVs). Drones offer solutions to many of these limitations while also complementing data from satellites and traditional field surveys [3,26]. Drone technology provides very high spatial resolution imagery with minimal operational costs (with easy-to-use drones), enables near real-time processing, and is less affected by cloudy conditions [25] than spaceborne satellite imagery. The applications of drones have been successful across several fields. For instance, D’Oleire-Oltmanns at al. [4] utilized UAVs to monitor and quantify gully and badland soil erosion in 2D and 3D formats in Morocco. Drones have been employed to monitor the impact of tourism on trails’ conditions, vegetation structure, and disturbances in protected areas [27]. In addition, drone-based assessments have revealed significant intra-annual tree cover losses, such as a minimum loss of 107 trees within a span of 2 years in a classified forest [28]. It is worth noting that UAV operations can be influenced by windy and rainy conditions, carry a higher risk of crashing, and are limited in spatial coverage [25,29]. Despite these encounters, drone imagery offers valuable benefits for research and applications across diverse fields.
This study was conducted within Mount Elgon, a mountainous transboundary conservation area across Uganda and Kenya; recognized by UNESCO as a man and biosphere reserve since 2005 [20]. The region has faced significant challenges due to high population density, intensive forest resource extraction, and farming, leading to ongoing land fragmentation and encroachment into the park [30,31]. These pressures have resulted in intensive land use changes that accelerate deforestation, landslides, and soil erosion [8,24]. Mount Elgon has become a degradation hotspot, directly threatened by high population density, agricultural activities, and human-induced forest fires [32,33]. Previous studies have focused on forest management, landslides, and community coping strategies [11,34]. Various efforts have been made to address the situation, with both government and non-government organizations partnering with international conservation agencies to implement projects aimed at land restoration and minimizing encroachment [19,20]. These interventions promote agroforestry, farmers’ adoption of SWC measures, and collaborative park conservation between park authorities and adjacent communities [20]. As a result, several hopespots have emerged via sensitization and hands-on activities such as tree planting, grass strip implementation, trench digging in farmers’ fields to reduce erosion, and sustainable park utilization [20,35]. The Manafwa Watershed Restoration and Stewardship (MWARES) project has also played a pivotal role in stimulating these activities in the upper Manafwa watershed using the Participatory Integrated Plan (PIP) approach [35,36]. Despite these efforts, quantification of restoration in hopespots and the ongoing degradation in hotspot areas is still inadequate. Moreover, local community perspectives on the applicability and adoption of such measures for combating land degradation are limited. Integrating the experiences of farmers enables the inclusion of indigenous knowledge and location-specific information on land degradation controls, enriching the existing literature [7,21].
Studies addressing forms of land degradation, land use management, and restoration measures in Mount Elgon are limited. The concerning trend of land degradation is persistent and the adopted SWC measures are diverse in the Mount Elgon region. This study provides a comprehensive understanding of the interconnection between land degradation, restoration efforts, and community perceptions via the integration of drones, household surveys, and discussions. The specific objectives of this study were threefold: (i) to identify and categorize prevalent forms of land degradation impacting the study area and restoration activities in the region by using the drone imagery, (ii) to quantify the rate of restoration within the selected study sites, (iii) to assess the farmers’ perceptions via interviews regarding land degradation, land utilization, and the adoption of SWC measures within the upper Manafwa Watershed, Mount Elgon, Uganda. We utilize drone imagery and geospatial analysis tools supplemented with structured questionnaires and data from Focus Group Discussions (FGDs) and Key Informant Interviews. This comprehensive approach allows us to provide a thorough understanding of the complex landscape dynamics in the upper Manafwa Watershed, Mount Elgon, Uganda. This study enriches the body of knowledge by incorporating valuable insights from local communities and applying innovative drone technology in the context of landscape monitoring and restoration.

2. Materials and Methods
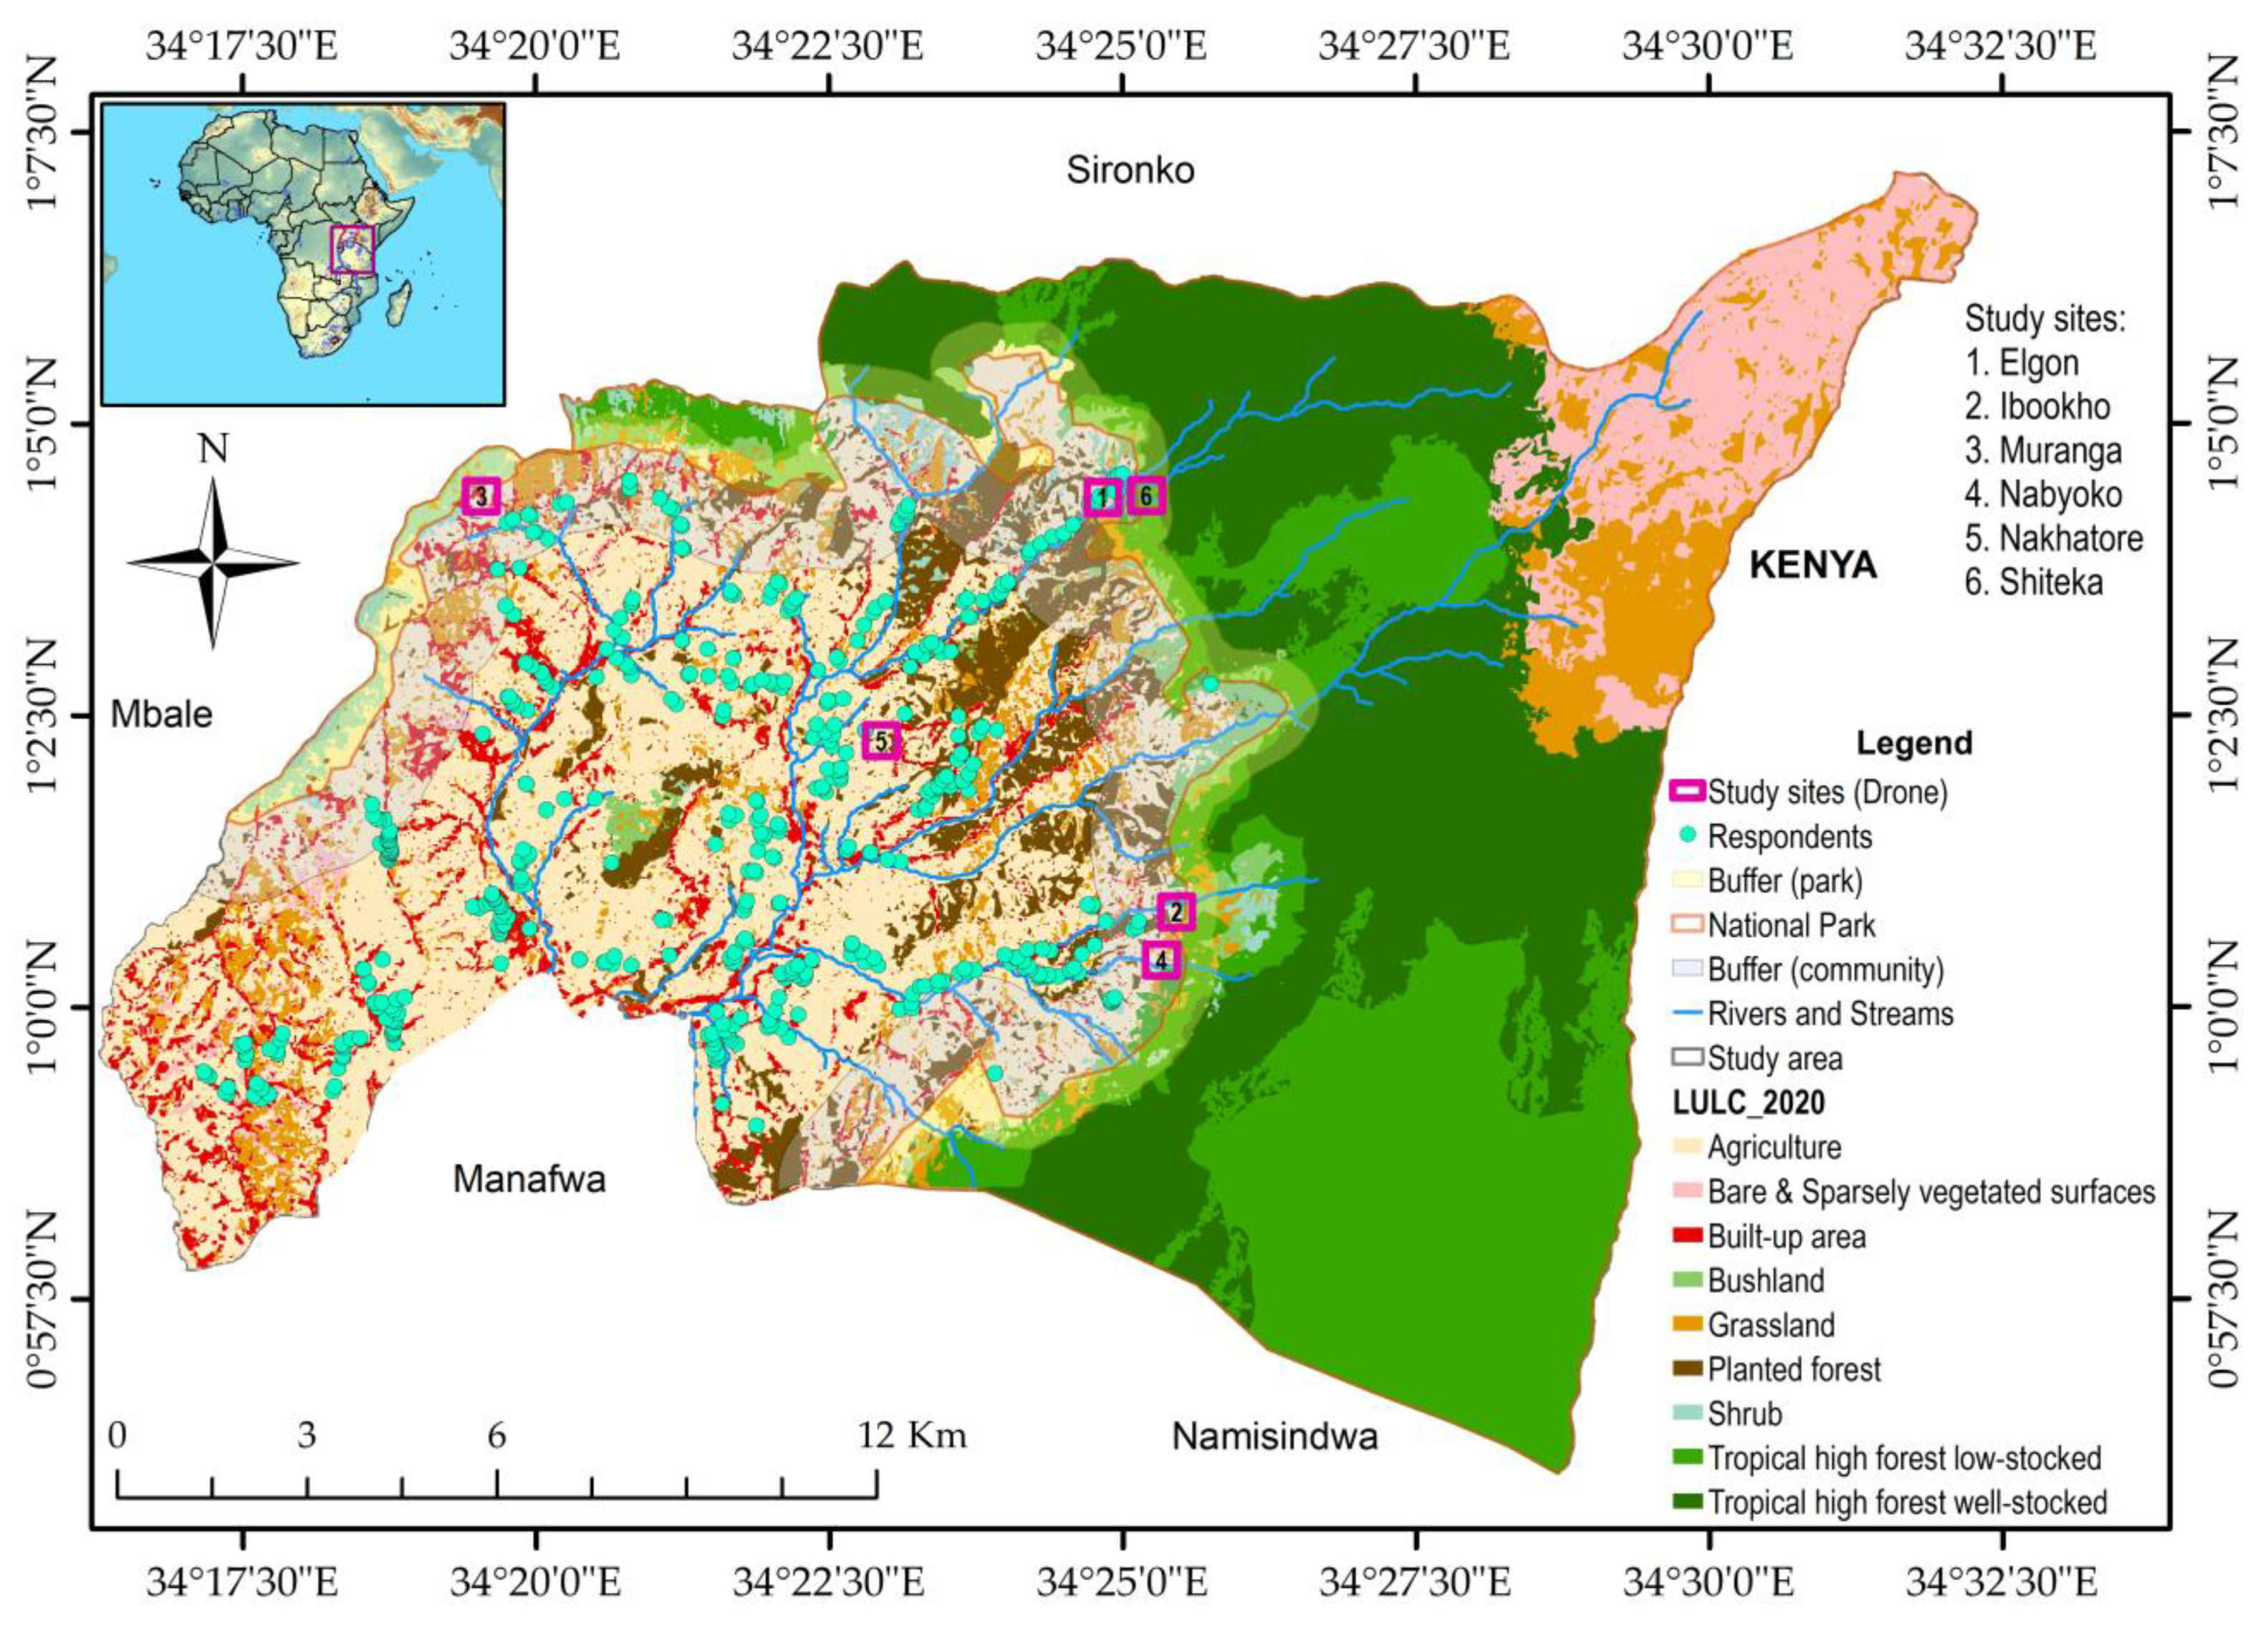
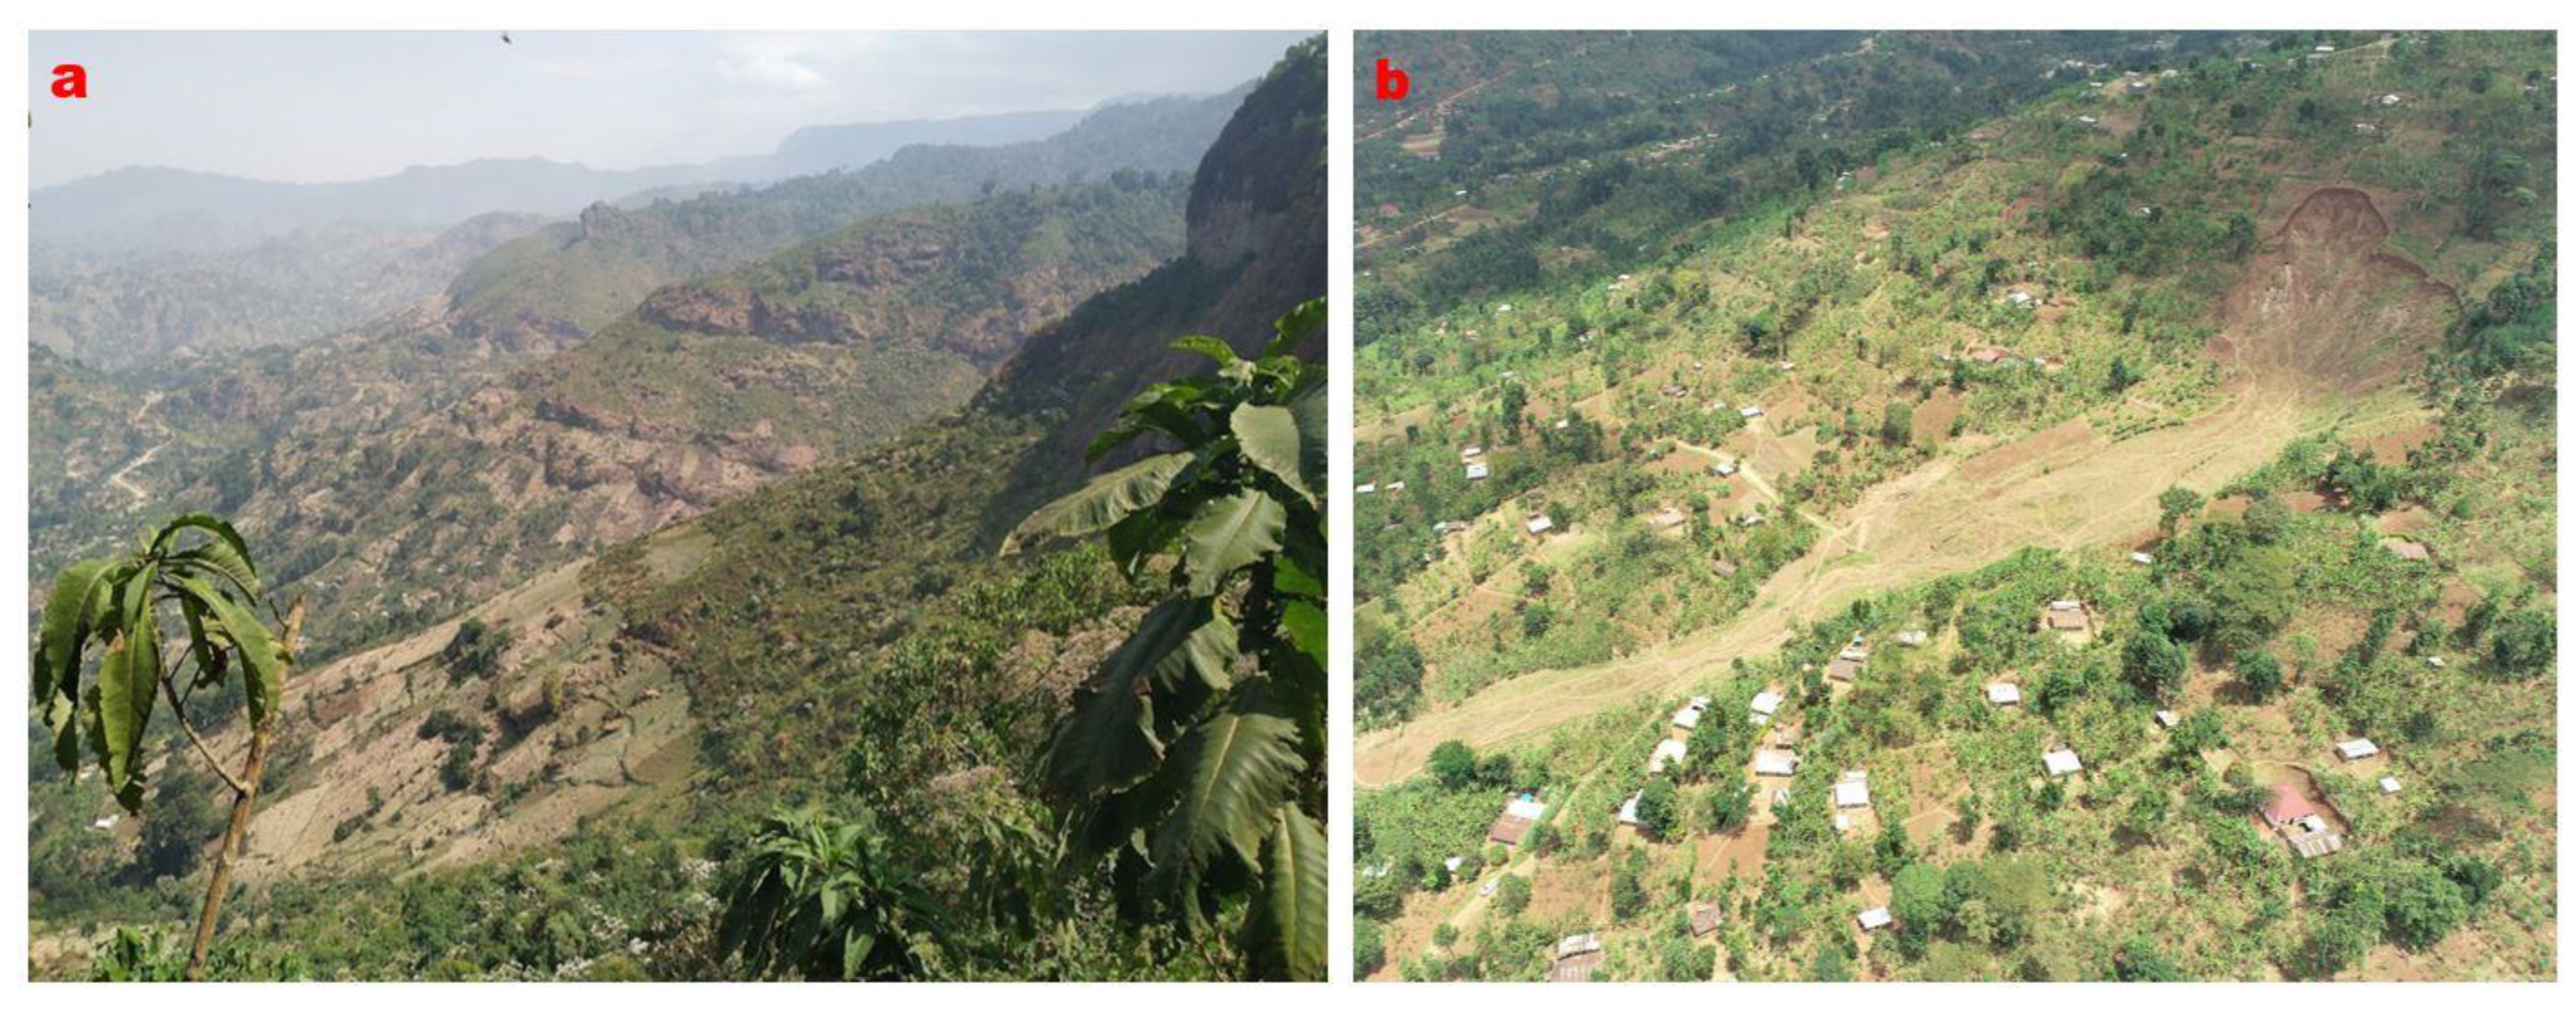
2.1. Study Area

The study area and drone-recorded sample sites are situated on the upper slopes of the Manafwa watershed in Mount Elgon, Uganda (Figure 1). Mount Elgon is an extinct solitary transboundary volcano along the Uganda–Kenya boarder, which rises to 4321 m above sea level at the summit [8]. The study area’s elevation spans from 1190 m to 4306 m above sea level, and the geographical coordinates lie between latitudes 0°57′19.818″ N; 1°7′15.986″ N and longitudes 34°31′37.535″ E; 34°15′40.672″ E. The average slope angle is 20°, reaching a maximum of 78° in the mountainous regions (Figure 1). The region has fertile volcanic soils with high clay content [37]. Mount Elgon experiences a humid subtropical bimodal climate, with the primary rainy seasons occurring in March-April-May (MAM) and September-October-November (SON). Annual rainfall can reach up to 2000 mm with average temperatures of 20 °C [24,32].
The vegetation cover in Mount Elgon is zoned altitudinally, reflecting the biophysical environment and human activities within the area [24,37]. Figure 2 illustrates the nature of the landscape and land use activities in the study area. Mixed montane forests extend up to 2500 m, followed by bamboo and montane forest (3000 m), and further up, heath and moorland (above 3500 m) with bare rocks (see Figure 2a). Banana–coffee crops dominate the lower altitude (below 2000 m) with human settlements (Figure 2b). The population density is very high within the study area, over 950 people per km2 [17]. This population exerts immense pressure on available resources, leading to land fragmentation and ultimately driving higher rates of forest encroachment (Figure 2a). Rainfed subsistence agriculture is the primary economic activity, engaged in by over 90% of population within the study area [38]. The main crops are banana–coffee with seasonal crops (mostly maize, beans, onions, and cabbages) that are planted during the rainy seasons [32]. Recently, bee keeping in the park has also been encouraged as a sustainable activity, especially by the communities near the park area [20].
A combination of drone-based land use change analysis, household surveys, and interviews were used to achieve the study objectives. Household surveys were specifically conducted to gauge farmers’ perceptions regarding land use, management, degradation, and adopted SWC measures, specifically in reducing soil erosion in the study area. Figure 3 outlines the overall methodological steps and materials used in this study.

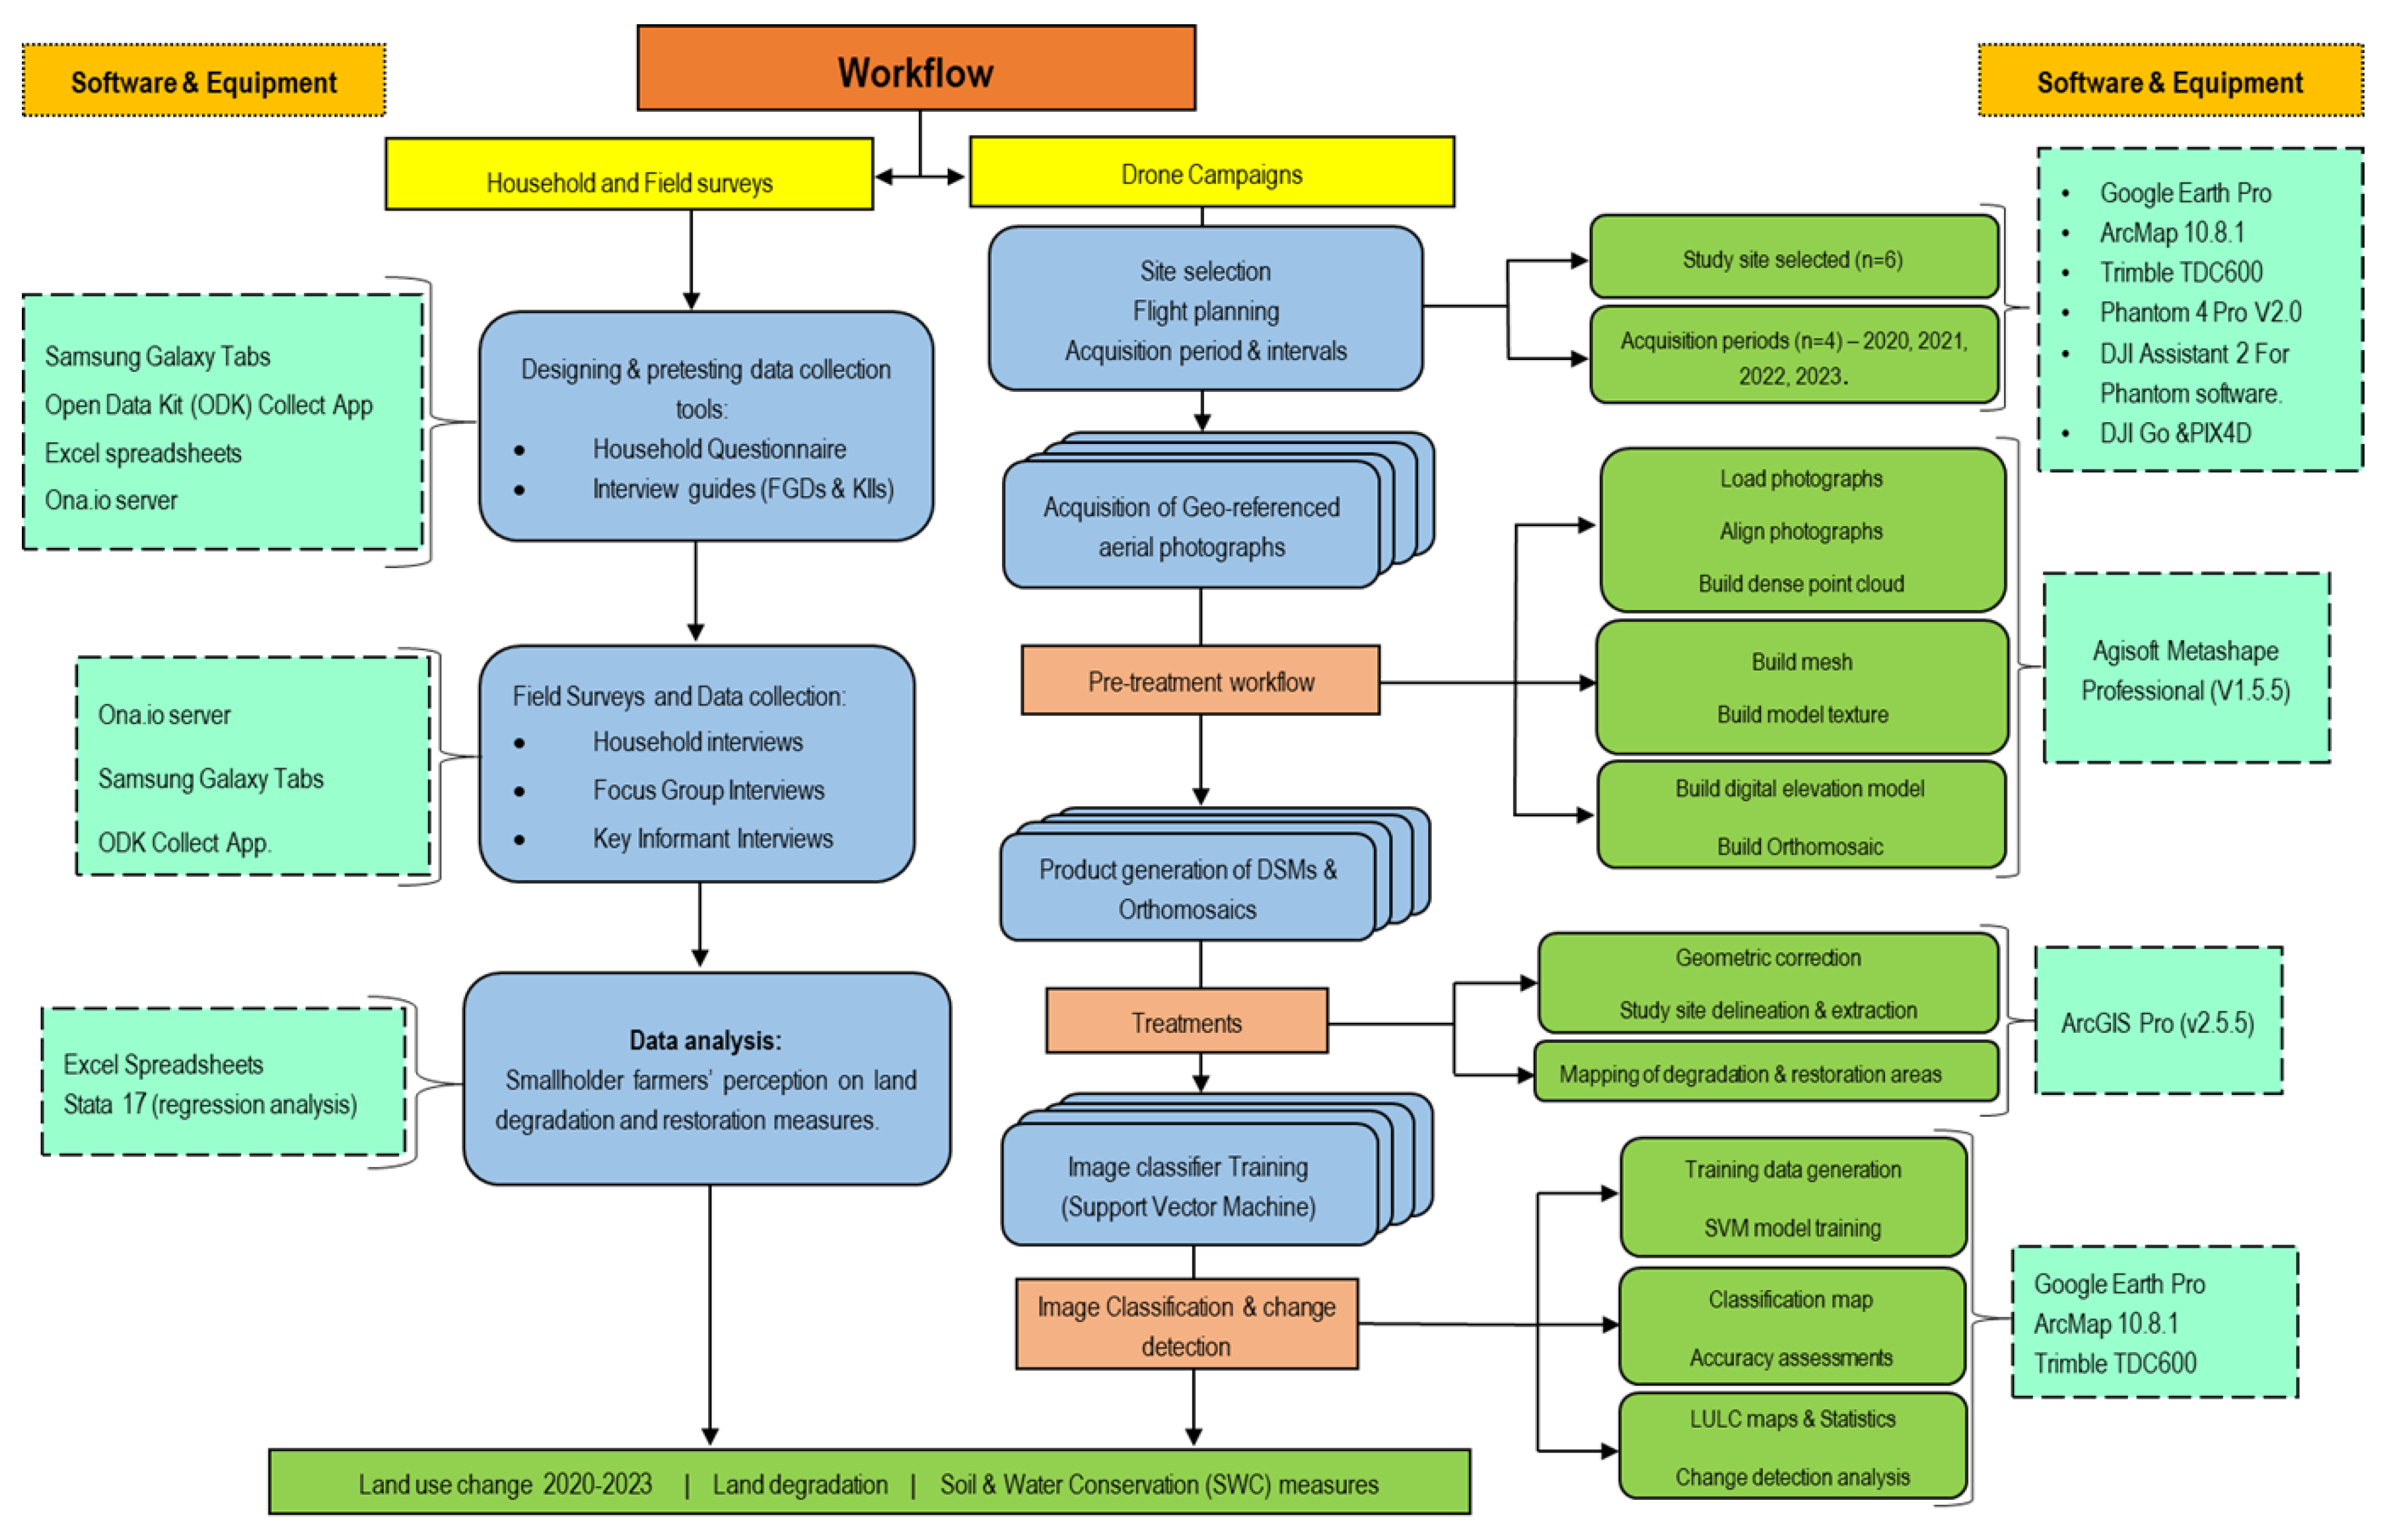
2.2. Drone Image Acquisition and Processing

A Phantom 4 Pro V2 drone was used to acquire very high-resolution imagery (4 cm/pixel), with Ground Control Points (GCPs) established using a Trimble TDC600 GPS receiver. Study sites were selected based on six villages under operation by the MWARES project and a control village outside the project area for comparison (see Figure 1). The DJI software (DJI GO 4.0) aided in flight planning, Agisoft Metashape for the development of orthomosaics, while ArcGIS was employed for image classification and land use change analysis.

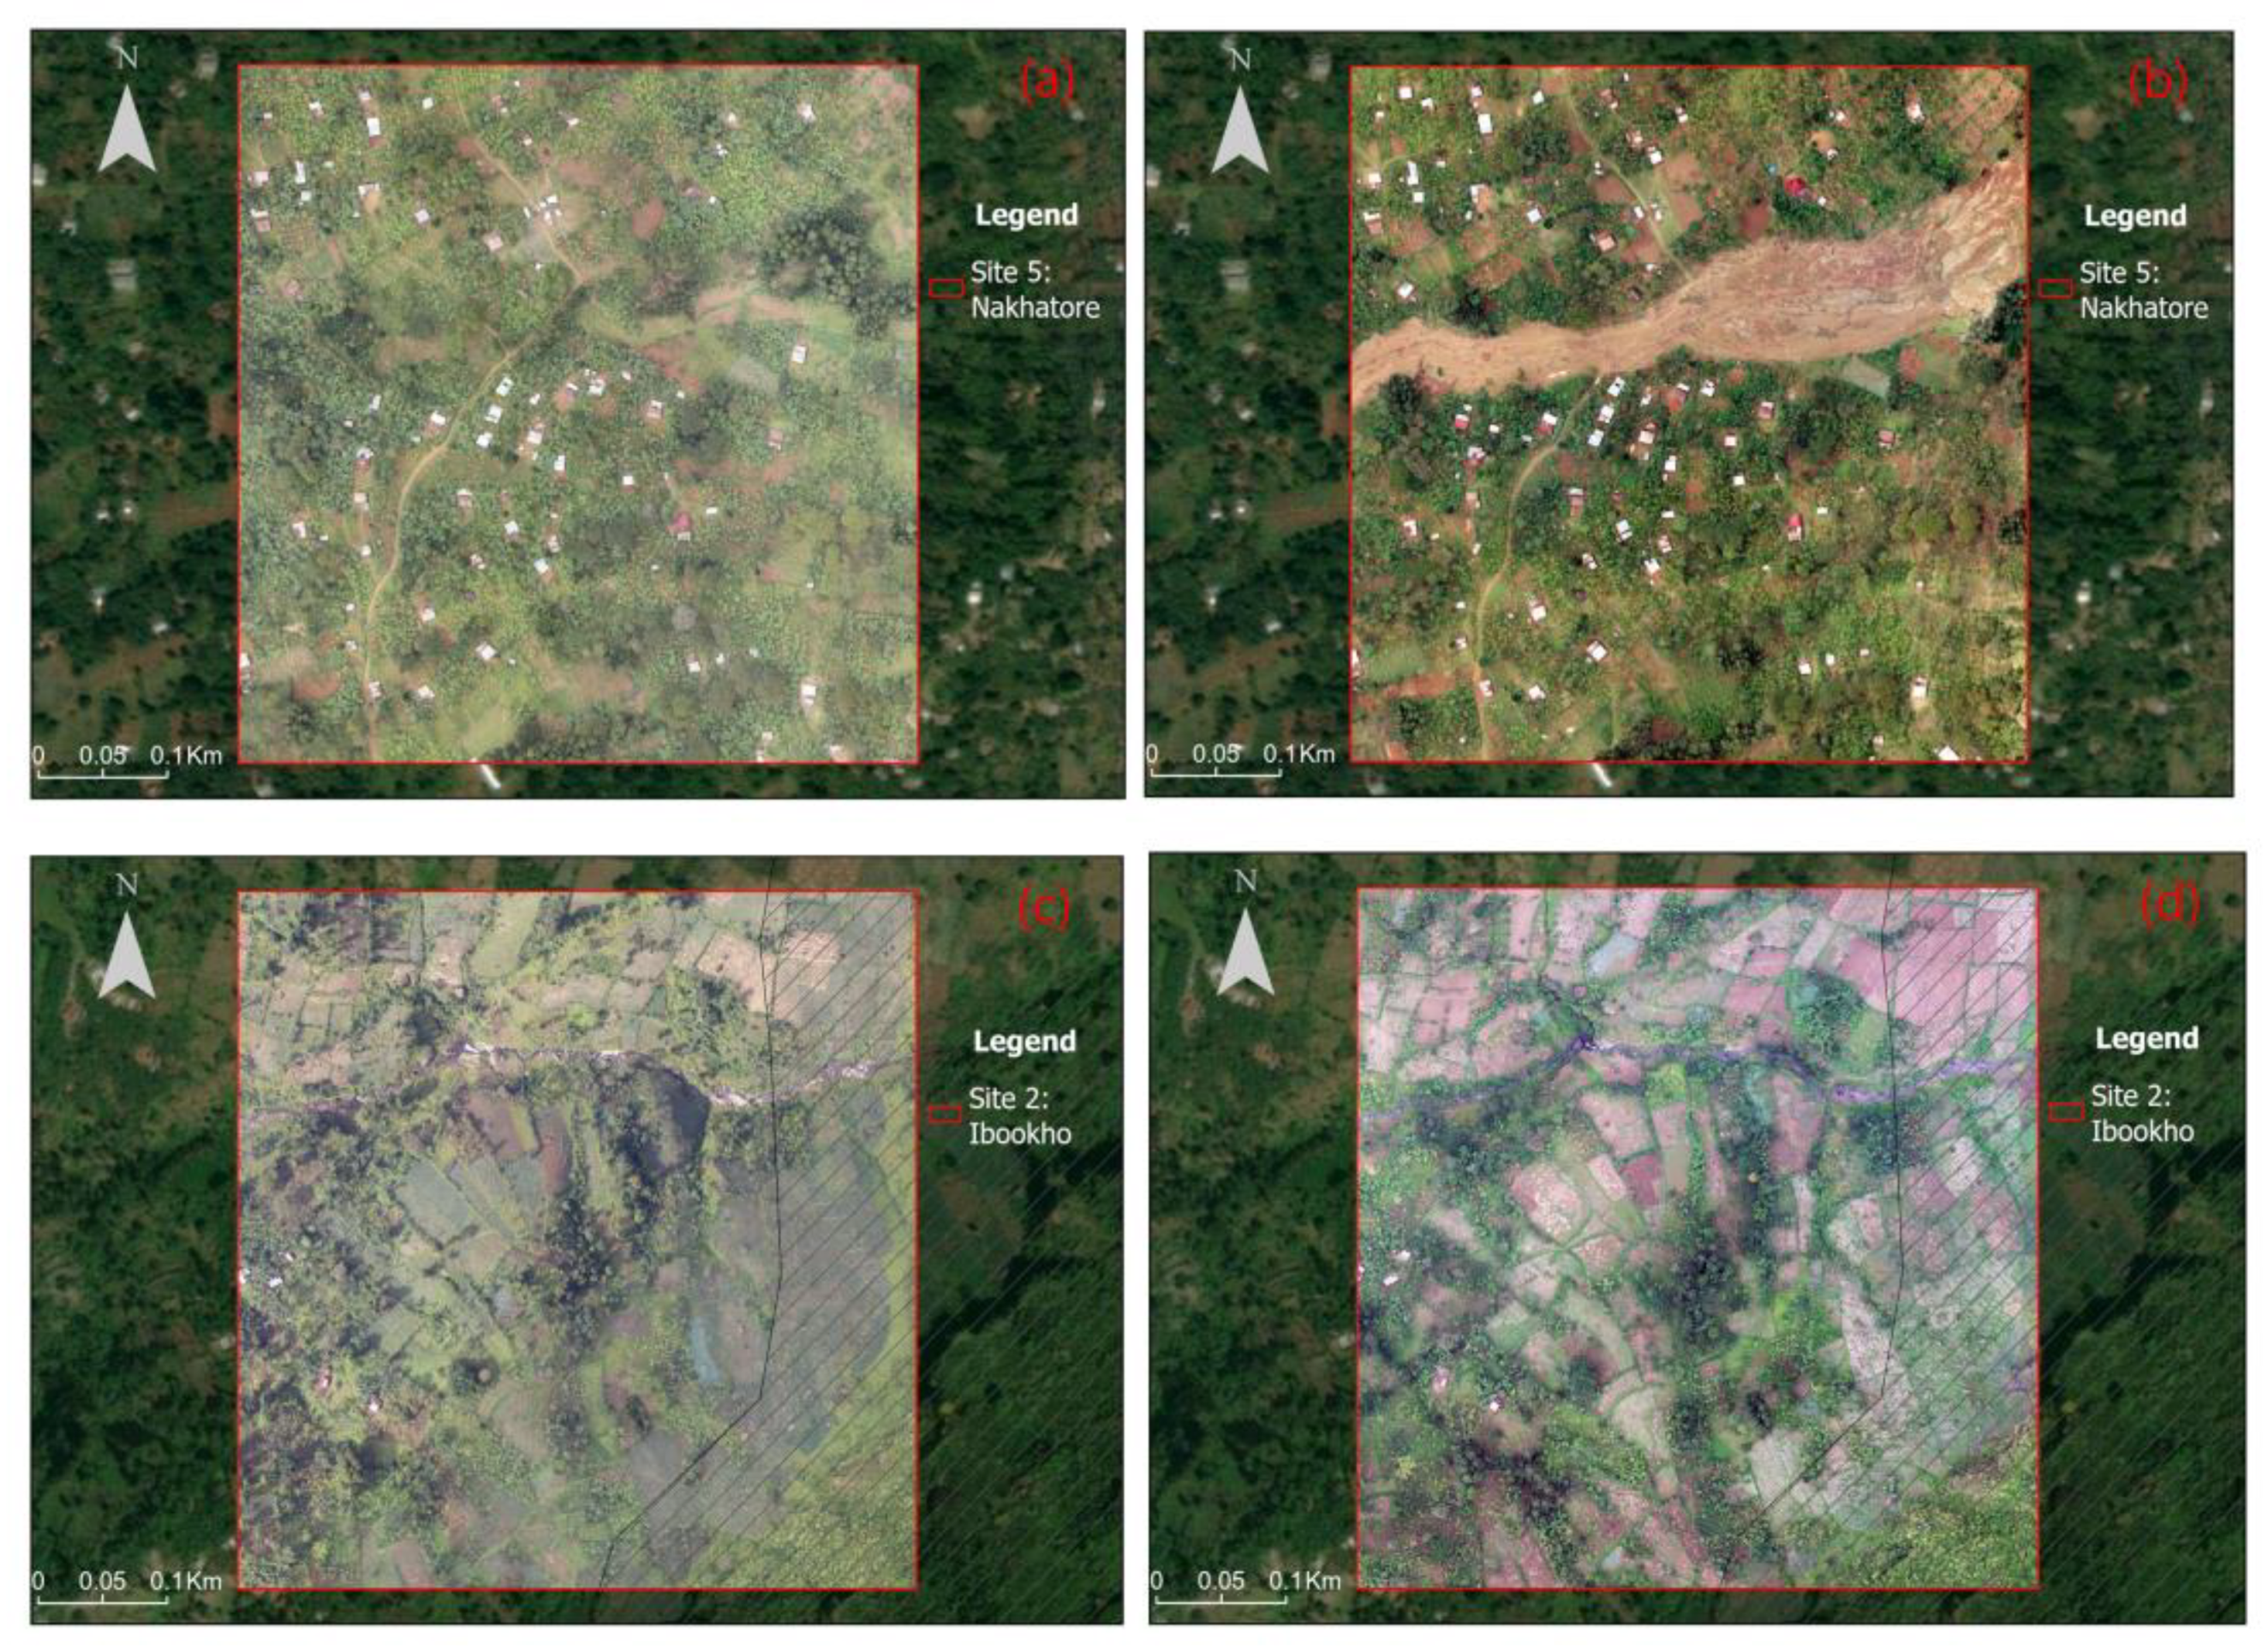
2.2.1. Sampling Plan and Site Selection

The study focused on identifying forms of and quantifying the extent of land degradation and/or restoration in six selected sites for the period of 2020 to 2023. Five sites were located in villages targeted by the MWARES project, where PIP Innovative (PIs) farmers had been trained on sustainable land management and were implementing SWC measures in their fields [35,36], as well as one control site in the center of the community land, away from the project’s operational area
Each of the selected study sites covered an area of 500 × 500 m (25 ha) where drone images were captured. This image swath was purposively selected to maintain the visual line of sight (VLOS) from the highest starting point on a hillslope. Energy resources (battery) also became an influencing factor for the selected swath. For the purpose of drone safety, all flights were started at the highest point in each selected site. Notedly, the five sites were strategically positioned within a buffer of 500 m from the park boundary, with the control site located 1.2 km from the park boundary as illustrated in Figure 1. The location of the study sites enabled evaluation of the impact of human activities on the park. Other site selection considerations included terrain, accessibility, tree height, canopy cover, and equipment limitations.

2.2.2. Aerial Image Acquisition

The DJI Phantom 4 Pro V2.0 drone was used for image acquisition (dji.com/phantom-4-pro-v2). This quadcopter (four motors) drone has a 1-inch 20 mega-pixel sensor, capturing true-color images at an 8-bit radiometric resolution. The drone is equipped with a GPS/GLONASS satellite positioning system and a 5-direction vision and infrared sensing system for obstacle avoidance during flight. Sensor calibration was conducted prior to the flights using DJI Assistant 2 For Phantom software (vr2.0.10), as shown in Figure 3. The drone configuration and the flight planning were conducted with a DJI Go 4 (vr4.3.50) and Pix4Dcapture (vr4.13.1) software, respectively [39]. Aerial images were acquired at a flying height of 100 m Above Ground Level (AGL), with a ground resolution of 4 cm/pixel. The drone camera was set at a 90° position during flight, with a longitudinal overlap of 75% and lateral overlaps of 79% for proper image stitching when generating the orthomosaics. The images were taken in the visible range (Blue, Green, and Red) spectrum and were already georeferenced. Ground Control Points (GCPs) were established using TDC600 handheld GPS with RTK technology (n = 10 per site), strategically distributed within study sites. These GCPs helped to improve the geometric accuracy during image processing.
The Civil Aviation (Remotely Piloted Aircraft Systems) Regulations, 2020 for Uganda were followed during the importation and operation of an unmanned aircraft in the study area. This was mainly for security, privacy, and ethical considerations. The drone flights took place annually during the dry season (January and February) in four campaigns spanning from 2020 to 2023 (Figure 3). The dry season was chosen to minimize the impact of cloud cover, rain, and canopy cover, allowing for better detection of degradation hotspots and hopespots of restoration in the study sites. Crop harvest and field preparation activities occur in this period, further reducing the canopy cover in the farmland.

2.2.3. Production of Orthomosaics

The photogrammetry methodology was followed using Agisoft Metashape software (vr1.7.3) for processing drone images, including orthorectification and mosaicking [28]. The workflow included the alignment of aerial images to establish the camera positions and orientations, building a dense cloud to generate a 3D model, creating a mesh for orthomosaic generation, and applying texture to the 3D model [39,40]. The orthomosaics and Digital Surface Model (DSMs) were produced, cleaned to remove edge effects, and the intended study area was delineated from the larger image footprint. A sample of an Agisoft Metashape drone image processing report is shown in Supplement File S1.
The default coordinate system of the orthomosaic images for the selected sites was re-projected to EPSG 32636 (https://epsg.io/32636 (accessed on 1 June 2023)). Georeferencing of the orthomosaics was carried out using a third-order polynomial transformation with a minimum of eleven control points for each image. The images of 2020 were used as a baseline image for georeferencing later images. Control points consisted of permanent buildings, rock outcrops, mark stones for the national park (MENP) boundary line, road junctions, and bridges. These were uniformly distributed through the entire orthomosaic image of each study site.

2.3. Land Degradation and Restoration Activities

Visible forms of land degradation in the community land and conservation area were mapped based on the orthomosaic images. These included homesteads and landslide scars; park encroachment by settlements and farming; and SWC measures, especially trenches, grass strips, and afforestation in the farmers’ fields. The intact forest cover and forest regeneration in the conservation area were also recorded. The area coverage of these forms within the selected sites were mapped remotely from 2020 to 2023. For instance, Figure 4 shows the status and nature of land utilization, degradation, and conservation measures adopted in two study sites (Nakhatoore and Ibookho). The extent and annual rate of encroachment was computed by overlying the boundaries of MENP [41] on the study sites (Figure 4c,d). This study focused on observable forms, while acknowledging the potential for other forms and areas of land degradation or restoration hidden under vegetation canopy. The household survey was hence adopted to establish all existing forms of degradation and restoration measures in the study area.

2.4. Smallholder Farmers’ Perceptions

The data regarding smallholder farmers’ perceptions of land use, land degradation, and restoration measures over the past decade were gathered via household interviews, FGDs, and key informant interviews. A structured questionnaire (see Supplement Table S1) was developed after reviewing the existing literature on land use, land degradation, and restoration activities. The questionnaire was aligned with the sustainable land management approaches of the World Overview of Conservation Approaches and Technologies (WOCAT) [42,43]. This comprehensive questionnaire covered various aspects, including land use and management, soil erosion processes, SWC activities, and their effectiveness as restoration measures against soil erosion. During interviews, respondents were shown photographs depicting dominant forms of land degradation, soil erosion, and SWC activities to facilitate understanding. The questionnaire was hosted on the ona.io server and administered to respondents using the Open Data Kit (ODK) Collect app on Samsung Galaxy Tabs, ensuring data security and minimizing potential delays caused by weather. A total of 499 respondents were randomly selected and interviewed across the 15 sub-counties and two town councils within the study area. The sample size was determined using the Yamane formula for a 95% confidence interval and ±5% precision level. Stratified random sampling was employed to select respondents from different villages, with the distribution influenced by the settlement pattern in Bududa District, as depicted in Figure 1.
To enhance data validity, information collected from Focus Group Discussions (FGDs) and key informant interviews (KIIs) were used to corroborate the insights obtained from smallholder farmer interviews. Ten FGDs were conducted in eight sub-counties (including four adjacent to the national park) and two town councils, featuring an equal number of sessions for female and male participants. Each FGD comprised of eight smallholder farmers representing diverse sociodemographic characteristics. Key informants referred to individuals with substantial knowledge and experience acquired from their involvement in the study area. This group consisted of nine political and technical leaders, encompassing community representatives (chairpersons of natural resource committees, Local Council (LC) I and LC.II), Sub County officials (Sub County Chiefs and LC.III), district-level personnel (Environment Officer and LC.V), and three field staff members from the Uganda Wildlife Authority who engage in collaborative conservation efforts with communities adjacent to the park. The data derived from FGDs and KIIs provided insights into farmers’ perspectives regarding land degradation processes, trends, and choices of SWC activities for erosion control, as well as the perceived effectiveness of these measures. This research proposal was assessed and granted permission by the Uganda Christian University Research Ethics Committee. The study objectives, research ethics, and confidentially were explained and consent was sought from each participant before conducting the interviews and discussions. The household surveys and FGDs were conducted in the local language (lumasaaba), while the key informant interviews were conducted in the English language with the help of research assistants who are from the Mount Elgon region. One-day training of research assistants and a pretest of the data collection tools was conducted before the actual data collection.

2.5. Data Analysis Techniques

Annual drone orthomosaics from 2020 to 2023 were classified using supervised image classification algorithms in ArcMap 10.8.1. The Support Vector Machine (SVM) method, known for high accuracy and proficiency, was utilized for image classification as it is particularly suited for high resolution image classification [44,45]. The SVM’s advantages include better results compared to the Random Forest classification algorithm, even in data-scarce situations, as well as the ability to work with fewer training datasets [46,47,48]. Prior to classification, images were cleaned by removing the black background color from the orthomosaic images using the Copy Raster tool of ArcGIS software (Version 2.5.5). The NoData value (−9999) was replaced with a ‘0’ value to create an empty background. Training datasets were then generated from cleaned orthomosaics. At least 100 training pixels were collected per land use class. A total of seven land use/cover classification schemes were created based on the classification scheme by Opedes et al. [24], as shown in Table 1. Khalid and Shahrol [45] highlighted the importance of creating many training samples for a single class to enhance SVM accuracy, leading to the generation of >100 training samples per land use class in this particular study. The model was trained and executed using the SVM classifier. The classification accuracy assessment for the orthomosaics was conducted (see Supplement Table S2).
To analyze the impact of human activities on land utilization and conservation, land use/cover change analysis was conducted for 2020–2023 drone orthomosaics in the six selected sites. Observable land degradation and restoration forms were remotely mapped using ArcMap based on the orthomosaic images. Descriptive statistics, such as counts, averages, and change rates, were employed to present drone image results.
The data from household surveys, obtained from ona.io, underwent descriptive analysis, including mean, frequency, and percentage calculations, to capture smallholder farmers’ perceptions on land use, degradation, and restoration practices against soil erosion. A binary probit regression model was utilized with Stata 17 software to examine factors influencing forest resource extraction, land degradation, and SWC measure adoption (see Supplement Table S3). This model was well suited due to the binary nature of dependent variables, enabling p-value analysis. The results provided insights into how income sources, level of education, and land and household sizes influenced the likelihood of observing specific outcomes—forest product utilization, land degradation, and SWC measure adoption. Only significant relationships were reported in this study (details are provided in Supplement Table S3). Additionally, illustrative quotes and observations based on data analysis from the FGDs and key informant interviews were included. We only selected the well-articulated quotes related to land use change, forest resource extraction, encroachment, land degradation, and the adoption of SWC measures.

3. Results

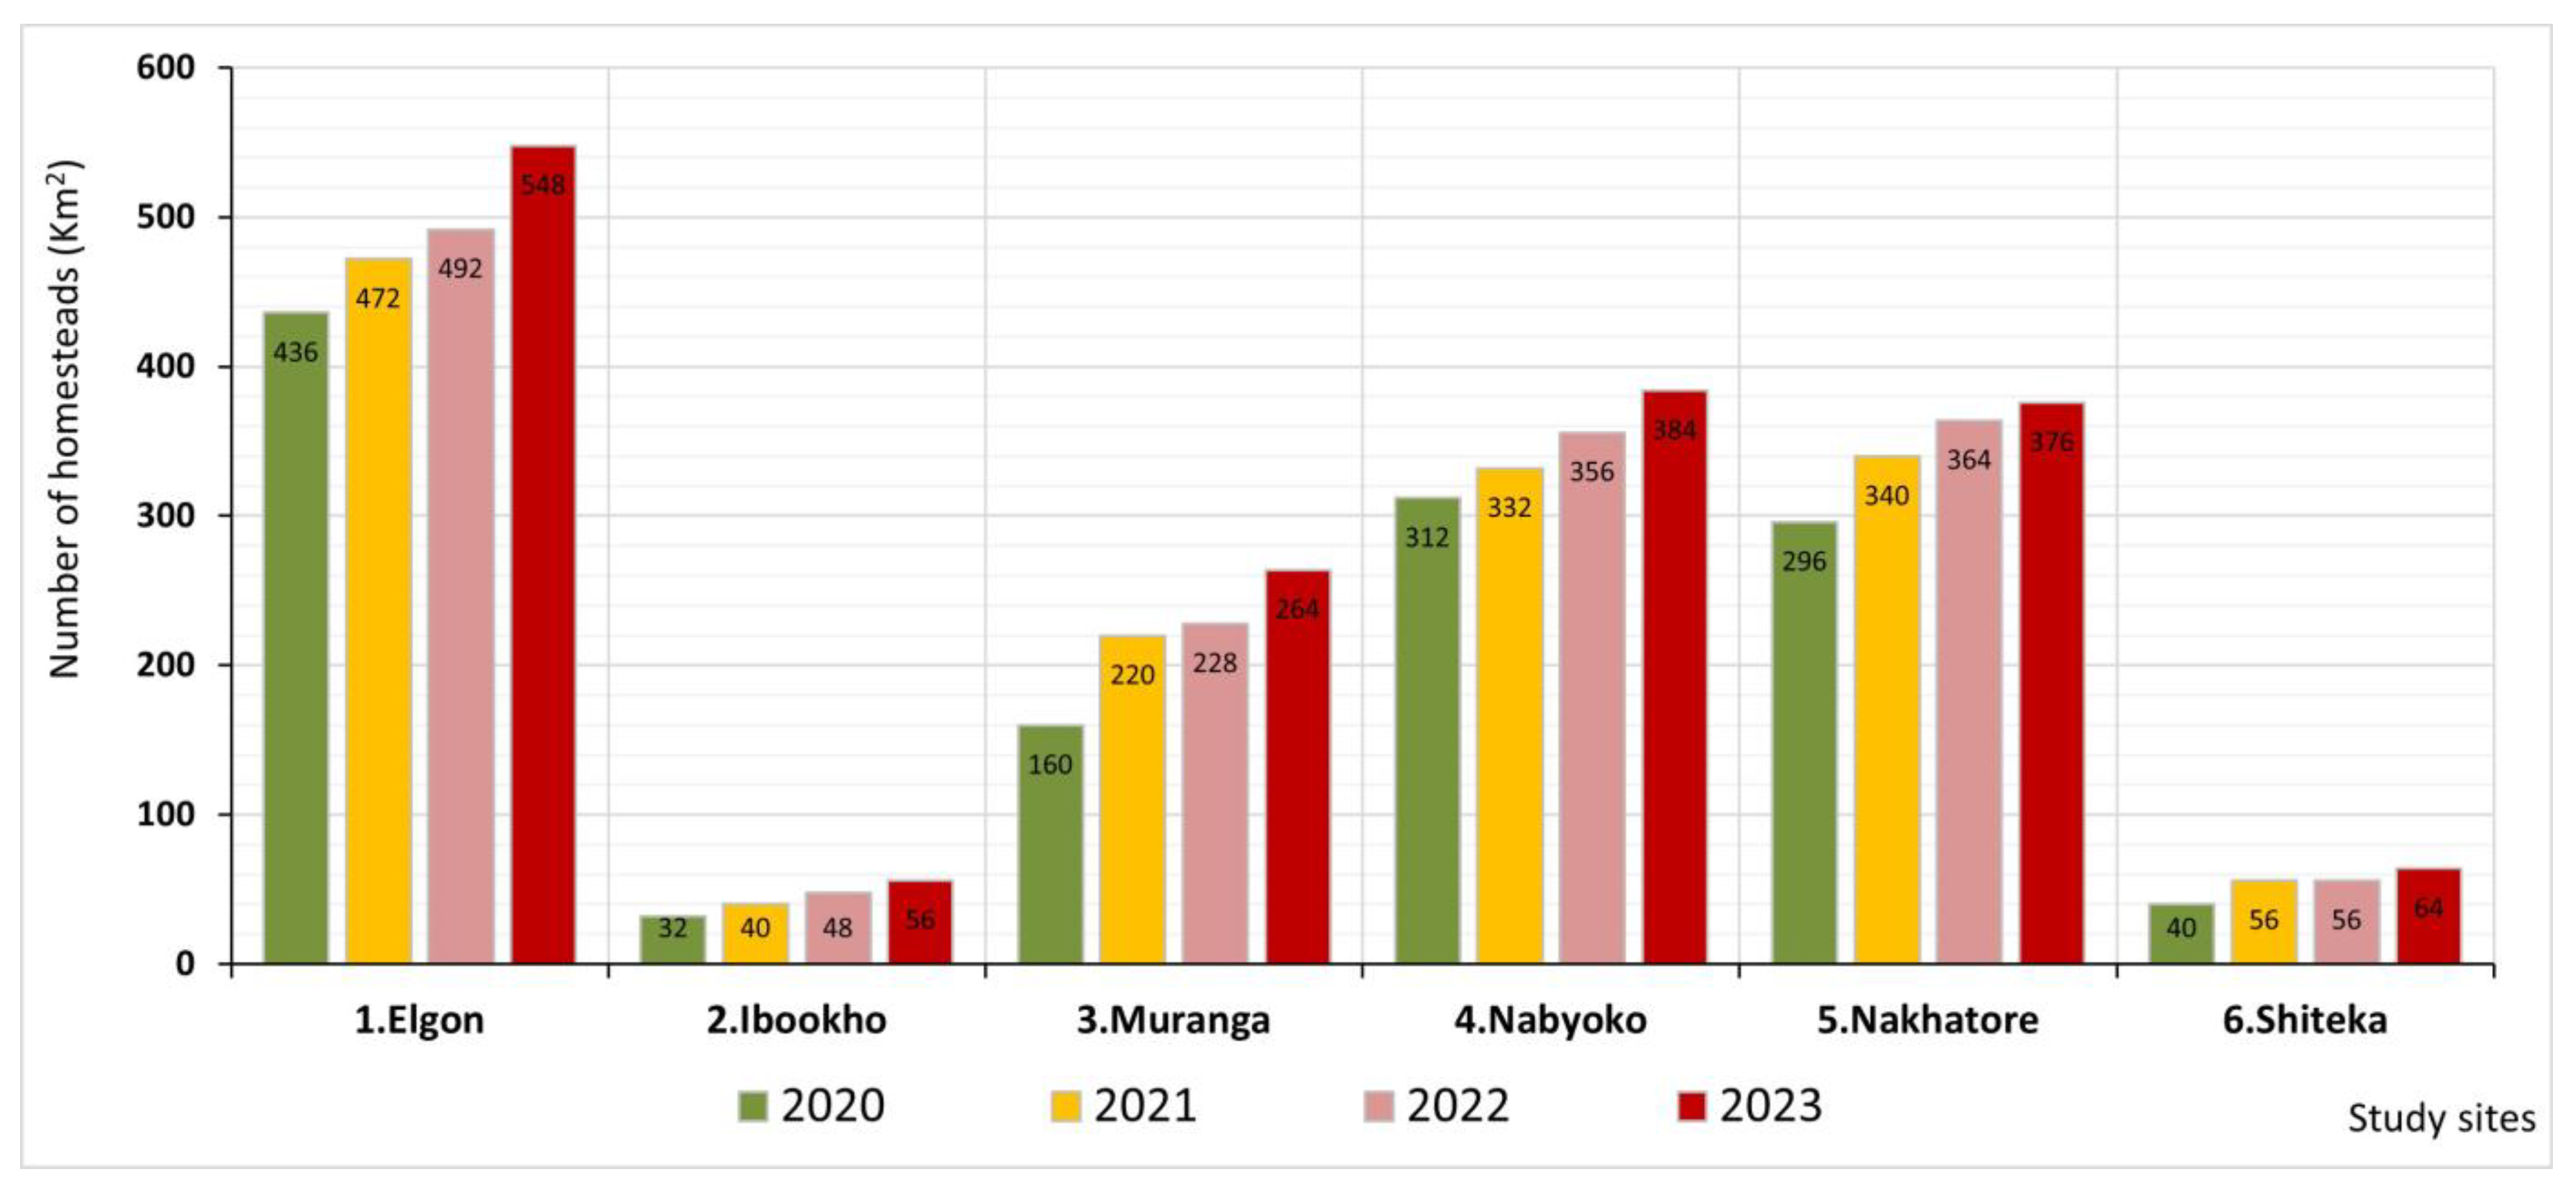
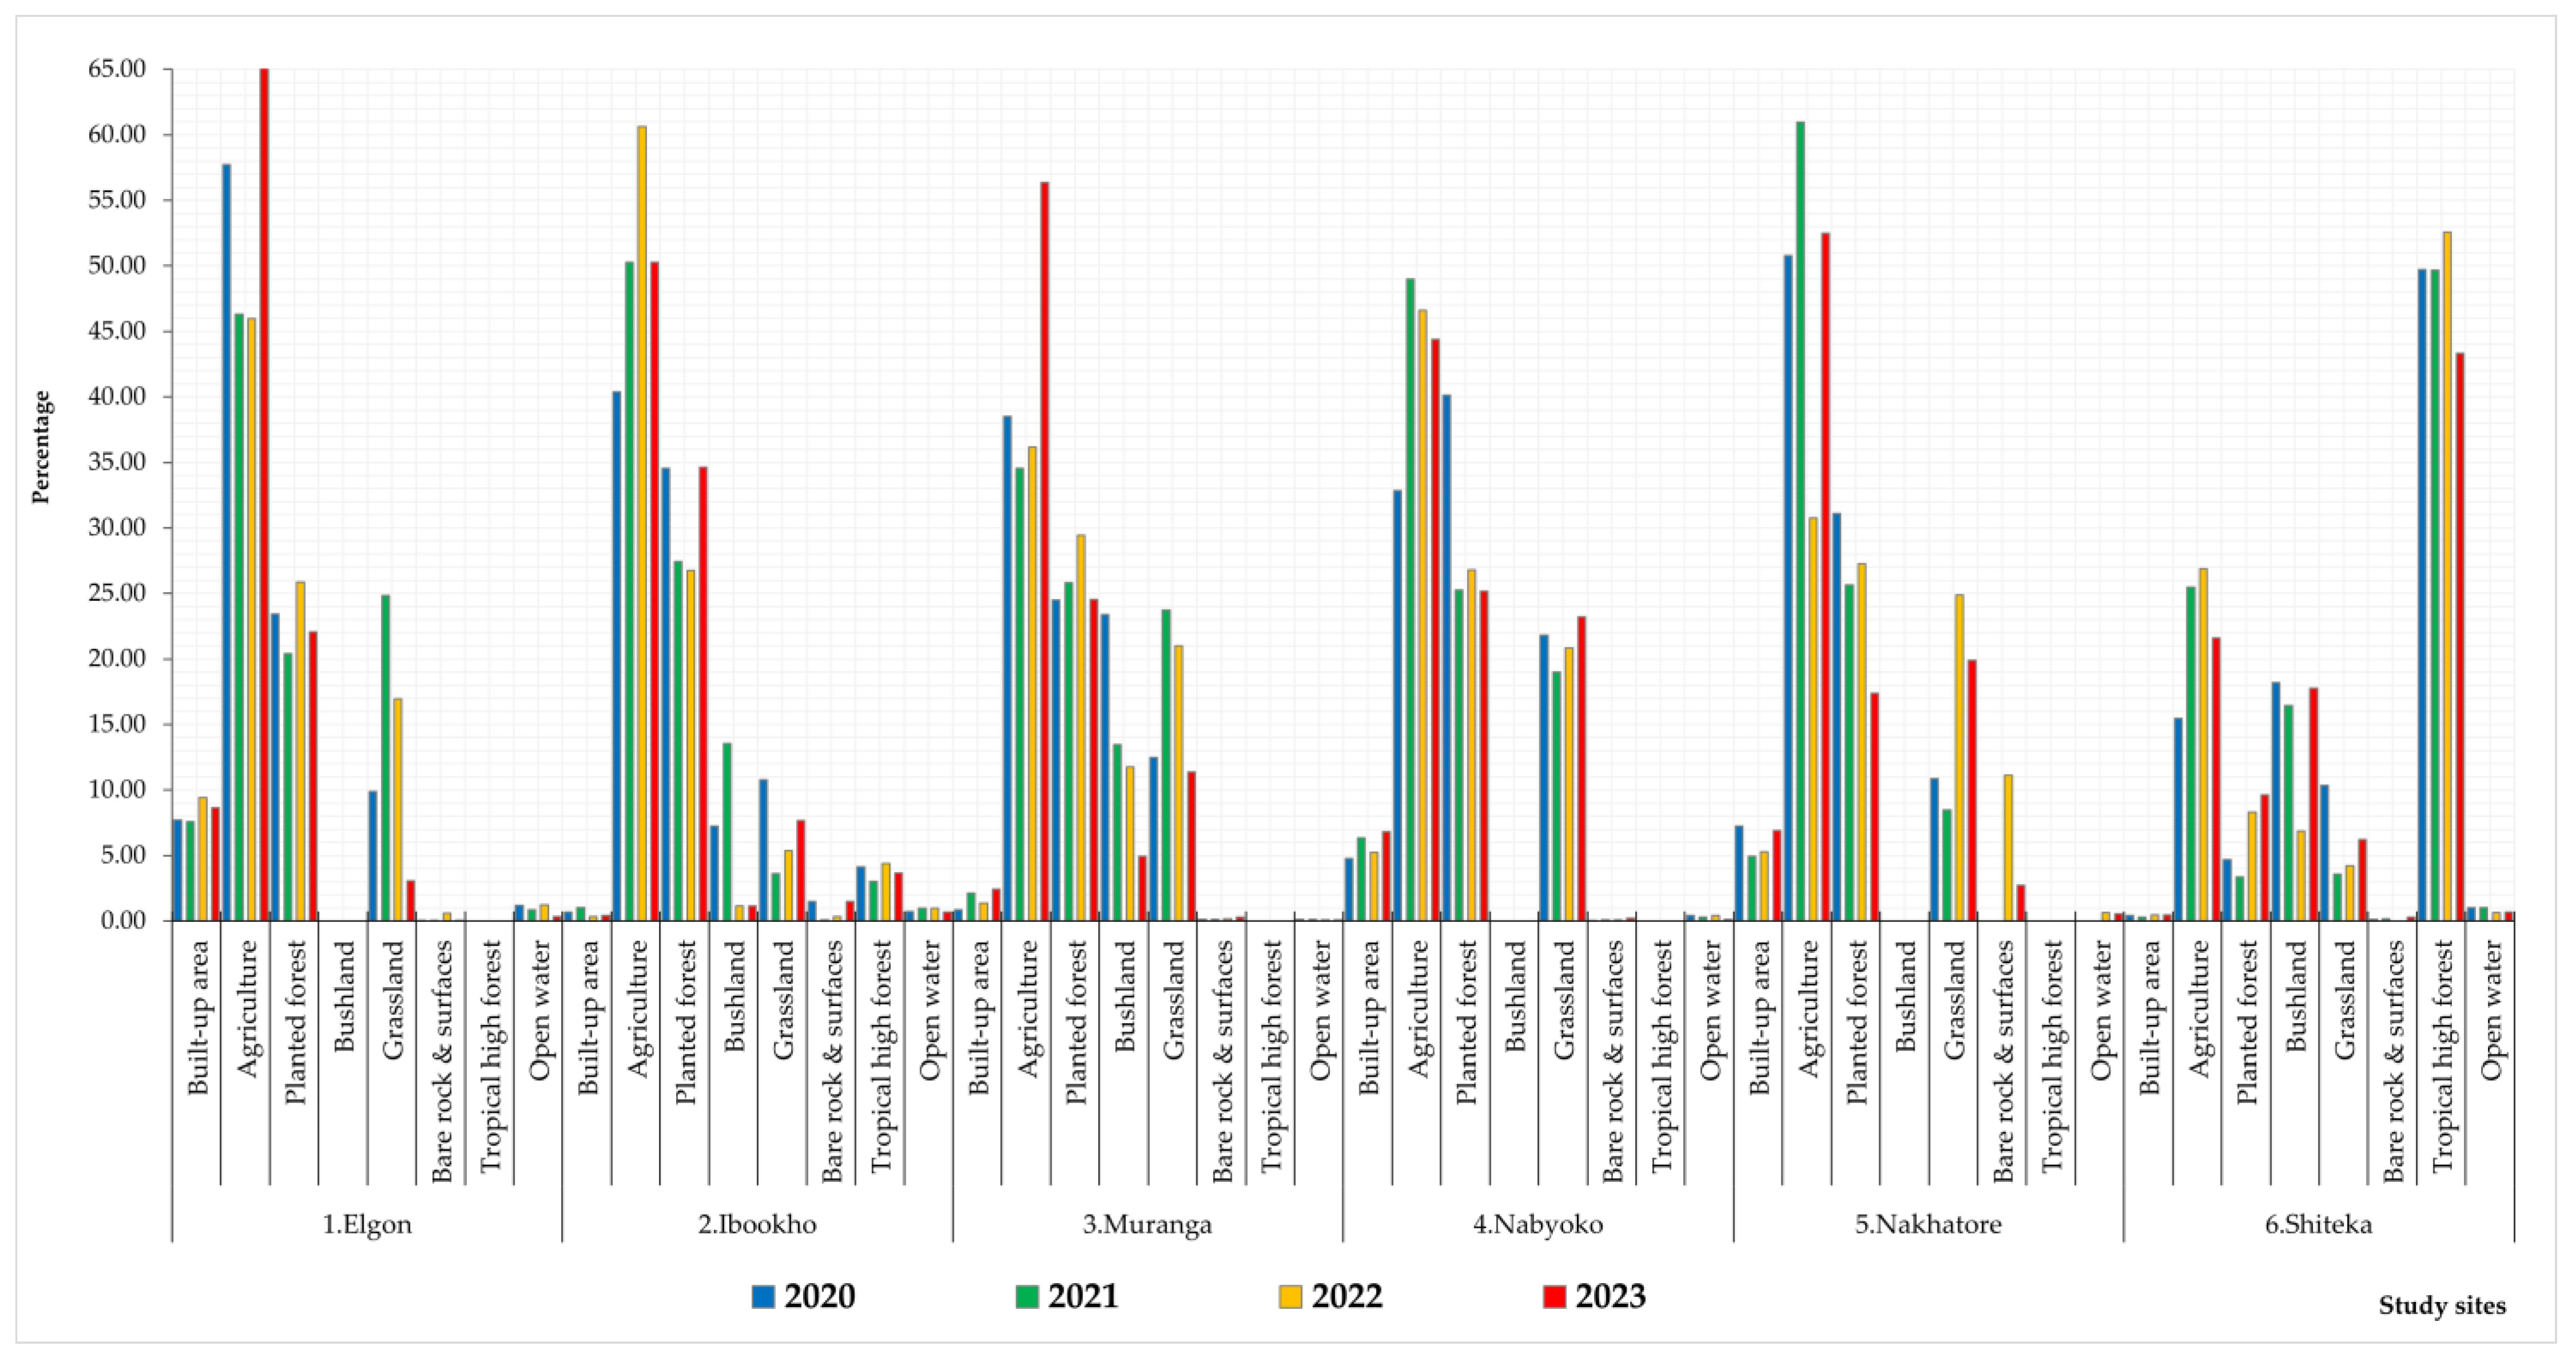
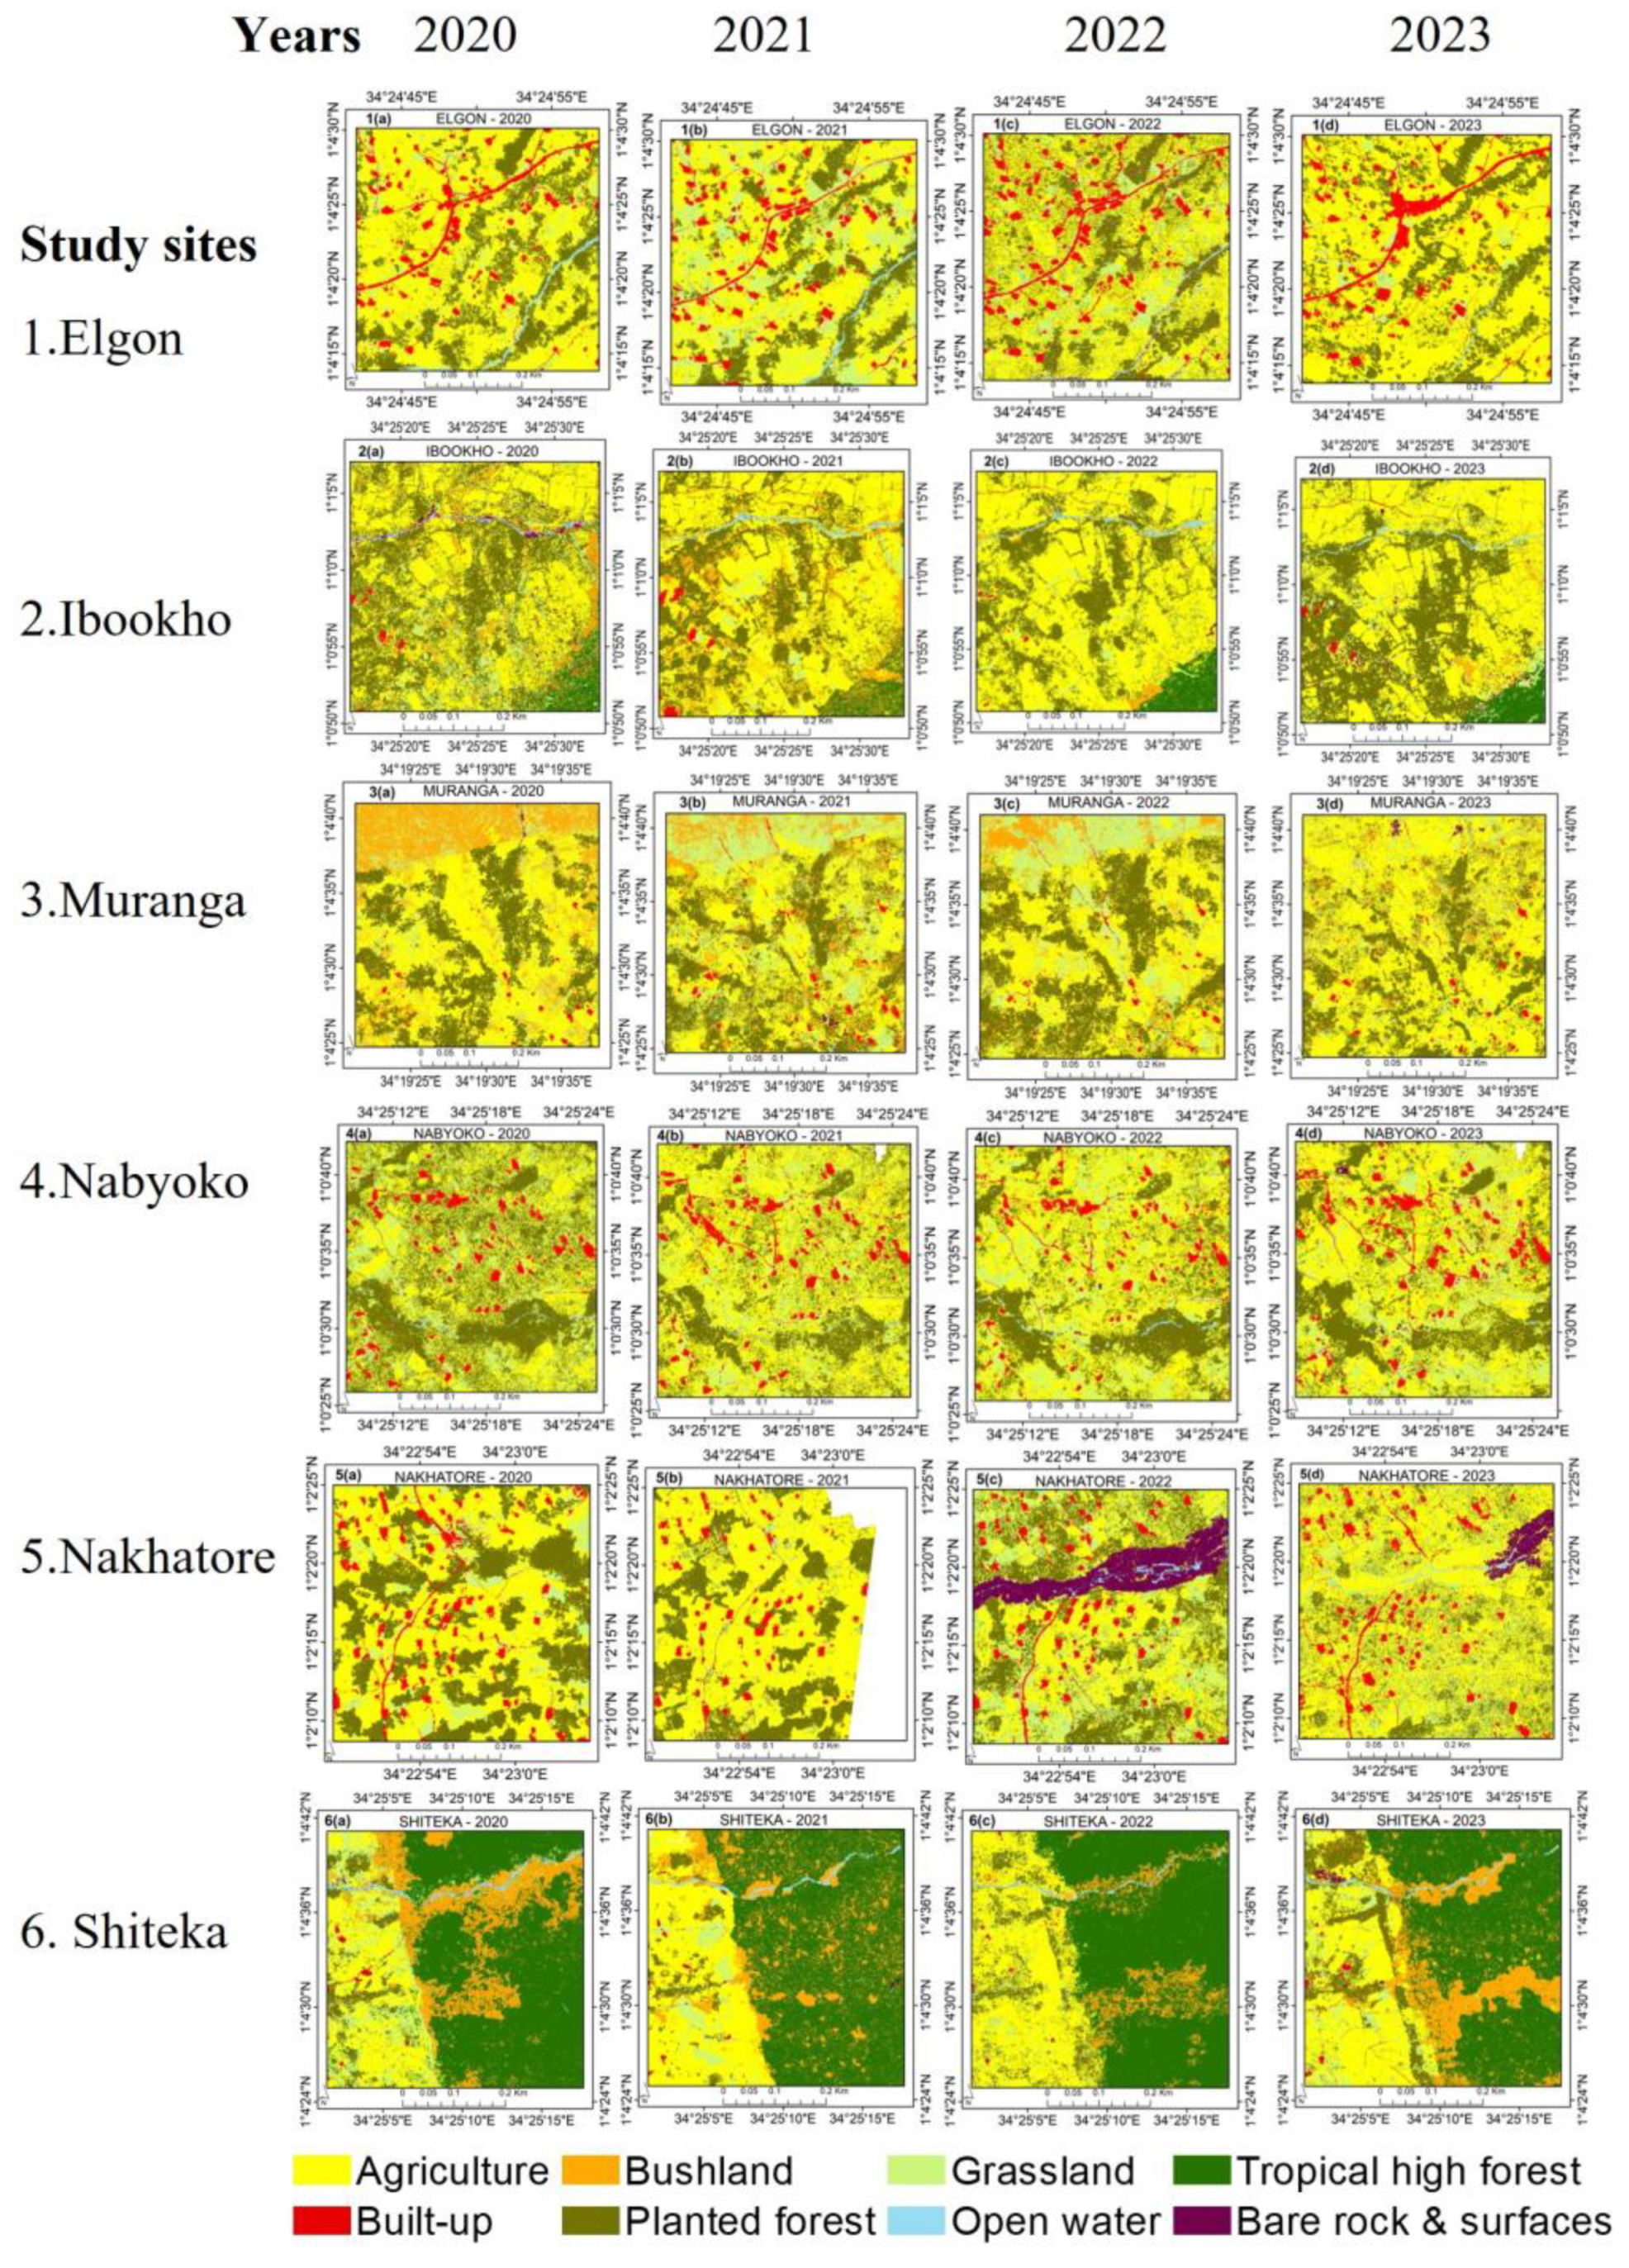
3.1. Land Use Change (2020–2023)

The summary results of the accuracy assessment of land use classification are shown in Supplement Table S2. The user accuracy and producer accuracy obtained in SVM image classification were very high (>80%), while a 100% accuracy was also recorded among classes. The overall accuracy ranged between 80% and 91% and the kappa coefficients were between 0.79 and 0.88 for all the classified images. The SVM classifier obtained high accuracy and there were less errors of omission and commission in image classification due to high producer accuracy and user accuracy, respectively. These results were satisfactory for the subsequent analysis of land use changes in the six selected sites for the period 2020–2023.
Figure 5 and Figure 6 summarize the spatial and temporal land use changes across the six study sites based on eight classes from 2020 to 2023. The dominant land uses in 2020 were agriculture and planted forest across all the selected sites, except in Shiteka. Specifically, the Elgon site had 58% of the total land area under agriculture, followed by planted forest (24%), grassland (10%), and built-up area (8%). Similar trends were also observed in the study sites of Ibookho, Nakhatore Muranga, and Nabyoko (Figure 6). There was no bushland and tropical high forest in Elgon, Nabyoko, and Nakhatore, while bare rock and surfaces and open water were minimal (≥2%) across all study sites. However, the Shiteka site had tropical high forest as the most dominant land use cover (50%), followed by bushland (18%), agriculture (16%), and grassland (10%), with the lowest cover comprising built-up, bare rock and surfaces, and open water (≥1%), as seen in Figure 5. Similar land use changes were recorded in 2021 and 2022 across the study sites with progressive increased coverage by agriculture, planted forest, and grassland. By 2023, agriculture was the dominant land use (>50%) in Elgon, Ibookho, Muranga, and Nakhatore. This was followed by planted forest with an average coverage of 20%. While in Shiteka, tropical high forest was still the dominant land use type with 44%, followed by agriculture (22%), bushland (18%), planted forest (10%), and grassland (6%), with the other land use types (built-up, bare rock and surfaces, and open water) all below 1%.
Figure 6 further illustrates the spatial land use patterns from 2020 to 2023 across the six study sites. Note that bad weather affected drone flights in 2021, as seen Figure 6, due to the early onset of the rainfall season, but the Nakhatore site was not completely covered. Agriculture and planted forest is clearly seen as dominant land use types, especially in Elgon, Ibookho, Muranga, Nabyoko, and Nakhatore. However, tropical high forest was the dominant land use in Shiteka, followed by bushland and agriculture. Built-up areas were most visible in Nakhatore, Nabyoko, and most prominently, in Elgon. The grassland coverage is generally low and was easily converted to agriculture, as clearly seen in Muranga (2022 and 2023). Open water was constrained in areas with river streams, especially in Shiteka and Ibookho. Bare rock and surfaces was very minimal except after the occurrence of a landslide in Nakhatore in 2022 (Figure 6). Although agriculture reclaimed most of the coverage in 2023 in the Nakhatore site, planted forest was lost as a consequence and a river stream emerged after the landslide. This led to the appearance of open water in 2022 and 2023 in Nakhatore.

3.2. Smallholder Farmers’ Perceptions

The demographic and socio-economic characteristics of the sampled smallholder farmers, crucial to this study, are summarized in Table 2. The total percentage of male respondents are 62%, while 38% were female, primarily aged between 31 and 64 years (73%). Though 44% of the respondents were born in the study area, migration from the Mount Elgon region into the study areas was common, often driven by marriage, family reasons, and tribal connections. Household sizes were notably large, averaging 7.01 members, contributing to land fragmentation. Customary land tenure prevailed (50.5%), reflecting the significance of traditional land management systems. Moreover, the average land size per household is 2.1 acres (0.85 hectares), often divided among family members, leading to increased land fragmentation. Education attainment showed significant gaps, with 60.7% discontinuing schooling at the primary level, with only 23% reaching secondary (high school) education. Subsistence farming stands as the primary occupation for 99% of households, supplemented by business and casual labor (71%). Up to 45.8% earned an annual income of USD415 or less, placing them in a low-income category as compared to the national GDP per capita for Uganda [49]. The results show a universal use of fuelwood (firewood and charcoal) for cooking, with 66.90% of the respondents relying on traditional three-stone open fire as the mode of cooking stoves within the study area. This practice could intensify pressure on forests and tree cover.

3.3. Land Utilization and Management

The study area exhibits diverse land use and management practices due to the existence of the conservation area (MENP) next to the community land. Up to 16% of the respondents acknowledged to be engaged in extracting resources from MENP, while 84% reported no involvement due to distance and restrictions. However, this statistic does not reflect a complete picture of the reality since non-timber forest products (NTFPS) were observed and used across several homesteads within the study area. For instance, during the FGD, one of the participants explained:
The natural forest cover in 1980s was evergreen but now is disappearing with more extensive farmland in the community and patchy tree cover in the park. Grassland, bushland and shrubs are being converted into subsistence farms due to high population in this area and a need for more land to grow cabbages, and onions.
The results in Figure 7 show the variety of products extracted from MENP by the respondents in this study. Timber and poles (39%), fuelwood (28%), fodder (17%), and bamboo shoots (11%) were the primary resources harvested by the respondents, while the smallest numbers were harvested honey (3%) and wild herbs and vegetables (2%) from the park.
Approximately 50% of respondents reported illegal harvesting, while 37% obtained informal park authority permission. Only a minority (13%) had official agreements and Memorandums of Understanding (MoUs) with the Uganda Wildlife Authority (UWA) for resource access. Findings from key informants and FGDs highlighted the expiry of several MoUs, of which these were not renewed, yet communities continued to harvest resources from the park. These activities occurred twice weekly for 78% of the respondents, while 22% visited once weekly. This was partly attributed to the external demand for forest products beyond the study area. For example, a key informant said:
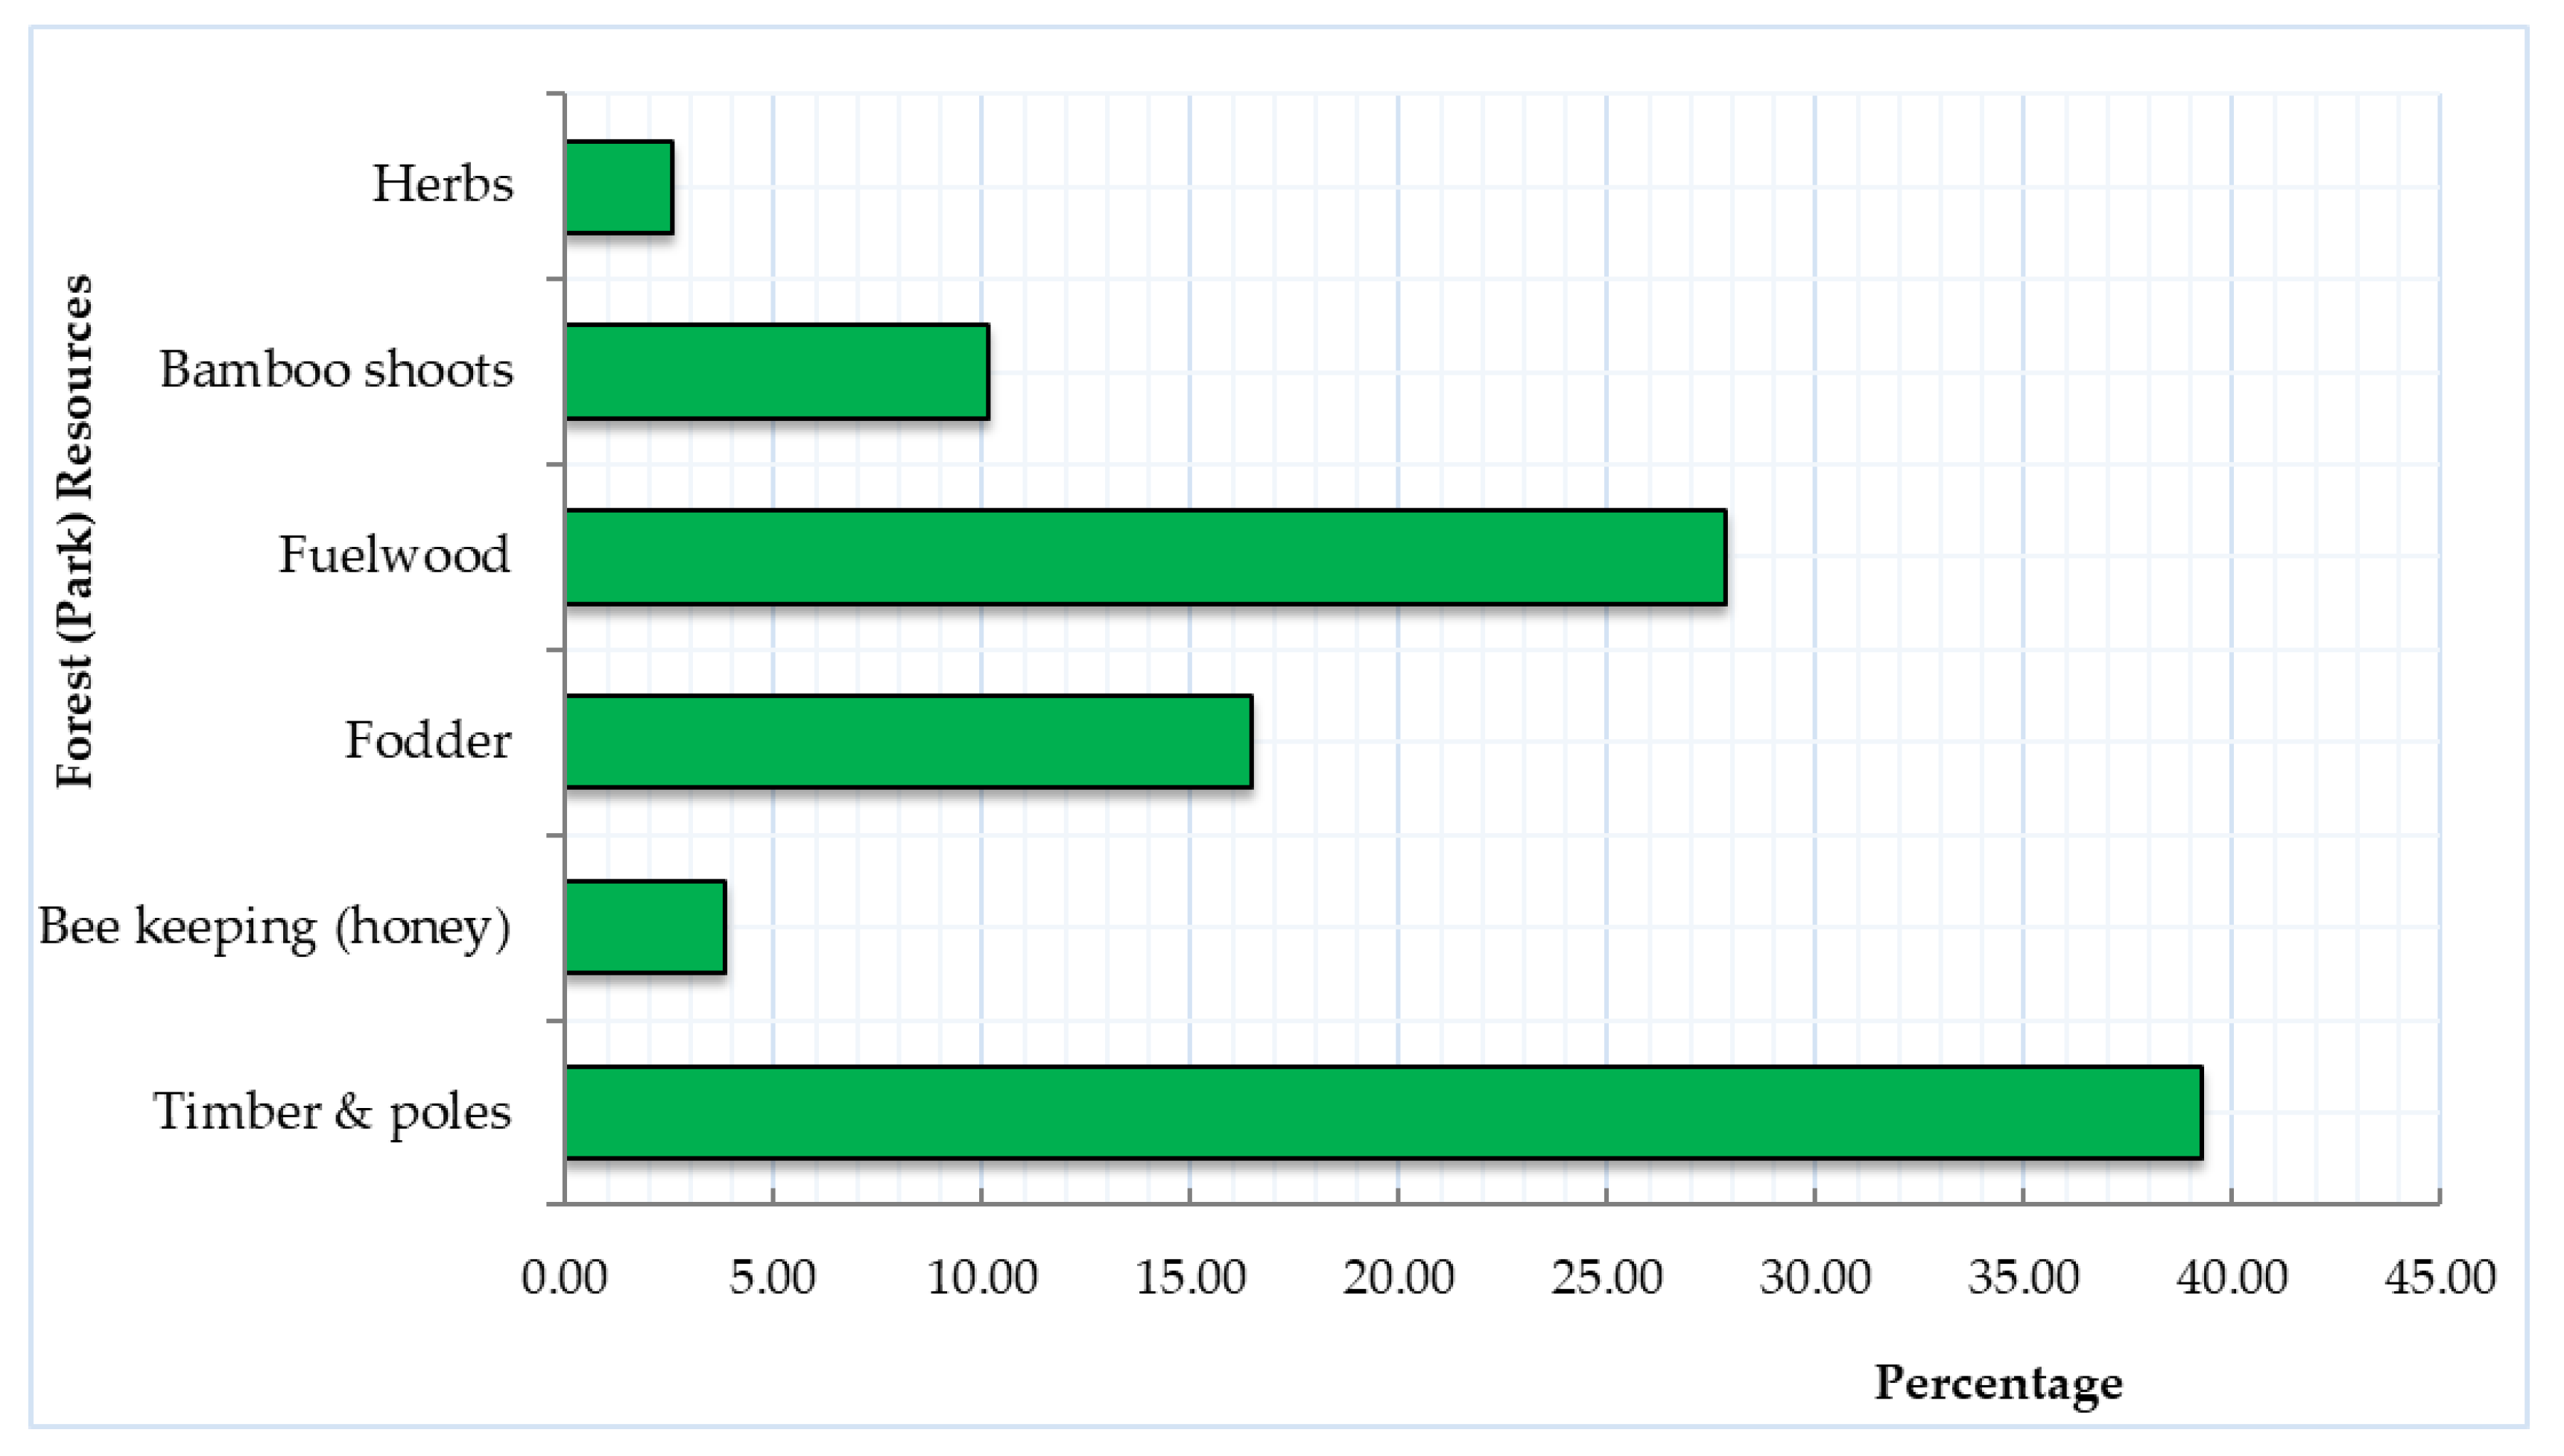
Most communities around Mount Elgon harvest several park resources including; dry poles, mushrooms, herbs and bamboo shoots (malewa). The rate of harvesting has rapidly increased due to external demand and yet the original purpose was intended for communities surrounding the park. For instance, malewa is highly demanded and is on sell during peak seasons in Mbale city and even in Kampala.
Land utilization within the communal land primarily involves homesteads development, subsistence farming, and tree plantations. The number of homesteads per square kilometer trended upwards from 2020 to 2023 consistently across the six sites (Figure 8), with the lowest (32) in 2020 and peaking at 548 in 2023 in the Ibookho and Elgon sites, respectively. The results revealed a general increase in homesteads per year in every study site. Further, the Elgon site consistently recorded the highest number of homesteads per square kilometer (>400) from 2020 to 2023, followed by Nabyoko and Nakhatore with an annual average of 345 homesteads per square kilometer. Annually, the Muranga site averaged 218 homesteads per square kilometer, while Shiteka and Ibookho had the lowest (<50) average of homesteads per square kilometer. Notably, Muranga, Ibookho, and Shiteka are adjacent to the conservation area where the establishment of homesteads is legally prohibited. Nonetheless, the study revealed isolated homesteads in these restricted zones.

3.4. Land Degradation

The study area experiences various forms of land degradation and soil erosion, as reported by 87% of the respondents. Table 3 provides insights into the perceived forms of land degradation and erosion, with soil erosion being the most common form, noted by 33.71% of respondents. Loss of organic matter (17.75%), landslides (15.56%), and declining vegetation cover (12.64%) also featured prominently. According to the farmers, rainy seasons brought additional challenges in the form of flash floods (7.37%) and riverbank erosion (7.21%). Among respondents who reported soil erosion, rill erosion (34.53%), rain splash (24.95%), gullies (20.60%), and sheetwash (19.44%) were cited as the dominant forms. These erosional processes are indicators of the vulnerability of the landscape to soil loss.
The drone imagery analysis revealed landslides as another significant form of land degradation in the study area. Although not widespread, landslide scars were observed during the field surveys in the study area. A more extensive landslide affected Nakhatore village in October 2021, as shown in Figure 4b. About 7.95 acres (3.23 ha) of land within the Nakhatore study site alone was affected. Figure 6 illustrates the transformation of the Nakhatore landscape before and after the landslide. Around 83% of the landslide-affected area had been converted into agriculture by January 2023 with pockets of tree plantations as restoration measures and in response to land fragmentation. During the FGD, one participant expressed:
Our hillslopes in Bududa are very vulnerable to soil erosion and landslides than ever before, because we till our fields in preparation for planting. We always lose a lot of top soil once rainy season starts and landslides also occur because the slopes are very steep and bare. The color of water in the rivers is more reddish especially in March and April and most recently, our community lost an access road, a water spring, crop fields, and tree plantations when a landslide happened in 2022.
Drone image analysis exposed forest encroachment as a prominent form of land degradation in Ibookho, Muranga, and Shiteka (sites with MENP area), although it was perceived in the smallholder farmer interviews as decline in vegetation cover. Table 4 illustrates the encroached area and annual percentage rate of park encroachment from 2020/21 to 2022/23. The encroached forest area was lowest in 2020 and increased progressively. Ibookho had the largest encroached forest area (6.59 ha) by 2023, followed by Muranga (4.42 ha) and Shiteka with the smallest size (4.15 ha). The results further show an increasing trend, with the highest rate in Muranga (114.63%) during 2020-2021 and 55.21% during 2022–2023. Moderate rates were recorded in the 2021–2022 period in Shiteka (34.62%) and Muranga (24.36%). Low rates of encroachment (<20%) occurred in Ibookho, while the lowest (−1.35%) was recorded in Shiteka during 2022/23.
Key informant interviews and FGDs revealed a sequence of forest degradation, starting with intensive fodder and fuelwood extraction, followed by the establishment of crop fields for onions and cabbages. An example of a critical reflection from one of the key informants expressed this as follows:
Forest encroachment in Mount Elgon has occurred since colonial era, especially along on the gentle slopes in the park. Illegal trails from the communities into the park exist and occurrence of human-induced forest fires at night further accelerates encroachment. Besides, monitoring and enforcement of conservation laws has been hampered by limited human resource, court injunctions, and the hilly terrain.
These changes occur along the park boundaries due to the community’s strong dependence on agriculture, land fragmentation, and limited monitoring of encroachment and law enforcement. In some park areas, napier grass was cultivated for fodder. Human-induced fires also occur during the dry season, further endangering the natural cover.

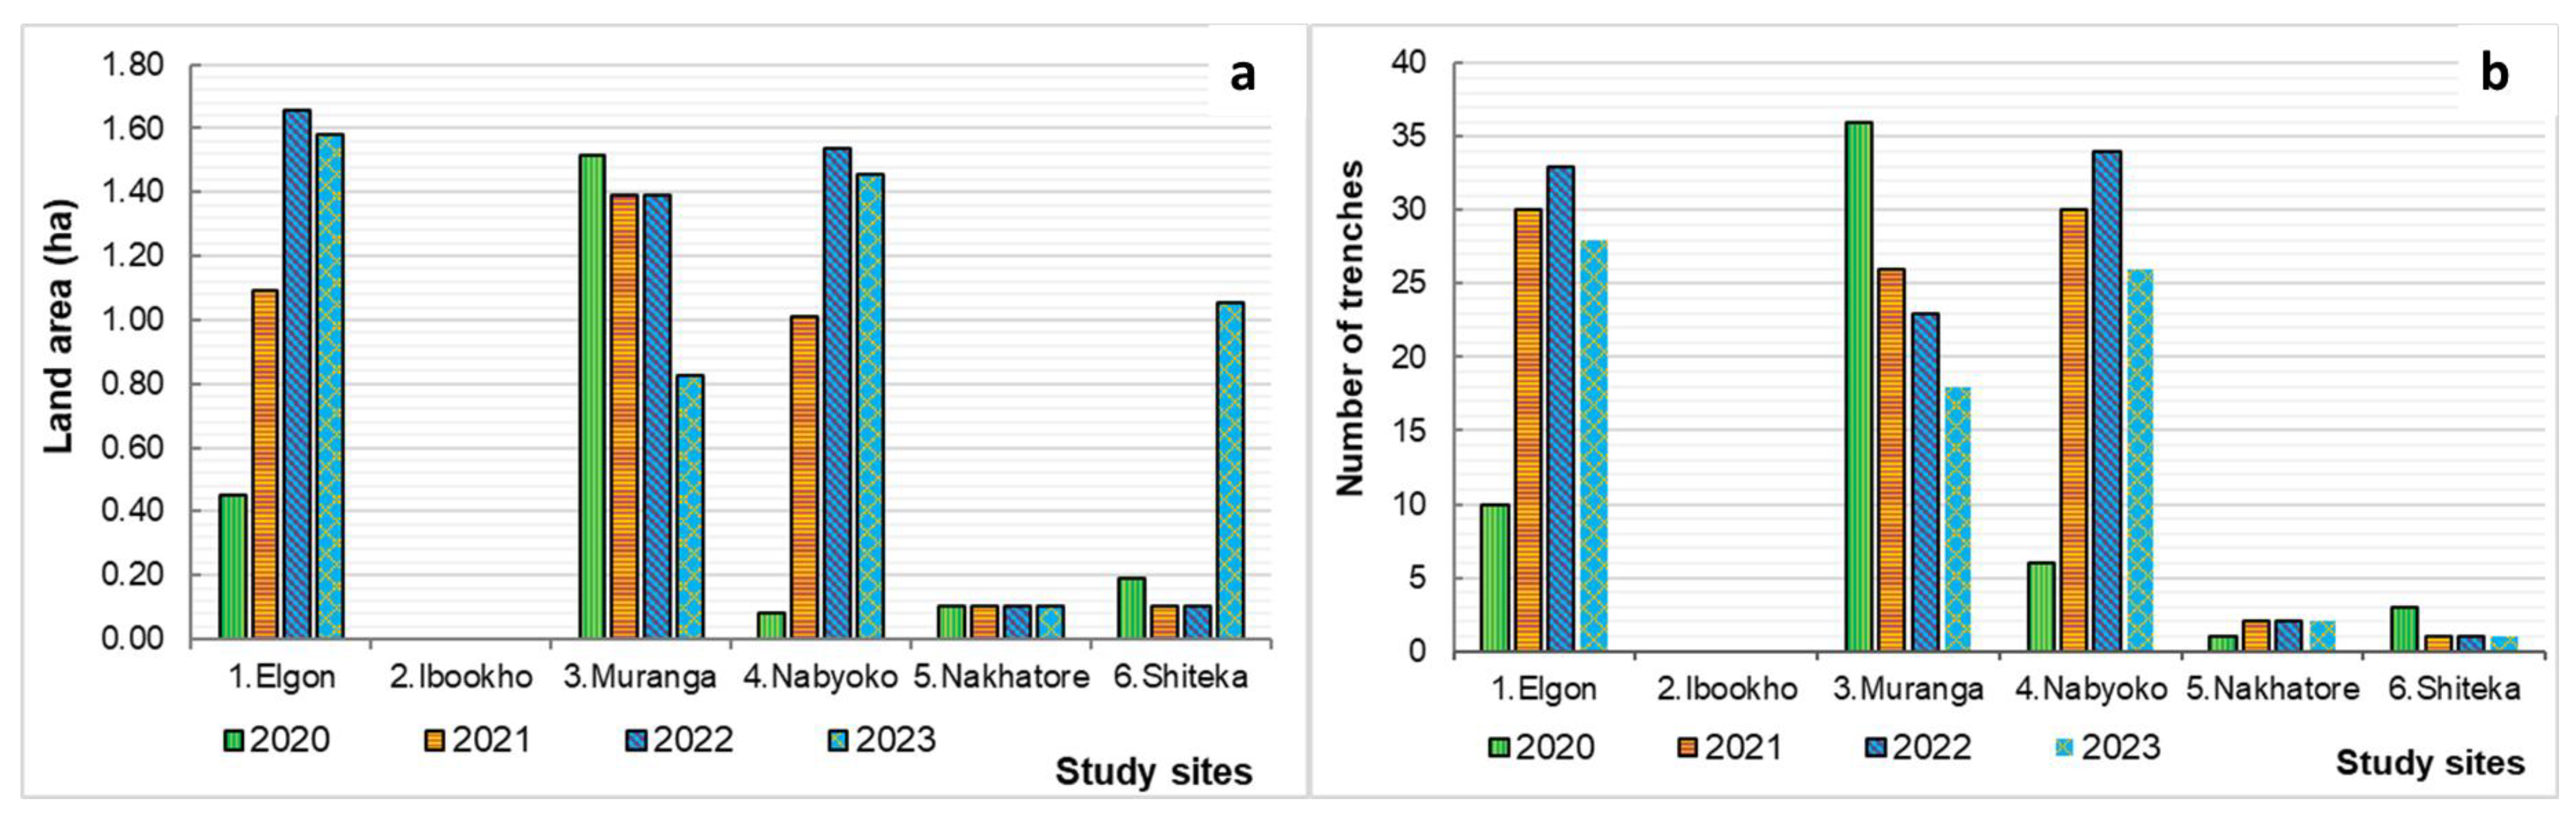
3.5. Soil and Water Conservation (SWC)

According to the study, 87% of the respondents reported to be adopting SWC measures to restore their farm fields and enhance soil productivity. Table 5 depicts the respondents’ perception of the SWC measures used by small-scale farmers in the study area. The most commonly adopted measures fell under the subcategories of vegetation and soil cover (21%), organic matter/soil fertility (14%), grasses and perennial herbaceous plants (13%), and tree and shrub cover (12%). The measures specifically included mixed farming, crop rotations, grass strips, and agro-forestry. Interestingly, the measures were not consistently implemented across all slopes, field area, or the crops that farmers planted annually.
Drone orthomosaic results revealed the widespread use of trenches as a significant SWC measure across the study sites. Figure 9 illustrates the farmland area with trenches and the number of trenches established within the farmland of study sites. Elgon, Muranga, and Nabyoko had the largest farmland area (>0.5 ha) with trenches and the highest number of trenches (>15) in the farmland. These sites coincide with areas where a high number of homesteads was observed (see Figure 8). The number of trenches peaked in 2021 and 2022 as compared to the start and end years of the study. This is partly attributed to limited knowledge prior to 2020 and inadequate routine maintenance (desilting) of the trenches by farm owners. Shiteka and Nakhatore had the smallest number of trenches (<5) per site, while Ibookho had none. The study revealed that trenches were mainly established in banana–coffee plantations, especially near homesteads and not on fields far away or near the park. Some trenches may not have been visible due to high canopy cover in the coffee and banana plantations.
The drone orthomosaics also showed that farmers implemented afforestation and forest conservation as SWC measures. Natural forest area existed in Ibookho, Muranga, and Shiteka. Eucalyptus (eucalyptus globulus) tree plantations have been established within the community land for slope stabilization, timber, and fuelwood. Table 6 shows the trend of area coverage and the rate of change in tree plantations and natural forest (MENP) area in the study sites. In 2020, the Shiteka site had the largest area (17.18 ha) under primary forest, followed by Muranga (3.54 ha), and the lowest in Ibookho (2.36 ha). The primary forest cover drastically reduced by 2023, with Muranga having the lowest cover (0.26 ha), followed by Ibookho (0.97 ha) and Shiteka (15.54 ha). The results of annual rates of change indicate a general decrease in natural forest cover, with Muranga recording up to an 80% decrease in the period 2021/22. This reduction is attributed to expansion of farm land, as seen in Figure 6. The Shiteka site had the lowest decrease in forest cover and even experienced a 1% increase in forest cover in 2022–2023.
Tree plantations in the community showed a general increase as depicted in Table 6. The highest percentage increase (92.11%) in tree plantation was recorded in the Shiteka site, followed by Ibookho (74.95%) during the period 2021/22. However, the Nakhatore site experienced a significant decrease (−63.56%) in tree plantation coverage, primarily due to a major landslide in 2021 and limited hands-on farmer training in SWC measures; hence, fewer tree plantations. On adoption and effectiveness of SWC practices, one participant in FGD expressed:
The quality of my farm and produce was very poor before attending MWARES trainings on farm management. The farm is now healthy, organized and more fertile because of pruning coffee, digging trenches, and planting napier grasses and calliandra on farm edges. I am excited because my farm harvest is now very good.
Additionally, eucalyptus harvests by farm owners further reduced coverage, particularly in the Elgon and Nabyoko sites during the periods 2020/21 and 2021/22, respectively. Of great importance to note is that this study only considered tree plantations with a remotely visible canopy cover in the study sites. Nonetheless, the study results from household surveys and drone image analysis, illustrating several SWC measures that have been adopted in the study area.

3.6. Socio-Economic Factors Explaining Resource Extraction, Land Degradation, and SWC Measures

The results of binary probit regression analysis offer valuable insights into the impact of respondents’ income sources, land sizes on resource extraction levels, vulnerability to land degradation, and the adoption of SWC measures (see Supplement Table S3). Households with larger land size showed a significant tendency (p < 0.05) to extract resources from the park. Conversely, respondents with diverse income sources displayed a lower inclination to extract park resources, although not statistically significant (p > 0.05). The regression results further underscored the significance (p < 0.05) of livelihood diversification in reducing the risks of land degradation. While not statistically significant (p > 0.05), larger farm sizes were associated with an increased vulnerability to land degradation. Finally, farmers with larger farm land size were more inclined to adopt SWC measures, whereas households with diverse income sources were less inclined to adopt these measures, although these associations were not statistically significant (p > 0.05). During an interview for instance, a farmer mentioned:
Our father divided about 1.50 hectares of land among five of us (his children) and I got 0.4 hectares. The farming space will reduce further if I dig trenches or establish contour lines in my farmland. Therefore, I am only composting, mulching the farmland, and planting napier grass on the farm edges.

4. Discussion

4.1. Land Use Change

The results of the accuracy assessment showed that the 24 maps from six sites and eight land use classes considered by this study were in agreement since the overall accuracy was above 80% [51]. The heterogeneity between classes in the study area, especially between grassland, bushland, and agriculture, have been previously reported to limit the classification accuracy [24]. Additionally, the sudden change in weather (strong winds followed by a storm) affected some drone flights and led to incomplete data for the Nakhatore site in 2021 (Figure 6). This limitation on drones has been documented to affect aerial surveys in the tropics [25,29].
The results for the land use changes between 2020 and 2023 indicates that most of bushland, grassland, planted forest, and tropical high forest was converted into agriculture across the six study sites. Despite limited built-up areas within the study sites, extensive land is devoted to intensive agriculture, with many farmers residing in scattered homesteads throughout the study area and regularly commuting to cultivate crops within these sites. This is most common in areas adjacent to the park (in Muranga, Ibookho, and Shiteka), as reported previously, and this is projected to increase [36]. The fluctuation in planted forest cover is mainly due to the harvest of trees by owners to meet the enormous demand for fuelwood [32]. The occurrence of a landslide in the Nakhatore site specifically lead to a reduction in planted forest cover, agriculture, and the resultant increase in bare and sparsely vegetated surfaces and open water (Figure 6). Further, Nakhatore village is a control site without any interventions from the MWARES Project. The rate at which agriculture was re-introduced into the landslide-affected area between 2022 and 2023 was rapid, indicating high pressure on land. The demographic characteristics reported in the study area also indicates high demand for arable land [17,38].

4.2. Smallholder Farmers’ Perception

In the study area, the socio-economic attributes of the respondents (for instance, large household size, low amount of income, heavy dependence of agriculture and fuelwood as main energy cooking source) reflects heavy reliance on natural resources, significantly increasing land resource utilization. The socio-economic characteristics in the study area underscore the rural, agriculture-centric nature of the community, the dominance of customary land systems, and the challenges associated with limited education and low incomes. These factors shaped farmers’ perceptions and decisions regarding land use and conservation in Pakistan [7]. Forest loss in the Brazilian Amazon has been attributed to developmental projects and urbanization [52]. Previous studies have also reported that heavy reliance on natural resources, particularly for fuelwood, exerts extreme pressure on forests, leading to substantial reductions in tree cover [7,15]. Documented evidence further shows that lower levels of education negatively impact the adoption of SWC measures in Mount Elgon and Ethiopia [9,17]. The results provide a valuable context for understanding the complex interplay between human factors and land degradation, offering essential guidance for designing interventions in the Mount Elgon region.

4.3. Land Utilization and Management

The study findings illuminate the intricate dynamics of land utilization and management, from resource extraction within the park to farming practices on communal land in the Mount Elgon region. According to Himmelfarb and Cavanagh [30], the transitions in legal status and institutions in charge of the management of Mount Elgon national park since 1894 has affected the conservation efforts. Resource exploitation practices in the Mount Elgon region, coupled with specific household characteristics, exert considerable pressure on both the local park and community lands, leading to degradation [20]. A shift from perennial to annual crops is notable due to the short growth cycle and strong market demand, pushing farmers towards this transition [53]. Moreover, a trend of mixed farming within perennial crop fields is evident in the area [17,54]. Increasing homesteads signify a growing population [24] and ongoing land fragmentation, connected by multiple road trails [32,36]. Existing studies have reported impacts of roads and rapid settlement expansion in exacerbating forest encroachment and degradation [18,36]. Additionally, animal fodder, essential farm inputs like mulching and staking materials, especially for vegetables and climbing beans, are sourced from the forest [32,53]. The communities around the park heavily rely on nature and this increases the rate of resource extraction. Addressing these bottlenecks and reducing the practices of rapid resource extraction is crucial for effective land management. Livelihood diversification among households will further provide income and thereby enhance conservation efforts in the Mount Elgon region. Enhancing road infrastructure and social amenities is crucial for improved access to markets, education, and healthcare, facilitating alternative livelihoods and boosting tourism in the area. Additionally, ongoing efforts should focus on educating household heads about family planning, modern population control methods, and sensitization on collaborative forest management. These will minimize the rates of encroachment due to population growth and intensive subsistence farming.

4.4. Land Degradation

Agriculture, a primary livelihood for most rural communities, has been reported as a major driver of land degradation and encroachment in mountainous landscapes, including the Mount Elgon region [18,36]. Soil erosion processes via rills and sedimentation has been reported to be extensive in Rwanda, reducing soil fertility in farmland [16]. Landslides have also affected community livelihoods in hilly and mountainous landscapes [11,50] and across Africa [55]. Broeckx et al. [11] mapped up to 653 landslides in the community and national park of the Mount Elgon region, Uganda. These mass movements led to loss of life, property, and infrastructure [34]. Further, encroachment into the forest and continued farming on very steep slopes increases risks to disasters in Mount Elgon [50]. Similar results of forest clearance for agriculture and fuelwood harvests have been reported to contribute towards degradation in Ethiopia and Kenya [14]. Excess demand for forest products by communities and towns outside the conservation area increases rates of resource extraction [7,14]. This is especially the case with fresh bamboo shoots, which are highly demanded and consumed (as malewa) within and beyond the Mount Elgon region. Furthermore, human-induced fires, selective logging, firewood production, and farmland patches persisting as disturbances have been reported to cause deforestation and degradation within Mount Elgon [36], South–West Ivory Coast [18], and Brazilian Amazon [6]. These activities with resultant impacts underscore the need for sustainable land management strategies. Addressing land degradation necessitates comprehensive training for households in implementing structural SWC measures like contour bunds, terraces, and trenches across the landscape. Promoting reforestation and agroforestry is essential for slope stability, providing animal fodder and fuelwood. Apart from awareness campaigns, households should receive training in collaborative park management to shift their mindset regarding deforestation and encroachment. Developing the tourism potential of the watershed is crucial for supporting conservation efforts due to presence of waterfalls, caves, and biodiversity in the forest. Local development of craftsmanship, tour guiding, and the hospitality industry can diversify livelihoods. Ultimately, communities will value and inherently conserve the forest when they directly experience the benefits of tourism, reducing soil erosion and landslides in the region.

4.5. Soil and Water Conservation (SWC) Measures

Despite the awareness of land degradation challenges in the study area, not all farmers are implementing SWC measures. Some farmers in Mount Elgon still perceive their farmlands to be continuously productive [17]. Nonetheless, implementation of SWC measures is widespread in mountainous landscapes, with practices like mixed farming, afforestation, and grass strips being adopted as traditional measures by farmers in Mount Elgon [17,21,36]. In Rwanda, efforts against soil erosion involve terraces, afforestation, and ditches [16]. Elsewhere, agroforestry and the planting of fodder trees have been reported to contribute to land productivity while reducing pressure on forests [14,18]. Multiple strategies have been employed in Mount Elgon to facilitate regreening and landscape restoration. The Participatory Integrated Plan approach, as part of the MWARES project, collaboratively engages community members in developing collective solutions to address environmental and socio-economic challenges within the community. For instance, hands-on training of farmers on the adoption of SWC measures using the integrated farm planning approach within the study area shows promising results towards conservation and landscape restoration. The skills and knowledge acquired by the farmers under the MWARES Project has led to adoption of SWC measures, especially trenches, mulching, and agroforestry, at a plot level [19,35]. Encouraging beekeeping and promoting energy-saving stoves will contribute to reducing deforestation in the area. Crucially, support and extension services from the government and conservationists are needed to guide farmers in adopting appropriate measures and monitoring standards. Collective efforts are essential to sensitize farmers on the long-term impacts of land degradation, provide training on SWC measures, and enforce forest conservation laws.

4.6. Socio-Economic Factors Explaining Resource Extraction, Land Degradation, and SWC Measures

The regression analysis provided interesting results in this study and can be compared with the existing literature. The tendency of large land owners to excessively harvest park resources may be attributed to their need for staking materials, especially for climbing beans and tomatoes and animal feeds for their livestock, particularly under zero-grazing conditions [53]. Additionally, farmers with extensive land may have better insights into park entry points, especially when their land is adjacent to the park [36]. Households with diversified income sources tend to be less likely to extract park resources, aligning with previous findings in Pakistan that off-farm activities reduce dependence on forest resources [7,15]. The costs and risks associated with park access are high compared to the gains [30]. According to Nakakaawa et al. [20], livelihood diversification not only generates more household income, but also contributes to reduced resource extraction frequency. Moreover, livelihood diversification ensures household income inflow even in the face of poor harvests due to farming-related degradation [7]. Large farmlands are more vulnerable to land degradation since most land in the study area is dedicated to rainfed agriculture and farming is the main source of livelihood. Investment related to SWC measures is too demanding and farm owners are not able to adequately implement these measures, making any degradation detrimental to crop yields. The binary probit regression results in this study aligns with findings supporting farmers with larger farmland in implementing SWC measures. The results also indicated that farmers with less farmland are more concerned about losing land area to specific SWC measures and this has been reported previously within Mount Elgon [17] and, e.g., in Ethiopia [56]. This, however, contrasts with Betela and Wolka, [9] due to differences in land sizes. Farmers in Mount Elgon typically own less than 1 hectare, differing from those in southwest Ethiopia. Further, farmers with diverse income sources are less likely to implement SWC measures due to associated costs and marginal returns. The harvests from rainfed agricultural fields can be very low and inconsistent as compared to the cost of farm inputs. This has been evidenced in eastern Ethiopia, where greater income is generated from engagement in off-farm activities and not invested into farming [57]. Although small proportion of farmers have adopted SWC measures, the low levels of investments in SWC measures has been projected in the long term to further increase land degradation and forest encroachment in Mount Elgon [36].
To counter this trend, it is crucial to prioritize efforts in reducing population growth, improving access to formal education for the younger generation, and offering training for farmers to adopt sustainable land management activities. Subsequent studies should explore the factors influencing farmers’ adoption of specific Soil and Water Conservation (SWC) measures, the impact of hands-on training, and mindset change on restoration activity adoption. Additionally, investigations into the effectiveness of SWC measures in addressing soil erosion and landslides at a catchment level in Mount Elgon are necessary.

5. Conclusions

The integration of drones in environmental monitoring surveys yields valuable insights into understanding land use changes, degradation, and particularly, the rate of encroachment—the primary conservation challenge in Mount Elgon. Drones provided evidence-based results on land degradation processes and the adoption of SWC measures. Other observations were drawn from diverse sources such as the drone RGB orthomosaics, household surveys, FGDs, and key informant interviews.
The results show a persistent increase in agricultural coverage and planted forest at the expense of grassland, bushland, and tropical high forest. This is attributed to household demographic profiles characterized by large household sizes, heavy dependence on rainfed subsistence agriculture, low levels of education, and limited annual income. These household and socio-economic factors contribute to overexploitation of natural resources, leading to conservation and land degradation issues. Landslides and soil erosion were dominant forms of land degradation in the study area. Portions of park land had also been encroached by agriculture, worsening the continuous rate of encroachment and deforestation. Although smallholder farmers in the study area have implemented various soil and water conservation (SWC) measures, they often apply them selectively, concentrating on specific crops and portions of their fields. The study results from drone surveys found that SWC measures were predominantly targeted at banana–coffee fields intercropped with beans and maize during the wet seasons, as reported by 87% of the respondents during the household surveys. This selective approach underscores the need for more comprehensive and integrated SWC strategies. To address the prevalent land degradation on farm fields and park encroachment, targeted and sustainable interventions are essential. Effective land management practices, conservation efforts, and community engagement must be prioritized. The collaborative involvement of all stakeholders is crucial, particularly in light of the continuous increasing trend of observed land degradation as underpinned by the drone and household surveys, underscoring the need for timely and season-specific intervention measures.
This research that combined drones with household surveys is a strong tool that enriches our understanding of variations in land use dynamics on Mount Elgon, underscoring the significance of community engagement and sustainable land management for future conservation endeavors. Involving community members, such as natural resource committees, becomes crucial for the effective management of conservation areas. Collective integration of SWC measures by farmers from individual plots to a catchment level would become pivotal in reducing soil erosion and landslides in the area. The application of drone technology proves instrumental for the regular monitoring of landscape restoration activities and conservation initiatives, especially in challenging terrains. Drones offer a seamless means of routinely monitoring the growth of tree plantations and the adoption of Soil and Water Conservation (SWC) measures. Conservation agencies and organizations are encouraged to embrace this approach as it provides timely information to effectively counter encroachment and deforestation.

Supplementary Materials

The following supporting information can be downloaded at: https://www.mdpi.com/article/10.3390/land13010001/s1, File S1: Agisoft metashape processing report; Table S1: structured questionnaire used in this study; Table S2: The classification accuracy assessment; Table S3: Binary probit regression analysis.

Author Contributions

Conceptualization, H.O., C.A.M., J.E.M.B. and F.M.; data curation, H.O., C.A.M. and S.N.; formal analysis, H.O., C.A.M. and S.N.; funding acquisition, C.A.M., J.E.M.B. and F.M.; investigation, H.O., S.N., C.A.M., J.E.M.B. and F.M.; methodology, H.O., S.N., C.A.M., J.E.M.B. and F.M.; resources, H.O., C.A.M., J.E.M.B. and F.M.; software, H.O., C.A.M. and S.N.; supervision, C.A.M., J.E.M.B. and F.M.; validation, H.O., C.A.M. and S.N.; visualization, H.O., C.A.M., J.E.M.B., S.N. and F.M.; writing—original draft, H.O.; writing—review and editing, H.O., C.A.M., J.E.M.B., S.N. and F.M. All authors have read and agreed to the published version of the manuscript.

Funding

This research was conducted within MWARES Project, funded by Stichting DOB Ecology, project number 5200044445.

Data Availability Statement

The data presented in this study are available on request from the corresponding author. The data are not publicly available due to ethical restrictions.

Acknowledgments

We acknowledge the support from Uganda Wildlife Authority (UWA), Mount Elgon Conservation Area for the support in drone importation and operations in Mount Elgon, The Manafwa Watershed Restoration and Stewardship (MWARES) Project consortium and staff, community members in Bududa district, and research assistants. This study proposal was evaluated and approved by Uganda Christian University Research Ethics Committee (UCUREC-2020-59). We appreciate the support from the committee. We thank ESIPPS International Limited for the baseline drone campaigns in 2020.

Conflicts of Interest

The authors declare no conflict of interest.

References

  1. UNEP. From Hotspots to Hopespots: Connecting Local Changes to Global Audiences. Environ. Dev. 2013, 8, 95–104. [Google Scholar] [CrossRef]
  2. Lira, P.K.; Portela, R.d.C.Q.; Tambosi, L.R. Land-Cover Changes and an Uncertain Future: Will the Brazilian Atlantic Forest Lose the Chance to Become a Hopespot? In The Atlantic Forest: History, Biodiversity, Threats and Opportunities of the Mega-Diverse Forest; Marques, M.C.M., Grelle, C.E.V., Eds.; Springer Nature Switzerland: Cham, Switzerland, 2021; pp. 233–251. ISBN 9783030553227. [Google Scholar]
  3. Kaivosoja, J. Future Possibilities and Challenges for UAV-Based Imaging Development in Smart Farming. In New Developments and Environmental Applications of Drones; Lipping, T., Linna, P., Narra, N., Eds.; Springer: Helsinki, Finland, 2022; pp. 117–128. ISBN 9783030778590. [Google Scholar]
  4. D’Oleire-Oltmanns, S.; Marzolff, I.; Klaus, D.P.; Ries, J.B. Unmanned Aerial Vehicle (UAV) for Monitoring Soil Erosion in Morocco. Remote Sens. 2012, 4, 3390–3416. [Google Scholar] [CrossRef]
  5. Tarolli, P.; Straffelini, E. Agriculture in Hilly and Mountainous Landscapes: Threats, Monitoring and Sustainable Management. Geogr. Sustain. 2020, 1, 70–76. [Google Scholar] [CrossRef]
  6. Matricardi, E.A.T.; Skole, D.L.; Costa, O.B.; Pedlowski, M.A.; Samek, J.H.; Miguel, E.P. Long-Term Forest Degradation Surpasses Deforestation in the Brazilian Amazon; American Association for the Advancement of Science: Washington, DC, USA, 2020; Volume 369. [Google Scholar]
  7. Ali, N.; Hu, X.; Hussain, J. The Dependency of Rural Livelihood on Forest Resources in Northern Pakistan’s Chaprote Valley. Glob. Ecol. Conserv. 2020, 22, e01001. [Google Scholar] [CrossRef]
  8. Sassen, M.; Sheil, D.; Giller, K.E.; ter Braak, C.J.F. Complex Contexts and Dynamic Drivers: Understanding Four Decades of Forest Loss and Recovery in an East African Protected Area. Biol. Conserv. 2013, 159, 257–268. [Google Scholar] [CrossRef]
  9. Betela, B.; Wolka, K. Evaluating Soil Erosion and Factors Determining Farmers’ Adoption and Management of Physical Soil and Water Conservation Measures in Bachire Watershed, Southwest Ethiopia. Environ. Chall. 2021, 5, 100348. [Google Scholar] [CrossRef]
  10. Makabayi, B.; Musinguzi, M.; Otukei, J.R. Estimation of Ground Deformation in Landslide Prone Areas Using GPS: A Case Study of Bududa, Uganda. Int. J. Geosci. 2021, 12, 213–232. [Google Scholar] [CrossRef]
  11. Broeckx, J.; Maertens, M.; Isabirye, M.; Vanmaercke, M.; Namazzi, B.; Deckers, J.; Tamale, J.; Jacobs, L.; Thiery, W.; Kervyn, M.; et al. Landslide Susceptibility and Mobilization Rates in the Mount Elgon Region, Uganda. Landslides 2019, 16, 571–584. [Google Scholar] [CrossRef]
  12. Reddy, C.S.; Bird, G.N.; Sreelakshmi, S.; Manikandan, T.M.; Asra, M.; Krishna, P.H.; Jha, C.S.; Rao, P.V.N.; Diwakar, P.G. Identification and Characterization of Spatio-Temporal Hotspots of Forest Fires in South Asia. Environ. Monit. Assess. 2019, 191, 791. [Google Scholar] [CrossRef]
  13. NEMA. National State of the Environment Report for Uganda 2016/17; NEMA: Kampala, Uganda, 2017. [Google Scholar]
  14. Duguma, L.A.; Atela, J.; Minang, P.A.; Ayana, A.N.; Gizachew, B.; Nzyoka, J.M.; Bernard, F. Deforestation and Forest Degradation as an Environmental Behavior: Unpacking Realities Shaping Community Actions. Land 2019, 8, 26. [Google Scholar] [CrossRef]
  15. Hussain, J.; Zhou, K.; Akbar, M.; Zafar khan, M.; Raza, G.; Ali, S.; Hussain, A.; Abbas, Q.; Khan, G.; Khan, M.; et al. Dependence of Rural Livelihoods on Forest Resources in Naltar Valley, a Dry Temperate Mountainous Region, Pakistan. Glob. Ecol. Conserv. 2019, 20, e00765. [Google Scholar] [CrossRef]
  16. Maniraho, A.P.; Liu, W.; Mupenzi, C.; Mind’je, R.; Nzabarinda, V.; Gasirabo, A.; Nyirarwasa, N.; Li, L. Mapping Soil Erosion and Analyzing Its Severity Using the RUSLE Model and Local Farmers’ Perception in the Agricultural Area of Rwanda. Model. Earth Syst. Environ. 2023, 9, 1069–1087. [Google Scholar] [CrossRef]
  17. Bamutaze, Y.; Mukwaya, P.; Oyama, S.; Nadhomi, D.; Nsemire, P. Intersecting RUSLE Modelled and Farmers Perceived Soil Erosion Risk in the Conservation Domain on Mountain Elgon in Uganda. Appl. Geogr. 2021, 126, 102366. [Google Scholar] [CrossRef]
  18. Kouassi, J.-L.; Gyau, A.; Diby, L.; Bene, Y.; Kouamé, C. Assessing Land Use and Land Cover Change and Farmers’ Perceptions of Deforestation and Land Degradation in South-West Côte d’Ivoire, West Africa. Land 2021, 10, 429. [Google Scholar] [CrossRef]
  19. Kessler, A.; van Reemst, L.; Beun, M.; Slingerland, E.; Pol, L.; De Winne, R. Mobilizing Farmers to Stop Land Degradation: A Different Discourse from Burundi. Land Degrad. Dev. 2021, 32, 3403–3414. [Google Scholar] [CrossRef]
  20. Nakakaawa, C.; Moll, R.; Vedeld, P.; Sjaastad, E.; Cavanagh, J. Collaborative Resource Management and Rural Livelihoods around Protected Areas: A Case Study of Mount Elgon National Park, Uganda. For. Policy Econ. 2015, 57, 1–11. [Google Scholar] [CrossRef]
  21. Buyinza, J.; Nuberg, I.K.; Muthuri, C.W.; Denton, M.D. Assessing Smallholder Farmers’ Motivation to Adopt Agroforestry Using a Multi-Group Structural Equation Modeling Approach. Agrofor. Syst. 2020, 94, 2199–2211. [Google Scholar] [CrossRef]
  22. Kessler, C.A.; van Duivenbooden, N.; Nsabimana, F.; van Beek, C.L. Bringing ISFM to Scale through an Integrated Farm Planning Approach: A Case Study from Burundi. Nutr. Cycl. Agroecosystems 2016, 105, 249–261. [Google Scholar] [CrossRef]
  23. Qi, W.; Li, H.; Zhang, Q.; Zhang, K. Forest Restoration Efforts Drive Changes in Land-Use/Land-Cover and Water-Related Ecosystem Services in China’s Han River Basin. Ecol. Eng. 2019, 126, 64–73. [Google Scholar] [CrossRef]
  24. Opedes, H.; Mücher, S.; Baartman, E.M.J.; Nedala, S.; Mugagga, F. Land Cover Change Detection and Subsistence Farming Dynamics in the Fringes of Mount Elgon National Park, Uganda from 1978–2020. Remote Sens. 2022, 14, 2423. [Google Scholar] [CrossRef]
  25. Suab, S.A.; Avtar, R. Unmanned Aerial Vehicle System (UAVS) Applications in Forestry and Plantation Operations: Experiences in Sabah and Sarawak, Malaysian Borneo. In Unmanned Aerial Vehicle: Applications in Agriculture and Environment; Avtar, R., Watanabe, T., Eds.; Springer International Publishing: Cham, Switzerland, 2020; pp. 101–118. ISBN 9783030271565. [Google Scholar]
  26. Gomez-Sapiens, M.; Schlatter, K.J.; Melendez, A.; Hernandez-Lopez, D.; Salazar, H.; Kendy, E.; Flessa, K.W. Improving the Efficiency and Accuracy of Evaluating Aridland Riparian Habitat Restoration Using Unmanned Aerial Vehicles. Remote Sens. Appl. Soc. Environ. 2021, 7, 488–503. [Google Scholar] [CrossRef]
  27. Ancin-murguzur, F.J.; Munoz, L.; Monz, C.; Hausner, V.H. Drones as a Tool to Monitor Human Impacts and Vegetation Changes in Parks and Protected Areas. Remote Sens. Ecol. Conserv. 2019, 6, 105–113. [Google Scholar] [CrossRef]
  28. Ouattara, T.A.; Sokeng, V.C.J.; Zo-Bi, I.C.; Kouamé, K.F.; Grinand, C.; Vaudry, R. Detection of Forest Tree Losses in Côte d’Ivoire Using Drone Aerial Images. Drones 2022, 6, 83. [Google Scholar] [CrossRef]
  29. Ecke, S.; Dempewolf, J.; Frey, J.; Schwaller, A.; Endres, E.; Klemmt, H.J.; Tiede, D.; Seifert, T. UAV-Based Forest Health Monitoring: A Systematic Review. Remote Sens. 2022, 14, 3205. [Google Scholar] [CrossRef]
  30. Himmelfarb, D.; Cavanagh, C.J. Managing the Contradictions: Conservation, Communitarian Rhetoric, and Conflict at Mount Elgon National Park. In Conservation and Development in Uganda; Sandbrook, C., Cavanagh, C.J., Mwesigye, T.D., Eds.; Routledge: New York, NY, USA, 2018; pp. 85–103. ISBN 978-1-138-71092-4. [Google Scholar]
  31. Petursson, J.G.; Vedeld, P.; Sassen, M. An Institutional Analysis of Deforestation Processes in Protected Areas: The Case of the Transboundary Mt. Elgon, Uganda and Kenya. For. Policy Econ. 2013, 26, 22–33. [Google Scholar] [CrossRef]
  32. Sassen, M.; Sheil, D.; Giller, K.E. Fuelwood Collection and Its Impacts on a Protected Tropical Mountain Forest in Uganda. For. Ecol. Manag. 2015, 354, 56–67. [Google Scholar] [CrossRef]
  33. Vedeld, P.; Cavanagh, C.; Petursson, J.; Nakakaawa, C.; Moll, R.; Sjaastad, E. The Political Economy of Conservation at Mount Elgon, Uganda: Between Local Deprivation, Regional Sustainability, and Global Public Goods. Conserv. Soc. 2016, 14, 183. [Google Scholar] [CrossRef]
  34. Vlaeminck, P.; Maertens, M.; Isabirye, M.; Vanderhoydonks, F.; Poesen, J.; Deckers, S.; Vranken, L. Coping with Landslide Risk through Preventive Resettlement. Designing Optimal Strategies through Choice Experiments for the Mount Elgon Region, Uganda. Land Use Policy 2016, 51, 301–311. [Google Scholar] [CrossRef]
  35. Misanya, D.; Tassone, V.C.; Kessler, A.; Kibwika, P.; Arjen, E.J. Analysing Farmers’ Learning for Socio-Ecological Stewardship in Eastern Uganda: A Transformative Learning Ecology Perspective. NJAS Impact Agric. Life Sci. 2023, 95, 2191795. [Google Scholar] [CrossRef]
  36. Opedes, H.; van Eupen, M.; Mücher, C.A.; Baartman, J.E.M.; Mugagga, F. Park Conservation or Degradation? ICLUE Modelling of Land Use Change Projections in the Upper Manafwa Watershed on Mount Elgon, Uganda. J. Nat. Conserv. 2023, 76, 126493. [Google Scholar] [CrossRef]
  37. Jiang, B.; Bamutaze, Y.; Pilesjö, P. Climate Change and Land Degradation in Africa: A Case Study in the Mount Elgon Region, Uganda. Geo-Spat. Inf. Sci. 2014, 17, 39–53. [Google Scholar] [CrossRef]
  38. Uganda Bureau of Statistics. The National Population and Housing Census 2014—Area Specific Profile Series; Uganda Bureau of Statistics: Kampala, Uganda, 2017. [Google Scholar]
  39. Elkhrachy, I. Accuracy Assessment of Low-Cost Unmanned Aerial Vehicle (UAV) Photogrammetry. Alex. Eng. J. 2021, 60, 5579–5590. [Google Scholar] [CrossRef]
  40. Ulvi, A. Documentation, Three-Dimensional (3D) Modelling and Visualization of Cultural Heritage by Using Unmanned Aerial Vehicle (UAV) Photogrammetry and Terrestrial Laser Scanners. Int. J. Remote Sens. 2021, 42, 1994–2021. [Google Scholar] [CrossRef]
  41. National Forestry Authority (NFA). Gazetted Areas GIS Database; National Forestry Authority (NFA): Kampala, Uganda, 2007. [Google Scholar]
  42. WOCAT. Where the Land Is Greener—Case Studies and Analysis of Soil and Water Conservation Initiatives Worldwide; Liniger, H., Critchley, W., Eds.; FAO, UNEP, CDE: Wageningen, The Netherlands, 2007; ISBN 9789290813392. [Google Scholar]
  43. WOCAT. Questionnaire on Sustainable Land Management (SLM) Technologies. A Tool to Help Document, Assess & Disseminate SLM Practices. Available online: Wocat.net/documents/189/QT_Core_EN.pdf (accessed on 8 May 2021.).
  44. Ul Din, S.; Mak, H.W.L. Retrieval of Land-Use/Land Cover Change (LUCC) Maps and Urban Expansion Dynamics of Hyderabad, Pakistan via Landsat Datasets and Support Vector Machine Framework. Remote Sens. 2021, 13, 3337. [Google Scholar] [CrossRef]
  45. Khalid, N.; Shahrol, N.A. Evaluation The Accuracy of Oil Palm Tree Detection Using Deep Learning and Support Vector Machine Classifiers. IOP Conf. Ser. Earth Environ. Sci. 2022, 1051, 012028. [Google Scholar] [CrossRef]
  46. Adugna, T.; Xu, W.; Fan, J. Comparison of Random Forest and Support Vector Machine Classifiers for Regional Land Cover Mapping Using Coarse Resolution FY-3C Images. Remote Sens. 2022, 14, 574. [Google Scholar] [CrossRef]
  47. Fragou, S.; Kalogeropoulos, K.; Stathopoulos, N.; Louka, P.; Srivastava, P.K.; Karpouzas, S.; Kalivas, D.P. Quantifying Land Cover Changes in a Mediterranean Environment Using Landsat TM and Support Vector Machines. Forests 2020, 11, 750. [Google Scholar] [CrossRef]
  48. Gigović, L.; Pourghasemi, H.R.; Drobnjak, S.; Bai, S. Testing a New Ensemble Model Based on SVM and Random Forest in Forest Fire Susceptibility Assessment and Its Mapping in Serbia’s Tara National Park. Forests 2019, 10, 408. [Google Scholar] [CrossRef]
  49. UBOS. Statistical Abstract 2022; Uganda Bureau of Statistics: Kampala, Uganda, 2022; pp. 1–336. [Google Scholar]
  50. Nakileza, B.R.; Nedala, S. Topographic Influence on Landslides Characteristics and Implication for Risk Management in Upper Manafwa Catchment, Mt Elgon Uganda. Geoenvironmental Disasters 2020, 7, 27. [Google Scholar] [CrossRef]
  51. Hailu, A.; Mammo, S.; Kidane, M. Dynamics of Land Use, Land Cover Change Trend and Its Drivers in Jimma Geneti District, Western Ethiopia. Land Use Policy 2020, 99, 105011. [Google Scholar] [CrossRef]
  52. da Cruz, D.C.; Benayas, J.M.R.; Ferreira, G.C.; Santos, S.R.; Schwartz, G. An Overview of Forest Loss and Restoration in the Brazilian Amazon. New For. 2021, 52, 1–16. [Google Scholar] [CrossRef]
  53. Nakileza, B. Horticulture in Mountain Agro-Ecosystems of Uganda: Environmental and Socio-Economic Threats and Opportunities. J. Agric. Sustain. 2017, 10, 17–33. [Google Scholar]
  54. Oyana, T.J.; Kayendeke, E.; Bamutaze, Y.; Kisanga, D. A Field Assessment of Land Use Systems and Soil Properties at Varied Landscape Positions in a Fragile Ecosystem of Mount Elgon, Uganda. Afr. Geogr. Rev. 2015, 34, 83–103. [Google Scholar] [CrossRef]
  55. Broeckx, J.; Vanmaercke, M.; Duchateau, R.; Poesen, J. A Data-Based Landslide Susceptibility Map of Africa. Earth-Sci. Rev. 2018, 185, 102–121. [Google Scholar] [CrossRef]
  56. Wordofa, M.G.; Okoyo, E.N.; Erkalo, E. Factors Influencing Adoption of Improved Structural Soil and Water Conservation Measures in Eastern Ethiopia. Environ. Syst. Res. 2020, 9, 13. [Google Scholar] [CrossRef]
  57. Sileshi, M.; Kadigi, R.; Mutabazi, K.; Sieber, S. Determinants for Adoption of Physical Soil and Water Conservation Measures by Smallholder Farmers in Ethiopia. Int. Soil Water Conserv. Res. 2019, 7, 354–361. [Google Scholar] [CrossRef]
Figure 1. Location of the study area and land use within the upper Manafwa watershed. The drone activities were conducted in the six study sites along the park boundary and in the community land (pink squares).
Land 13 00001 g001
Figure 2. Photographic representation of the study area: (a) land utilization at the proxy of the Mount Elgon National Park and (b) landslide scar extent that occurred in 2021, affecting community livelihoods in the study area.
Land 13 00001 g002
Figure 3. Overall methodological workflow of household survey and drone-based data collection and processing procedures used in this study.
Land 13 00001 g003
Figure 4. Delineated and processed orthomosaic images of study sites in Nakhatoore (a,b) and Ibookho (c,d) showing the nature of land utilization and degradation (landslide and park encroachment) in 2020 (a,c) and 2022 (b,d). The hatched part in (c,d) is the conservation area (MENP).
Land 13 00001 g004
Figure 5. Land use changes in the period 2020–2023, based on drone image classification and analysis for the six study sites in the study area, with each site covering an area of approximately 500 by 500 m.
Land 13 00001 g005
Figure 6. The land use maps for the period 2020–2023 in the six selected sites based on drone image classification and analysis within the study area.
Land 13 00001 g006
Figure 7. Natural forest resources extracted from the park (MENP) by the communities within the study area. Bamboo shoots are intensively used for making a traditional dish locally known as “Malewa” and is consumed in East Africa.
Land 13 00001 g007
Figure 8. The number of homesteads per square kilometre (km2) within the study sites from 2020 to 2023, based on drone image classification and analysis.
Land 13 00001 g008
Figure 9. The farmland area (hectares) with trenches (a) and number of trenches (b) on farmland based on drone image analysis.
Land 13 00001 g009
Table 1. Land use land-cover types and descriptions.
LULC ClassDescription
Built-Up areaAreas with buildings and artificially paved surfaces including rural and urban residential and service areas, transportation and communication routes.
AgricultureLand area under subsistence farming of perennial and/or annual crops, especially banana–coffee (Musa spp-Coffea canephora) plantations throughout the year, with scattered fruit trees and intercropping of annual crops like beans, maize, and vegetables, with reduced cover after crop harvest.
Planted forestForests of planted broad-leaved woody trees and/or evergreen needle-shaped leaved trees with top-layer trees <65% cover. Undergrowth of small trees, shrubs, and grasslands exists.
BushlandNatural and/or human-planted vegetation dominated by shrubs and thickets intermixed with bunches of grasses as an entity, but not exceeding an average height of 4 meters.
GrasslandNatural or human-planted extensively used grasslands, but not exceeding an average height of 0.5 m, with or without farm structures like shelters, enclosures, and watering places.
Bare rock and surfacesExposed rocks and the vegetation cover never exceeds 5% during any time of the year and stony (≥40%). Includes rock outcrops, accumulation of rock without vegetation, and active erosion surfaces.
Tropical high forestPrimary mixed natural forest (intact and/or degraded) with indigenous trees, top-layer trees’ ≥20% canopy cover. Second layer mixed with shrubs and bush, an annual cycle of leaf-on and leaf-off periods for degraded areas, whereas broadleaf trees remain green all year with green canopy foliage.
Open WaterAll forms of water surfaces represented by line features (rivers, streams, and tributaries) and area features, especially man-made reservoirs of water for irrigation and flood control.
Adopted from Opedes et al. [24].
Table 2. Household demographic and socio-economic characteristics of respondents interviewed in the study area (N = 499).
Household Attributes (Units)ValueStd. Dev.MinMax
Gender (male, %)62.00
Age group (31–64 years, %)73.00
Migration Status (native, %)44.20
Mean household size (no)7.013.051.0018.00
Land tenure system (Customary land, %)50.50
Mean land size (acre) *2.081.900.2520.00
Education level (primary, %)60.72
Main Occupation (subsistence farming, %)99.00
Mean income (≤USD415/year, %) **45.80272.3028.172140.85
Main energy source for cooking (fuelwood, %)100.00
Major cooking stove (three-stones open fire, %)66.90
* 1 acre = 0.4 hectares; ** Forex rate as of May, 2021: USD1 = UGX 3550 (BoU, 2023).
Table 3. Perceived prevalent forms of land degradation and soil erosion processes in the study area.
Land DegradationFrequencyPercentageSoil ErosionFrequencyPercentage
Riverbank erosion897.21Gullies21320.60
Soil erosion41633.71Rills35734.53
Landslides19215.56Sheetwash20119.44
Offsite degradation231.86Rain splash25824.95
Surface crusting453.65Pediments50.48
Vegetation cover decline15612.64Total1034100
Flash floods and flooding917.37
Loss of organic matter21917.75
Other forms30.24
Total1234100
Table 4. The encroached area and rate of encroachment into the park (MENP) within the selected study sites from 2020 to 2023.
Encroached Park Area (Hectares) *Annual Rate of Change (Percentage)
Study Sites20202021202220232020–20212021–20222022–2023
2. Ibookho4.044.805.546.5918.8515.3618.98
3. Muranga1.072.292.854.42114.6324.3655.21
6. Shiteka2.633.134.214.1518.8034.62−1.35
* Encroachment by agriculture and built-up into the primary forest (MENP) based on drone image classification and analysis.
Table 5. Perceptions on the most adopted soil and water conservation measures against land degradation in the study area.
Adopted Soil and Water Conservation (SWC) Measures *FrequencyPercentage
Vegetation/soil cover37020.65
Organic matter/soil fertility25013.95
Soil surface treatment1528.48
Subsurface treatment251.40
Tree and shrub cover21612.05
Grasses and perennial herbaceous plants22512.56
Clearing part of the vegetation864.80
Bench terraces1488.26
Bunds 362.01
Graded ditches and waterways311.73
Soil surface treatment1136.31
Major change in timing of activities372.06
Control/change in species composition633.52
Other measures 22.23
Total1754100
* based on the household survey (n = 499) and WOCAT subcategories of sustainable land management technologies [50].
Table 6. Area coverage and annual rate of change for the tree plantations and the intact forest (MENP) in the selected study sites.
Study SitesArea (Hectares)Annual Rate of Change (Percentage)
Forest *20202021202220232020–20212021–20222022–2023
2. Ibookho2.361.731.230.97−26.87−29.13−20.49
3. Muranga3.542.470.490.26−30.12−80.15−46.66
6. Shiteka17.1816.3615.4215.54−4.76−5.720.73
Tree plantations **
1 Elgon0.630.671.181.42−7.466.0639.74
2. Ibookho1.491.381.462.047.0174.9520.81
3. Muranga0.980.991.171.811.2318.2154.64
4. Nabyoko2.332.552.483.399.46−2.6436.51
5. Nakhatore1.441.720.630.6219.75−63.56−1.74
6. Shiteka0.320.460.891.3842.0492.1156.16
* Forest (Mount Elgon National Park) and ** planted trees within the community land based on drone image classification and analysis in the six study sites.
Disclaimer/Publisher’s Note: The statements, opinions and data contained in all publications are solely those of the individual author(s) and contributor(s) and not of MDPI and/or the editor(s). MDPI and/or the editor(s) disclaim responsibility for any injury to people or property resulting from any ideas, methods, instructions or products referred to in the content.

