Article

Simulated Runoff and Erosion on Soils from Wheat Agroecosystems with Different Water Management Systems, Iran

by
Saeed Sharafi
1,
Mehdi Mohammadi Ghaleni
2 and
Deirdre Dragovich
3,*
1
Department of Environment Science and Engineering, Arak University, Arak 38156879, Iran
2
Department of Water Science and Engineering, Arak University, Arak 38156879, Iran
3
School of Geosciences, The University of Sydney, Sydney, NSW 2050, Australia
*
Author to whom correspondence should be addressed.
Land 2023, 12(9), 1790; https://doi.org/10.3390/land12091790
Submission received: 16 August 2023 / Revised: 12 September 2023 / Accepted: 13 September 2023 / Published: 15 September 2023

Abstract

:
In developing countries, the demand for food has increased with significant increases in population. Greater demands are therefore being placed on the agricultural sector to increase production. This has led to increased soil erosion, especially in arid and semi-arid regions. The aim of this study was to simulate runoff and erosion on soils of three different wheat agroecosystems (rainfed farming, traditional irrigation, and industrial irrigation systems). The effect of variations in soil texture, slopes (1, 3 and 5%) and rainfall intensity (10, 25 and 40 mm h−1) on runoff volume, runoff coefficient, sediment concentrations, and sediment loss (soil erosion) were recorded for soils from each management system. Soil chemical properties (pH, EC) and organic matter were not significantly related to soil erosion. Analysis of variance showed significant differences in soil erosion and runoff coefficients when slopes were increased from 1 to 5 percent. The highest soil erosion was recorded on a slope of 5% with a rainfall intensity of 40 mm h−1, and the lowest on a slope of 1% with a rainfall intensity of 10 mm h−1. Of the three management systems, the highest runoff volume, runoff coefficient, sediment concentration and soil erosion occurred on soils from the traditional irrigation treatment, with a soil texture of sandy loam, slopes of 5% and rainfall intensity of 40 mm h−1. Results of the study indicated that the influence of slope and rainfall intensity on runoff volume, runoff coefficient, sediment concentration and soil erosion varies with soil texture and agroecosystem. These results can be usefully applied to agricultural land use planning and water management systems for reducing soil erosion at regional and on-farm levels.

1. Introduction

Land use changes and improper management practices in agriculture have a large effect on soil properties [1,2], including soil erodibility. Soil erosion is a common threat especially in unsustainable agroecosystems in arid regions, where rainfall has key role in meeting the water needs of crops [3,4] which can utilize water stored within the upper 30 cm in the soil profile [5,6]. Although infiltration capacity on arable lands is very high with vegetation coverage, on bare land (fallow rotation) water entering the soil reduces steadily with increasing cumulative rainfall [7] and with higher intensity falls. When infiltration rates are lower than rainfall intensity, surplus water either contributes to runoff or is temporarily ponded in surface depressions, thus further increasing the amount of subsequent surface runoff [8]. However, complex relationships exist between runoff volume, degree of surface cover, sediment availability, and quantities of soil eroded [9], and recording and quantifying these processes in the field can present problems [10]. Soil erosion modelling can be applied using incomplete field data, although the value of this approach depends on the predictive capacity of models estimating erosion and the factors influencing it [11,12]. Some researchers have endorsed the use of the Universal Soil Loss Equation (USLE) [13,14], while others point to the disadvantage of USLE which over-estimates the amount of soil erosion relative to observed values [15,16].
An alternative to field-based modelling has been the adoption of laboratory simulations of the main factors involved in the Universal Soil Loss Equation (USLE) and its revised version (RUSLE). The factors in the equation—rainfall amount and intensity, slope angle and length, soil erodibility, conservation measures, and land use/cover—can be varied independently or in combination. Evaluating the effects of rainfall is possible using a rainfall simulator, for example, [10,17,18]. The most important advantages of rain simulation are speed in operation, efficiency, controllability and more flexibility than natural rainfall [19]. Rainfall simulation can be used to quantify runoff and sediment losses in the field, and these have shown similar results to those obtained in laboratory conditions [20].
Research on the use of rainfall simulation has included the study of runoff volume and sediment concentrations in different climatic conditions [10], the effects of land use change [21], differences in the structure of topsoil such as soil closure [22], the investigation of mine reclamation with emphasis on erosion sensitivity and for parametrization of erosion models [23], and the examination of changes in soil properties due to rainfall in arable lands [24]. Laboratory and some field studies involving rainfall simulation have been carried out using rainfall intensities between 14 and 148 mm h−1 [10,25,26,27], on slopes of 5% or more [28,29], and employing various combinations of rainfall, slopes, geology, land cover, and surface roughness [20,28].
Runoff and sediment concentration have generally been found to increase with increasing rainfall intensity and slope steepness, but the investigation of extreme physical conditions may produce exceptional results. On steep colluvial deposits, soil erosion and runoff volume have been noted to increase with rainfall intensity up to critical slope gradients of 47 and 58 percent, respectively [30]; and Lin et al. [31] also reported that sediment concentration increased with increasing slope and flow discharge. However, Liu et al. [32] conducted a field rainfall simulation experiment on colluvial deposits with 40–48 percent gradients and observed a negative correlation between slope gradient and runoff flow. The runoff-sediment relations and erosional processes noted on such steep slopes may not be replicated on the gentler slopes characteristic of wheat agroecosystems which are, in addition, likely to have different soil textures and water management, including irrigation in arid-semiarid lands. As well as slope steepness and rainfall intensity, runoff is influenced by geology [28], soil properties [33], crust formation and persistence [26], and amounts of crop residue [29]. An investigation by Mayerhofer et al. [34] also found that the runoff coefficient depended substantially on vegetation cover and the level of soil moisture prior to precipitation. Sediment concentration can be further affected by soil surface roughness on different slopes [20] and by surface crusts [26]. Using rainfall simulators for five rainfall intensities (14, 21, 30, 36 and 45 mm h−1) and slopes of 5, 9 and 12 percent, Salem and Meselhy [27] reported that sediment concentration and runoff coefficients were significantly different for different rainfall intensities and slopes.
The key variables influencing runoff and soil erosion are thus well known and have been intensely investigated both in the field and in laboratory settings. However, few studies have focused on simulating runoff and soil erosion for a single form of land use in which different modes of water (irrigation) management have been applied. Therefore the main objective of this study was to investigate potential soil erosion and runoff under different water management systems, using controlled laboratory simulations for varying rainfall intensities, slopes, and soil textures. Water management practices employed in wheat agroecosystems used three different systems: rainfed farming, traditional irrigation, and industrial (modern) irrigation. The parameters of each potential erosional variable investigated—rainfall intensity, slope angle, and soil texture—were either measured (slope angle and soil texture) or evaluated for representativeness of field conditions (rainfall intensity) and incorporated into simulations.

2. Materials and Methods

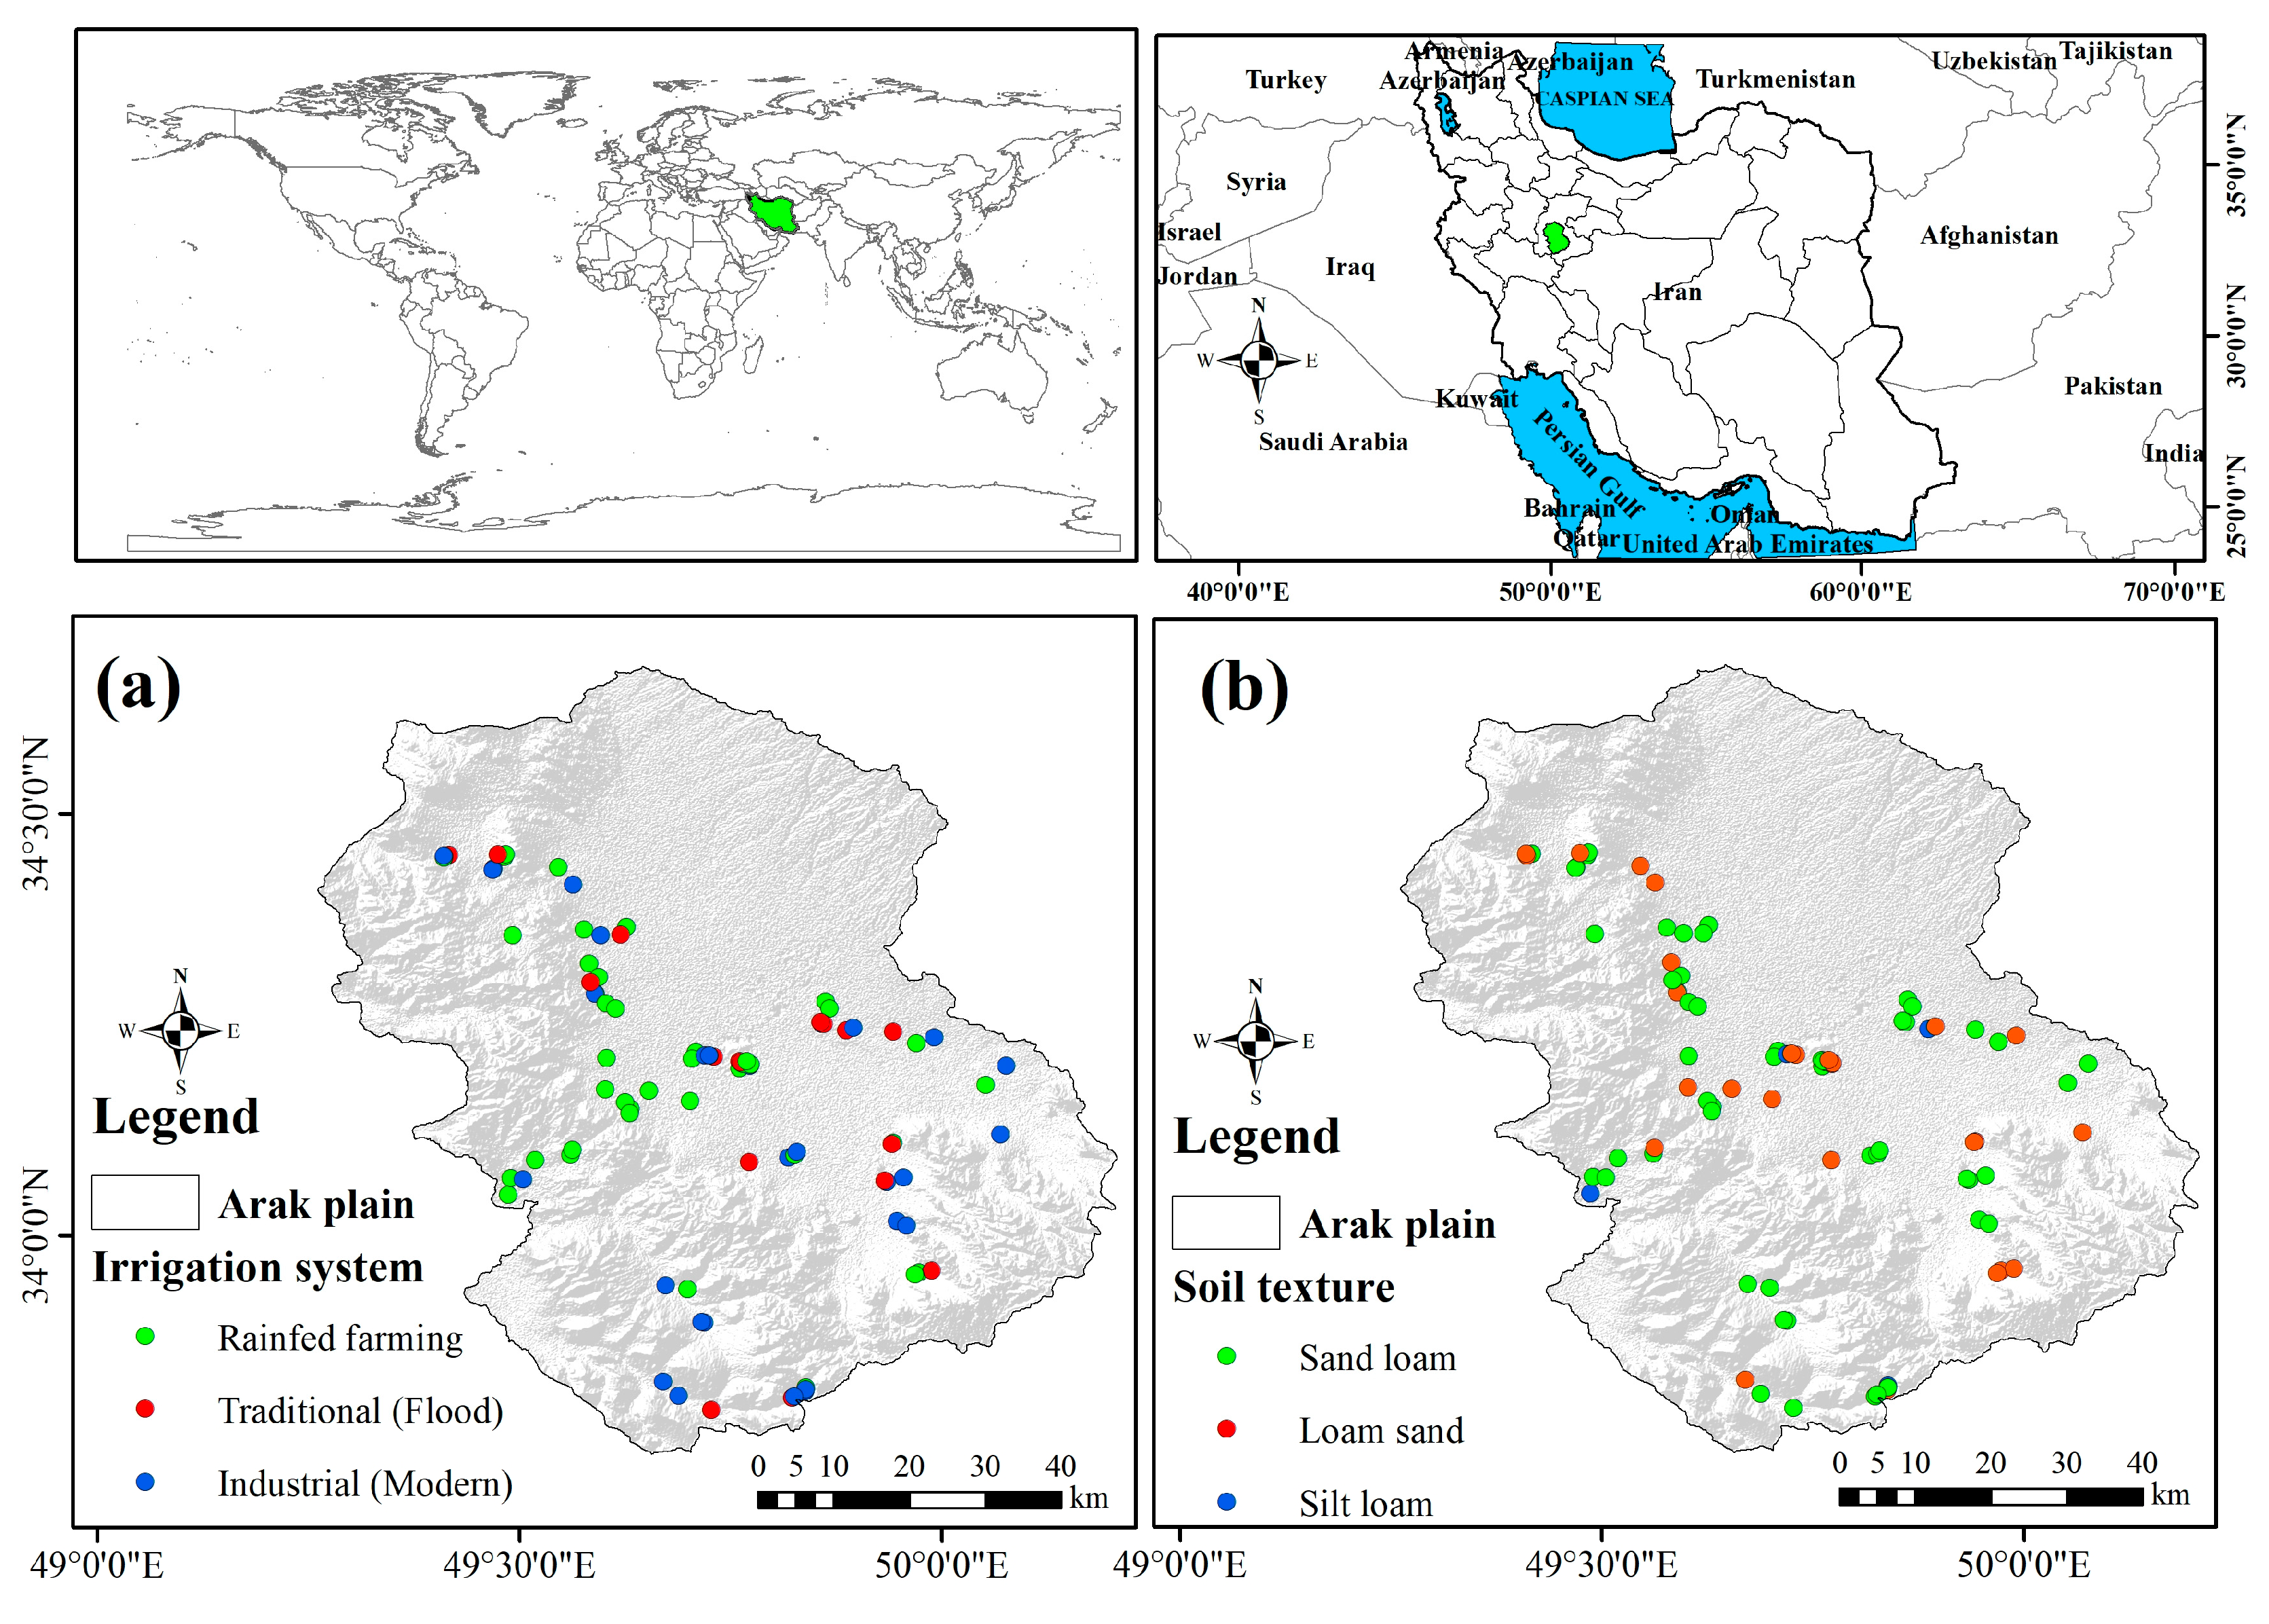
2.1. Study Area and Soil Analysis

This study was undertaken in a semiarid region located at longitude 49.42 °N and latitude 34.06 °E and covering approximately 107 km2. The mean monthly temperatures (Tmin and Tmax) were 6.9 and 20.6 °C respectively. Mean annual precipitation and reference evapotranspiration (ETref) in the same period (1951–2021) were 307.6 and 2035.7 mm, respectively [35]. The spatial differences of mean temperatures (16.65 °C for Tmean) and precipitation (1107 mm per year) showed the climatic diversity in this semiarid region [36]. Annual precipitation declined from approximately 610 mm to less than 190 mm across the region, with respective annual average ETref ranging between 1048 mm and 1527 mm [35].
Geology is relatively uniform, with basalt rocks of the Eocene period (dark gray basalt, trachybasalt and basalt andesite) [37]. The slope, direction and altitude maps of the region were compiled using a Digital Elevation Model (DEM) [8,38]. Soil samples were collected from 158 wheat farms, of which 31 were rainfed farms, 53 farms were under traditional irrigation management, and 74 farms were managed using industrial (modern) irrigation methods. All farms cultivated winter wheat as the sole crop (i.e., a monoculture cropping system), with planting from late September and harvesting in late June. Rainfed farms relied solely on rainfall; traditional irrigation methods involved flood, strip and furrow irrigation; and industrial irrigation methods included large-scale center pivot, gun coil, or trickle irrigation techniques. Only farms having slopes of 1%, 3% or 5% were included in the sample as those were the slopes to be used in laboratory simulations.
Soil samples were collected using a 10-cm diameter auger to a depth of 30 cm, and three replicate samples were collected for each farm (a total of 474 samples). After returning samples to the laboratory, coarse materials were removed by passing each sample through a 2 mm sieve after air drying at 105 °C for 24 h. Tests were then performed to determine soil texture by the hydrometer method; a saturated extract was prepared for recording pH and EC [39]. Organic matter (OM) determination was based on the Walkley-Black method, and Calcium Carbonate Equivalent (CCE) was determined using 6N hydrochloric acid by the calcimetric method [40].
To determine soil texture, sand particles were first separated by sieving using a 270-mesh screen [41,42]. The hydrometer sedimentation method [43] was used to determine the clay and silt fractions. However, this method may not measure a portion of water-soluble organic carbon, but since soil-soluble organic matter contains only a small fraction of soil organic matter (less than one percent carbon) [44], it will have little effect on the test results. Soil textures were classified according to the Soil Survey Staff [45]. From these results, the three soil textures of sandy loam, loamy sand and silty loam were found to be dominant in the study region (Figure 1).

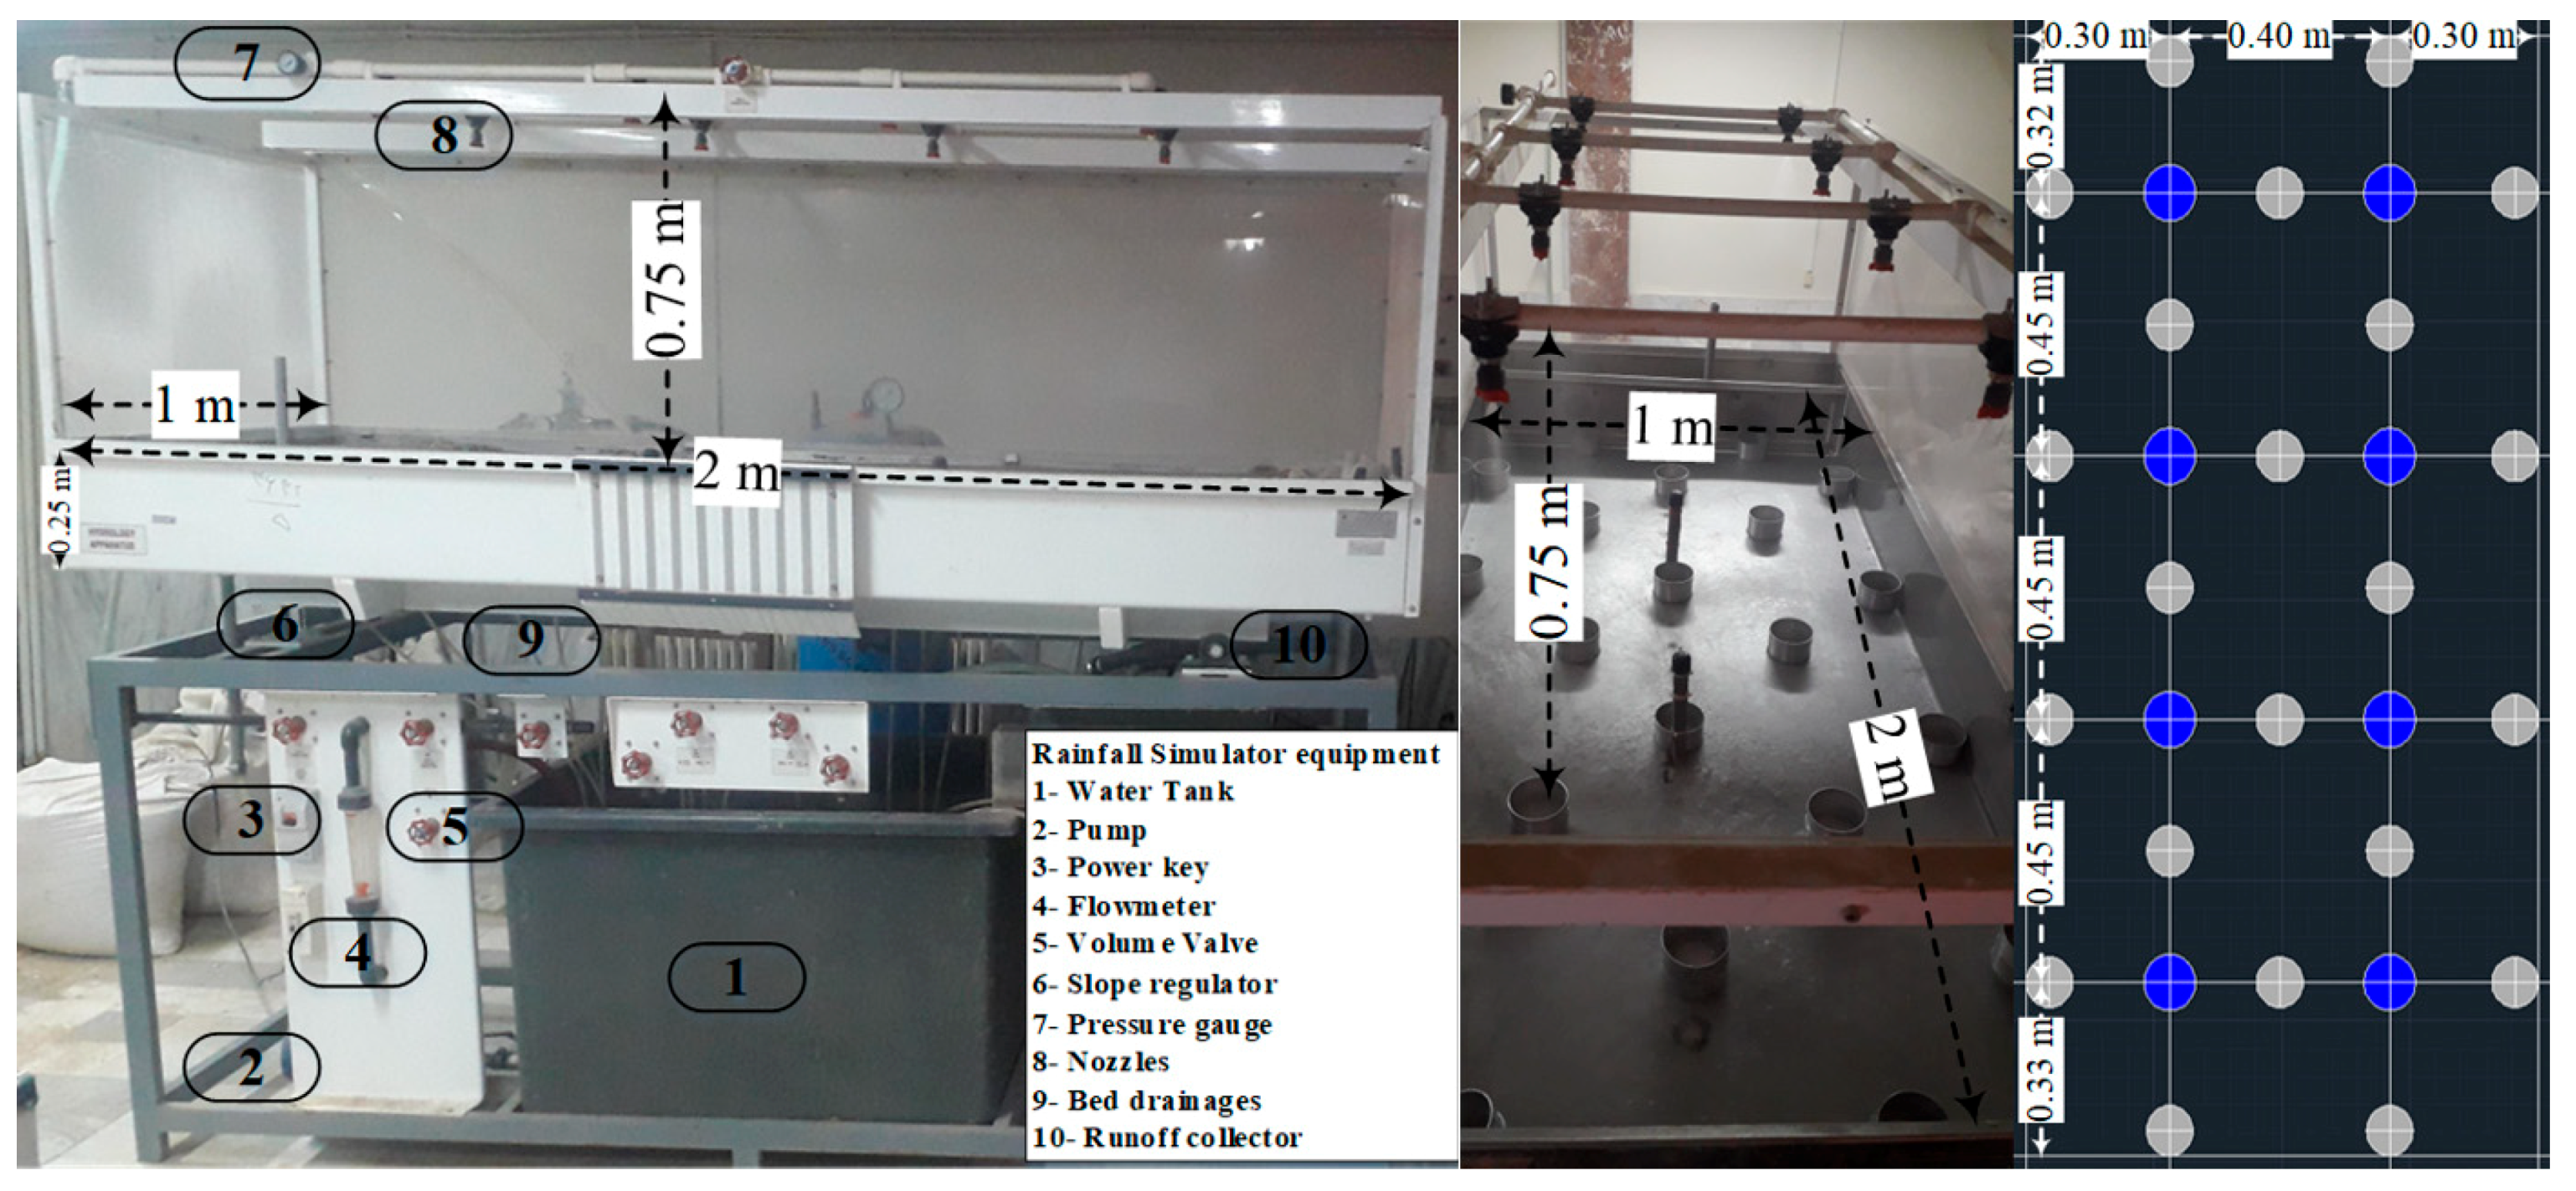
2.2. Rainfall Simulator

The rainfall simulator used in this research was from the equipment of Arak University Hydrology Laboratory (Figure 2). The water reservoir of the rainfall simulator has dimensions of 1 m × 0.75 m × 0.60 m with a volume of 450 L. The pump used was the Italian Stream model SQB70 (559.3 W) which had a maximum flow rate of 45 L. Based on the flow meter installed in the water flow path and using the flow control valves, the system can be adjusted from about 5 to 20 L per minute.
Slope adjustment in the rainfall simulator can be managed using two manual levers with the ability to change the height up to 0.10 m. The pressure gauge was calibrated 10 times at the beginning of the flow. Rainfall was simulated using the 8 sprayers of the QPHA3.5 Promex model with aperture diameter of 1.6 mm and a flow rate of about 2.6 L per minute at 3 pressures. In order to drain the water from deep infiltration, 20 holes with a diameter of 10 mm were installed in the bottom of the precipitation area. This directed infiltrated water to the reservoir by pipes (Figure 2). Surface runoff from the precipitation was collected by a collector at the end of the precipitation range and was directed by a pipe to the runoff measuring container.
One of the most important characteristics of natural rainfall is uniformity of spray. In the present study, the uniformity of rainfall simulated at different intensities was measured using the coefficient of Christensen. Figure 2 shows the setup for measuring this coefficient. The Christiansen Uniformity coefficient (CUc) was measured using 22 circular containers with a diameter of 8.5 cm. After measuring the amount of water collected in these containers using Equation (1), the values of the spray uniformity coefficient in 3 rainfalls with different intensities were calculated:
C U c = 1 i = 1 n R i M n M
where CUc (%) is the coefficient of uniformity of Christiansen dispersion as a percentage; Ri (mm) is the volume of water collected in vessel ith; M (mm) is the average volume of water collected in the 22 measuring vessels; and n is the total number of measuring vessels. Before the simulation experiments commenced, adjustments were made to the rainfall simulator until the CUc values exceeded 80%. For the three rainfall intensities of 10, 25 and 40 mm h−1, CUc values were 98, 94 and 86%, respectively.

2.3. Experiment Method

Experiments were performed by simulating three different dominant rainfall intensities (10, 25 and 40 mm h−1) on saturated soil samples on three slopes of 1, 3 and 5 percent with three replications (474 experiments). The levels of rainfall intensity were selected based on a review of literature sources and the intensity of actual rainfall occurring in many arid regions, including in the study area. Although rainfall intensities are described differently in different climates, precipitation at a rate of 10 mm h−1 is classed as moderate to heavy [46] or heavy to very heavy [47]; at 25 mm h−1 as heavy [46] or “shower” [47]; and at 40 mm h−1 as heavy [46] or “cloudburst” [47]. All simulated rainfalls in this study were therefore classed as heavy to very heavy and would generate runoff. For each replication, the parameters of runoff volume, soil sediment weight, sediment concentration and runoff coefficient were measured. In order to create deep penetration flow, a 5 cm layer of coarse sand was poured on the bed of the precipitation plate to create a drainage layer which facilitated deep penetration flow.
In each replication of the experiment, 1.5 L samples from the outlet drain of the rainfall simulator were prepared to determine the weight of soil sediment and sediment concentration. After passing this volume through Whatman 42 filter paper, the samples were placed in an oven at 105 °C for 24 h and the weight of soil sediment was calculated by weighing [48]. By dividing the weight of soil loss by the sample volume, the sediment concentration was calculated at each replication of the experiment. In order to calculate the runoff coefficient, the volume of runoff output was divided by the volume of simulated rainfall and expressed as a percentage.

2.4. Data Analysis

After conducting laboratory studies and measuring the parameters of runoff volume, soil sediment weight, sediment concentration and runoff coefficient in each replication of the experiment, SPSS/23 software was used for statistical analysis. In the first stage, the Kolmogorov-Smirnov test was used at the 5% level to check for normality of the data [49]. Analysis of variance in the complete factorial method based on complete randomized design (CRD) was applied to the results for the three water management methods (rainfed farming, traditional irrigation and industrial irrigation), rainfall at three intensities (10, 25, and 40 mm h−1), and slope percentage at three levels (1, 3 and 5%). Means were compared using Duncan’s multiple range test at the 5% level, with correlation analysis. Multilinear regression was applied for soil erosion as a function of slope gradient and rainfall intensity.

3. Results

3.1. Soil Characteristics

Soils of the study area were classified as aridisols and inceptisols, and most of the soil samples collected were sandy loams (52%) or loamy sands (29%), with 19% being silty loams (Table 1). Overall, most farms (44%) were located on moderate slopes of 3%, but the proportion of rainfed cropping farms was the highest (45%) on the steepest mean slopes of 5%.
The measured pH of the saturated extract in all the studied samples was in the neutral range of pH 7.7 to 7.78 and EC values ranged from a minimum of 581 μS cm−1 in the Bk horizon of farms with traditional and modern irrigation systems up to 624 μS cm−1 in the Bk horizon of rainfed fields (Figure 3). The wide variation in EC values on rainfed farms indicates the presence of some previously irrigated fields, now salinized, and currently used for rainfed cropping.
The amount of OM in all three soil textures and under different water managements was highest in the soil surface horizons and decreased with increasing depth. However, OM contents were consistently low, with all soil samples recording values of <0.25% (Figure 3). Variations in particle size distribution within each texture class were examined. Sand was generally the dominant particle size in the study area, but in silty loam textures the amounts of sand and silt were almost equal. The percentage of sand, silt and clay in sampled soils was correlated separately with total OM and results showed that the amount of OM was positively and significantly related to the percentage of silt (R2 = 0.51).

3.2. Combined Analysis of Simulated Variables

Results from the Kolmogorov-Smirnov test showed that the data on runoff volume, runoff coefficient, sediment concentration and soil erosion were normal for all treatments at a significance level of five percent. The results of combined analysis showed that the effect of different treatments and the effect of their interaction on runoff volume (mL), runoff coefficient (%), sediment concentration (g L−1) and soil erosion (g) were significant. Table 2 indicates the significance of all measured parameters for different irrigation management treatments (rainfed, traditional irrigation and industrial irrigation), soil textures, slopes and rainfall intensities and their interactions at a significance level of 5% for runoff volume and runoff coefficient, and a significance level of 1% for sediment concentration and soil erosion.

3.3. Correlation Analysis of Simulated Variables

The results of Pearson’s correlation coefficients showed that a significant positive correlation was obtained between runoff volume and the runoff coefficient (0.78 **) and soil erosion (0.47 **), and a significant negative correlation with sediment concentration (−0.89 **), pH (−0.4 **), and OM (−0.55 **) (Table 3). The runoff coefficient had a positive correlation with sediment concentration (0.33 *) and runoff volume had a negative correlation with pH (−0.31 *). The highest correlation was obtained between sediment concentration and soil erosion (0.96 **). Sediment concentration also had a significant negative relationship with runoff volume (−0.89 **) and a significant positive association with organic matter (0.28 *). However, soil erosion did not show any dependence on individual factors such as pH, EC, and OM. The correlation analysis also showed that the relationship between soil erosion and the runoff coefficient was not significant.

Multilinear Regression
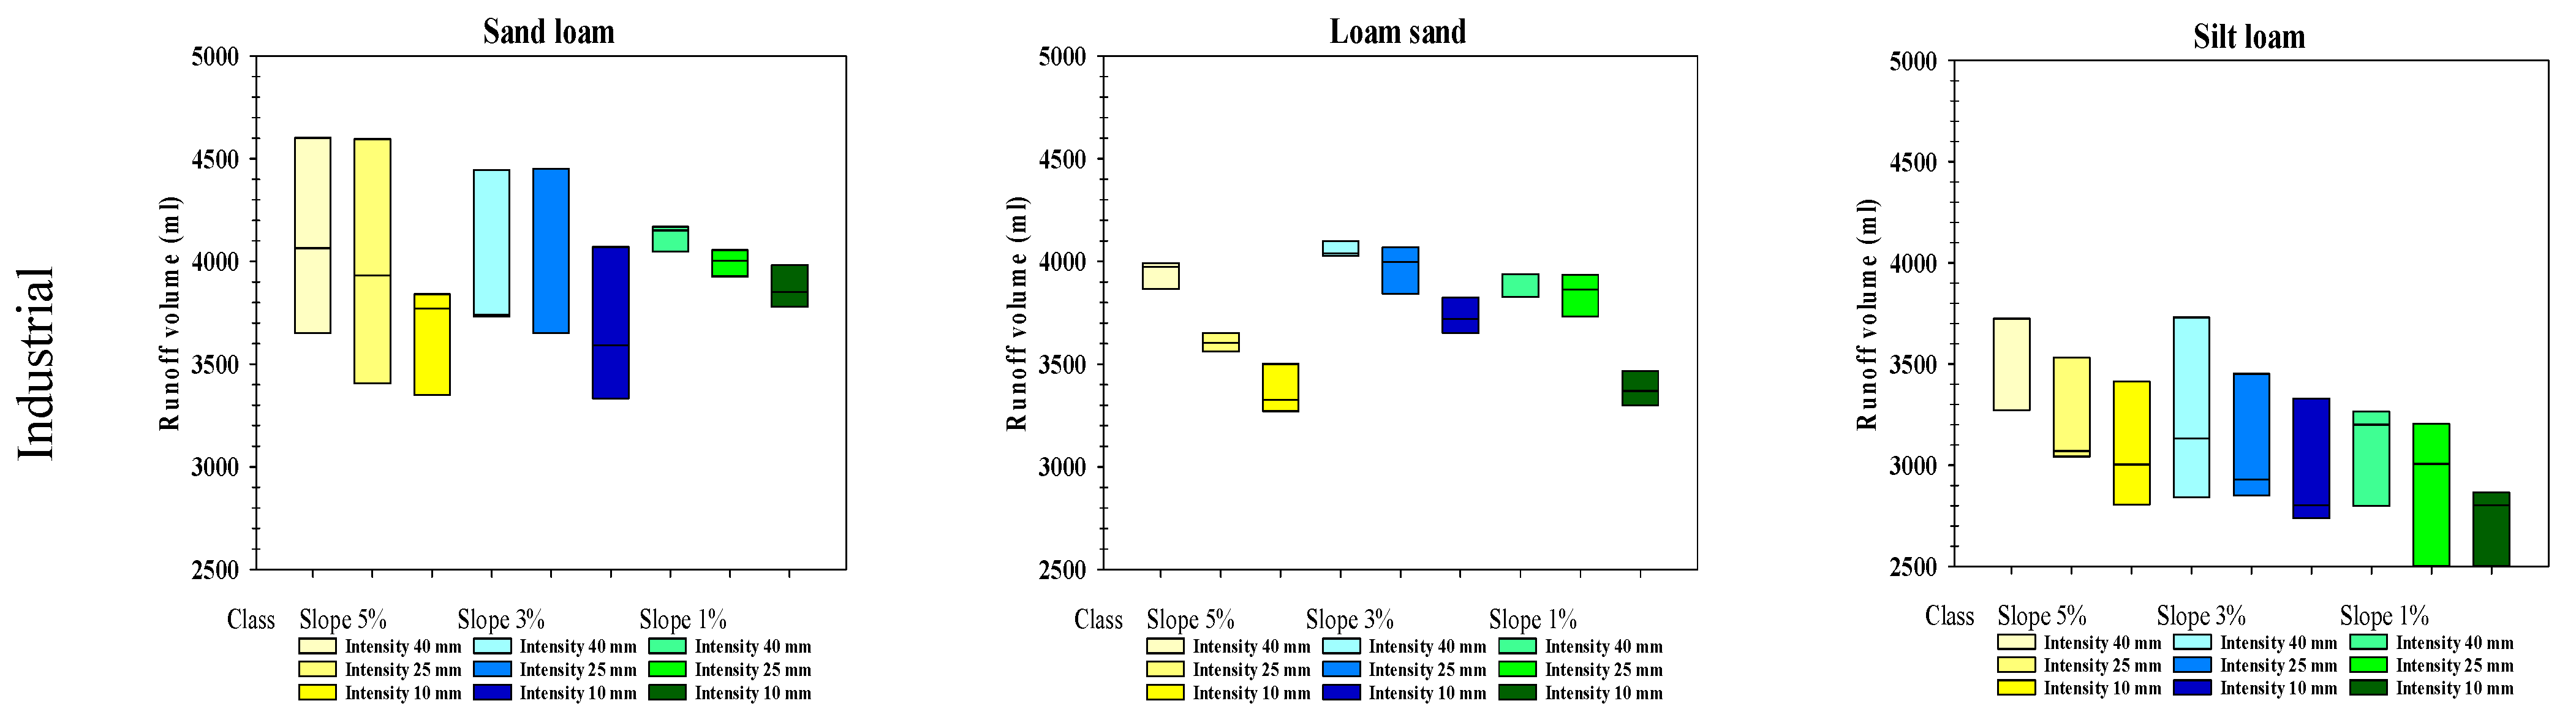
The influence of rainfall intensity and slope on soil erosion for the different farm types and soil textures is presented as a series of multiple regressions in Table 4. Soil erosion was least related to slope gradient and rainfall intensity on farms with silty loam soils and having traditional (0.40 n.s) and industrial (0.60 n.s) water management systems. In general, erosion on the loamy sands of all farm types was best correlated to the slope and rainfall intensity variables. As the experiments tested slope gradient and rainfall intensity at three fixed non-continuous levels, the overall predictive ability of these equations needs to be treated with caution.

3.4. Runoff Volume

Detailed results are presented in Figure 4 for the relationships between runoff volume, rainfall intensity, slope gradient and soil texture in different water management systems. Based on the results of this study, the highest runoff volume of 3869.8 mL was reported for soils from farms with traditional irrigation management, a volume which was 6.58 and 7.42 percent more than rainfed farming and industrial irrigation, respectively. In the study of soil texture results, the highest runoff volume was recorded for sandy loam (3984.9 mL) which was 6.68 and 15.59 percent greater than for loamy sand and silty loam textures, respectively. The highest runoff volume (3869.8 mL) was reported on the 5% slope, and this volume was 5.61 and 3.99 percent more than on the 1% and 3% slopes, respectively. For different rainfall intensities, the highest runoff volume was obtained for the 40 mm h−1 treatment (3905 mL), which compared to the rainfall intensities of 10 and 25 mm h−1 was 11.24 and 5.32 percent, respectively, greater. Overall, the highest runoff volume occurred for those sandy loam soils from the traditional irrigation treatment on slopes of 5% and rainfall intensity of 40 mm h−1.

3.5. Runoff Coefficient

Detailed results are presented in Figure 5 for the relationships of rainfall intensity, runoff coefficient, slope gradient and soil texture in different water management systems. The highest overall runoff coefficient of 77.57% was reported in the traditional irrigation treatment, a value which was 4.48 and 5.64 percent greater than for rainfed farming and industrial irrigation, respectively. Considering soil texture results, the highest average runoff coefficient was observed for sandy loams (78.71%), which was 3.3 and 11.02 percent greater than for loamy sand and silty loam textures, respectively. For the slope variable, the 5% slope recorded a runoff coefficient of 76.59% which was 2.55 and 3.86 percent higher than the 3% and 1% slopes, respectively. For different rainfall intensities, it was found that the highest runoff coefficient was obtained for the 40 mm h−1 treatment (53.25%), compared to the rainfall intensity treatments of 25 and 10 mm h−1 which showed a decrease of 14.76 and 42.52 percent, respectively. It seems that the runoff coefficient had a direct relationship with land slope and rainfall intensity, but was not significantly affected by the water management system or soil texture. In aggregate, the highest runoff coefficient occurred on slopes of 5% and rainfall intensity of 40 mm h−1.

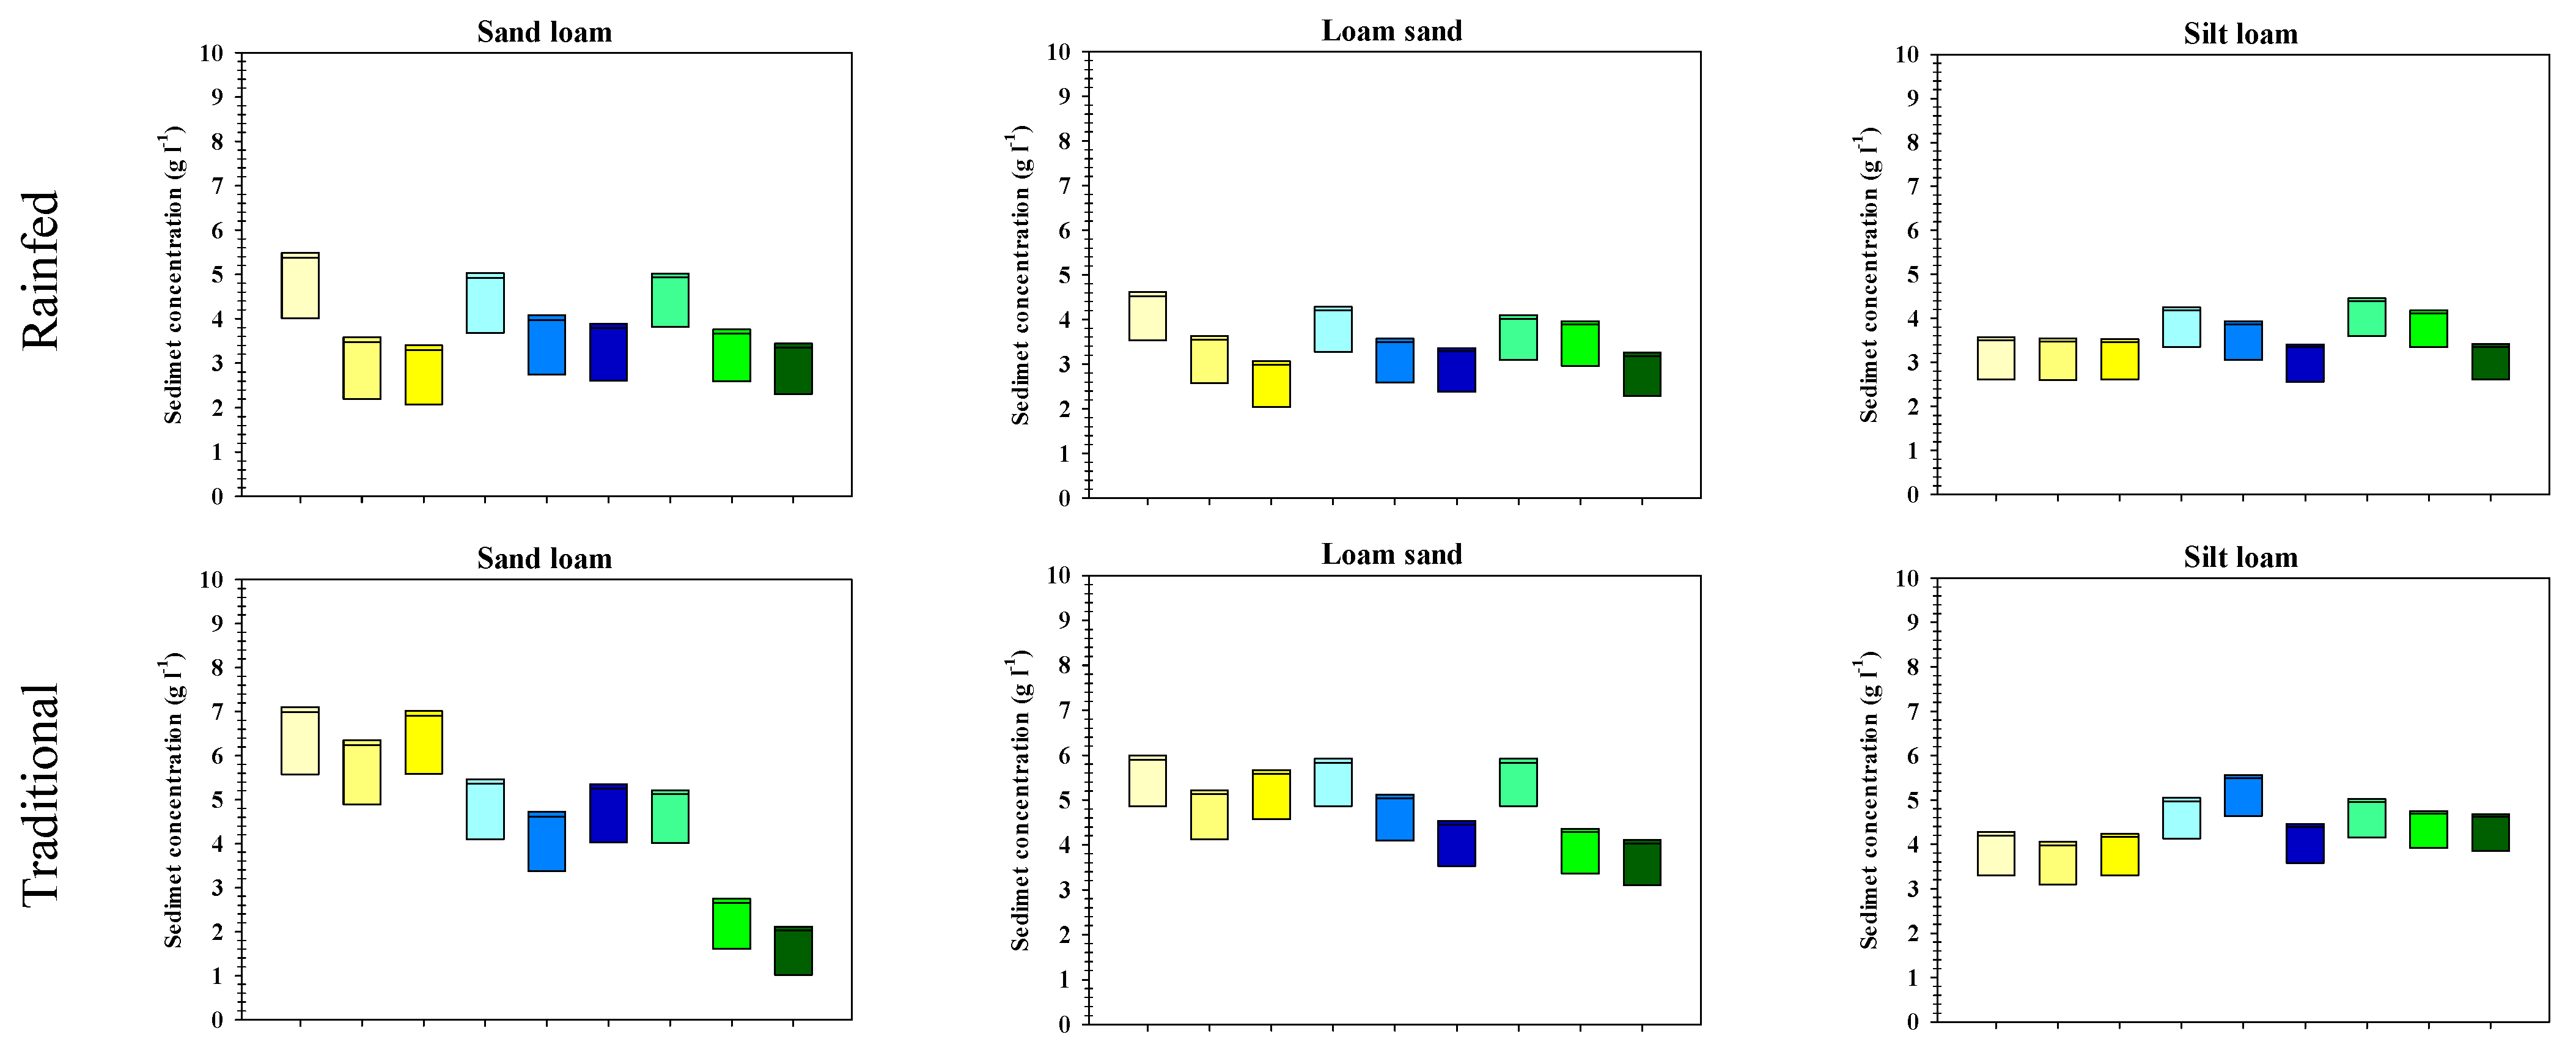
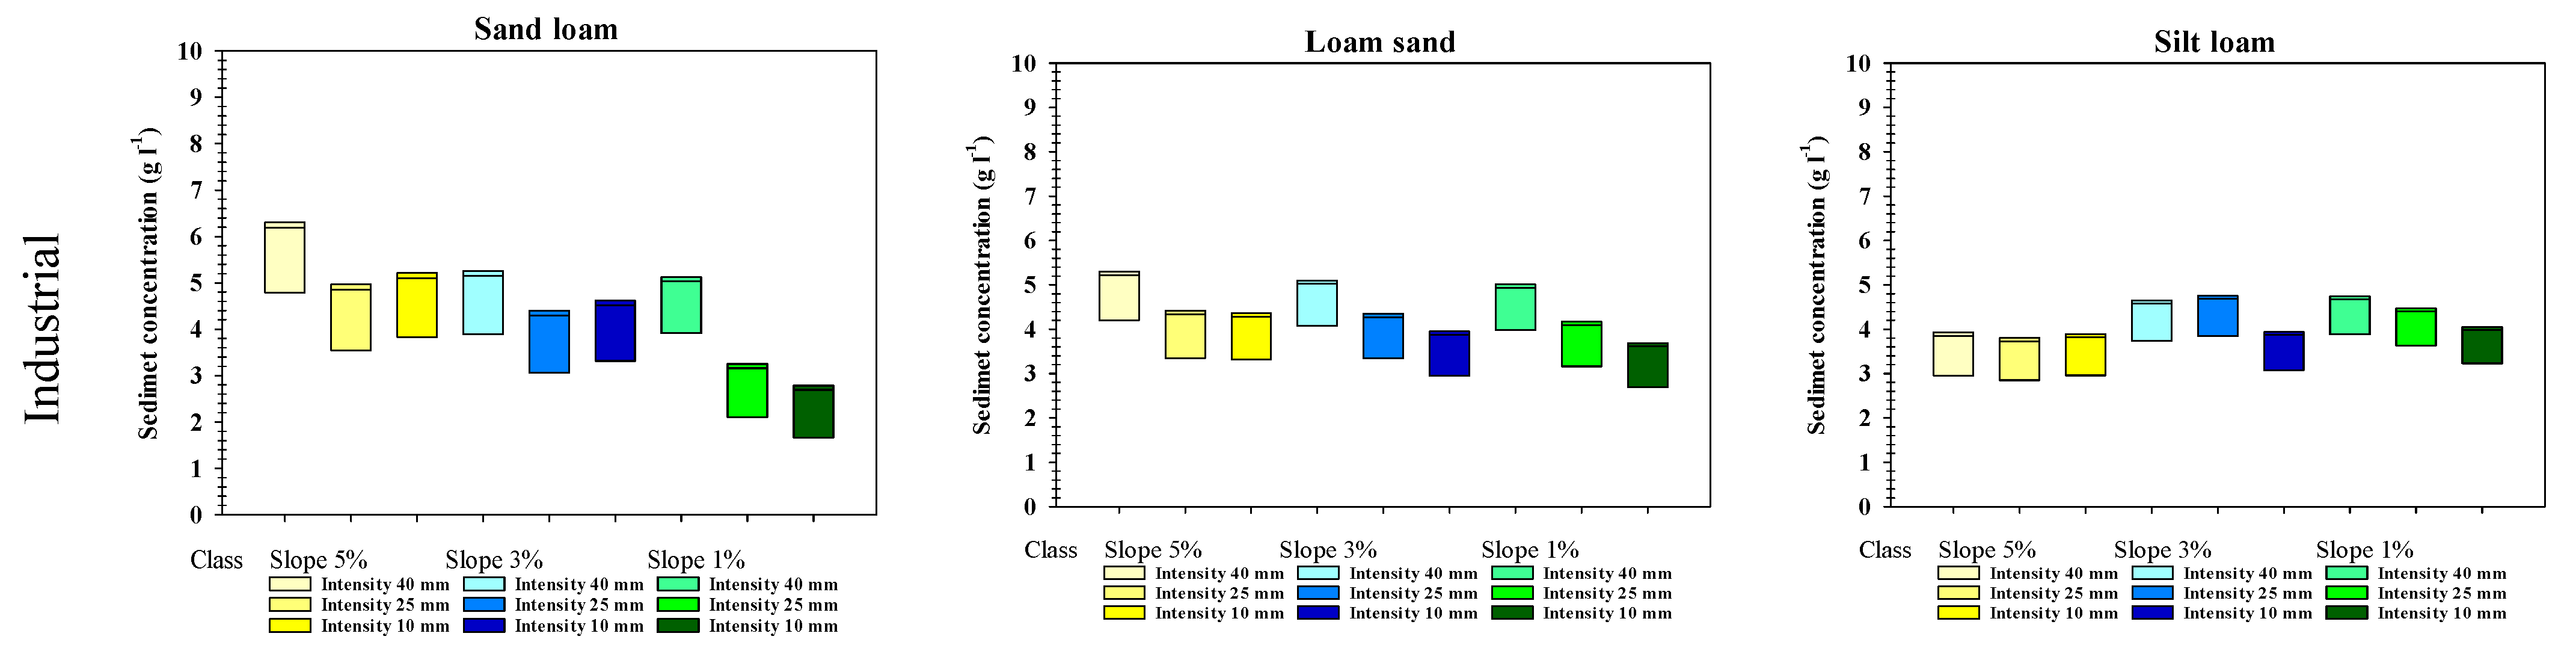
3.6. Sediment Concentration

The sediment concentration increased considerably with increasing rainfall intensity and slope, but this increase was noticeably different in different soil textures (Figure 6). The highest sediment concentration of 4.61 g L−1 was reported for soils from the traditional irrigation treatment, a result which was 11.71 and 23.21 percent greater than under rainfed farming and industrial irrigation, respectively. In the study of soil texture results, sediment concentration was highest in sandy loams (4.19 g L−1) which showed an increase of 1.9 and 6.45 percent in comparison with loamy sand and silty loam textures, respectively. The results also showed that the highest sediment concentration (4.27 g L−1) was reported for the 5% slope, a value which was 2.34 and 10.53 percent greater than for the 3% and 1% slopes, respectively. Under different rainfall intensities, it was found that the highest sediment concentration was obtained for the 40 mm h−1 treatment (4.65 g L−1), which compared to the rainfall intensities of 10 and 25 mm h−1 treatment showed an increase of 20.86 and 16.12 percent, respectively. Overall, the highest sediment concentration occurred in the traditional irrigation treatment, sandy loam soils, slopes of 5% and rainfall intensity of 40 mm h−1 (7.11 g L−1).

3.7. Soil Erosion

Results are presented in Figure 7 for the relationships between soil erosion, rainfall intensity, slope gradients and soil texture in different water management systems. The maximum soil erosion of 179.23 g was reported in the traditional irrigation treatment. This soil loss was 28.55 and 18.56 percent higher than for rainfed farming and industrial irrigation, respectively. In terms of soil textures, the greatest amount of soil erosion was observed in sandy loams (167.48 g), a loss which exceeded that for loamy sand and silty loam textures by 7.98 and 21.56 percent, respectively. The highest slope of 5% also recorded the highest soil erosion value of 164.38 g, representing 6.85 and 17.41 percent more than the 3% and 1% slopes, respectively. As expected, the highest rainfall intensity of 40 mm h−1 was associated with the greatest soil erosion (182.54 g) which, compared to the rainfall intensity treatments of 10 and 25 mm h−1, was greater by 30.31 and 21.39 percent, respectively.

4. Discussion and Conclusions

This study aimed at specifying the effects of differences in water management, soil texture, slope, and rainfall intensity on runoff volume, runoff coefficients, sediment concentration, and soil erosion in a semidry region. We used ANOVA and correlation analysis to establish the strength of relationships between these variables and soil erosion. Results confirmed a clear and consistent increase in runoff volume as a direct response to higher rainfall intensity under the three agroecosystems examined. This is in accord with previous studies conducted for varying rainfall intensities and with differing slope and surface conditions. For example, in a Mediterranean region, Salem and Meselhy [50] reported that increasing rainfall intensity from 21 mm h−1 to 36 mm h−1 increased average runoff by more than 30% on slope gradients from 5 to 12%, respectively. Arnaez et al. [51] conducted investigations in uncontrolled agroecosystems in a Mediterranean region, with simulated rainfall intensities ranging between a moderate 30–46 mm h−1 to a high intensity storm of 92–117 mm h−1. They reported that the average runoff values and runoff coefficients were moderate for low-intermediate rainfall intensities but during infrequent high-intensity rainfall events, the runoff coefficients were significantly higher, ranging from 20.9% to 37.2%. In another set of experiments conducted on abandoned fields in a semi-arid region with rainfall intensities ranging from 40 to 60 mm h−1, even higher runoff coefficients were observed, surpassing 70% [21]. Similar response patterns thus appear in most studies, although the strength of relationships between variables considered differs depending on specified local conditions.
Runoff volume in this study was found to have a negative relationship with sediment concentration (–0.89 **), as also reported by Defershe and Melesse [52]. Runoff volume was positively related to runoff coefficient (0.78 **) and to soil erosion (0.47 **). Based on our experimental data, analysis showed that runoff coefficients were more closely correlated with slope, and sediment concentration with rainfall intensity (Table 2). However, the strength of the effect of slope as well as rainfall intensity on runoff coefficients and sediment concentration varied with soil texture and the type of water management. Such interaction between individual variables has also been noted in other land use environments. In an alpine catchment with very high intensity rainfall (100 mm h−1) simulated under field conditions, for example, Mayerhofer et al. [34] found that runoff coefficients ranged from nearly zero to approximately 60%, depending on plot size, vegetation cover, grazing patterns, and antecedent soil moisture.
Soil erosion has been noted to increase as slope gradients increase from 5% to 35%, although the rate of change diminishes slowly with increasingly steeper slopes [10]. In addition, slope length is an important variable affecting water and sediment movement. At a small scale, cultivation can increase surface roughness and contribute to reducing effective slope length for runoff. Deliberate use of this capability in the old systems of traditional irrigation and rainfed farming in arid and semi-arid regions can contribute to erosion reduction. Under modern practices involving reservoir tillage—a rainwater harvesting system that creates mini-depressions for water collection—runoff is reduced through entrapment in between-row shallow (cultivated) mini-ponds. This interruption to flow encourages infiltration and soil moisture storage, reduces soil erosion, and results in higher wheat yields [50]. Reservoir tillage is thus an effective technique for controlling soil erosion in irrigation as well as rainfed farming systems.
Rainfall intensity is a key variable in soil erosion. Mhaske et al. [10] experimented with a range of very high intensity rainfalls (65 to 148 mm h−1) which all exceeded rainfall categories described as ‘violent’ (≥50 mm h−1; [46]) or ‘cloudburst’ (>30 mm h−1; [47]). Such high intensity rain events pose a high risk for erosion; however, they have been recorded in Mediterranean climates. For example, Camarasa-Belmonte and Soriano [53] used rainfall data collected for 147 gauges by the Automatic Hydrological Information System for a 14-year period, and reported average maximum 30-min intensities of 73 mm h−1 and an absolute maximum of 142 mm h−1. In laboratory experiments, Luo et al. [54] reported that both steeper slopes and higher extreme rainfall intensities were related to sediment concentration in runoff; and sediment concentration was also closely related to soil erosion (0.96 **) in our study (Table 3). The erosional effects of very high intensity falls are influenced by event duration; event frequency; soil texture, structure, antecedent moisture, and bulk density; slope; surface cover; and surface roughness.
OM content has been reported as <0.5% in many dryland soils in the Middle East [55], reflecting the reduced OM noted elsewhere in areas with low precipitation [56]. In the soils sampled for this study, OM content was generally low and OM did not have a significant relationship with erosion (r = 0.24). As OM contributes to soil aggregation which may assist in reducing erosion, the absence of a significant negative correlation between OM and soil erosion may be partly due to low OM levels and the soil depth sampled (the root zone, 0–30 cm). Crop and water management practices that increased soil OM would be expected to contribute to improved surface soil structure and a probable reduction in soil erosion through increased infiltration and reduced particle detachment. Other aspects of soil surface conditions, such as vegetation cover, crop residues [29], bulk density [34], soil surface crusting [26,33] and soil surface roughness [20,57] were not included in our experiments.
Results of this study indicated that the influence of slope and rainfall intensity on runoff volume, runoff coefficient, sediment concentration and soil erosion varies with soil texture and agroecosystem. Of the three water management systems simulated in this study, the highest runoff volume, runoff coefficient, sediment concentration and soil erosion occurred on soils from the traditional irrigation treatment, with a soil texture of sandy loam, slopes of 5% and rainfall intensity of 40 mm h−1. Greater understanding of the variables contributing to runoff and erosion under different water management systems would benefit from combining field observations with laboratory simulations, especially in relation to farms using traditional irrigation methods.

Author Contributions

Conceptualization, S.S.; methodology, S.S., M.M.G. and D.D.; formal analysis, S.S. and M.M.G.; data curation and visualization, S.S.; supervision, S.S.; writing—original draft preparation, M.M.G.; writing—review and editing, S.S., D.D. and M.M.G. All authors have read and agreed to the published version of the manuscript.

Funding

This research received no external funding.

Data Availability Statement

Data are available on reasonable request from the first author.

Acknowledgments

This research was conducted through collaboration between Arak University and the Department of Agriculture of Markazi Province. The authors wish to thank Arak University for giving us the opportunity to carry out this research. We are immensely thankful for the assistance and cooperation of the students of the Agriculture and Environment Faculty, particularly Davoud Khosravi, Mohammad Ashayeri, Arif Jabari Zahra, Majid Naimi, Mohadeseh Hejrati, Mahdieh Soltani, Elham Maleki, Fatemeh Salehi, Fatemeh Sharifdoust, Sara Abbasi, Zahra Heydari, Sara Pouyandeh, and Sara Shahghalei.

Conflicts of Interest

The authors declare no conflict of interest.

References

  1. De Oliveira, S.P.; de Lacerda, N.B.; Blum, S.C.; Escobar, M.E.O.; de Oliveira, T.S. Organic carbon and nitrogen stocks in soils of northeastern Brazil converted to irrigated agriculture. Land Degrad. Dev. 2015, 26, 9–21. [Google Scholar] [CrossRef]
  2. Colazo, J.C.; Buschiazzo, D. The impact of agriculture on soil texture due to wind erosion. Land Degrad. Dev. 2015, 26, 62–70. [Google Scholar] [CrossRef]
  3. Dlamini, P.; Orchard, C.; Jewitt, G.; Lorentz, S.; Titshall, L.; Chaplot, V. Controlling factors of sheet erosion under degraded grasslands in the sloping lands of KwaZulu-Natal, South Africa. Agric. Water Manag. 2011, 98, 1711–1718. [Google Scholar] [CrossRef]
  4. Pena, S.B.; Abreu, M.M.; Magalhães, M.R.; Cortez, N. Water erosion aspects of land degradation neutrality to landscape planning tools at national scale. Geoderma 2020, 363, 114093. [Google Scholar] [CrossRef]
  5. Mekonnen, M.; Keesstra, S.D.; Baartman, J.E.; Ritsema, C.J.; Melesse, A.M. Evaluating sediment storage dams: Structural off-site sediment trapping measures in northwest Ethiopia. Cuad. Investig. Geográfica 2015, 41, 7–22. [Google Scholar] [CrossRef]
  6. Lasanta, T.; Nadal-Romero, E.; Errea, P.; Arnáez, J. The effect of landscape conservation measures in changing landscape patterns: A case study in Mediterranean mountains. Land Degrad. Dev. 2016, 27, 373–386. [Google Scholar] [CrossRef]
  7. Cerdà, A. Parent material and vegetation affect soil erosion in eastern Spain. Soil Sci. Soc. Am. J. 1999, 63, 362–368. [Google Scholar] [CrossRef]
  8. Zhao, L.; Hou, R.; Wu, F.; Keesstra, S. Effect of soil surface roughness on infiltration water, ponding and runoff on tilled soils under rainfall simulation experiments. Soil Tillage Res. 2018, 179, 47–53. [Google Scholar] [CrossRef]
  9. Dragovich, D.; Morris, R. Fire intensity, slope wash and bio-transfer of sediment in eucalypt forest, Australia. Earth Surf. Process. Landf. 2002, 27, 1309–1319. [Google Scholar] [CrossRef]
  10. Mhaske, S.N.; Pathak, K.; Basak, A. A comprehensive design of rainfall simulator for the assessment of soil erosion in the laboratory. Catena 2019, 172, 408–420. [Google Scholar] [CrossRef]
  11. Bewket, W.; Teferi, E. Assessment of soil erosion hazard and prioritization for treatment at the watershed level: Case study in the Chemoga watershed, Blue Nile basin Ethiopia. Land Degrad. Dev. 2009, 20, 609–622. [Google Scholar] [CrossRef]
  12. El Jazouli, A.; Barakat, A.; Chafiri, A.; El Moutaki, S.; Ettaqy, A. Soil erosion modeled with USLE, GIS, and remote sensing: Case study of Ikkour watershed in Middle Atles (Morocco). Geosci. Lett. 2017, 4, 25. [Google Scholar] [CrossRef]
  13. Mati, B.W.; Veihe, A. Application of the USLE in a Savannah environment: Comparative experiences from east and west Africa. Singap. J. Trop. Geogr. 2001, 22, 138–155. [Google Scholar] [CrossRef]
  14. Zanjani Jam, M. Evaluation of soil erosion using USLE model in GIS (Case study: Zanjanrood watershed). Rep. Geomat. 2006, 140–146. (In Persian) [Google Scholar]
  15. Kinnell, P.I.A. Why the universal soil loss equation and the revised version of it do not predict event erosion well? Hydrol. Process. 2005, 19, 851–854. [Google Scholar] [CrossRef]
  16. Meinen, B.; Robinson, D.T. Agricultural erosion modelling: Evaluating USLE and WEPP field-scale erosion estimates using UAV time-series data. Environ. Model. Softw. 2021, 137, 104962. [Google Scholar] [CrossRef]
  17. Abudi, I.; Carmi, G.; Berliner, P. Rainfall simulator for field runoff studies. J. Hydrol. 2012, 454, 76–81. [Google Scholar] [CrossRef]
  18. Aksoy, H.; Unal, N.E.; Cokgor, S.; Gedikli, A.; Yoon, J.; Koca, K.; Inci, S.B.; Eris, E. A rainfall simulator for laboratory-scale assessment of rainfall-runoff-sediment transport processes over a two-dimensional flume. Catena 2012, 98, 63–72. [Google Scholar] [CrossRef]
  19. Meyer, L.D.; Harmon, W.C. Multiple-intensity rainfall simulator for erosion research on row sideslopes. Trans. ASAE 1979, 22, 0100–0103. [Google Scholar] [CrossRef]
  20. Gómez, J.A.; Nearing, M.A. Runoff and sediment losses from rough and smooth soil surfaces in a laboratory experiment. Catena 2005, 59, 253–266. [Google Scholar] [CrossRef]
  21. Lasanta, T.; Garcıa-Ruiz, J.M.; Pérez-Rontomé, C.; Sancho-Marcén, C. Runoff and sediment yield in a semi-arid environment: The effect of land management after farmland abandonment. Catena 2000, 38, 265–278. [Google Scholar] [CrossRef]
  22. Le Bissonnais, Y.; Cerdan, O.; Lecomte, V.; Benkhadra, H.; Souchère, V.; Martin, P. Variability of soil surface characteristics influencing runoff and interrill erosion. Catena 2005, 62, 111–124. [Google Scholar] [CrossRef]
  23. Loch, R.J. Effects of vegetation cover on runoff and erosion under simulated rain and overland flow on a rehabilitated site on the Meandu Mine, Tarong, Queensland. Soil Res. 2000, 38, 299–312. [Google Scholar] [CrossRef]
  24. Schiettecatte, W.; Ouessar, M.; Gabriels, D.; Tanghe, S.; Heirman, S.; Abdelli, F. Impact of water harvesting techniques on soil and water conservation: A case study on a micro catchment in southeastern Tunisia. J. Arid Environ. 2005, 61, 297–313. [Google Scholar] [CrossRef]
  25. Assouline, S.; Ben-Hur, M. Effects of rainfall intensity and slope gradient on the dynamics of interrill erosion during soil surface sealing. Catena 2006, 66, 211–220. [Google Scholar] [CrossRef]
  26. Zare, K.M.; Najafinejad, A.; Noura, N.; Kavian, A. Effects of slope and soil properties on runoff and soil loss using rainfall simulator, Chehel-chai watershed, Golestan province. J. Soil Water Conserv. 2012, 19, 165–178. (In Persian) [Google Scholar]
  27. Salem, H.M.; Meselhy, A.A. A portable rainfall simulator to evaluate the factors affecting soil erosion in the northwestern coastal zone of Egypt. Nat. Hazards 2021, 105, 2937–2955. [Google Scholar] [CrossRef]
  28. Farzi, P.; Azarakhshi, M.; Rasoulzadeh, A.; Bashiri, M. The Effects of Geological Units’ Characteristics and Slope Gradient on Runoff and Sediment Yield Using Rainfall Simulator (Case study: Senobar Watershed, Torbat-e-Heydarieh). J. Range Watershed Manag. 2016, 69, 437–447, (In Persian with English Abstract). [Google Scholar]
  29. Parvisi, Y.; Bayat, R.; Arabkhedri, M.; Fatehi, S. Determination of Main Agents Affecting Soil Erosion in Rainfed Land of Kermanshah Province Using Rainfall Simulator. Iran. J. Watershed Sci. 2020, 14, 70–82, (In Persian with English Abstract). [Google Scholar]
  30. Jiang, F.S.; Huang, Y.H.; Wang, M.K.; Lin, J.S.; Zhao, G.; Ge, H.L. Effects of rainfall intensity and slope gradient on steep colluvial deposit erosion in southeast China. Soil Sci. Soc. Am. J. 2014, 78, 1741–1752. [Google Scholar] [CrossRef]
  31. Lin, J.; Huang, Y.; Zhao, G.; Jiang, F.; Wang, M.K.; Ge, H. Flow-driven soil erosion processes and the size selectivity of eroded sediment on steep slopes using colluvial deposits in a permanent gully. Catena 2017, 157, 47–57. [Google Scholar] [CrossRef]
  32. Liu, X.; Tang, C.; Zhang, D. Simulated runoff processes on colluvial deposits of Liantanggang Benggang and their water distributions. Trans. Chin. Soc. Agric. Eng. 2015, 31, 179–185. [Google Scholar]
  33. Cheng, Q.; Cai, Q.; Ma, W. Comparative study on rain splash erosion of representative soils in China. Chin. Geogr. Sci. 2008, 18, 155–161. [Google Scholar] [CrossRef]
  34. Mayerhofer, C.; Meißl, G.; Klebinder, K.; Kohl, B.; Markart, G. Comparison of the results of a small-plot and a large-plot rainfall simulator–Effects of land use and land cover on surface runoff in Alpine catchments. Catena 2017, 156, 184–196. [Google Scholar] [CrossRef]
  35. Sharafi, S.; Ghaleni, M.M. Spatial assessment of drought features over different climates and seasons across Iran. Theor. Appl. Climatol. 2021, 1–17. [Google Scholar] [CrossRef]
  36. Panahi, D.M.; Kalantari, Z.; Ghajarnia, N.; Seifollahi-Aghmiuni, S.; Destouni, G. Variability and change in the hydro-climate and water resources of Iran over a recent 30-year period. Sci. Rep. 2020, 10, 1–9. [Google Scholar]
  37. Sahandi, M.R.; Soheili, M. Geological Map of Iran: Scale 1:1,000,000; Geological Survey & Mineral Explorations of Iran (GSI): Tehran, Iran, 2005. [Google Scholar]
  38. Guzha, A.C. Effects of tillage on soil microrelief, surface depression storage and soil water storage. Soil Tillage Res. 2004, 76, 105–114. [Google Scholar] [CrossRef]
  39. Reynolds, W.D.; Carter, M.R.; Gregorich, E.G. Saturated hydraulic properties: Well permeameter. In Soil Sampling and Methods of Analysis, 2nd ed.; CRC Press: Boca Raton, FL, USA, 2008; pp. 1025–1042. [Google Scholar]
  40. Sparks, D.L.; Fendorf, S.E.; Toner, C.V., IV; Carski, T.H. Kinetic methods and measurements. Methods Soil Anal. Part 3 Chem. Methods 1996, 5, 1275–1307. [Google Scholar]
  41. Jagadamma, S.; Lal, R. Distribution of organic carbon in physical fractions of soils as affected by agricultural management. Biol. Fertil. Soils 2010, 46, 543–554. [Google Scholar] [CrossRef]
  42. Jagadamma, S.; Lal, R.; Hoeft, R.G.; Nafziger, E.D.; Adee, E.A. Nitrogen fertilization and cropping system impacts on soil properties and their relationship to crop yield in the central Corn Belt, USA. Soil Tillage Res. 2008, 98, 120–129. [Google Scholar] [CrossRef]
  43. Bronick, C.J.; Lal, R. Manuring and rotation effects on soil organic carbon concentration for different aggregate size fractions on two soils in northeastern Ohio, USA. Soil Tillage Res. 2005, 81, 239–252. [Google Scholar] [CrossRef]
  44. Mavi, M.S.; Marschner, P. Drying and wetting in saline and saline-sodic soils—Effects on microbial activity, biomass and dissolved organic carbon. Plant Soil 2012, 355, 51–62. [Google Scholar] [CrossRef]
  45. Soil Survey Staff. Soil survey laboratory methods manual. In Soil Survey Investigations Rep. 42; Version 5; NRCS: Washington, DC, USA, 2014. [Google Scholar]
  46. WMO (World Meteorological Organization). Guide to Instruments and Methods of Observation; World Meteorological Organization: Geneva, Switzerland, 2018; p. 548. [Google Scholar]
  47. Avanzato, R.; Beritelli, F. An Innovative Acoustic Rain Gauge Based on Convolutional Neural Networks. Information 2020, 11, 183. [Google Scholar] [CrossRef]
  48. Seeger, M. Uncertainty of factors determining runoff and erosion processes as quantified by rainfall simulations. Catena 2007, 71, 56–67. [Google Scholar] [CrossRef]
  49. Geissen, V.; Sánchez-Hernández, R.; Kampichler, C.; Ramos-Reyes, R.; Sepulveda-Lozada, A.; Ochoa-Goana, S.; de Jong, B.H.J.; Huerta-Lwanga, E.; Hernández-Daumas, S. Effects of land-use change on some properties of tropical soils—An example from Southeast Mexico. Geoderma 2009, 151, 87–97. [Google Scholar] [CrossRef]
  50. Salem, H.M.; Meselhy, A.; Elhagarey, M.; Ali, A.M.; Wu, W. Soil erosion control and wheat productivity are improved by a developed ridge-furrow and reservoir tillage systems. Arch. Agron. Soil Sci. 2022, 68, 273–282. [Google Scholar] [CrossRef]
  51. Arnaez, J.; Lasanta, T.; Ruiz-Flaño, P.; Ortigosa, L. Factors affecting runoff and erosion under simulated rainfall in Mediterranean vineyards. Soil Tillage Res. 2007, 93, 324–334. [Google Scholar] [CrossRef]
  52. Defersha, M.B.; Melesse, A.M. Effect of rainfall intensity, slope and antecedent moisture content on sediment concentration and sediment enrichment ratio. Catena 2012, 90, 47–52. [Google Scholar] [CrossRef]
  53. Camarasa-Belmonte, A.M.; Soriano, J. Empirical study of extreme rainfall intensity in a semi-arid environment at different time scales. J. Arid. Environ. 2014, 100–101, 63–71. [Google Scholar] [CrossRef]
  54. Luo, B.; Han, Z.; Yang, J.; Wang, Q. Assessment of erosion characteristics in purple and yellow soils using simulated rainfall experiments. Int. J. Environ. Res. Public Health 2022, 19, 357. [Google Scholar] [CrossRef]
  55. Rawan, M.L.; Bol, R.; Amelung, W.; Brahim, N. Soil organic matter amendments in date palm groves of the Middle Eastern and North African region: A mini-review. J. Arid Land 2016, 8, 77–92. [Google Scholar] [CrossRef]
  56. Alvarez, R.; Lavado, R.S. Climate, organic matter and clay content relationships in the Pampa and Chaco soils, Argentina. Geoderma 1998, 83, 127–141. [Google Scholar] [CrossRef]
  57. Salem, H.M.; Valero, C.; Muñoz, M.Á.; Gil-Rodríguez, M.; Barreiro, P. Effect of reservoir tillage on rainwater harvesting and soil erosion control under a developed rainfall simulator. Catena 2014, 113, 353–362. [Google Scholar] [CrossRef]
Figure 1. Location of the study area. (a) location of 158 selected farms with different water management systems; (b) texture of soils on selected farms.
Land 12 01790 g001
Figure 2. Measuring rainfall uniformity based on the Christiansen coefficient.
Land 12 01790 g002
Figure 3. Boxplots showing pH, EC, and OM concentration in different water management systems.
Land 12 01790 g003aLand 12 01790 g003b
Figure 4. Boxplots showing runoff volume affected by rainfall intensity (40, 25 and 10 mm h−1) and slope (5, 3 and 1%) for different soil textures and water management systems.
Land 12 01790 g004aLand 12 01790 g004b
Figure 5. Boxplots showing runoff coefficient affected by rainfall intensity (40, 25 and 10 mm h−1) and slope (5, 3 and 1%) for different soil textures and water management systems.
Land 12 01790 g005aLand 12 01790 g005b
Figure 6. Boxplots showing sediment concentration affected by rainfall intensity (40, 25 and 10 mm h−1) and slope (5, 3 and 1%) for different soil textures and water management systems.
Land 12 01790 g006aLand 12 01790 g006b
Figure 7. Boxplots showing soil erosion affected by rainfall intensity (40, 25 and 10 mm h−1) and slope (5, 3 and 1%) for different soil textures and water management systems.
Land 12 01790 g007
Table 1. Soil texture and mean slopes on sampled farms.
Water Management SystemFarms (No.)Mean Slope (% of Farms *)Sandy Loam (% of Farms)Loamy Sand (% of Farms)Silty Loam (% of Farms)
1%3%5%
Rainfed (no irrigation)31233245362639
Traditional Irrigation53424513533215
Industrial Irrigation74164737582814
% of all farms(n = 158)264430522919
* Values may not total 100% due to rounding.
Table 2. Results of analysis of variance of mean squares of runoff volume (mL), runoff coefficient, sediment concentration (g L−1) and soil erosion (g).
Sum of Variance (S.O.V)Runoff VolumeRunoff CoefficientSediment ConcentrationSoil Erosion
Irrigation (I)2,006,833.94 **434.79 **23.41 **54,613.47 **
Soil texture (ST)7,872,654.2 **1605.9 **1.47 **27,068.34 **
I × ST586,709.89 **236.64 **0.67 **2226.49 **
Slope (S)996,508.83 **184.53 **5.41 **16,842.31 **
I × S226,703.1 **26.05 *3.04 **5566.74 **
ST × S333,094.34 **68.42 **8.92 **9504.48 **
I × ST × S124,345.45 *15.3 *1.91 **2322.13 **
Rainfall intensity (R)3,912,014.44 **32,397.82 **20.93 **65,478.26 **
I × R105,755.67 *28.82 *0.17 **290.22 *
ST × R26,295.02 *201.5 **2.84 **5843.24 **
S × R55,072.47 *26.83 *1.39 **1513.77 **
I × ST × R24,576.94 **11.85 *0.08 **223.41 *
ST × S × R6252.62 *3.2 *0.56 **776.49 **
I × ST × S × R13,945.35 *8.3 *0.35 **575.1 **
* and ** represent a significant difference at p < 0.05 and p < 0.01, respectively.
Table 3. Pearson correlation coefficients among measured properties (n = 158).
CodePropertyRVRCSCSEpHECOMCLSISA
1RV1
2RC0.78 **1
3SC−0.89 **0.33 *1
4SE0.47 **0.22 n.s0.96 **1
5pH−0.40 **−0.31 *0.21 n.s0.22 n.s1
6EC0.12 n.s0.16 n.s0.04 n.s0.05 n.s0.10 n.s1
7OM−0.55 **0.21 n.s0.28 *0.24 n.s0.25 n.s0.39 *1
8CL0.32 *−0.44 **−0.42 **−0.37 *−0.35 *0.39 *0.48 **1
9SI0.62 **0.31 *0.43 **0.60 **0.12 n.s−0.38 *0.70 **0.69 **1
10SA0.36 *−0.25 n.s−0.48 *−0.35 *−0.26 *0.17 n.s−0.53 **−0.71 **−0.96 **1
n.s: not significant; * and ** represent significant difference at p < 0.05 and p < 0.01, respectively. Abbreviations: RV, runoff volume (mg L−1); RC, runoff coefficient; SC, sediment concentration (g L−1); SE, soil erosion (g); EC, electrical conductivity (μS cm−1); OM, organic matter (mg); CL, clay; SI, silt; SA, sand.
Table 4. Multilinear regression of soil erosion as a function of slope (S) and rain intensity (RI) on different farm types and soil textures.
Farm TypeSoil TextureEquation (Soil Erosion)R2
RainfedSandy loamErosion = 74.35 + 2.23 S + 2.58 RI0.75 **
Loamy sandErosion = 65.81 + 4.24 S + 1.67 RI0.82 **
Silty loamErosion = 100.96 − 3.19 S + 1.06 RI0.77 **
TraditionalSandy loamErosion = 26.64 + 33.80 S + 2.62 RI0.81 **
Loamy sandErosion = 95.42 + 10.23 S + 2.45 RI0.80 **
Silty loamErosion = 129.95 + 0.47 S + 1.00 RI0.40 n.s
IndustrialSandy loamErosion = 61.77 + 15.20 S + 2.22 RI0.78 **
Loamy sandErosion = 95.49 + 2.81 S + 2.05 RI0.91 **
Silty loamErosion = 101.15 − 1.39 S + 0.90 RI0.60 n.s
n.s not significant; ** represent significance at p < 0.01.
Disclaimer/Publisher’s Note: The statements, opinions and data contained in all publications are solely those of the individual author(s) and contributor(s) and not of MDPI and/or the editor(s). MDPI and/or the editor(s) disclaim responsibility for any injury to people or property resulting from any ideas, methods, instructions or products referred to in the content.

