


Study on Influencing Factors and Planning Strategies of Population Spatial Distribution in Urban Fringe Areas from the Perspective of Built Environment—The Case of Wuhan, China

 , , ,
, , ,
Abstract
:1. Introduction
2. Literature Review
3. Research Area and Data
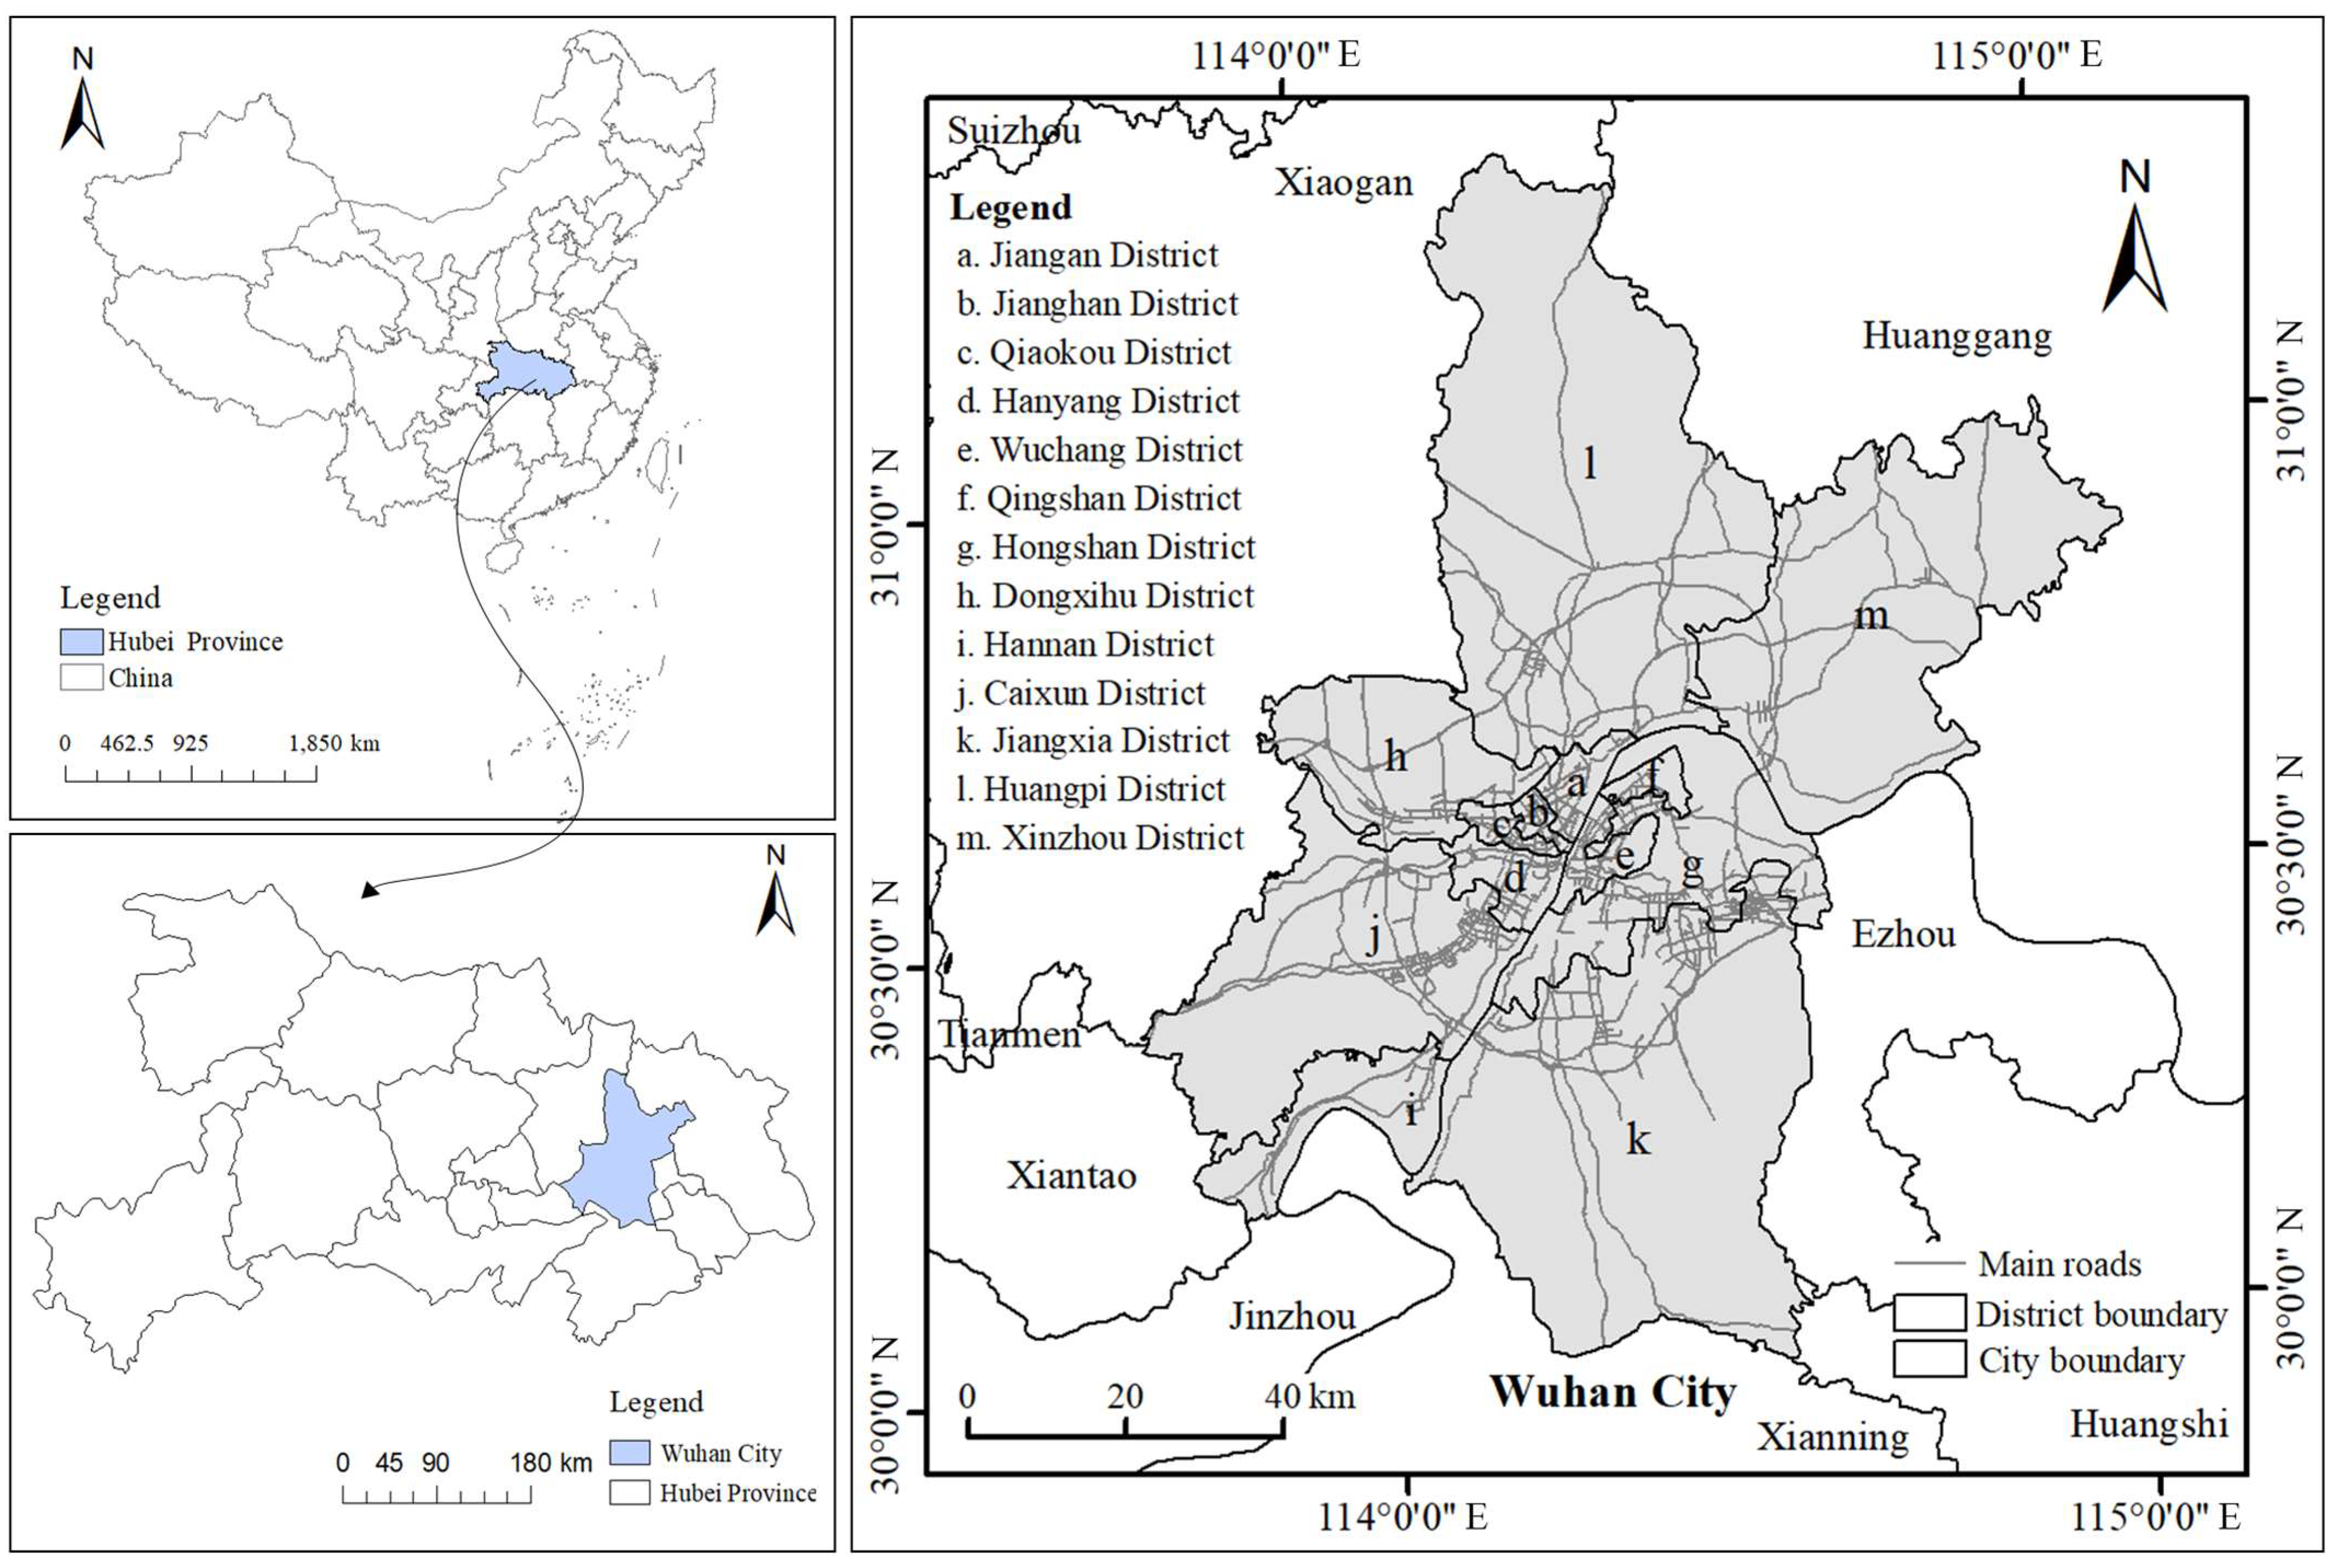
3.1. Overview of the Research Area
3.2. Data Source
4. Methodology
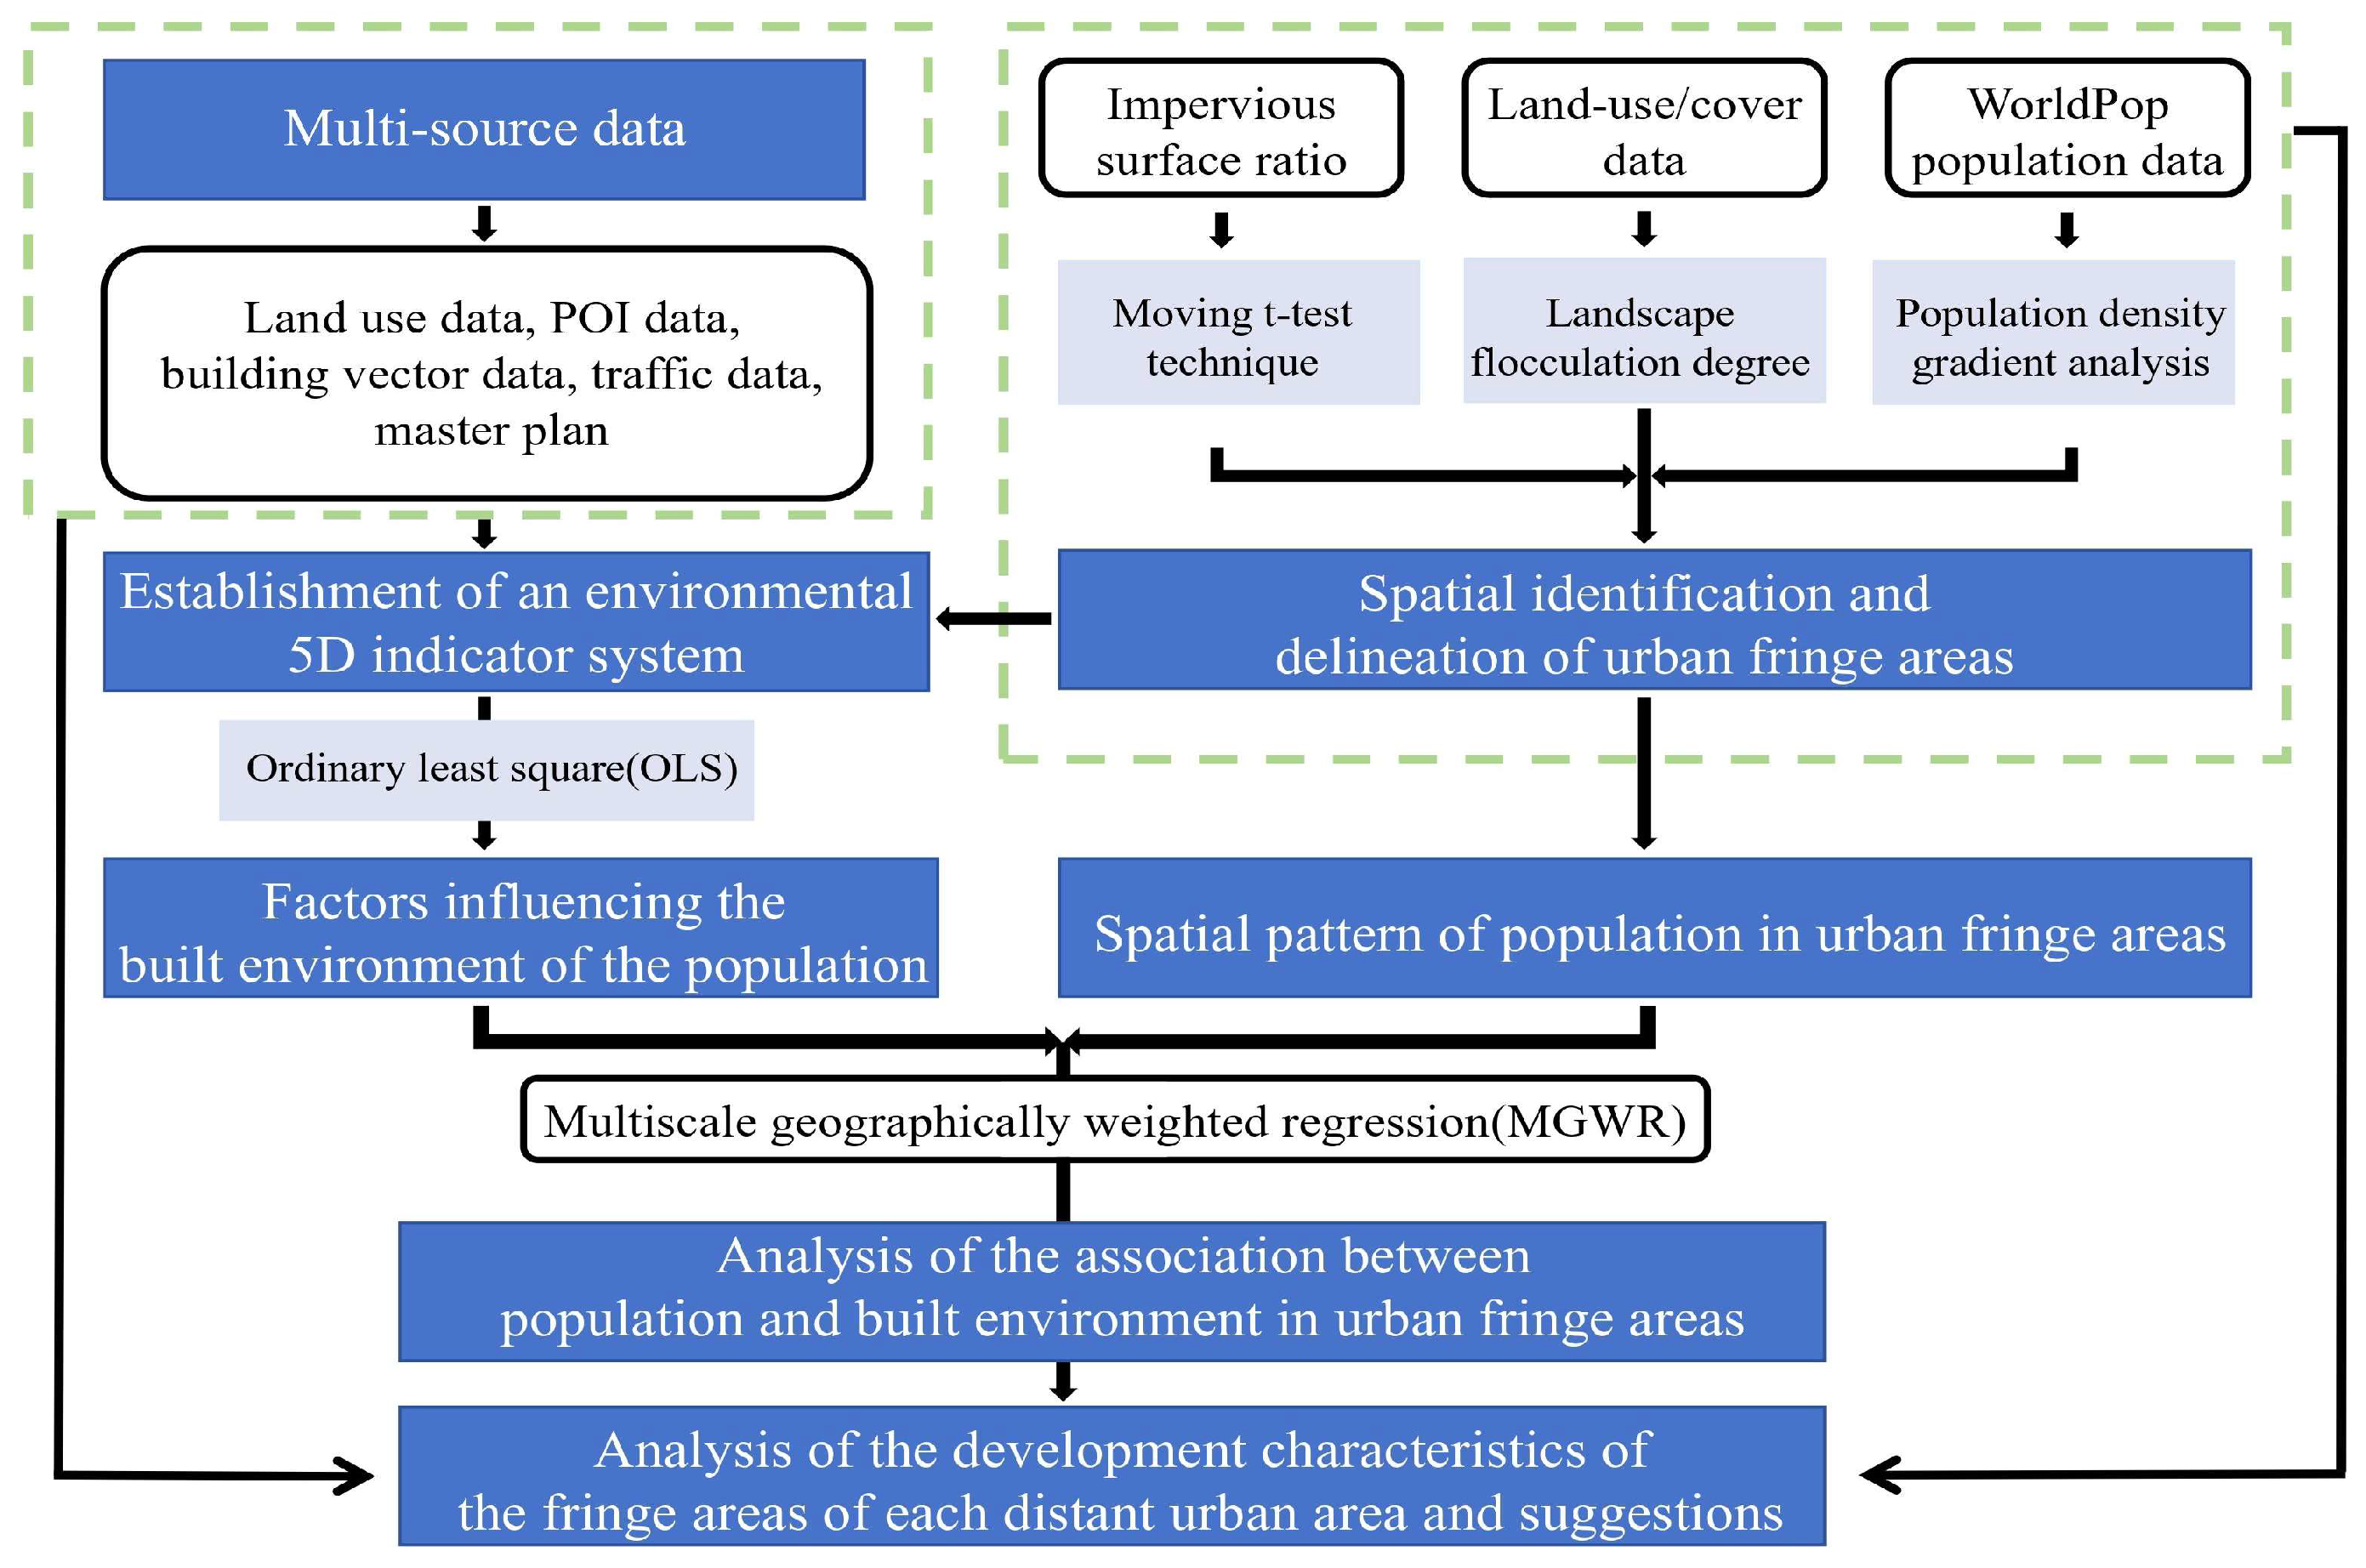
4.1. Research Framework
4.2. Methodology for Determining the Extent of Urban Fringe Areas
- (1)
- Impervious Surface Ratio and Sliding t-test Technique
- (2)
- Landscape Flocculation Degree
- (3)
- Population Density
4.3. Models and Variables
4.3.1. Ordinary Least Square
4.3.2. Multiscale Geographically Weighted Regression
4.3.3. Definitions of Variables
- (1)
- Density
- (2)
- Diversity
- (3)
- Design
- (4)
- Distance to Transit
- (5)
- Destination Accessibility
5. Analysis of the Evolution of Population and Built Environment in Urban Fringe Areas of Wuhan City
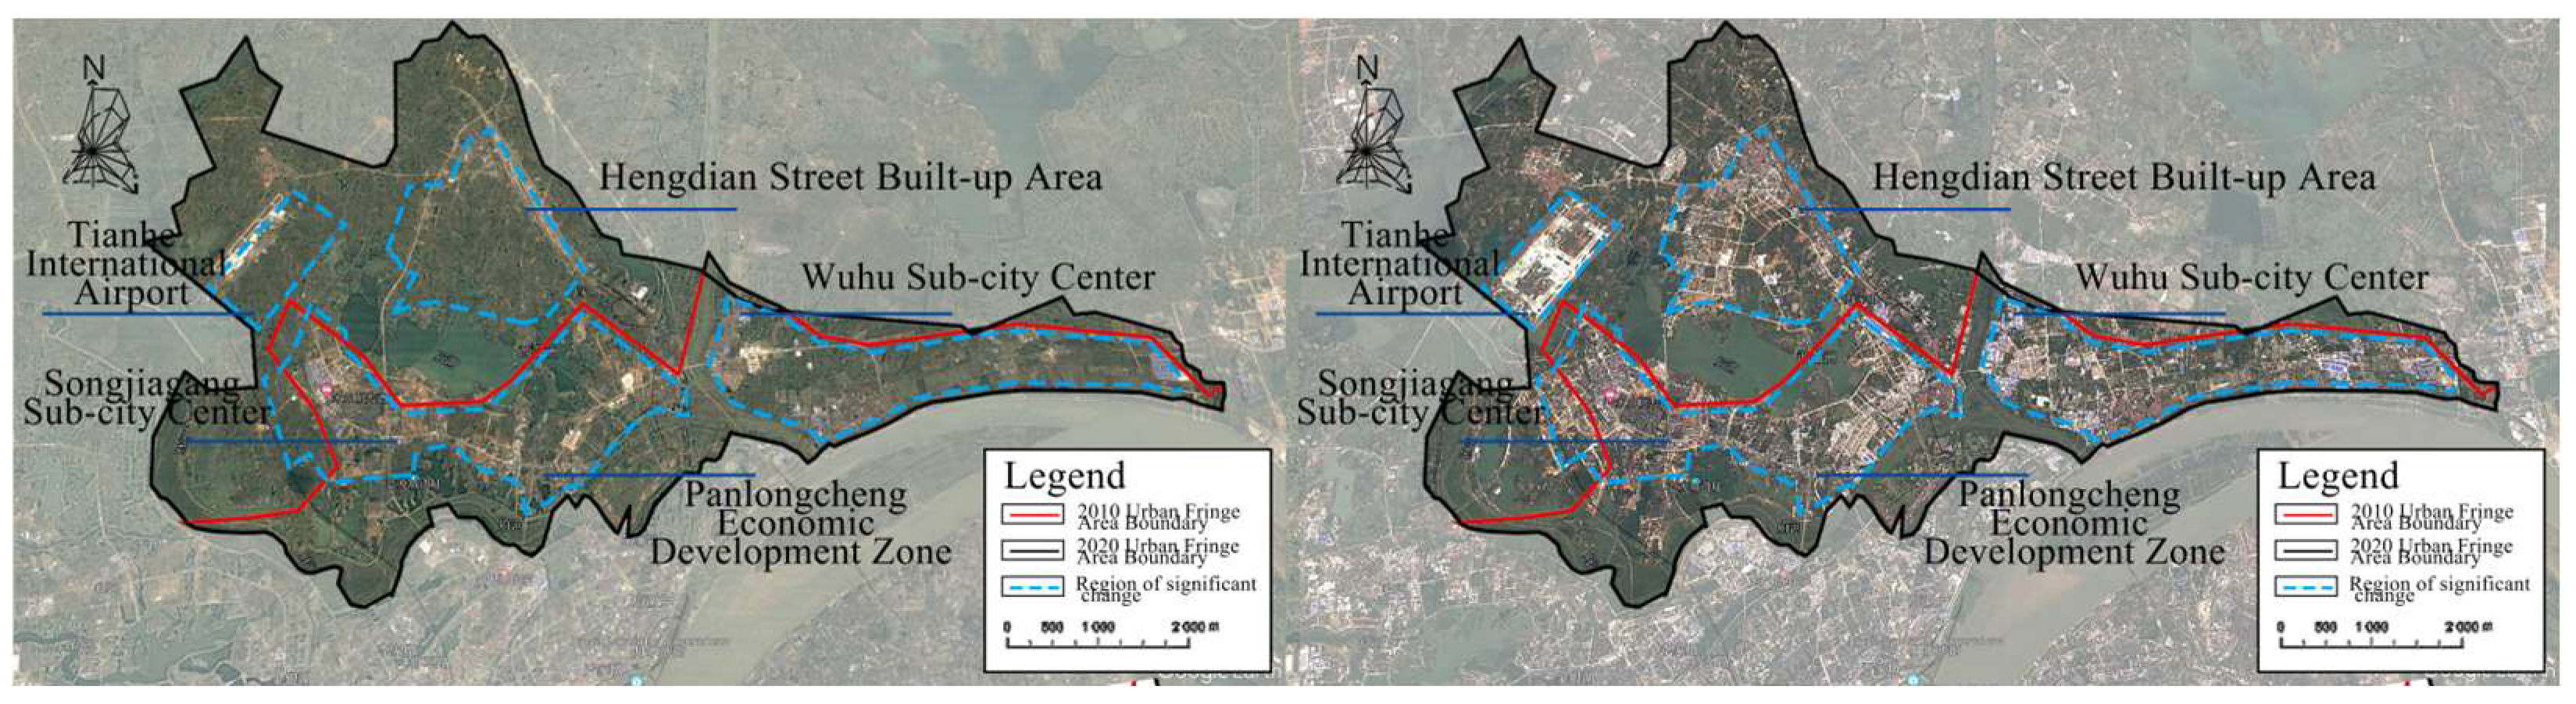
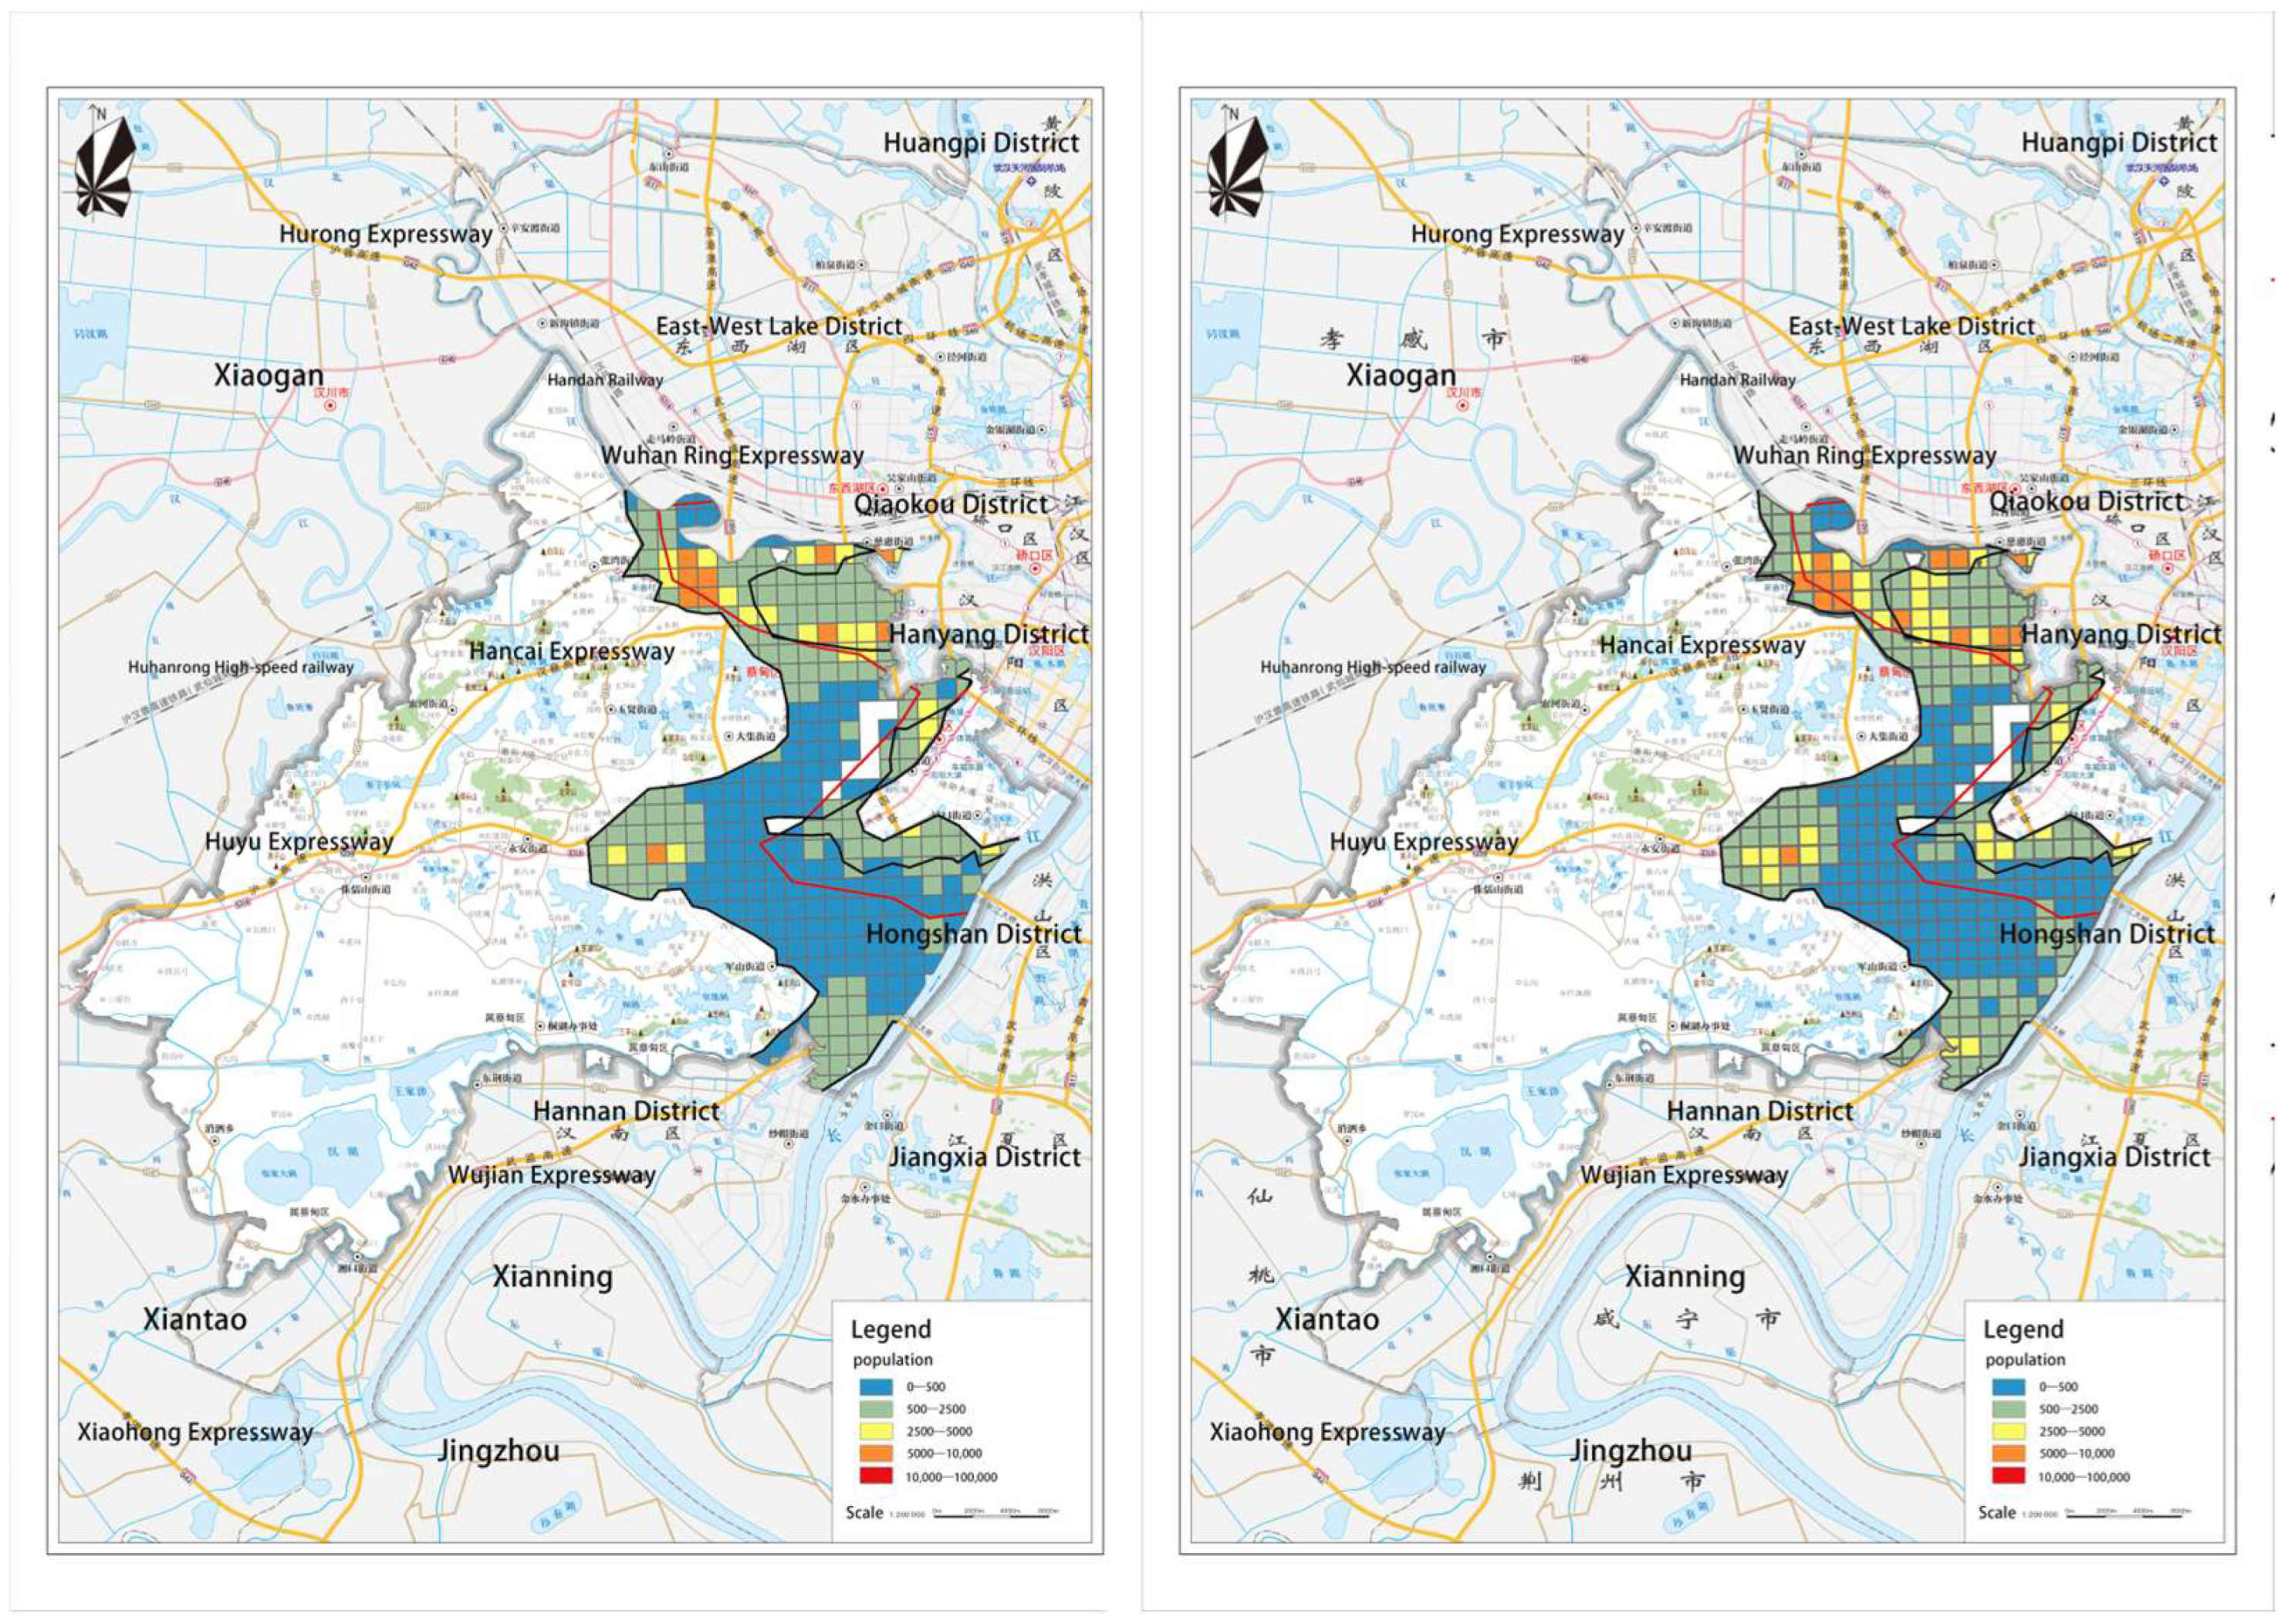
5.1. Determining the Extent of the Urban Fringe Areas
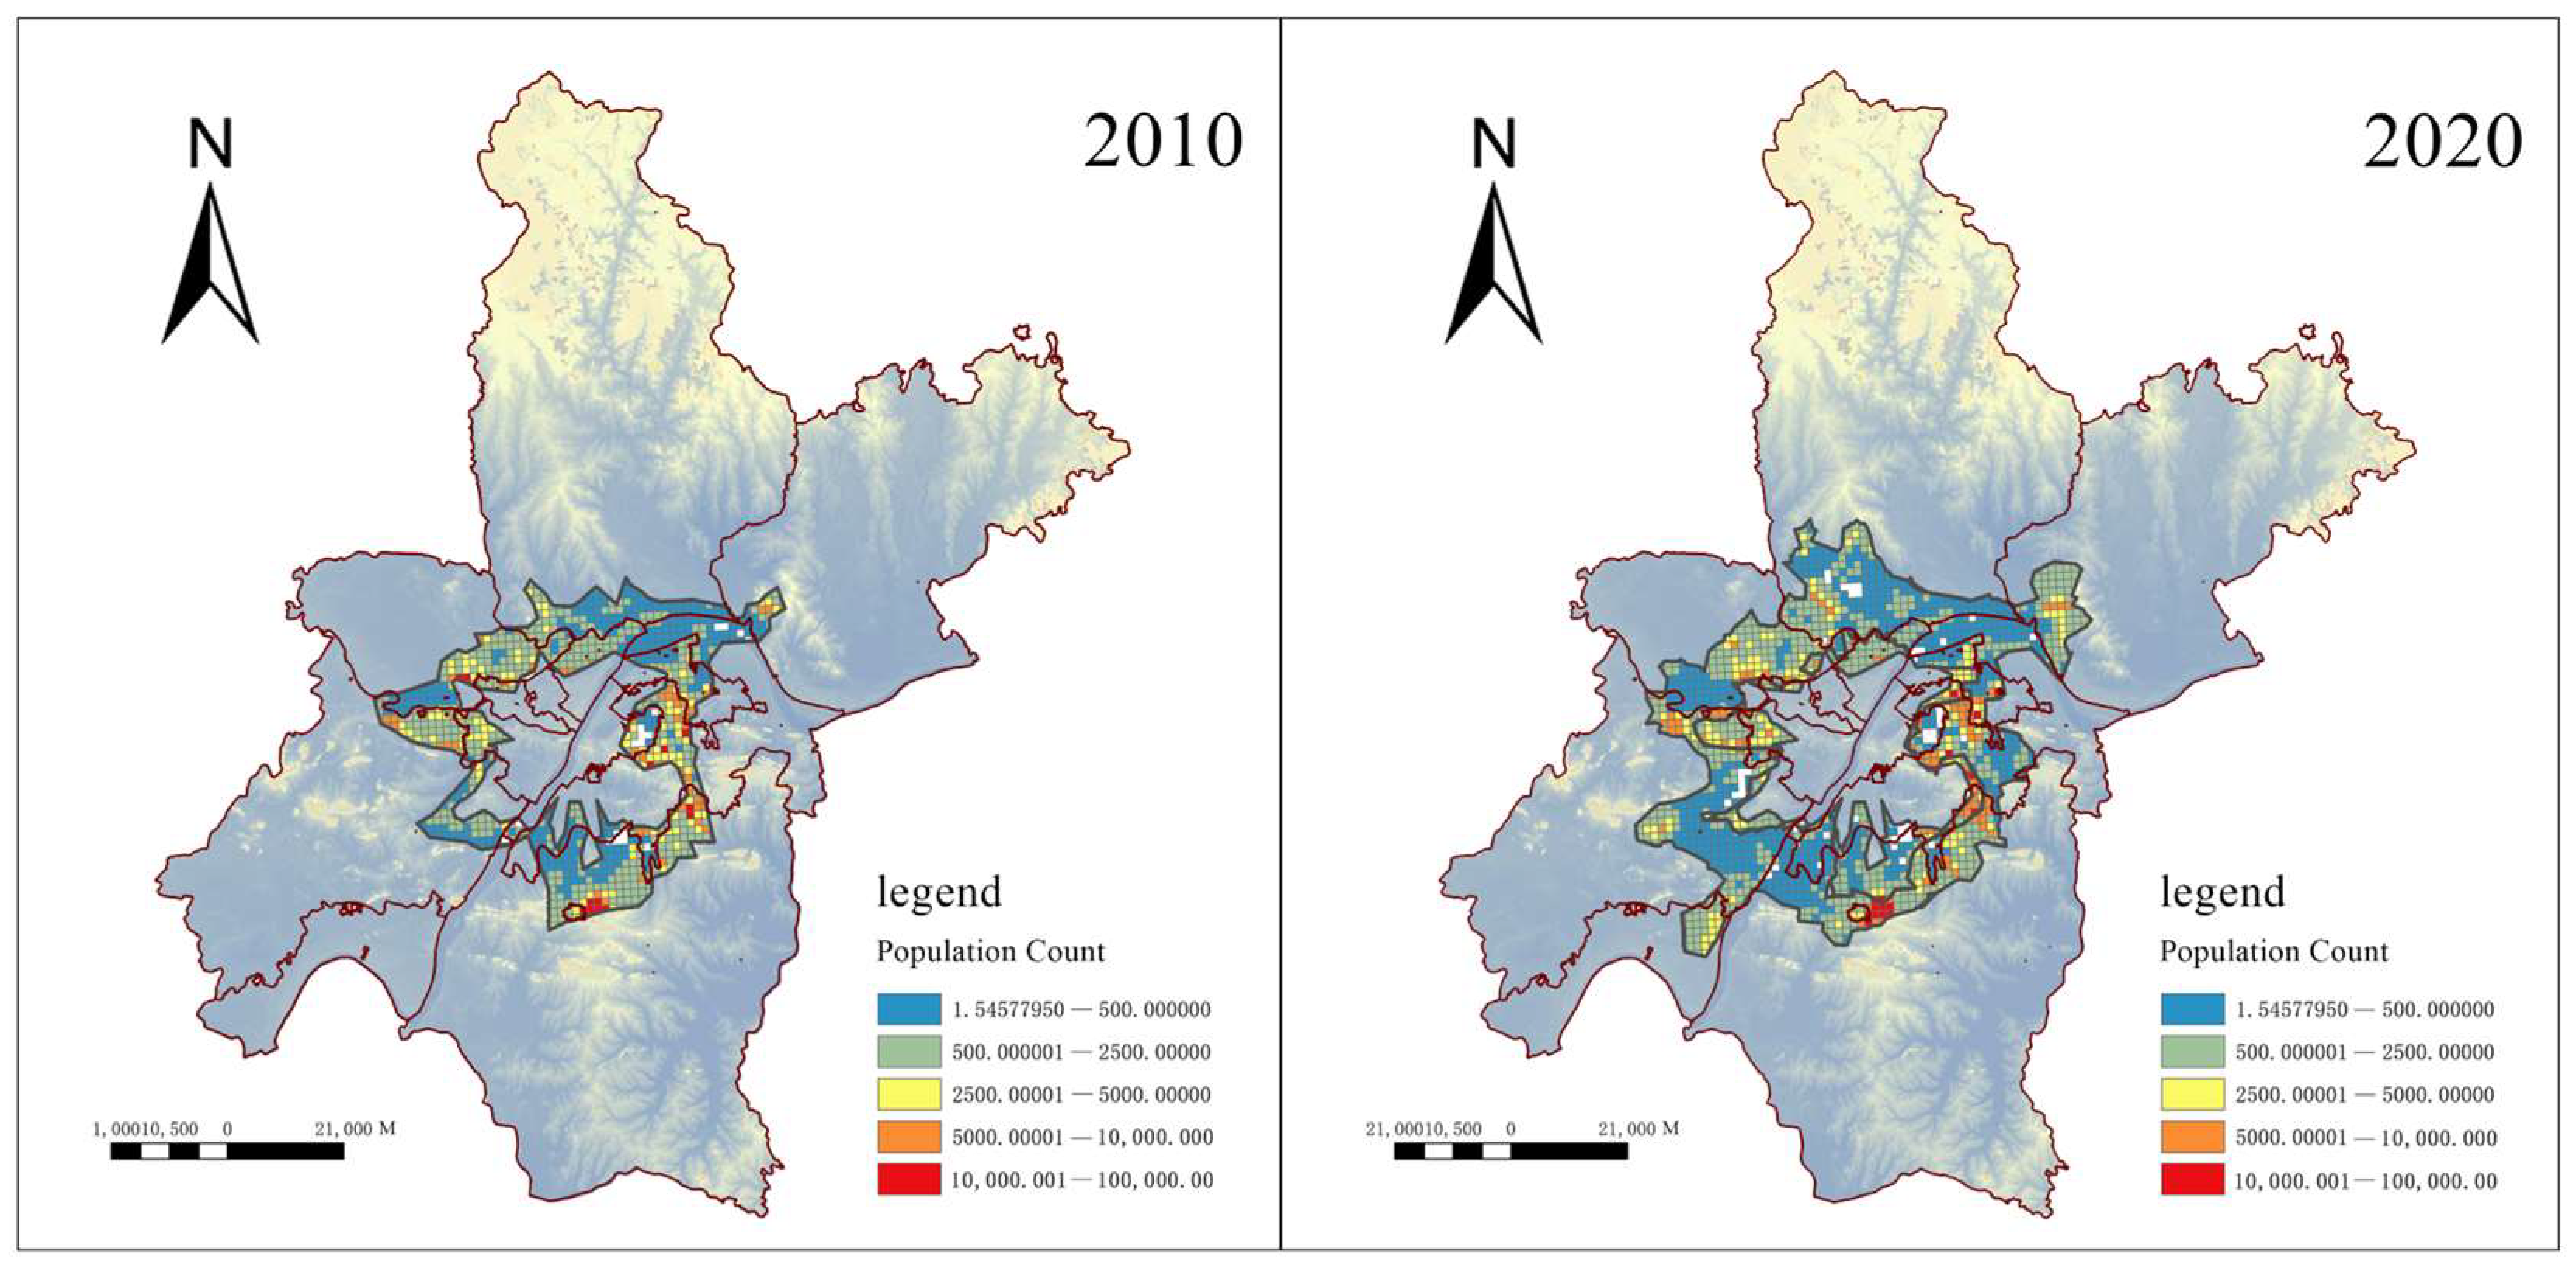
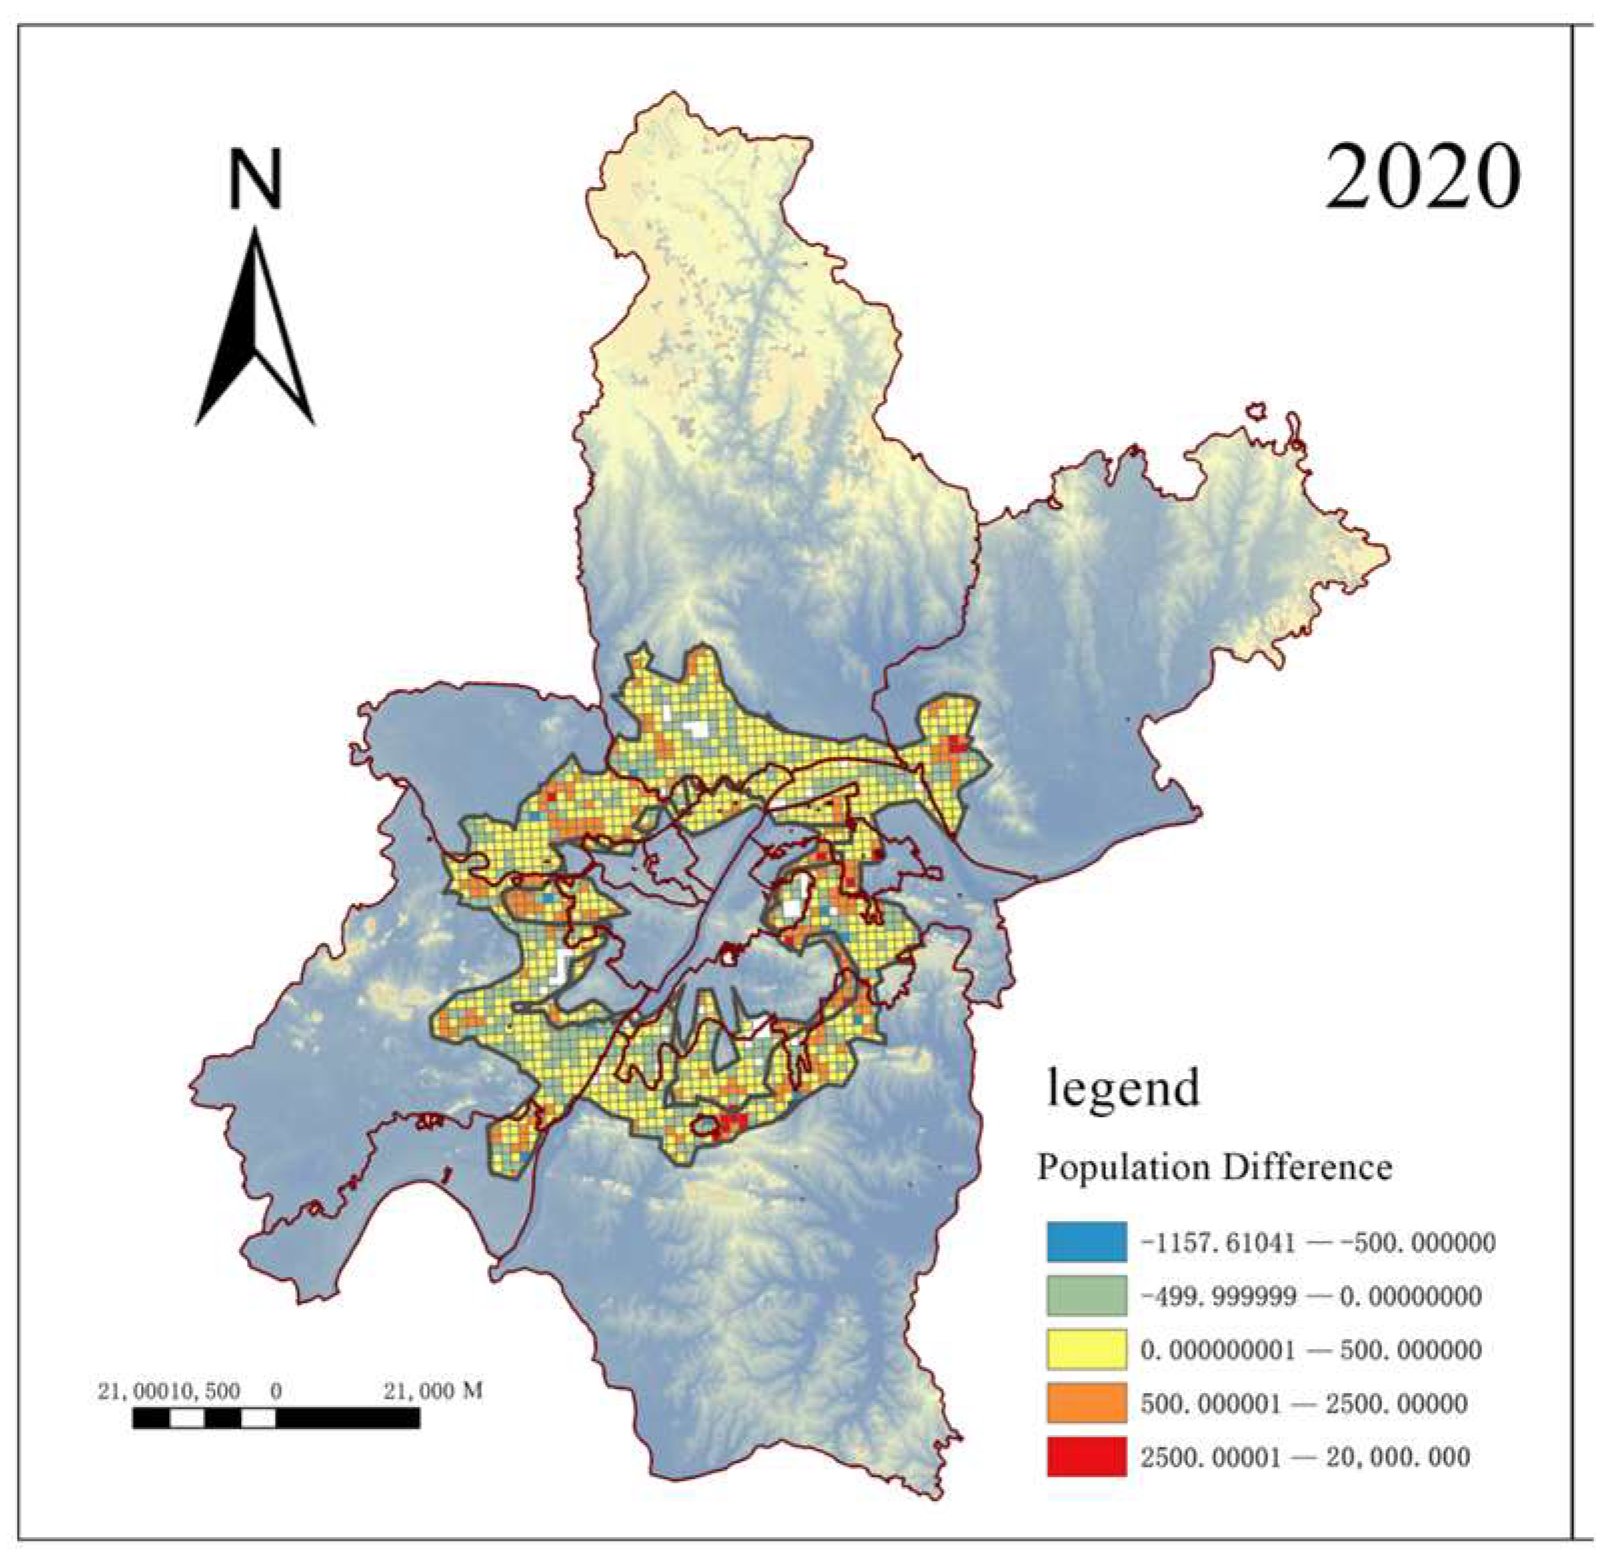
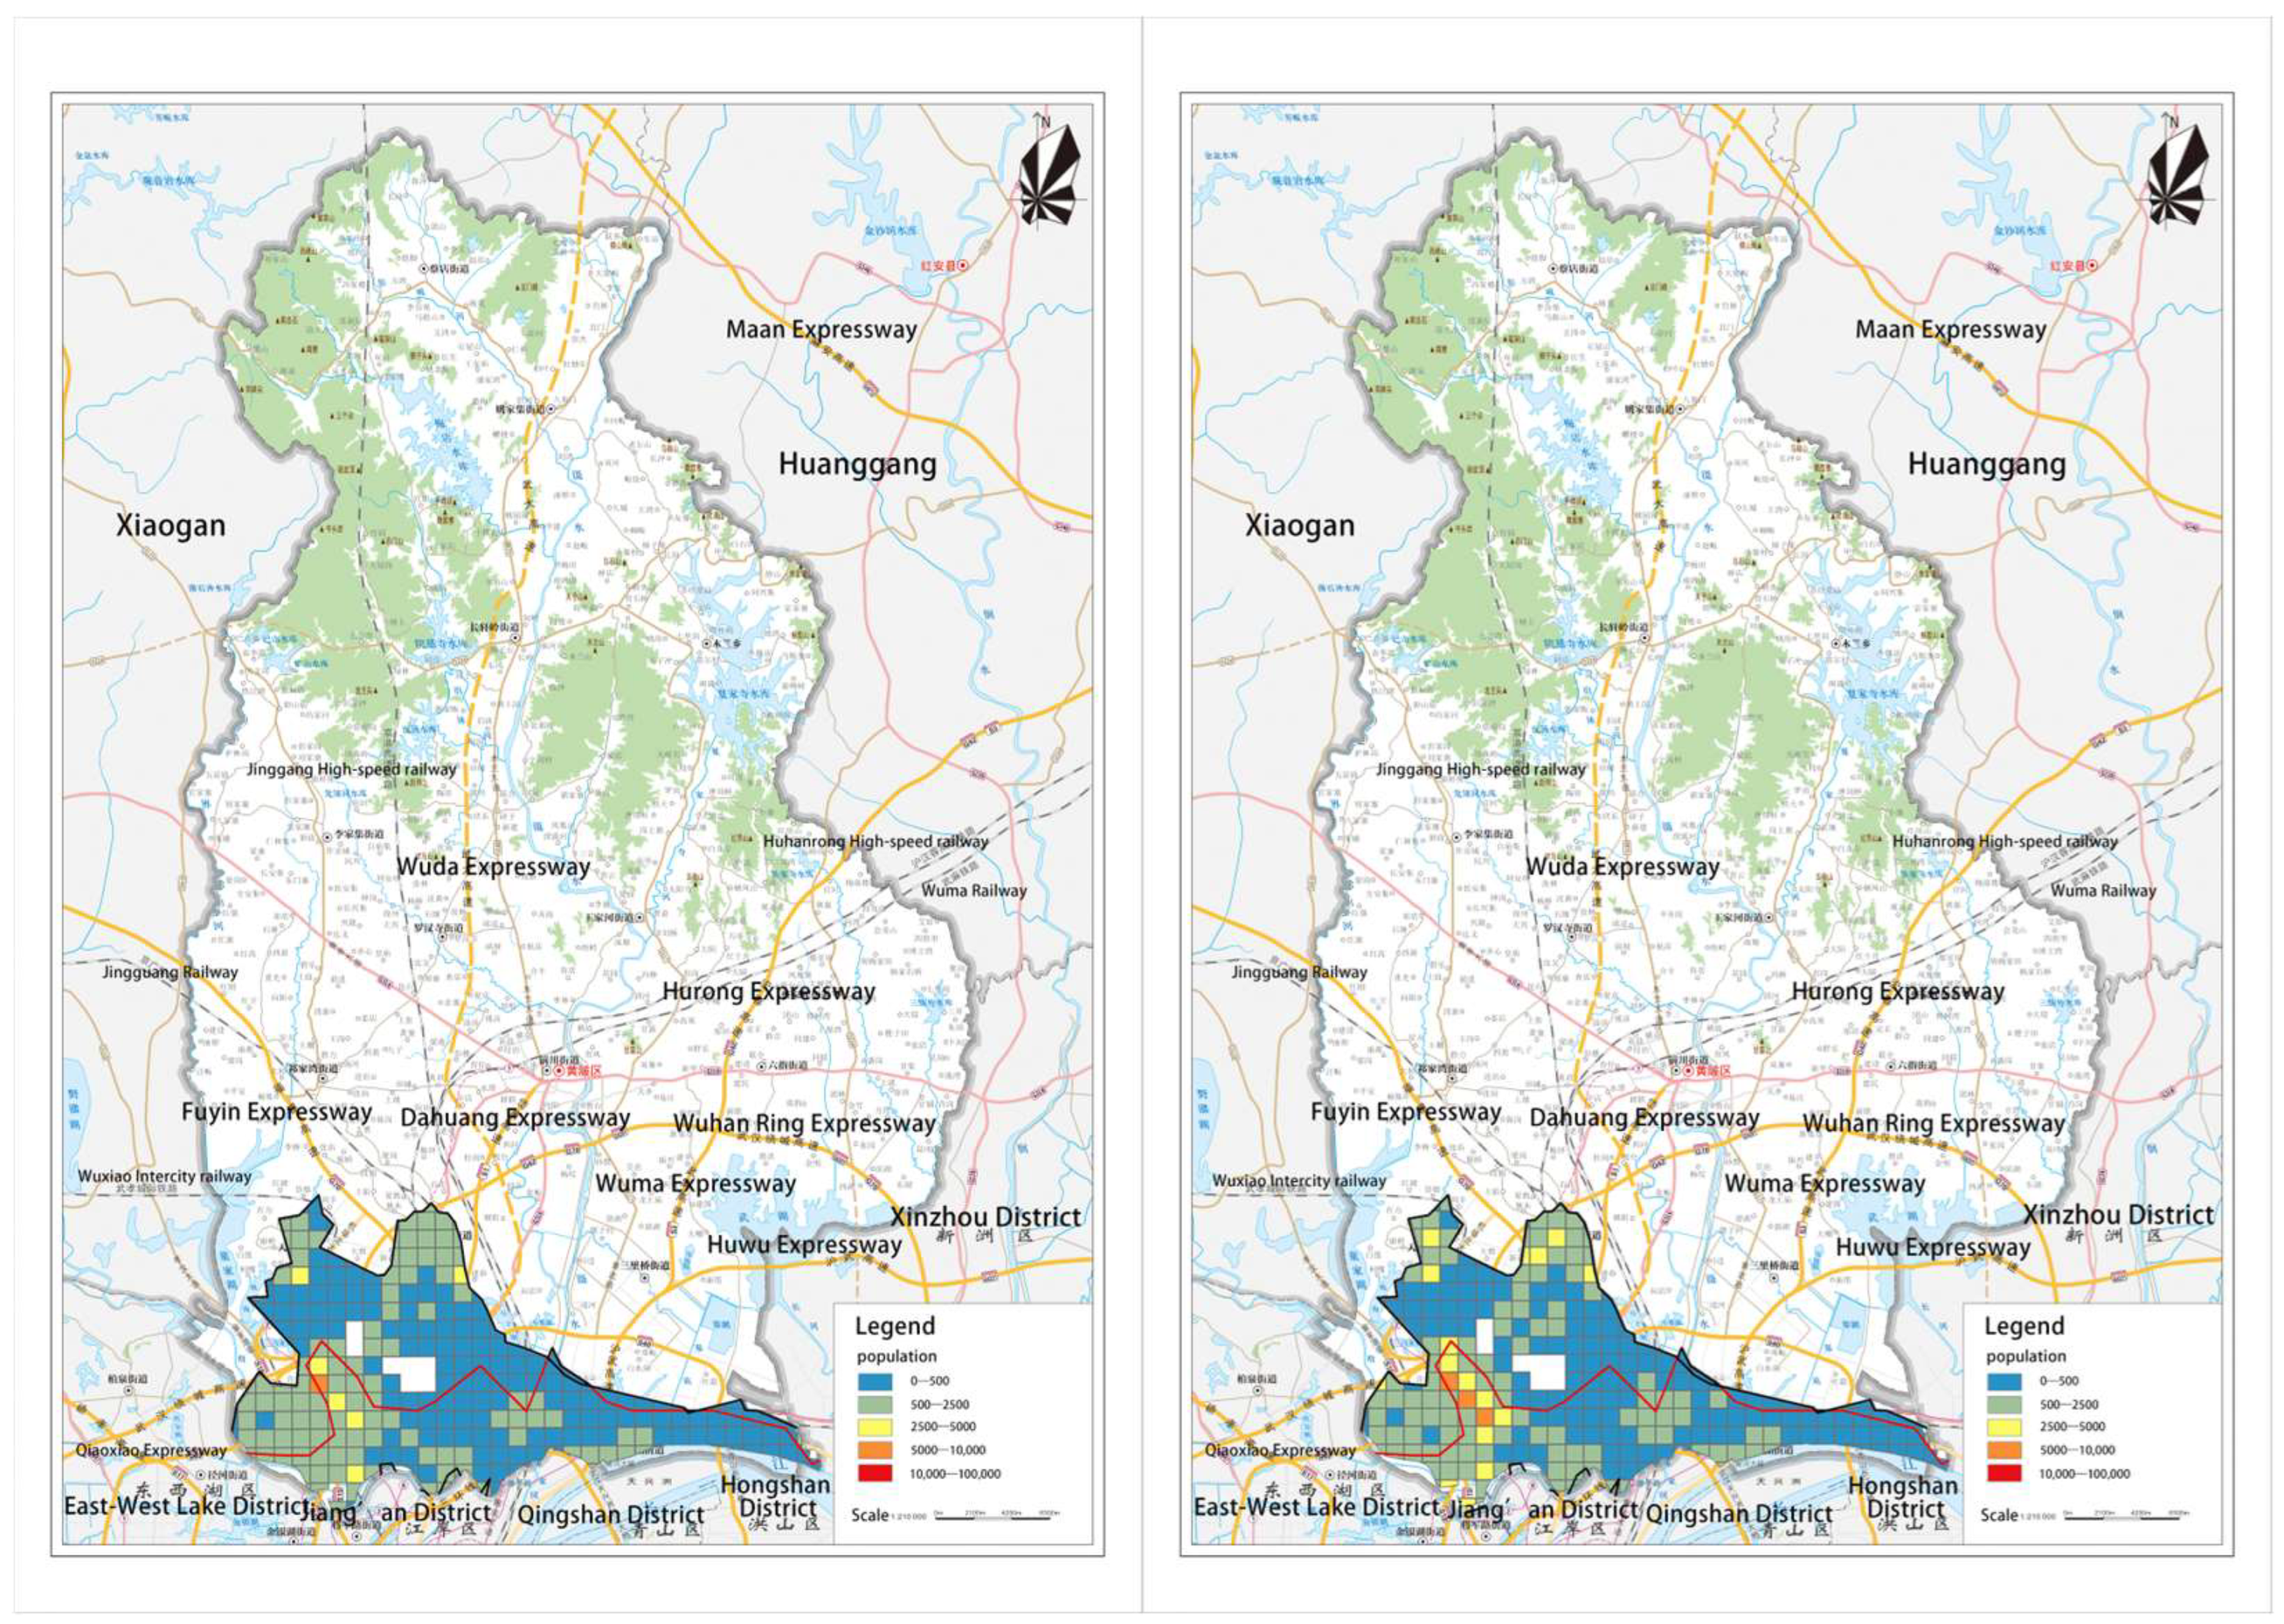
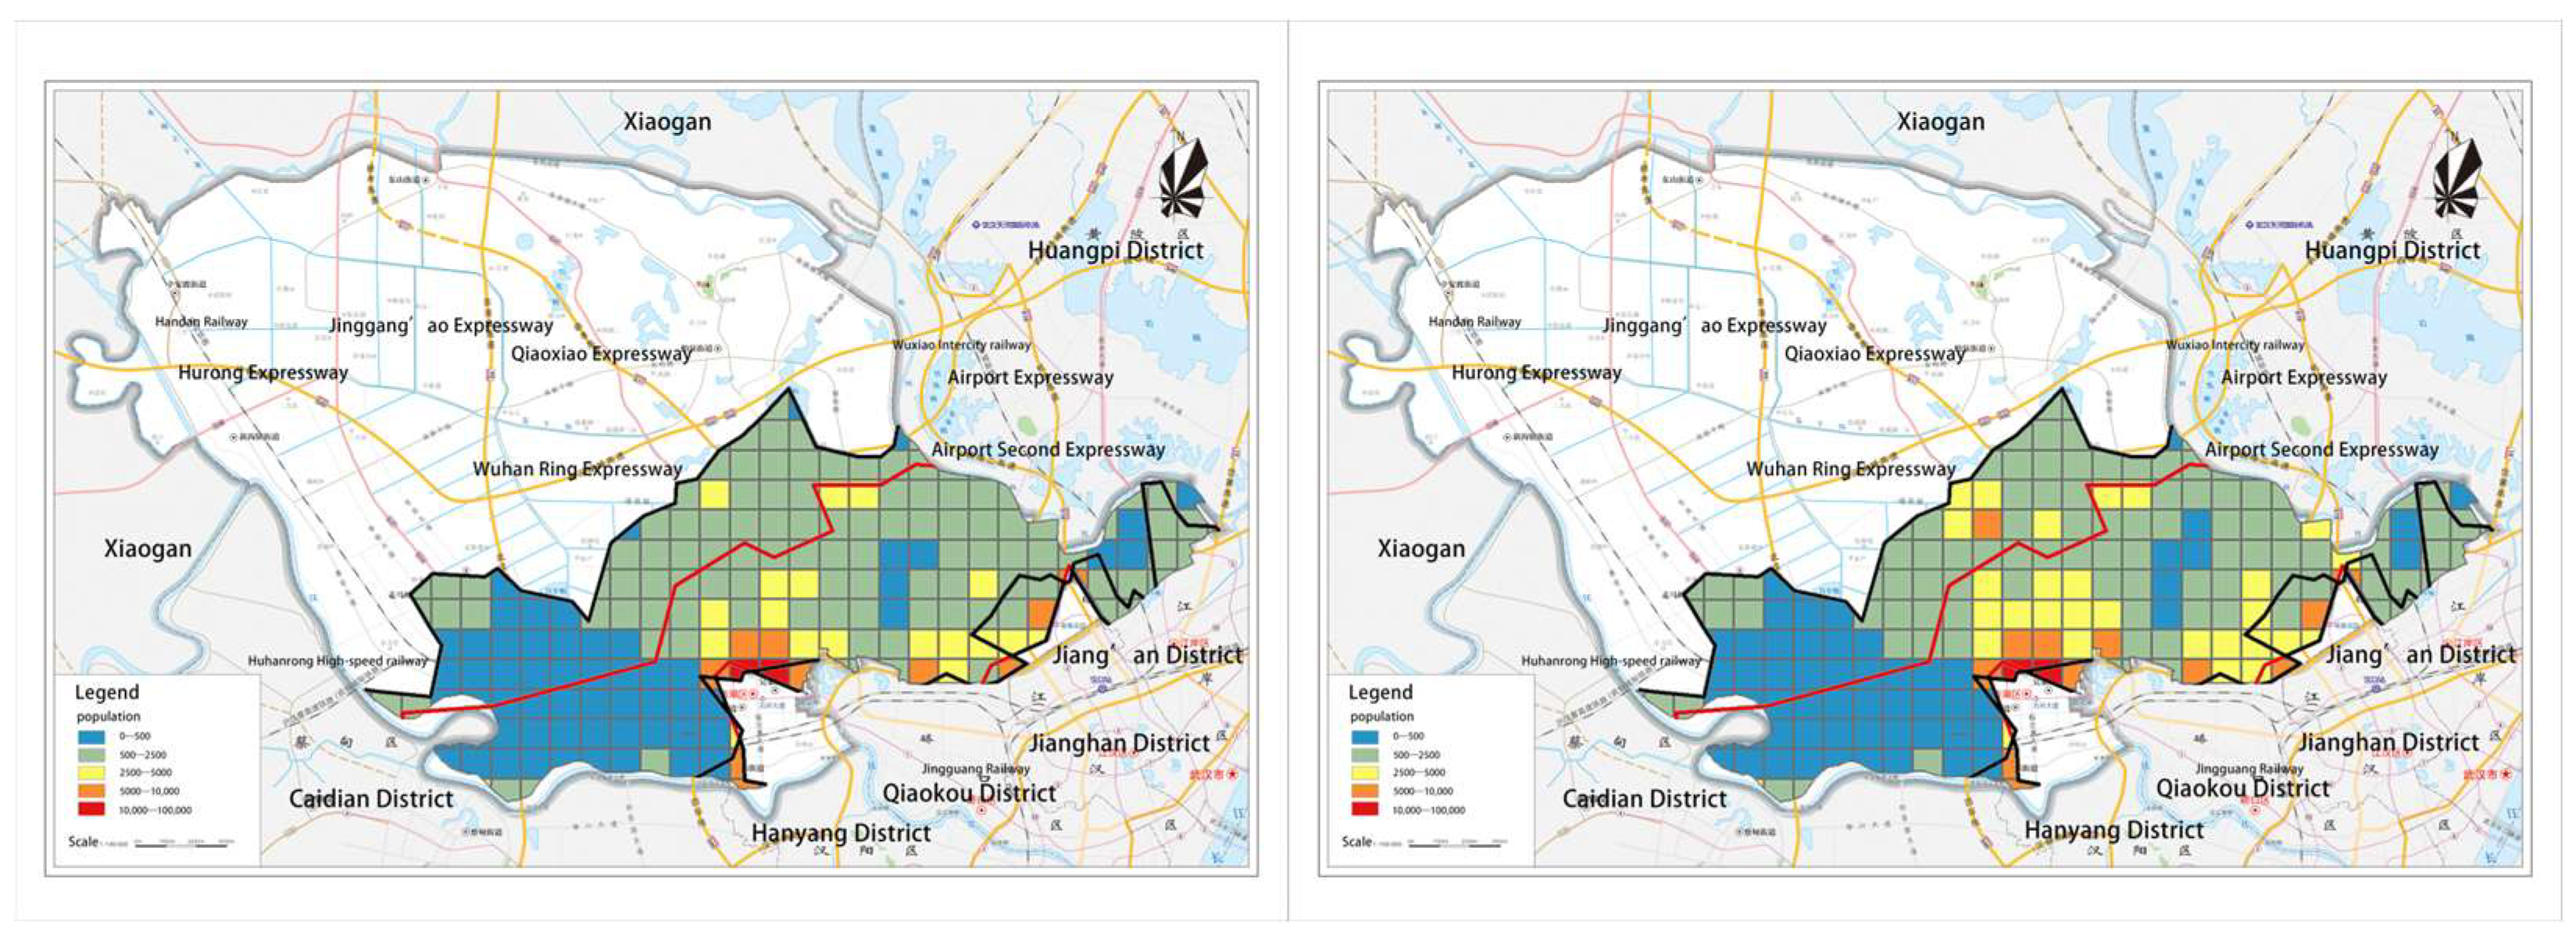
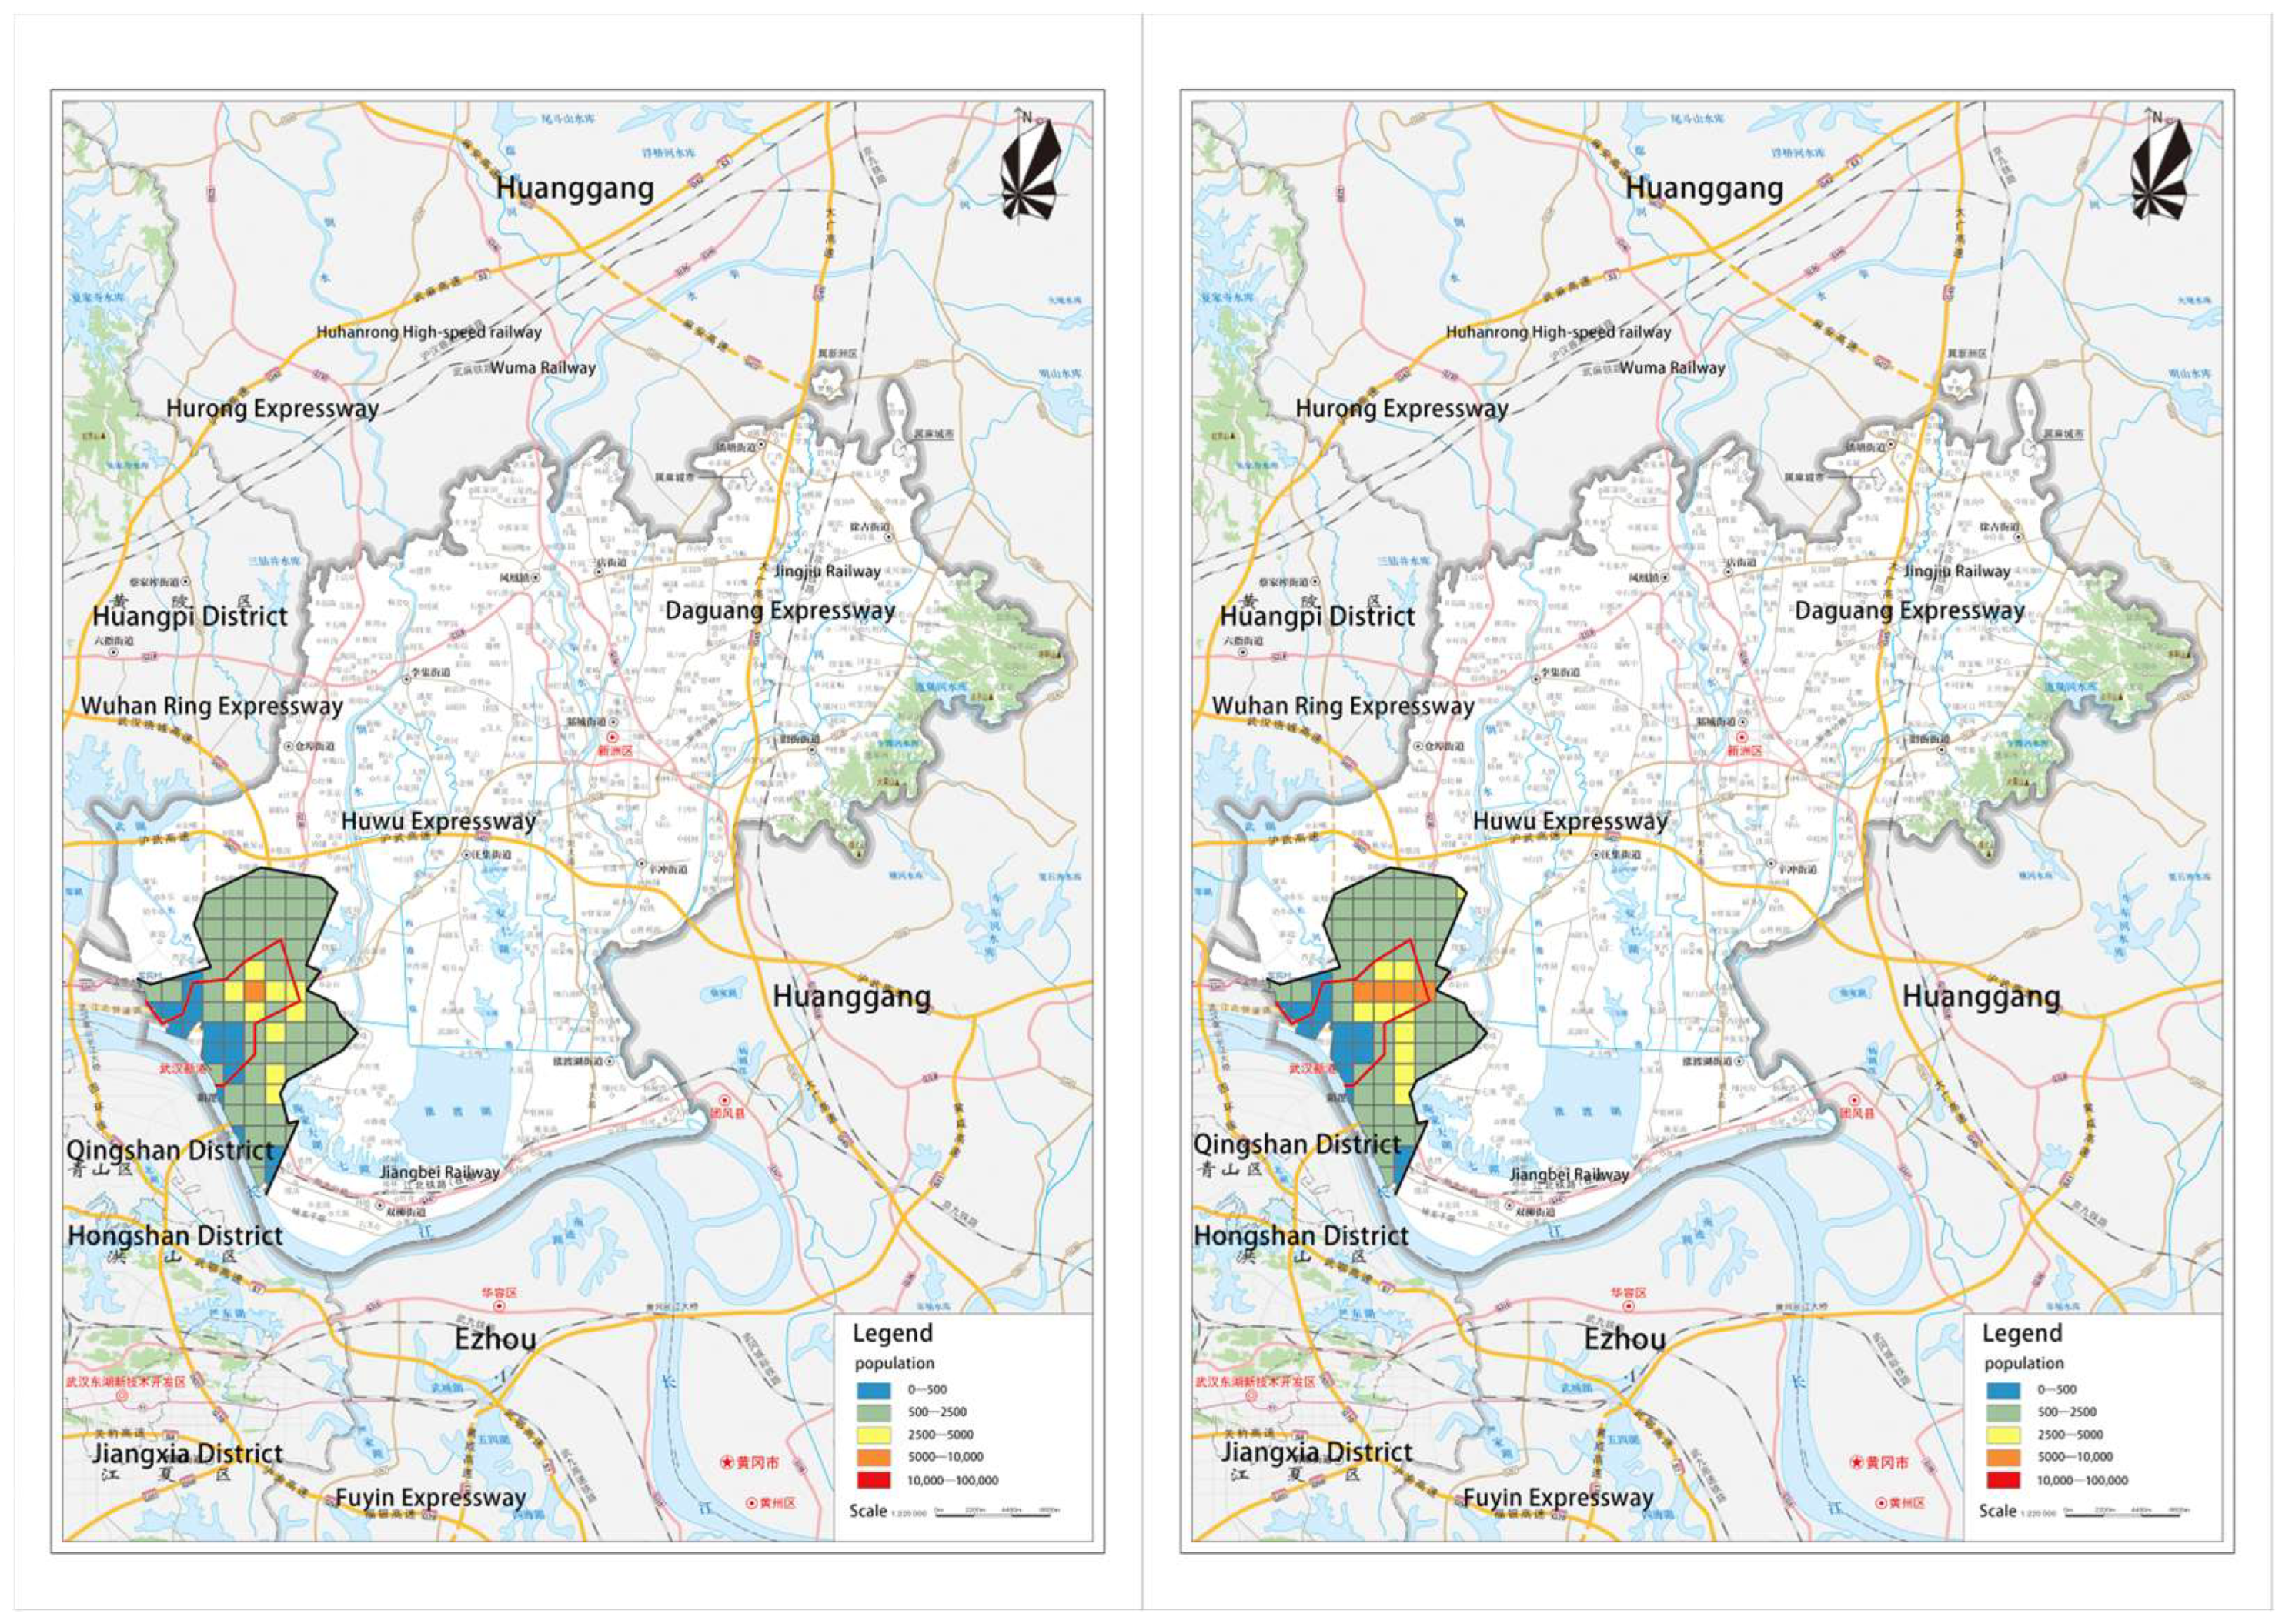
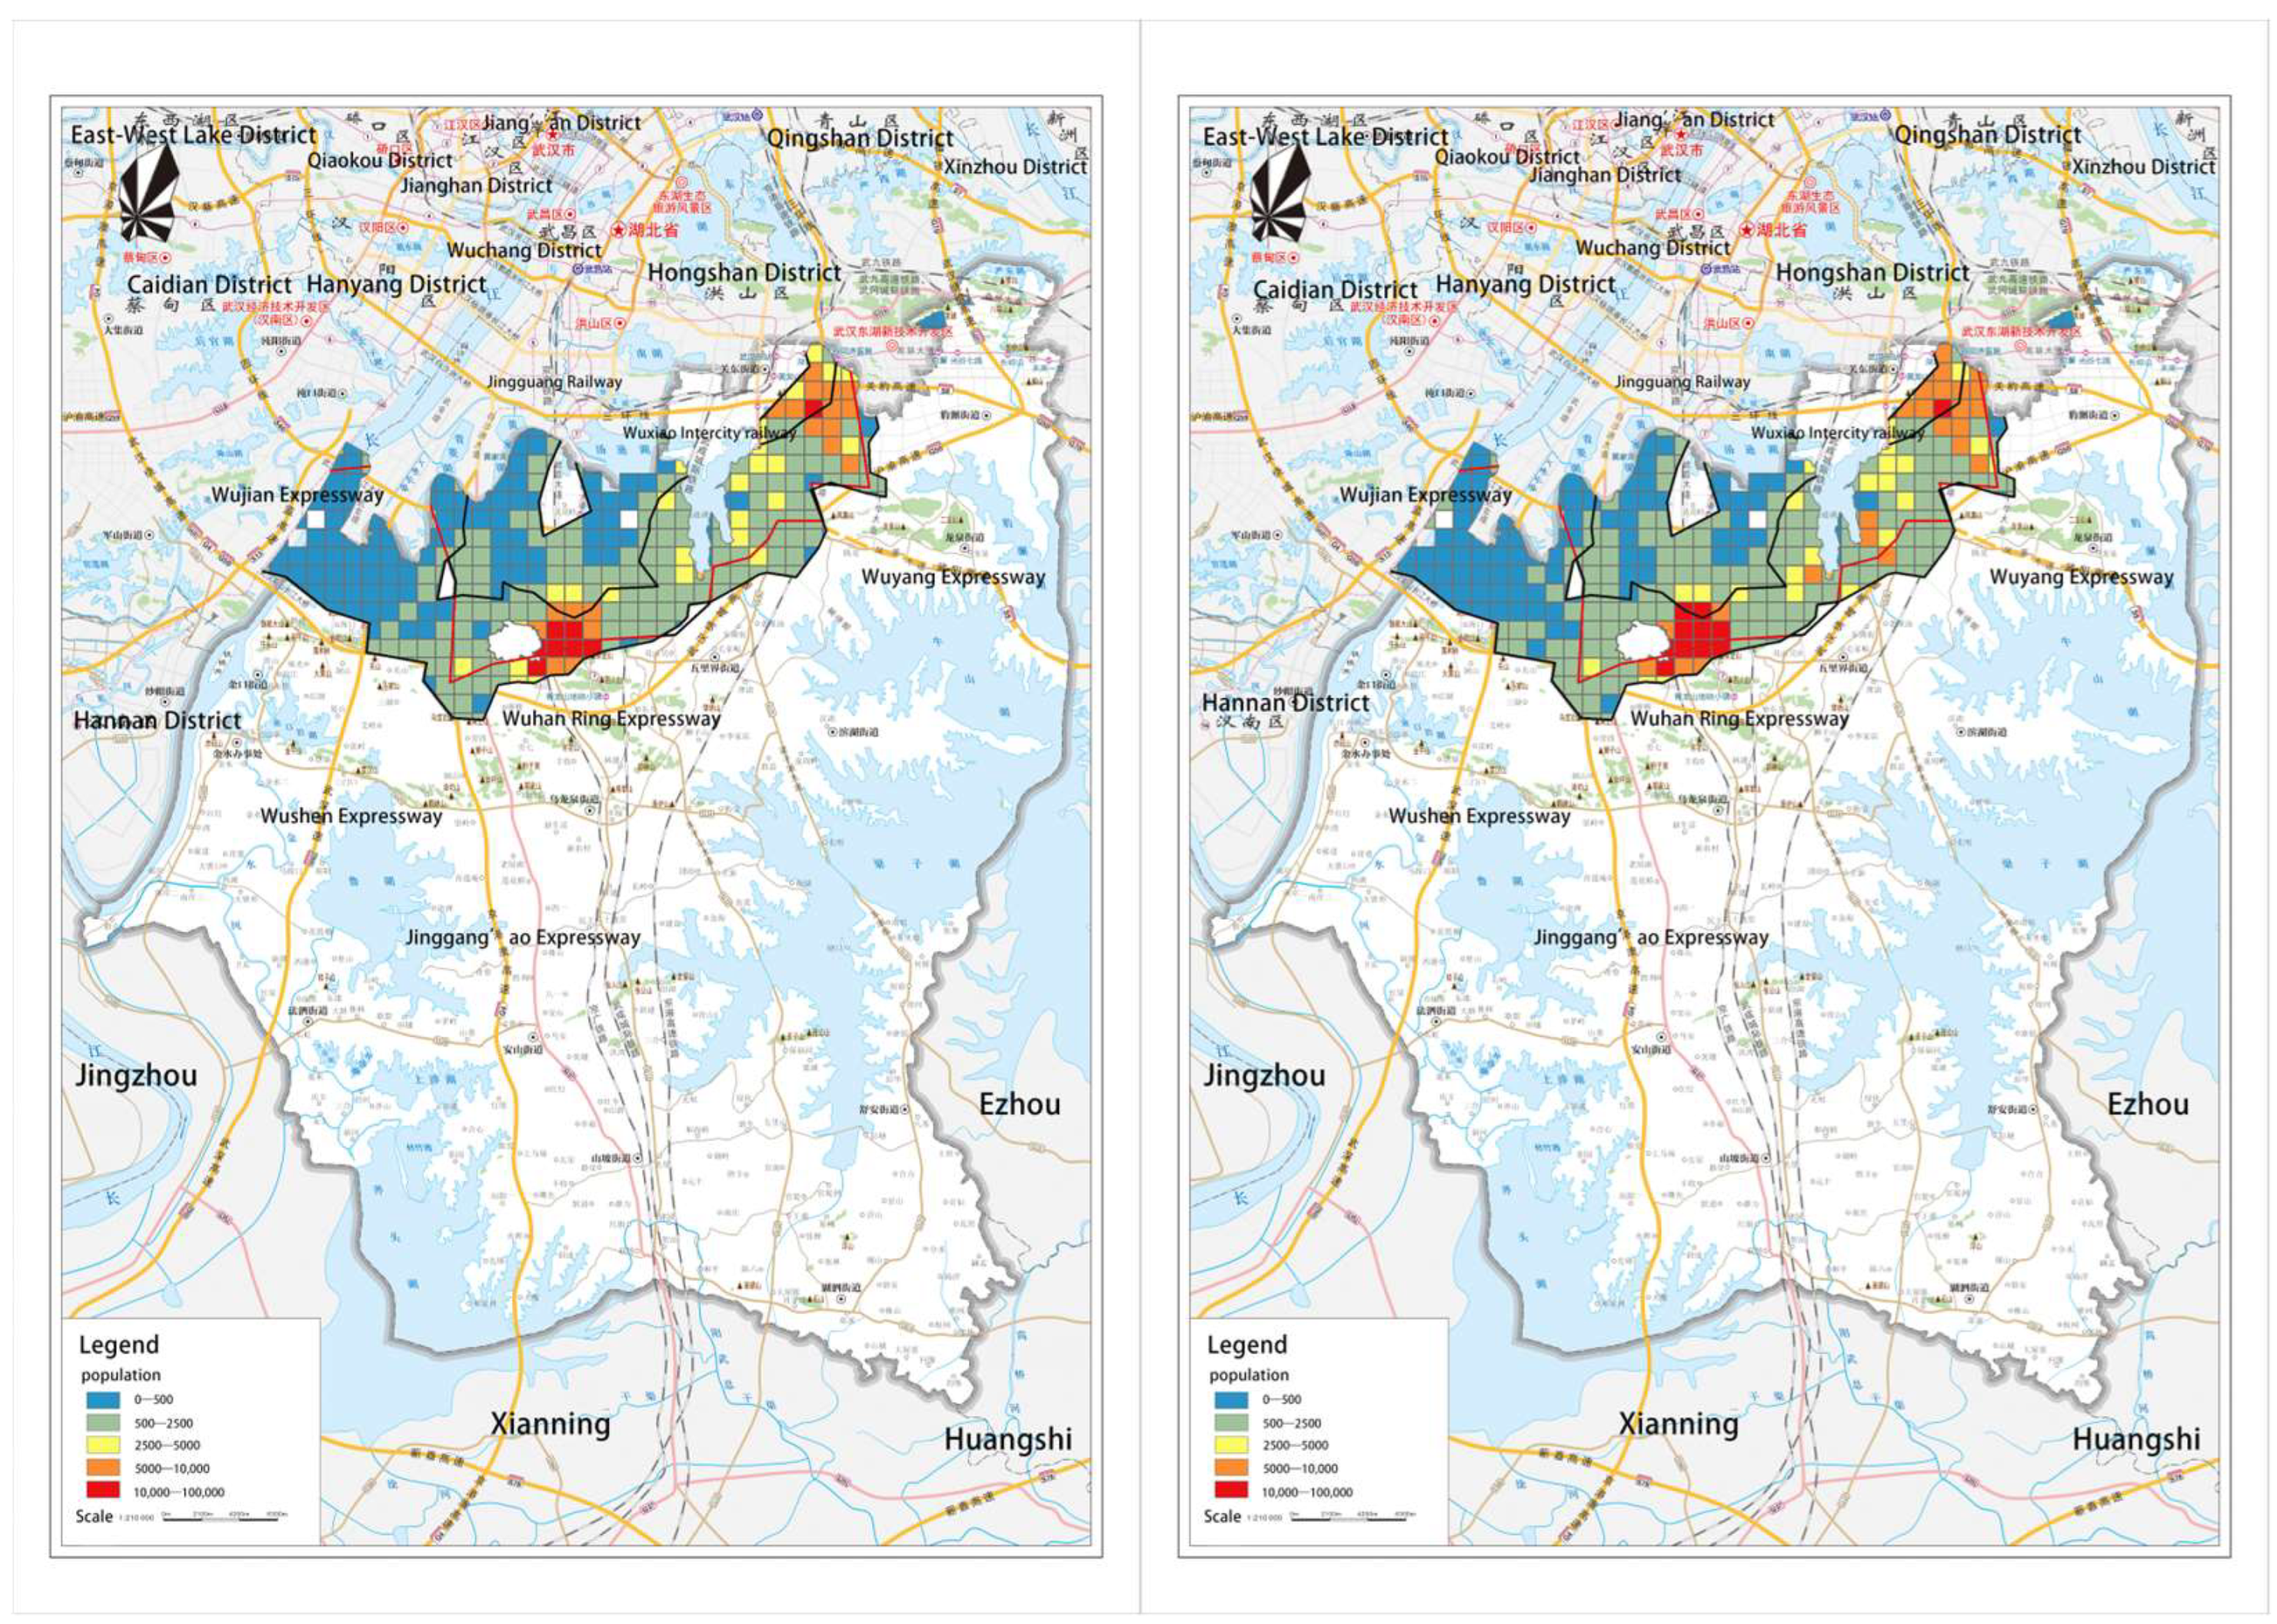
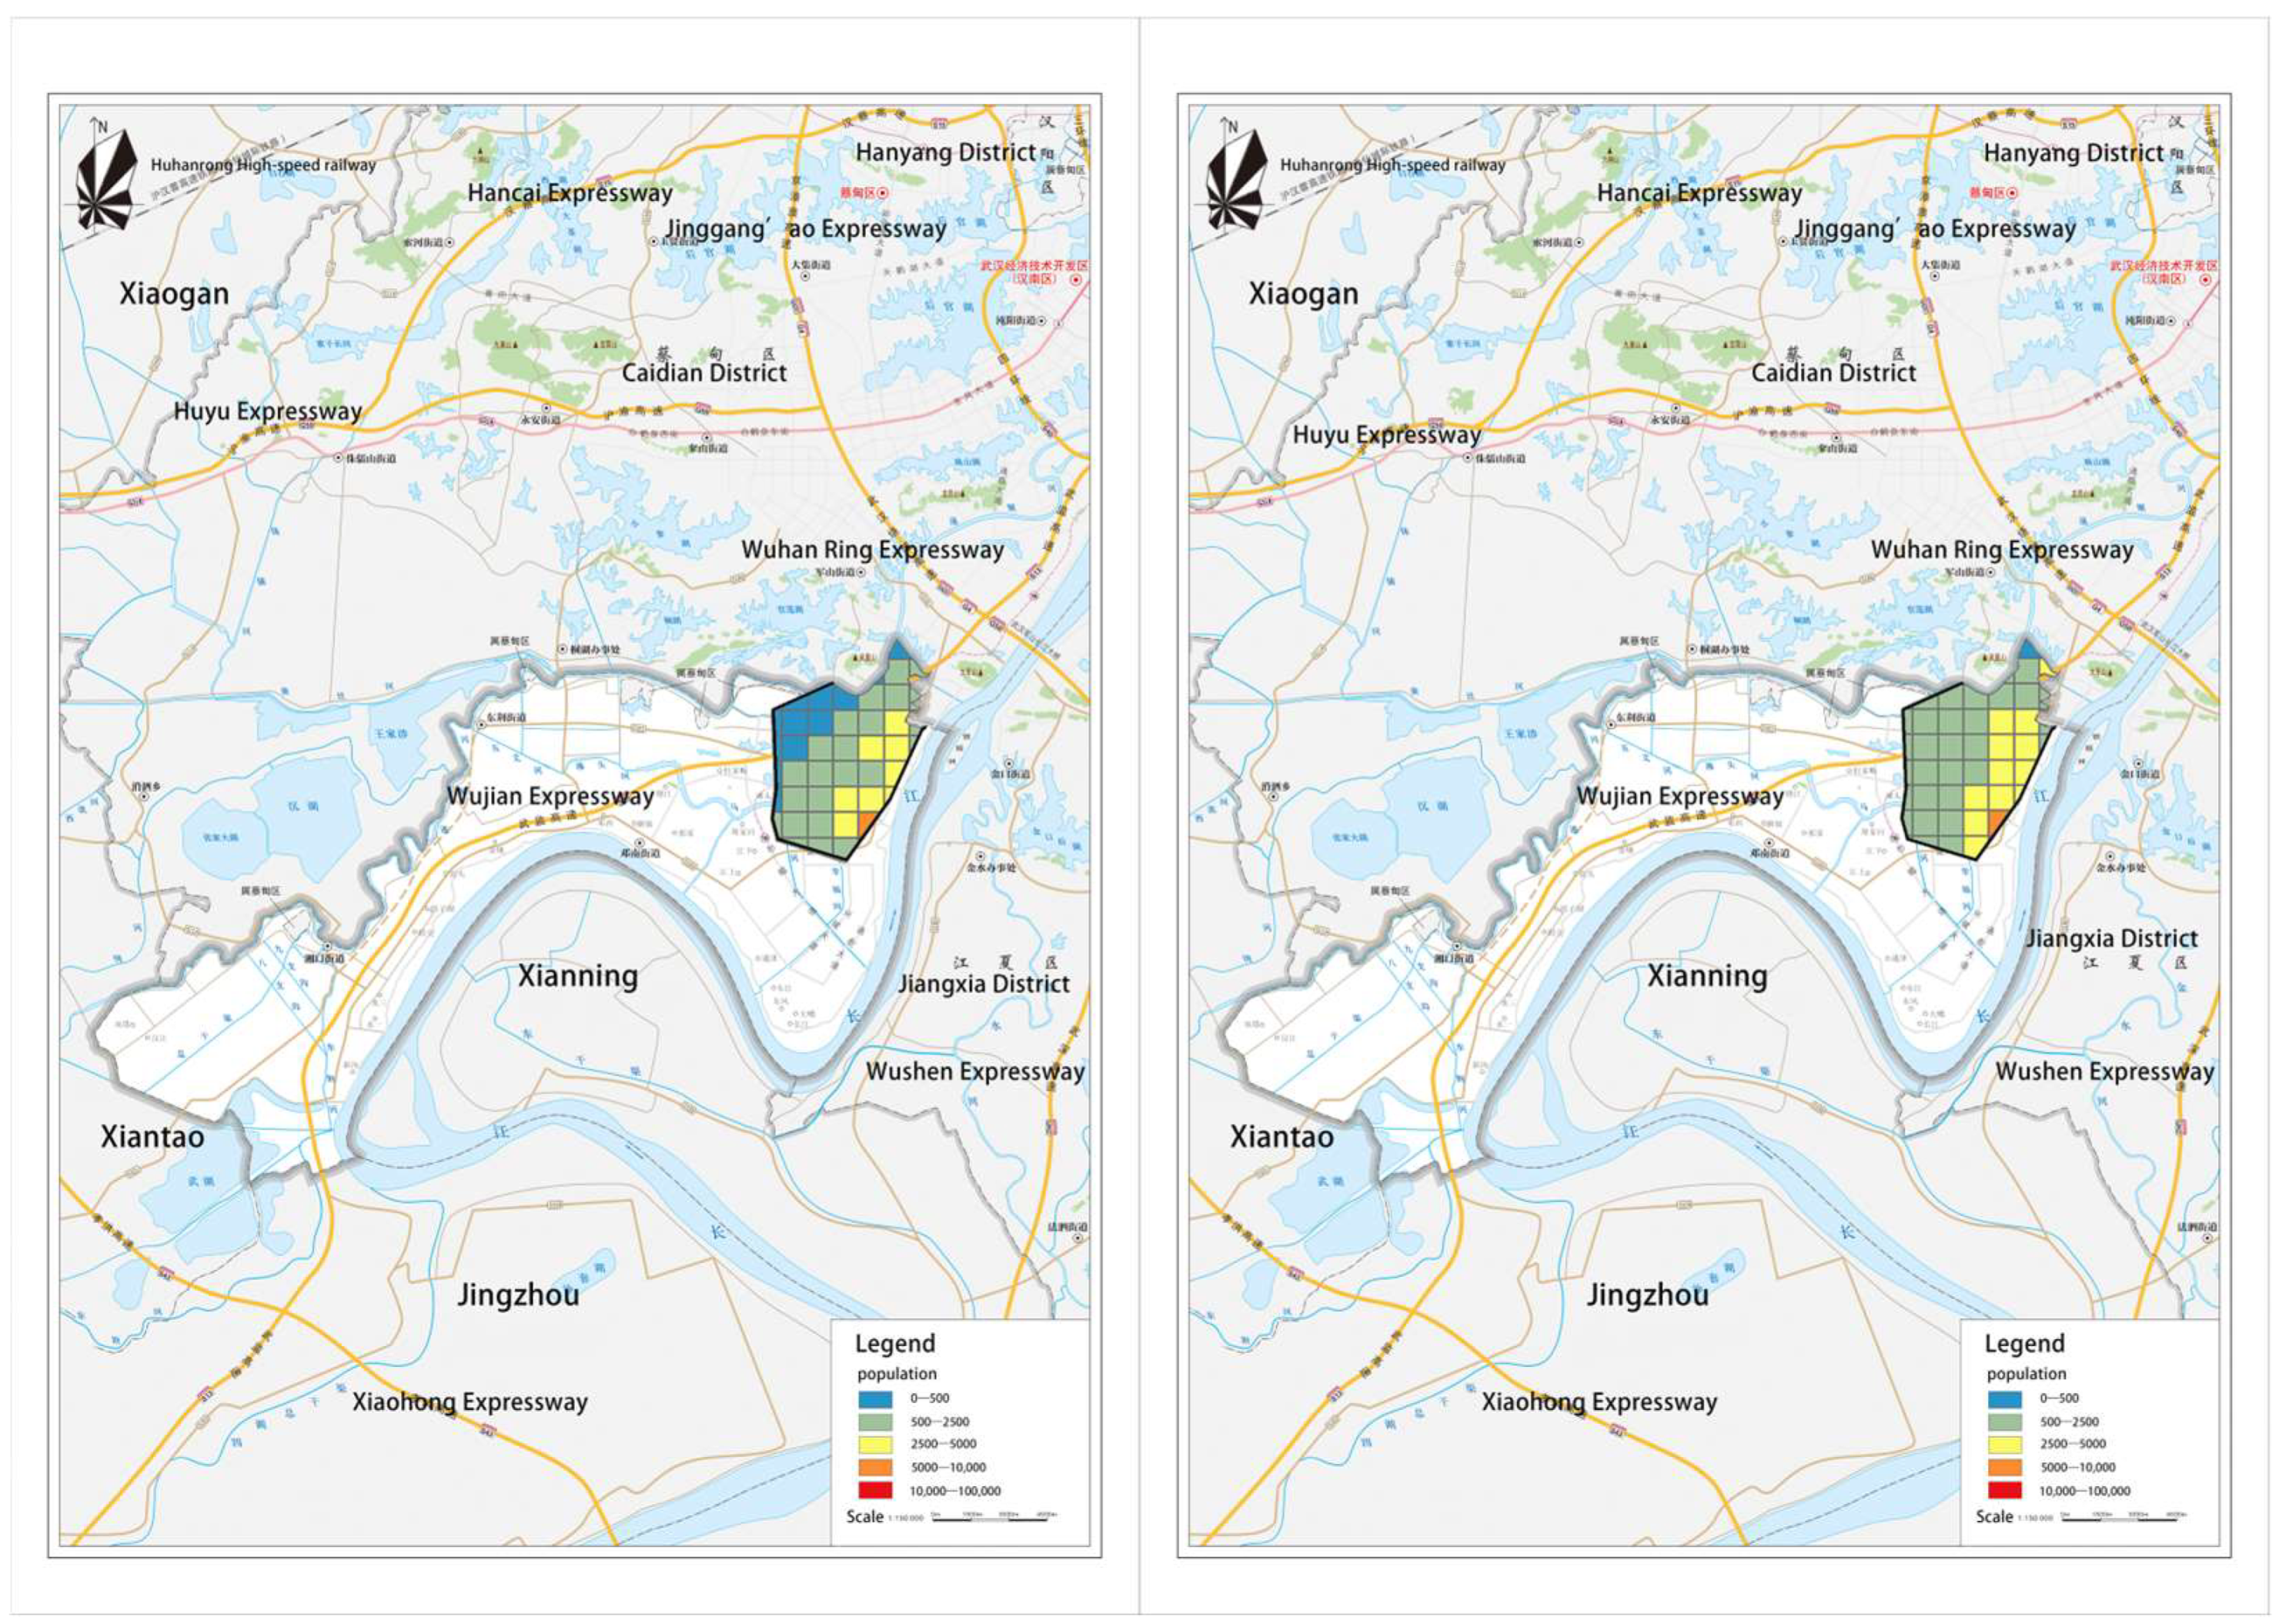
5.2. Spatial Patterns of Population in Urban Fringe Areas
5.3. Results and Analysis
5.3.1. Variable Screening
5.3.2. Model Results and Scale Analysis
5.4. Interpretation of Results and Planning Recommendations
5.4.1. Global Impact Factors Built Environment and Population Linkage Analysis
5.4.2. Global Impact Factors Built Environment and Population Linkage Analysis
- (1)
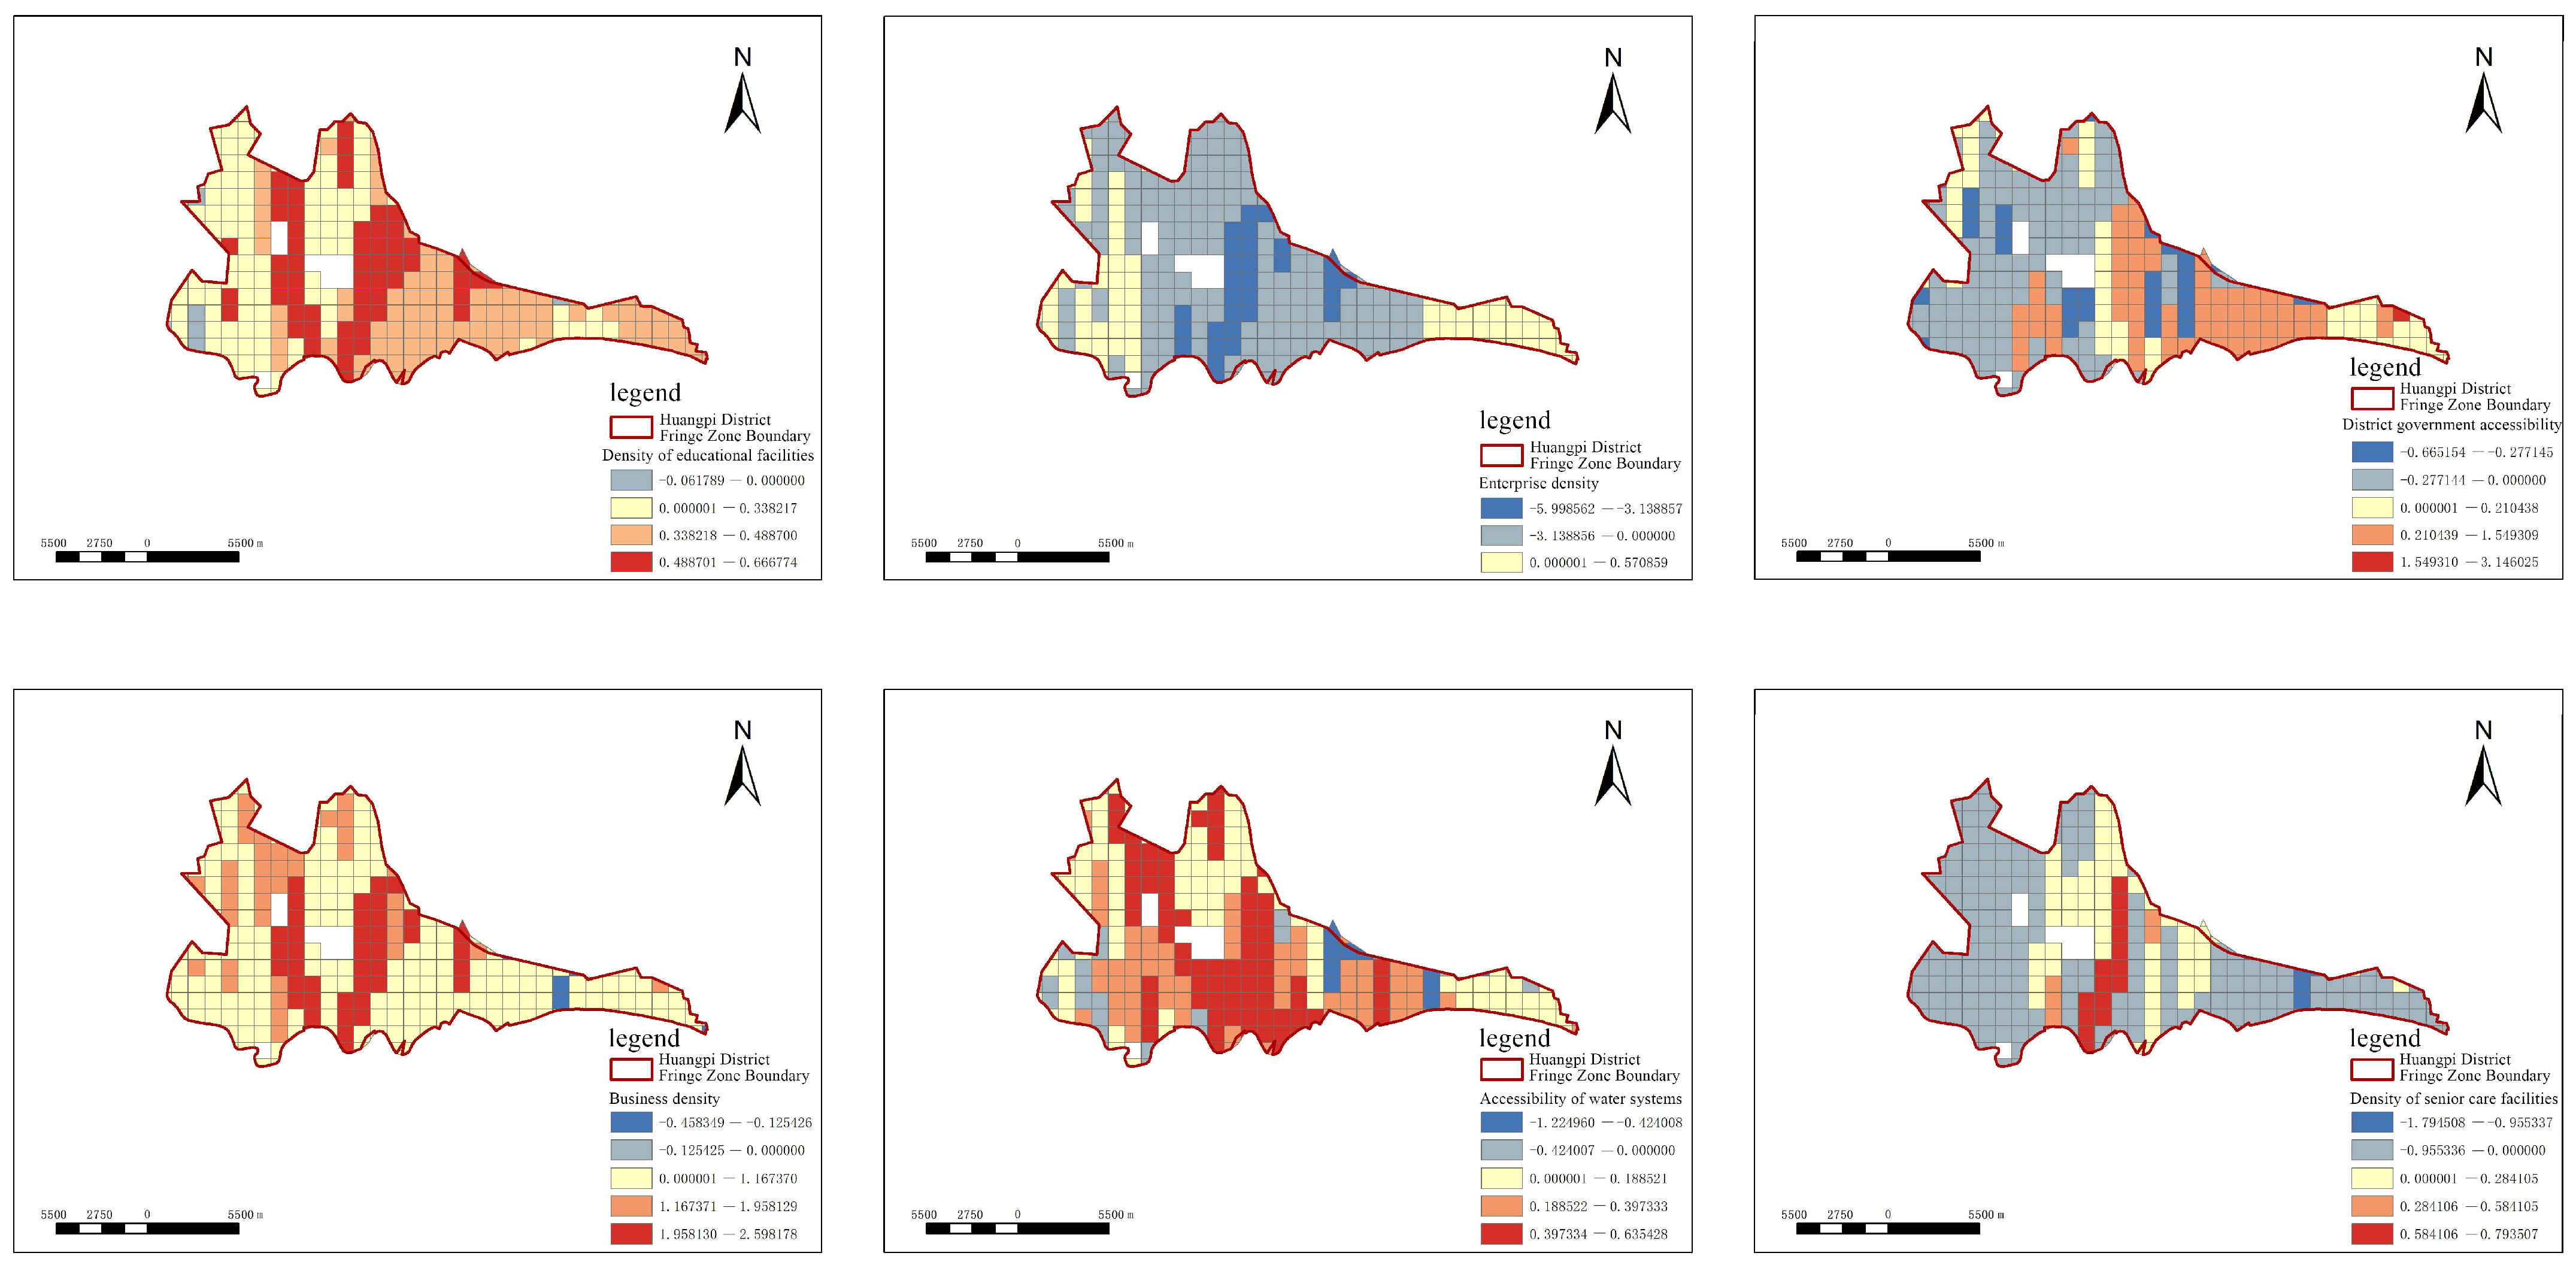
- Huangpi District
- (2)
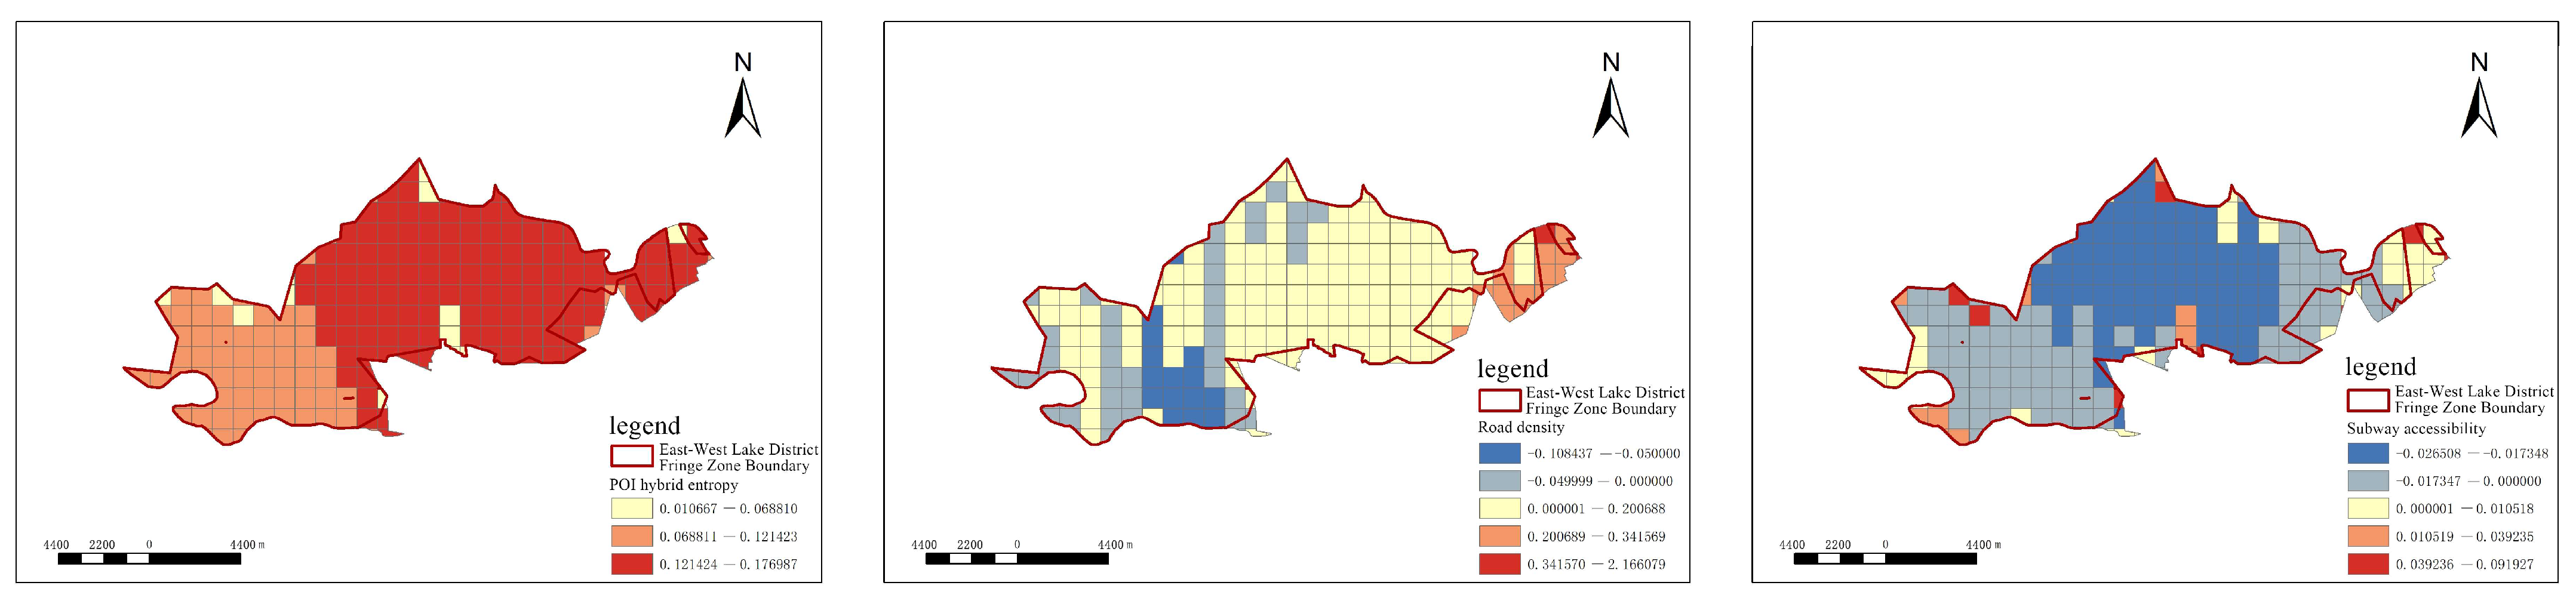
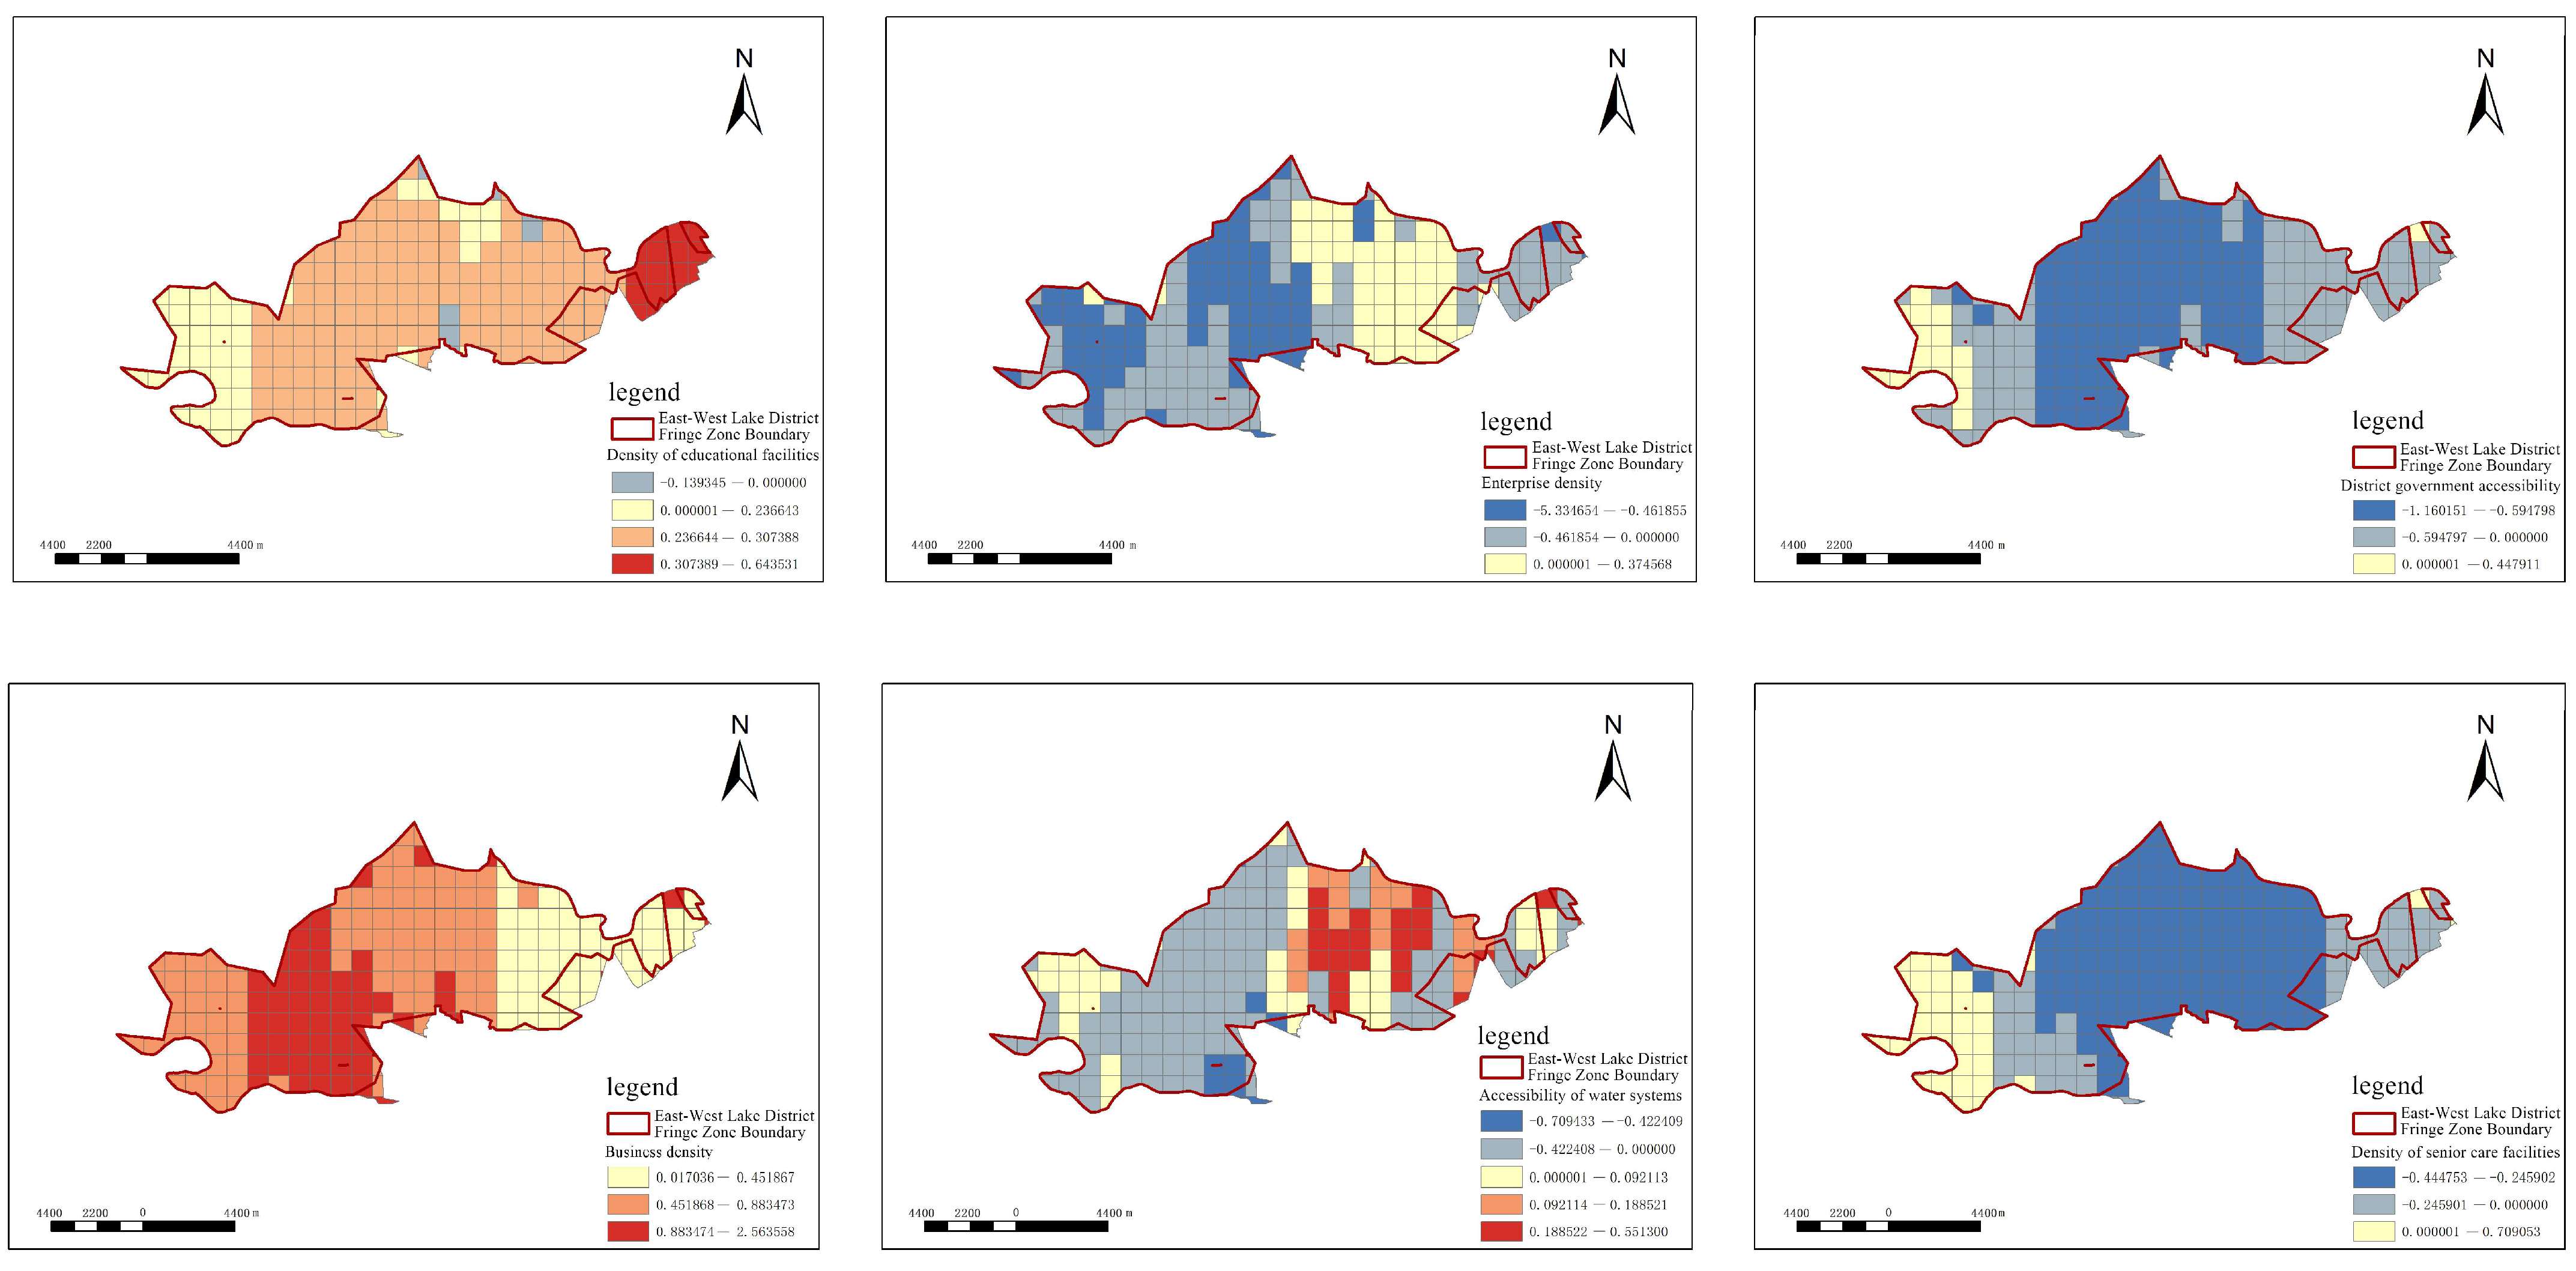
- East–West Lake District
- (3)
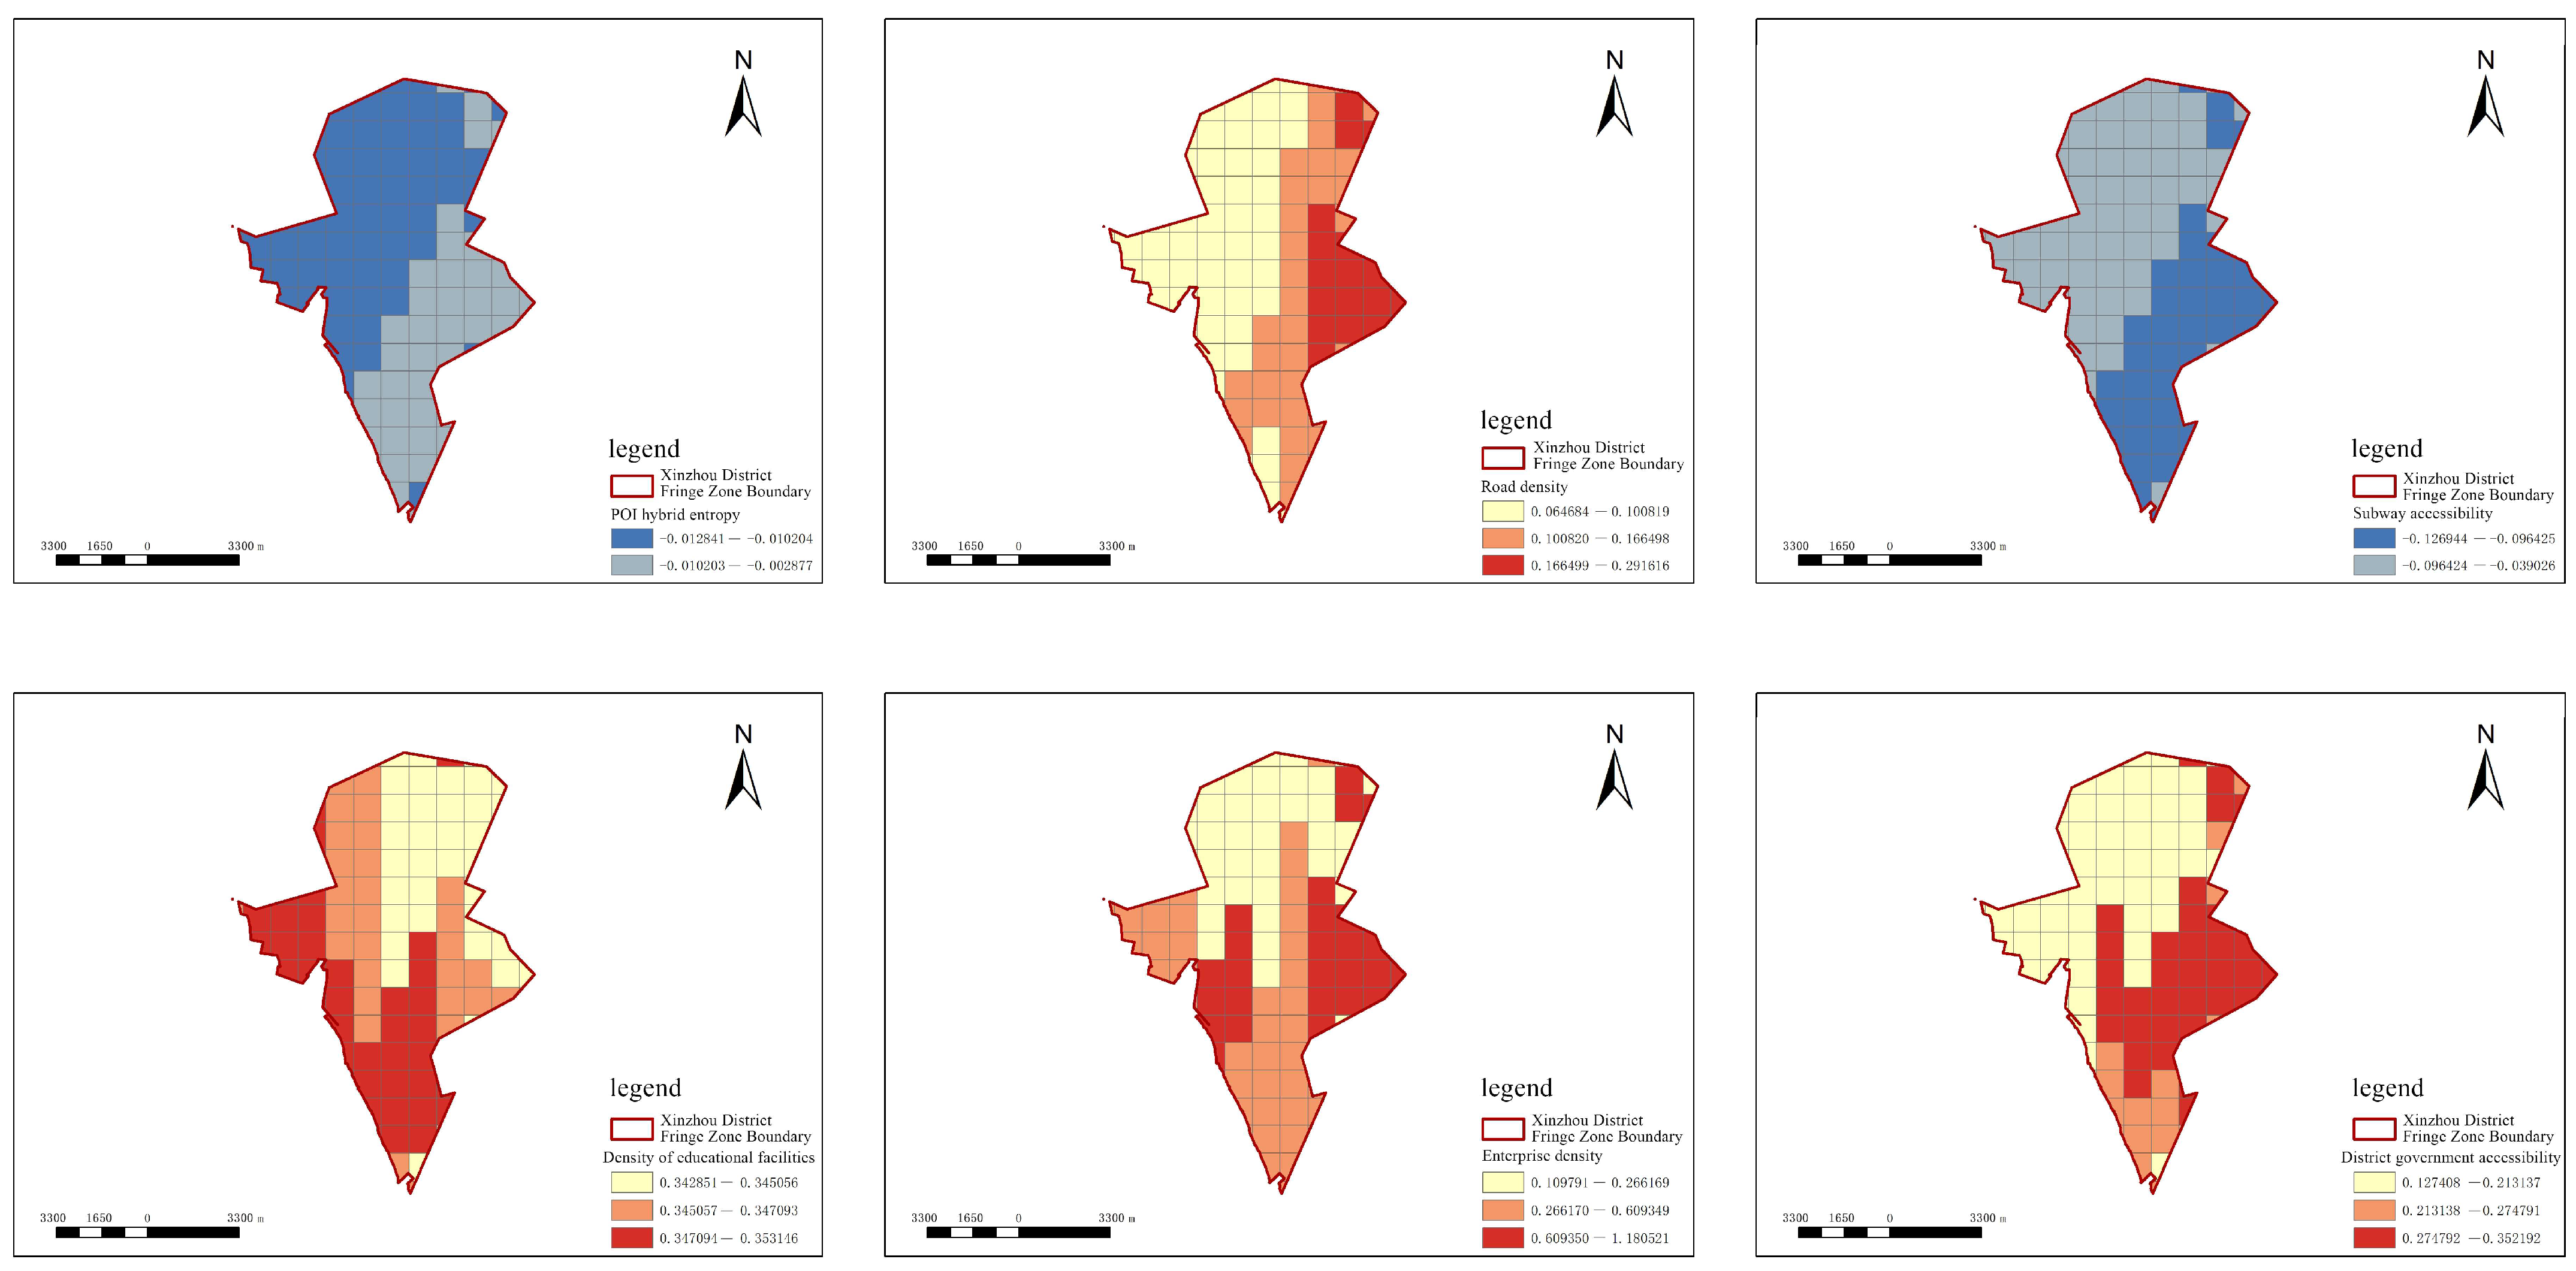
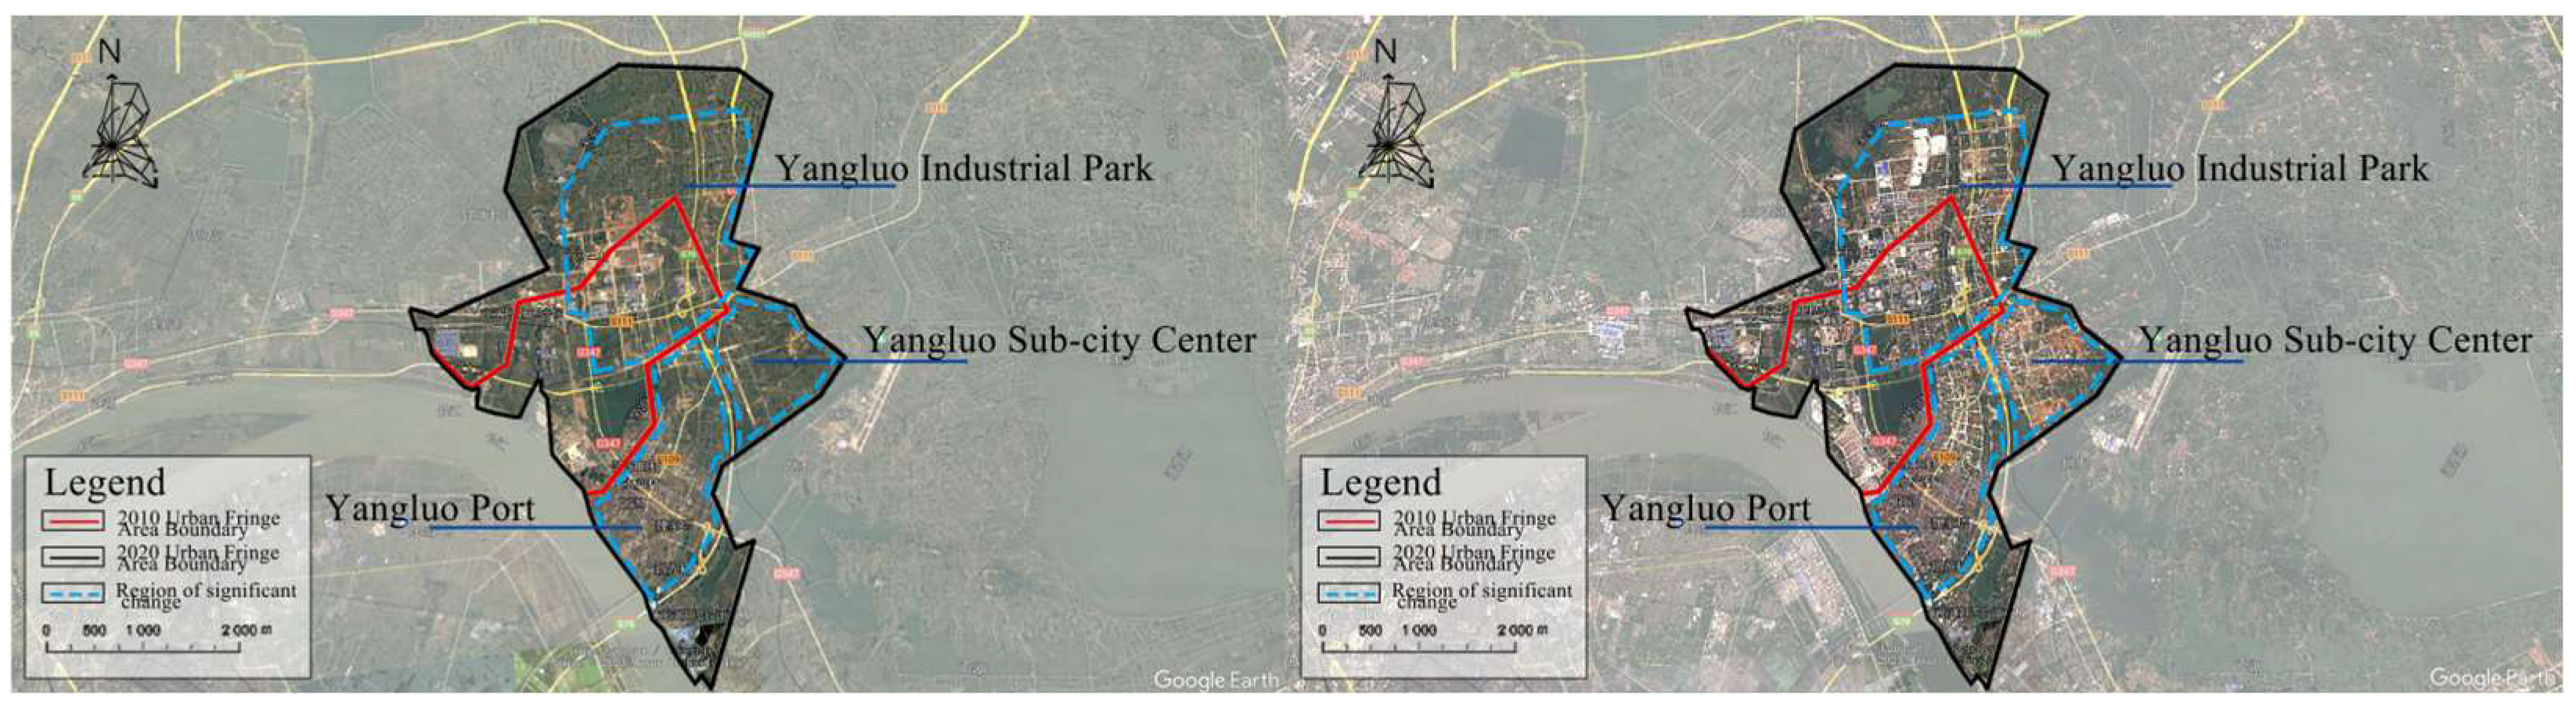
- Xinzhou District
- (4)
- Jiangxia District
- (5)
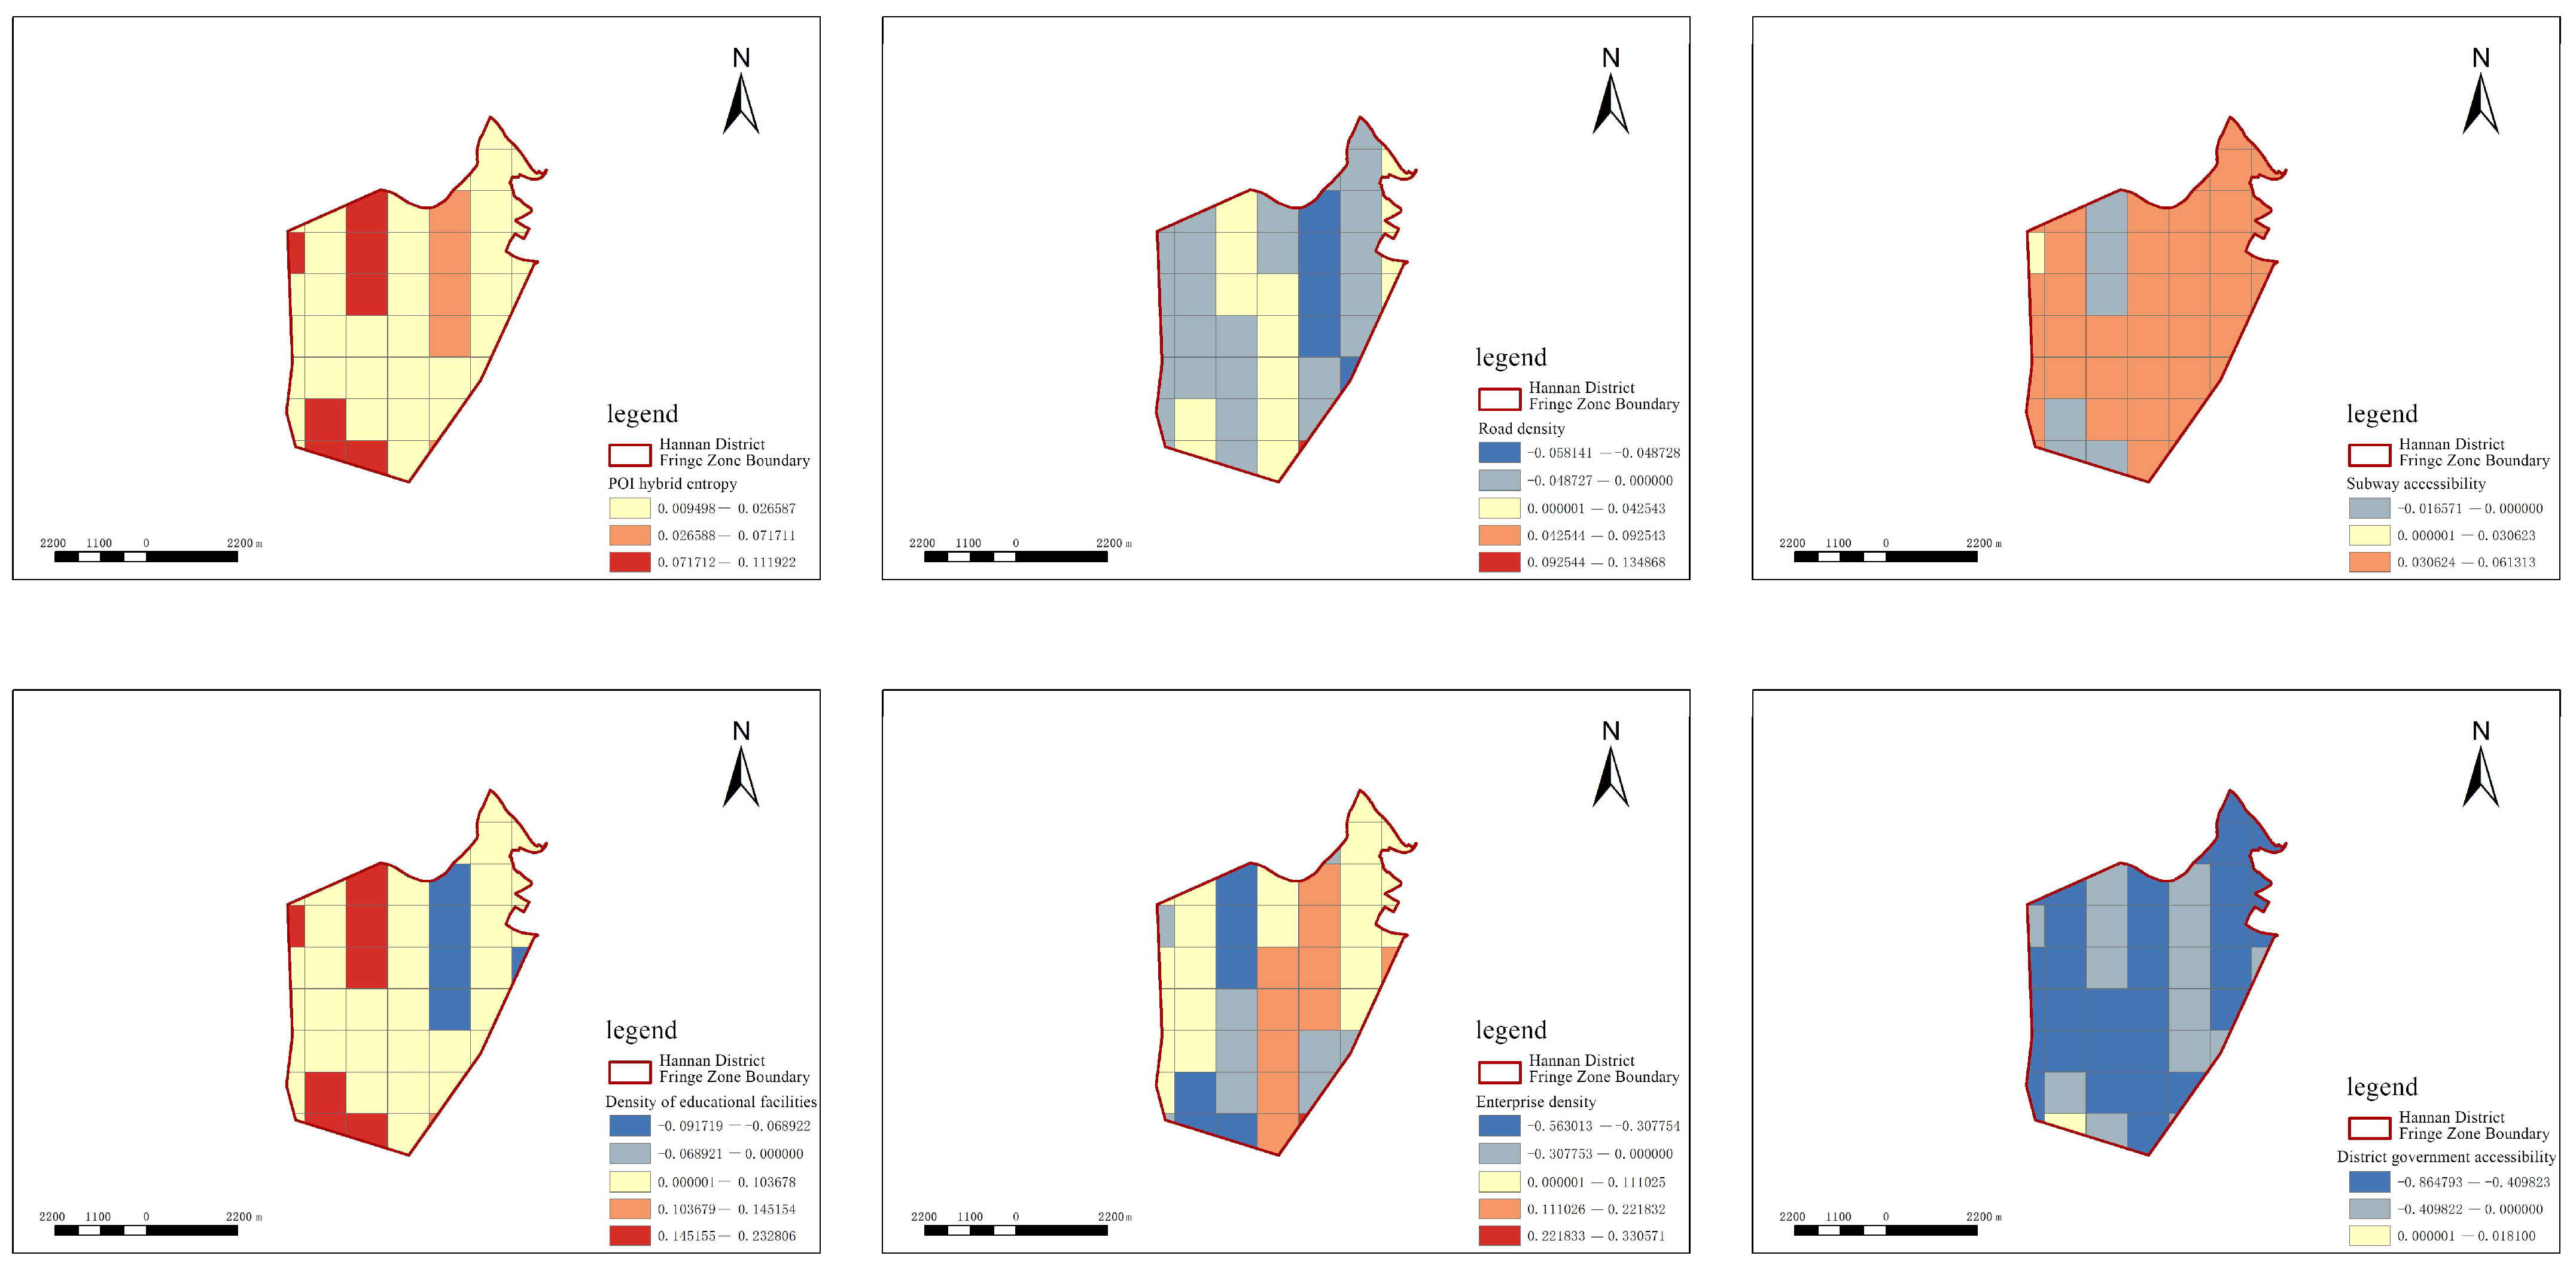
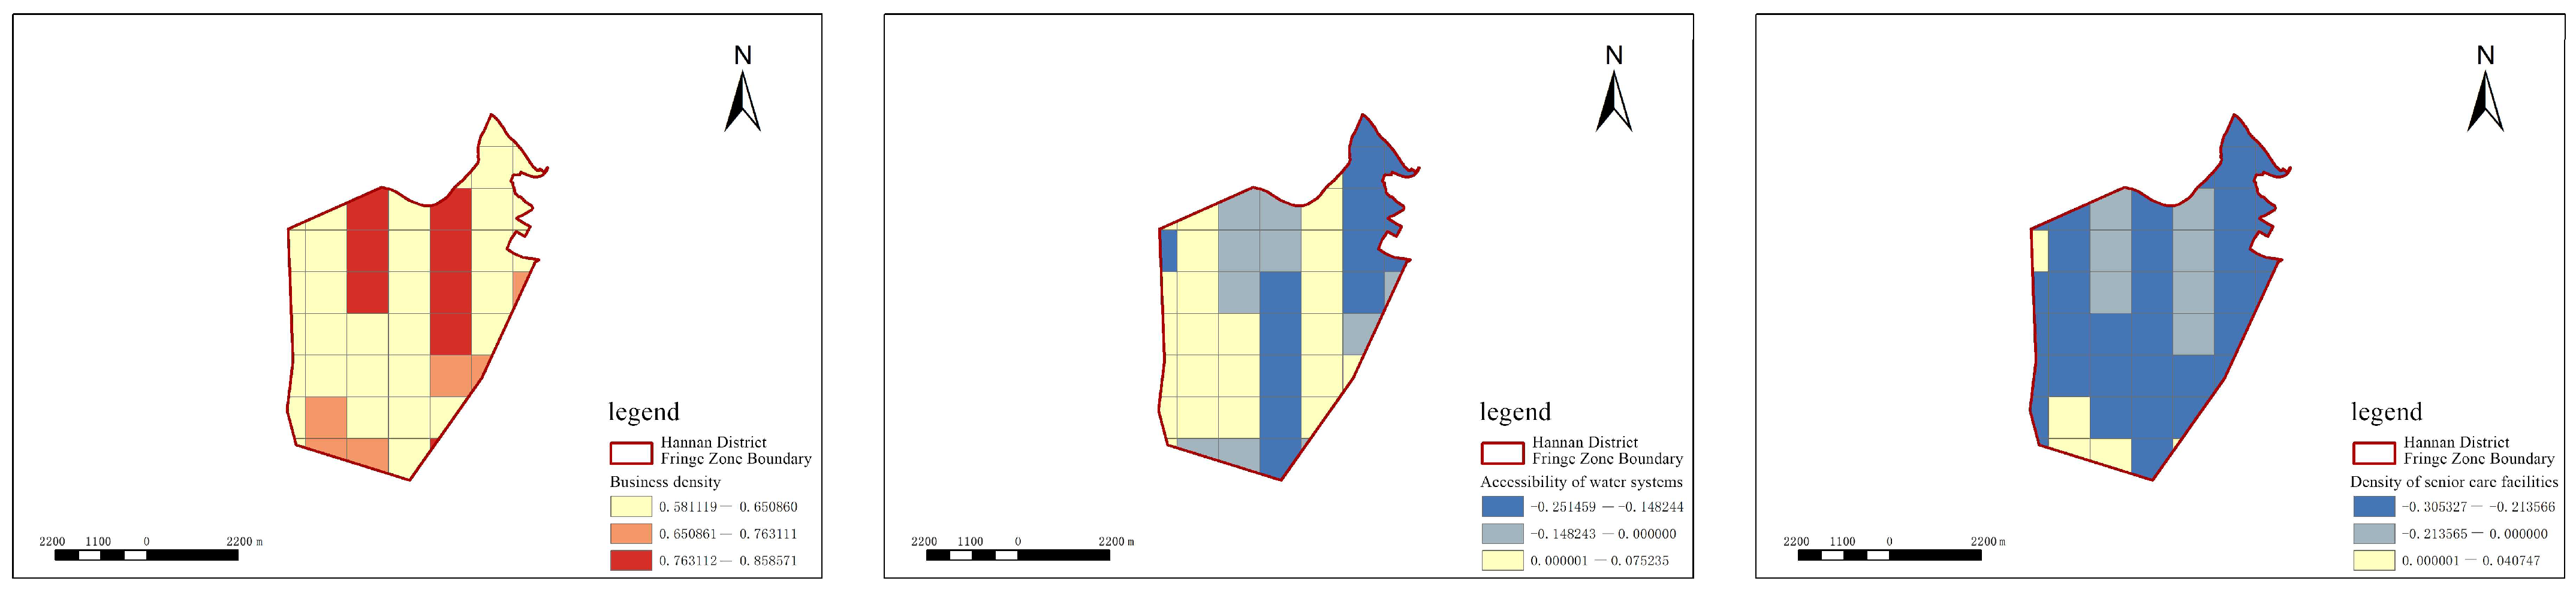
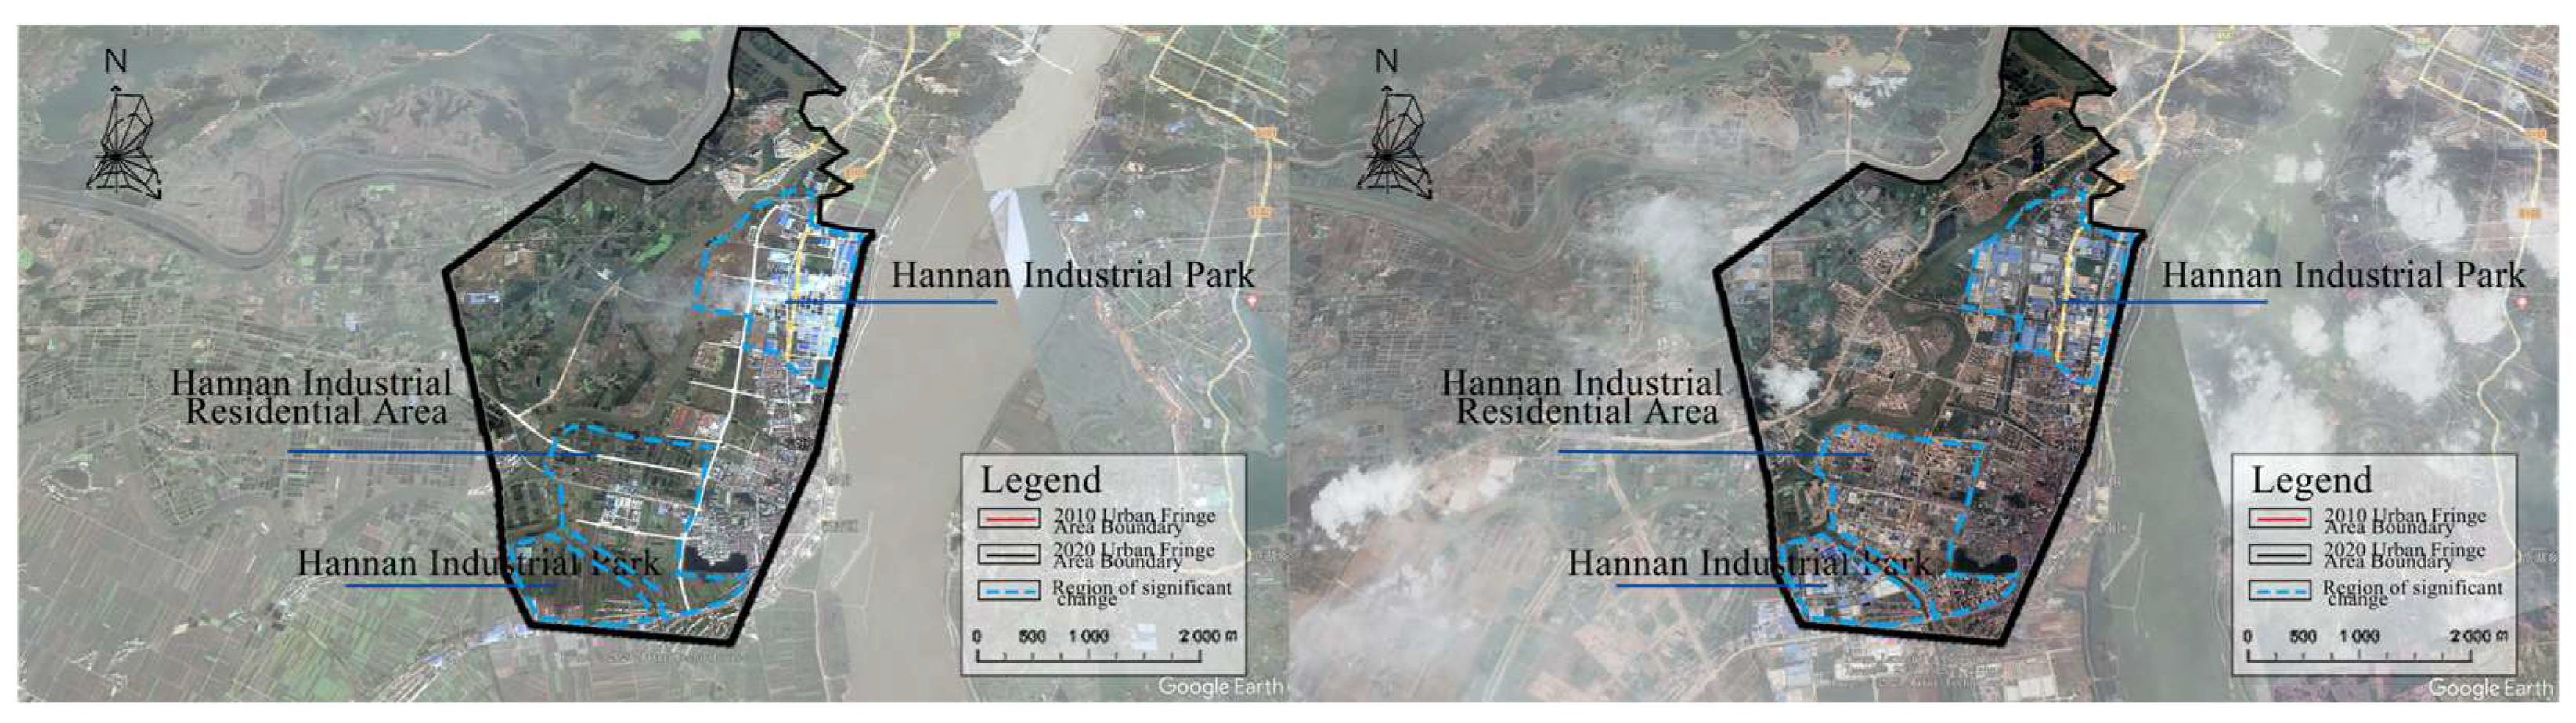
- Hannan District
- (6)
- Caidian District
6. Conclusions
6.1. Working Summary
6.2. Main Conclusions
- (1)
- In 2010, a small number of Wuhan’s fringe districts were located within the administrative boundaries of the central urban area. By 2020, the fringe districts were located within the administrative boundaries of the far urban area. The development bases and construction conditions of the far-away urban areas varied considerably, resulting in an increase in the populations of the fringe districts located in different far-away urban areas, and the magnitude of the increase varied considerably; therefore, it is necessary to put forward planning and construction proposals for the planning and construction of the far-away urban areas in line with their respective characteristics.
- (2)
- The “5D” elements of the built environment comprehensively describe all aspects of the urban built environment, covering most of the contents of urban planning and construction, and can be used as the theoretical basis for a more comprehensive construction of urban construction factors affecting the spatial distribution of the population.
- (3)
- First, the OLS model was used to select the significance and covariance of the variables. Then, the MGWR model was analyzed, and the adjusted R2 reached 0.725. And the results of the analysis showed that the influencing factors searched through the “5D” theory of the built environment better explained the demographic changes in the marginal zone.
- (4)
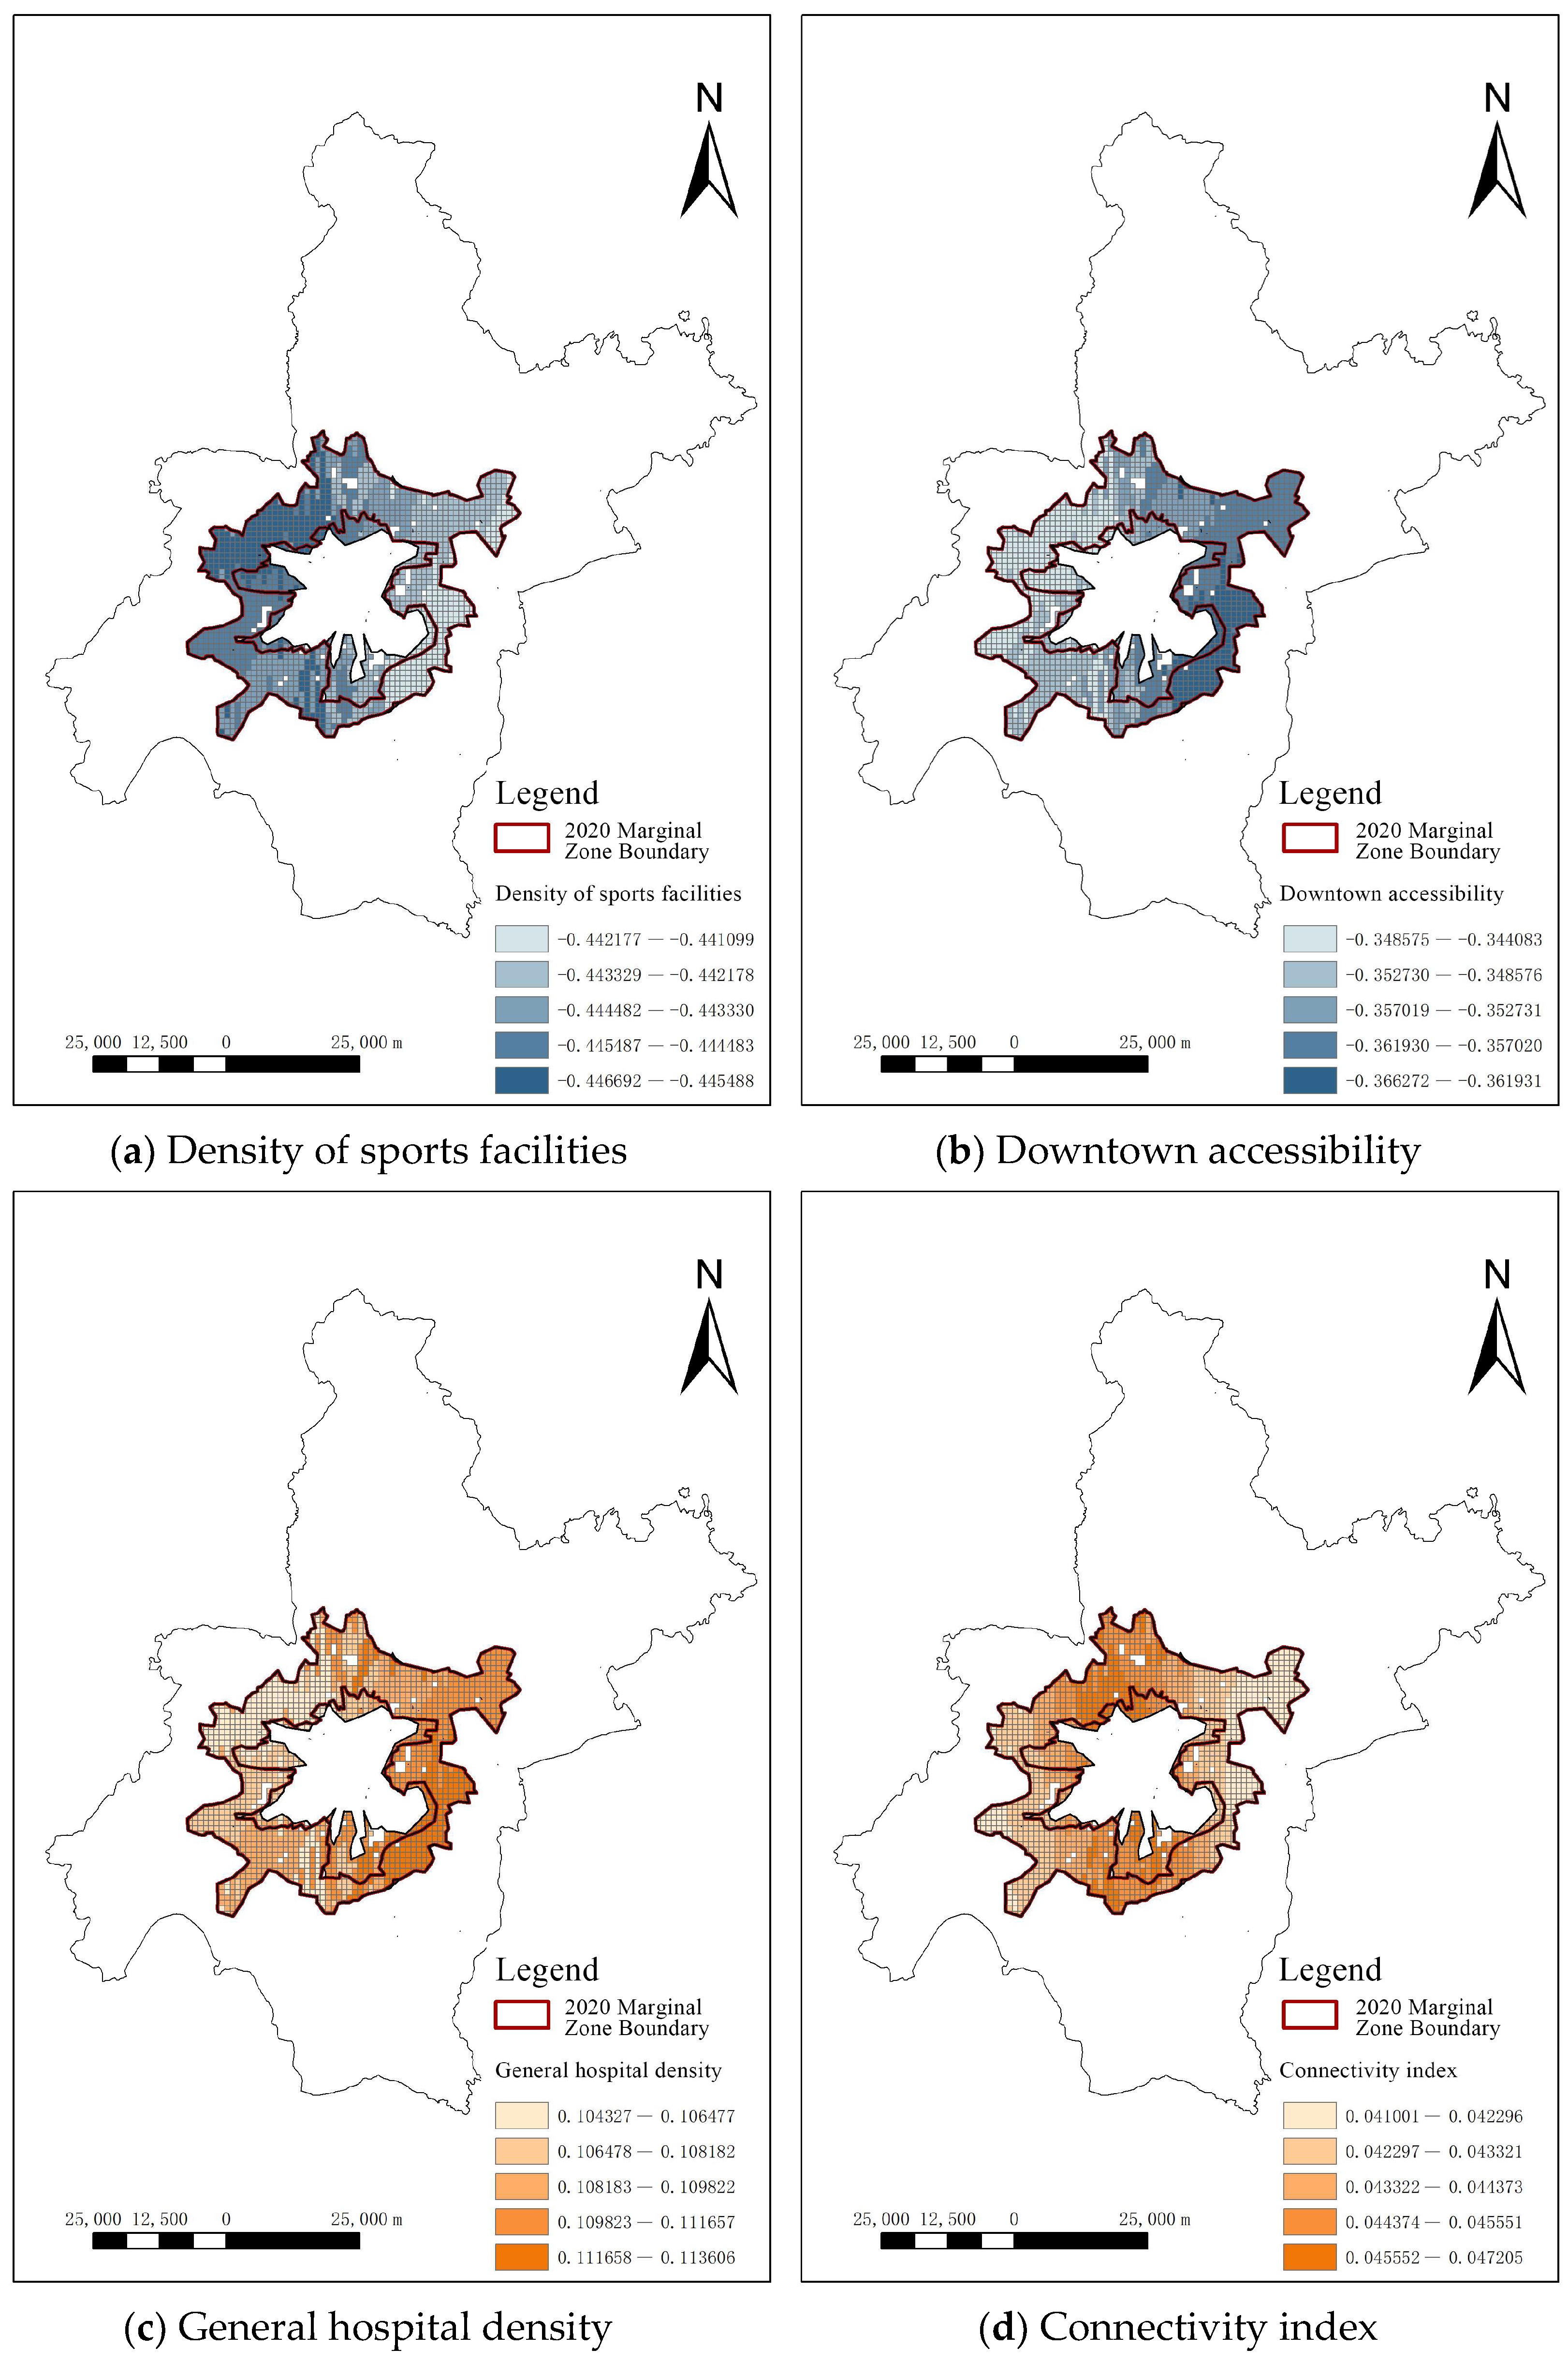
- Due to the MGWR’s calculation results of the bandwidth of different influencing factors, it can be seen that four factors, such as downtown accessibility, sports facility density, general hospital density, and connectivity index, are global variables with relatively uniform characteristics in the whole Wuhan fringe area. The other nine factors, such as enterprise density and district government accessibility, are local variables, with different influencing tendencies in each district, and thus need to be analyzed separately and put forward different planning suggestions.
6.3. Planning Recommendations
6.4. Prospects for Follow-Up Research
- (1)
- The Built Environment 5D Indicator is a theoretical perspective, and the selection of specific indicators is limited by data availability, which varies from city to city and from period to period, so if researchers have access to more comprehensive data, they can also look for different influences on the spatial distribution of the population and carry out further research.
- (2)
- The change in population size is also a topic worth studying, and subsequent studies can analyze the amount of change in the population of each grid as a dependent variable to explore the factors influencing the amount of change in the population.
- (3)
- Wuhan is a city with a very rich geographic environment, with the Yangtze River, the Han River, and numerous lakes and mountains; the geographic environment of the fringe areas in different locations varies greatly. And its history of development is also different, coupled with the large size of the urban fringe area. However, it is very difficult to explain the spatial distribution of the population of the different far-away urban areas and the interrelationships of various influencing factors in a single article, which is limited to the length of this paper. The planning proposals for the various far-away urban areas have not been fully and completely expressed, and subsequent studies can be further analyzed in terms of subregions or sub-factors to provide more specific suggestions for the planning and construction of the city.
Author Contributions
Funding
Data Availability Statement
Conflicts of Interest
References
- Yang, K. The Beijing-Tianjin-Hebei Grand Strategy and the Future Concept of the Capital—Several Basic Issues on the Adjustment of the Urban Functions of Beijing. Renming Luntan·Xueshu Qianyan 2015, 2, 72–83+95. [Google Scholar]
- Pan, Q.; Jiao, H.; Liu, X. The Feature Extraction for Attractiveness and the Optimization of Planning in a Suburban District: A Case Study of the Dongxihu District in Wuhan. Shanghai Urban Plan. Rev. 2021, 158, 65–73. [Google Scholar]
- Zhang, Y. Rational Spatial Distribution of Population and Healthy Urbanization: Problems and Countermeasures. Soc. Sci. Ningxia 2013, 1, 35–38. [Google Scholar]
- Fu, K.; Wang, Z.; Han, T. Spatial Division, Evolution and Characteristics of Urban Fringe: An Empirical Study Based on Xi’an Since 2000. Huazhong Archit. 2019, 37, 61–65. [Google Scholar]
- Wei, Q. How international metropolis plan for depopulation. Urban Manag. Sci. Technol. 2015, 17, 84–85. [Google Scholar]
- Todd, R. A City Index: Measurement of a City’s Attractiveness. 1977. Available online: https://digitalcommons.unomaha.edu/cparpubarchives/2/ (accessed on 6 May 2023).
- Zhang, W.; Liu, W.; Meng, B. On Location Advantage Value of Residential Environment in the Urban and Suburban Areas of Beijing. Acta Geogr. Sin. 2005, 01, 115–121. [Google Scholar]
- Chen, X.; Feng, J. Health effects of built environment based on a comparison of walkability and air pollution: A case study of Nanjing City. Prog. Geogr. 2019, 38, 296–304. [Google Scholar]
- Ewing, R.; Cervero, R. Travel and the built environment: A synthesis. Transp. Res. Rec. 2001, 1780, 87–114. [Google Scholar] [CrossRef]
- Wang, N.; Wu, J.; Li, S.; Wang, H.; Peng, Z. Spatial Features of Urban Vitality and the Impact of Built Environment on Them Based on Multi-Source Data: A Case Study of Shenzhen. Trop. Geogr. 2021, 41, 1280–1291. [Google Scholar]
- Liu, W.; Li, T. Analysis of the impact of community built environment on residents’ commuting distance in Guangzhou supported by mobile signaling data. World Region. Stud. 2023, 32, 79–90. [Google Scholar]
- Lyu, X.; Pan, H. Influencing Factors and Optimization Strategies of New Town Low Carbon Transportation: A Case Study of Songjiang New City of Shanghai. Urban Transp. Chin. 2022, 20, 99–110. [Google Scholar]
- Bai, M.; Chen, J.; Zhu, Y. A Study on the Measurement and Influencing Factors of the Vitality of Commercial Blocks in Handan City Based on Multiscale Geographically Weighted Regression Model. J. Shenyang Jianzhu Univ. Soc. Sci. 2022, 24, 332–338. [Google Scholar]
- Lao, X.; Gu, H. Unveiling Various Spatial Patterns of Determinants of Hukou Transfer Intentions in China: A Multi-Scale Geographically Weighted Regression Approach. Growth Chang. 2020, 51, 1860–1876. [Google Scholar] [CrossRef]
- Shabrina, Z.; Buyuklieva, B.; NG, M. Short Term Rental Platform in the Urban Tourism Context: A Geographically Weighted Regression (GWR) and a Multiscale GWR (MGWR) Approaches. Geogr. Anal. 2020, 53, 686–707. [Google Scholar] [CrossRef]
- Wu, C.; Ren, F.; Hu, W.; Du, Q. Multiscale Geographically and Temporally Weighted Regression: Exploring the Spatiotemporal Determinants of Housing Prices. Int. J. Geogr. Inf. Sci. 2018, 33, 489–511. [Google Scholar] [CrossRef]
- Wu, Z.; Lu, J. The Panzhihua Model: A Study of Population Urbanization Patterns. Tianfu New Idea 1996, 5, 12–18. [Google Scholar]
- Cheng, L.; Wang, X. The Quality Evaluation of Living Space of the Central City and Its Satellite Towns in China—A Case Study of the Satellite Towns of Xi’an. Prog. Geogr. 2003, 3, 216–225. [Google Scholar]
- Wang, W. A Quantitative Assessment on the Quality of Life in Hangzhou Based on Landsat/TM and Socioeconomic Data. Acta Geogr. Sin. 2005, 1, 151–157. [Google Scholar]
- Gao, Z. Study on the Attractiveness of Talents in Shanghai Based on Hierarchical Analysis. East China Econ. Manag. 2012, 26, 5–9. [Google Scholar]
- Wang, H.; Wang, D.; Liu, J. Population Attraction Strategy of New Towns in Shanghai Based on Residential Preference Behaviors. Urban Plan. Forum 2017, 4, 97–103. [Google Scholar]
- Institute for Urban Strategies. Global Power City Index. 2018. Available online: http://c30riozy.mwprem.net/english/ius2/gpci2/ (accessed on 5 May 2023).
- Jiang, B.; Yang, S.; Li, S. A study of changes in the number of births in China. Chin. J. Popul. Sci. 2018, 1, 60–71+127. [Google Scholar]
- Handy, S.; Boarnet, M.; Ewing, R.; Killingsworth, R. How the Built Environment Affects Physical Activity: Views from Urban Planning. Am. J. Prev. Med. 2002, 23, 64–73. [Google Scholar] [CrossRef] [PubMed]
- Bao, Y.; Huang, Z.; Guo, Q.; Liu, Y. Spatial calculation of urban built environment stock: Progress and prospects. Natl. Remote Sens. Bull. 2022, 26, 1909–1919. [Google Scholar] [CrossRef]
- Yin, C.; Zhou, J.; Lin, L.; Shao, C.; Wang, X.; Wang, S. Joint modeling research of commuting time and distance considering the impacts of urban built environment. J. Beijing Jiaotong Univ. 2021, 45, 24–29. [Google Scholar]
- Shen, T.; Yu, H.; Zhou, L. On Hedonic Price of Second-Hand Houses in Beijing Based on Multi-Scale Geographically Weighted Regression: Scale Law of Spatial Heterogeneity. Econ. Geogr. 2020, 40, 75–83. [Google Scholar]
- Wang, Y.; Zhou, P.; Pan, H. A Study on Multi—Scale Spatial Relationship between Road Network Form and Housing Price Based on sDNA and MGWR. Geogr. Geo-Inf. Sci. 2022, 38, 103–109. [Google Scholar]
- Wu, C.; Liu, P.; Nie, K. Analyzing Multiscale Spatial Relationships between Housing Prices and Influencing Factors in Nanjing. Mod. Urban Res. 2021, 4, 93–98. [Google Scholar]
- Fan, L.; Zhang, D. Research on the Influence Mechanism and Spatial Heterogeneity Characteristics of Block Vitality in Beijing: Based on Multi-scale Geographically Weighted Regression. City Plan. Rev. 2022, 46, 27–37. [Google Scholar]
- Ma, Y.; Huang, Z. Research on Spatial Distribution and Accessibility of the Traditional Villages in the Urban Agglomeration on the Middle Reaches of the Yangtze River Based on GWR Modal. Hum. Geogr. 2017, 32, 78–85. [Google Scholar]
- Li, Q.; Xu, B.; Wei, J. Study on the Spatio-Temporal Evolution and Influential Factors of Economic Development in the Yangtze River Delta Region: Empirical analysis based on data from 307 county units. Urban Probl. 2020, 305, 14–23. [Google Scholar]
- Yang, J.; An, r.; Tong, Z. Exploring the relationship between built environment and ventilation potential in Wuhan, A multi-scale geographically weighted regression analysis. J. Nanjing Norm. Univ. Nat. Sci. Ed. 2023, 6, 1–19. [Google Scholar]
- Wuhan National Economic and Social Development Statistics Bulletin. 2020. Available online: http://tjj.wuhan.gov.cn/tjf-w/tjgb/202104/t20210425_1675623.shtml (accessed on 25 May 2023).
- Interpretation of the Main Data Results of the Seventh National Population Census in Wuhan City. Available online: http://tjj.wuhan.gov.cn/tjfw/tjgb/202105/t20210528_1707420.shtml (accessed on 4 May 2023).
- Wuhan National Economic and Social Development Statistics Bulletin. 2022. Available online: http://tjj.wuhan.gov.cn/tjf-w/tjgb/202303/t20230330_2177979.shtml (accessed on 12 April 2023).
- Luo, T.; Liu, X.; Li, J. Spatio-Temporal Evolution of Ecological Spatial Conflicts in Beijing-Tianjin-Hebei Urban Agglomeration. J. Geomat. 2021, 46, 88–92. [Google Scholar]
- Long, Y.; Luo, S.; Liu, X.; Luo, T.; Liu, X. Research on the Dynamic Evolution of the Landscape Pattern in the Urban Fringe Area of Wuhan from 2000 to 2020. Int. J. Geo-Inf. 2022, 11, 483. [Google Scholar] [CrossRef]
- Shao, D.; Shao, L.; Wu, D. Study on the Influence of Architectural Space on the Distribution of Park Green Space: A Case Study of Suzhou Central City. Mod. Urban Res. 2022, 10, 108–114. [Google Scholar]
- Mcmillen, D.P. Geographically Weighted Regression: The Analysis of Spatially Varying Relationships. Am. J. Agric. Econ. 2004, 86, 554–556. [Google Scholar] [CrossRef]
- Fotheringham, A.S.; Charlton, M.E.; Brunsdon, C. Geographically Weighted Regression: A Natural Evolution of the Expansion Method for Spatial Data Analysis. Environ. Plan. A 1998, 30, 1905–1927. [Google Scholar] [CrossRef]
- Wang, H.; Xu, Y.; Liu, C. Response of Habitat Quality to Land Use Change Based on Geographical Weighted Regression. Acta Sci. Nat. Univ. Pekin. 2019, 55, 509–518. [Google Scholar]
- Vance, C.; Hedel, R. The impact of urban form on automobile travel: Disentangling causation from correlation. Transportation 2007, 34, 575–588. [Google Scholar] [CrossRef]
- Kang, L.; Zhang, W.; Yang, Z. The Influence of Beijing’s Built Environment on Residents’Livability Satisfaction. Hum. Geogr. 2020, 35, 52–60. [Google Scholar]
- Ewing, R.; Cervero, R. Travel and the built environment: A meta-analysis. J. Am. Plann. Assoc. 2010, 76, 265–294. [Google Scholar] [CrossRef]
- Bai, Y.; Wang, S.; Wu, S.; Guo, Y. On the Relationship Between the Urban Population Density and Traffic Intensity. China Transp. Rev. 2021, 43, 21–25+76. [Google Scholar]
- Shang, Z.; Zhang, X.; Lu, X. Evolution of Accessibility Spatial Pattern of Urban Land Use:A Case of Huai’an City in Jiangsu Province. Sci. Geogr. Sin. 2014, 34, 154–162. [Google Scholar]
- Li, G.; Cheng, G.; Wu, Z.; Liu, X. Coupling Coordination Research on Disaster-Adapted Resilience of Modern Infrastructure System in the Middle and Lower Section of the Three Gorges Reservoir Area. Sustainability 2022, 14, 14514. [Google Scholar] [CrossRef]
- Li, G.; Cheng, G.; Wu, Z. Resilience Assessment of Urban Complex Giant Systems in Hubei Section of the Three Gorges Reservoir Area Based on Multi-Source Data. Sustainability 2022, 14, 8423. [Google Scholar] [CrossRef]


| Author | Year | Research Focus | Method | Conclusion |
|---|---|---|---|---|
| Ralph, H. [6] | 1977 | The study ranked 100 cities based on 80 indicators and gave equal weight to four categories: economy, population/environment, crime, and entertainment/education to measure city attractiveness. | City index rankings and multiple regression analysis | There is no significant relationship between the population size of the 100 cities and their comparative status in terms of economic, demographic/environmental, crime, and recreational/educational characteristics. Only two indicators were significantly correlated with population size. These were population density and carbon monoxide air pollution. |
| Cheng, L., Wang, X. [18] | 2003 | This paper establishes a comprehensive index system for evaluating the quality of living space in China’s regional center cities and their satellite towns on the basis of Rich Boyer’s nine-factor index system and carries out a comprehensive evaluation of the quality of living space in Xi’an’s satellite towns. | Analytic hierarchy process | Factors that have a greater impact on the quality of urban living space and thus increase the attractiveness of the population, economic conditions, level of education, level of health, and transportation. |
| Zhang, W., et al. [7] | 2005 | The article selects service facilities, natural environment, traffic conditions, location conditions, and other elements to construct a model to evaluate the degree of location advantage of the residential environment in different areas of Beijing and analyze its spatial characteristics. | Multiple regression analysis and ArcGIS | Differences in the living environment directly affect the population’s relocation behavior and decision making on residential location, and areas with a high degree of locational advantage in the living environment also have relatively high prices for commercial housing, and are also the preferred areas for the population to choose living space. |
| Wang, W. [19] | 2005 | The article uses principal component analysis and the spatial superposition method of GIS to quantitatively analyze and evaluate the spatial distribution of quality of life in Hangzhou city in townships and streets. | Principal component analysis and ArcGIS | Studies show that Hangzhou’s population remains concentrated in city centers with higher quality of life and that economically developed or densely populated areas are more attractive to highly educated people and high-income families. |
| Gao, Z. [20] | 2012 | Based on the three dimensions of institutional environment, social and cultural atmosphere, and living environment, the article establishes an evaluation index system for the attractiveness of talents in Shanghai and analyzes in depth the various external factors affecting the attractiveness of talents in Shanghai. | Analytic hierarchy process | The results show that the “institutional environment” has the greatest impact on the attractiveness of Shanghai’s population, followed by the “living environment”, which has a slightly greater effect on the attractiveness of Shanghai’s population than the “social and cultural atmosphere”. |
| Wang, H., et al. [21] | 2017 | The article explores the characteristics of Shanghai residents’ housing preferences by investigating the types and preferences of residents’ housing choices and sorting out influencing factors, including facility configuration, location and transportation, housing conditions, price factors, natural and social environments, etc. | Stated preference method and discrete choice model | Shanghai’s suburbs have been the fastest-growing areas in terms of population density in recent years due to lower housing prices and better transportation facilities in the suburbs, which make them more attractive places to live, but the center of the city is still attractive to the population due to the improvement of education and other infrastructures. |
| Institute for Urban Strategies [22] | 2018 | The report focuses on a multi-dimensional evaluation and ranking of six primary indicators: economy, R&D, cultural exchange, livability, environment, and transportation. | City index rankings | In 2018, the top five cities in the overall ranking based on the six assessment indicators remained unchanged—London, New York, Tokyo, Paris, and Singapore—which could also reflect the strength of the cities’ attractiveness to the population. |
| Jiang, B., et al. [23] | 2018 | To study the impact of three factors, namely, the total number of women of childbearing age, the age structure of women of childbearing age and fertility, and the number of births from the 1980s to 2010. | Cross-sectional analysis and longitudinal analysis | Changes in the number of births in the country are influenced by changes in the total number of women of childbearing age, the age structure of women of childbearing age, and the fertility rate, with different factors playing a major role at different times. |
| Pan, Q., et al. [2] | 2021 | The study comprehensively analyzes the intrinsic factors and mechanisms of population distribution in far-away urban areas, establishes a system of indicators for evaluating the attractiveness of the population in far-away urban areas, and identifies and extracts the salient elements of population attraction. | Multivariable regression, tobit model, and GWR | The rail station will attract people to move from far away to live near the station, and the increase in output accessibility and green space accessibility will also attract more people, while the increase in accessibility of elderly care facilities will reduce the attractiveness of the population. |
| Type | Data | Data Sources | Processing |
|---|---|---|---|
| Wuhan city land-use data (2010–2020) | Wuhan 30 m resolution land-use data 2010–2020 | ZENODO (https://zenodo.org, accessed on 2 April 2023) | ArcGis 10.5 extraction processing for each type of land |
| Population density | Spatial distribution of population data 2010–2020 | WorldPop (https://www.worldpop.org, accessed on 23 March 2023) | ArcGis 10.5 raster extraction |
| Building outline | Building outline data in Wuhan from 2010 to 2020 | Self-drawn image map | ArcGis 10.5 calculates building density |
| Wuhan city road network data | Wuhan City’s urban trunk road network data from 2010 to 2020 | OpenStreetMap (https://www.open-streetmap.org, accessed on 26 March 2023) | ArcGis 10.5 calculates coverage and accessibility |
| POI data | Spatial data points of public transportation, education, culture, medical care, sports, and commercial facilities in Wuhan from 2010 to 2020 | Gao De Map crawl (https://www.amap.com, accessed on 26 March 2023) | ArcGis10.5 |
| Level Indicators | Secondary Indicators | Description |
|---|---|---|
| Density | Building density | Gross floor area/Fishing net area |
| Density of educational facilities | Kernel density calculation formula: Here, the parameter h is called the bandwidth, K(x) is called the kernel function, and K(x) satisfies the condition that , | |
| Density of medical facilities | ||
| Density of sports facilities | ||
| Enterprise density | ||
| Commercial density | ||
| General hospital density | ||
| Density of senior care facilities | ||
| Diversity | Land-use mixing entropy | denotes the entropy of the random variable X; is the probability that X takes Xi |
| POI hybrid entropy | ||
| Design | Road density | Total length of road/Total area |
| Intersection density | Number of road intersections/Total area | |
| Connectivity index | Number of intersections/Total number of intersections | |
| Distance to transit | Bus accessibility | Nearest distance of the fishing net to each target point in Arcgis |
| Subway accessibility | ||
| Destination accessibility | Accessibility of educational facilities | |
| Accessibility of medical facilities | ||
| Accessibility of sports facilities | ||
| Commercial accessibility | ||
| Business accessibility | ||
| General hospital accessibility | ||
| Accessibility of senior care facilities | ||
| district government accessibility | ||
| Downtown accessibility | ||
| Green space accessibility | ||
| Accessibility of water systems |
| Variables | 2010 | 2020 | ||
|---|---|---|---|---|
| Probability b Value | VIF | Probability b Value | VIF | |
| Building density | 0.004910 * | 1.505884 | 0.189267 | 1.690295 |
| Density of educational facilities | 0.000067 * | 10.617651 | 0.000000 * | 4.680789 |
| Density of medical facilities | 0.000000 * | 16.408955 | 0.572632 | 7.352393 |
| Density of sports facilities | 0.000506 * | 5.323807 | 0.000000 * | 6.219783 |
| Enterprise density | 0.000000 * | 3.954631 | 0.000000 * | 3.117108 |
| Commercial density | 0.964749 | 16.595558 | 0.000000 * | 9.347400 |
| General hospital density | 0.000152 * | 20.707629 | 0.006496 * | 5.858377 |
| Density of senior care facilities | / | / | 0.000070 * | 2.758703 |
| Land-use mixing entropy | 0.383541 | 1.166208 | 0.635061 | 1.216620 |
| POI hybrid entropy | 0.000407 * | 2.219505 | 0.000609 * | 2.569134 |
| Road density | 0.000000 * | 3.657860 | 0.000041 * | 3.101853 |
| Intersection density | 0.000060 * | 3.055031 | 0.192695 | 2.455613 |
| Connectivity index | 0.051274 | 1.493273 | 0.036192 * | 1.427666 |
| Bus accessibility | 0.495531 | 1.780257 | 0.745722 | 2.168778 |
| Subway accessibility | 0.943849 | 4.750124 | 0.000277 * | 1.532960 |
| Accessibility of educational facilities | 0.484203 | 2.331063 | 0.806583 | 2.447215 |
| Accessibility of medical facilities | 0.086862 | 5.315409 | 0.258241 | 2.863755 |
| Accessibility of sports facilities | 0.046233 * | 2.398171 | 0.890450 | 1.770127 |
| Commercial accessibility | 0.444364 | 2.078590 | 0.589879 | 2.307591 |
| Business accessibility | 0.049031 * | 3.256475 | 0.118101 | 2.713525 |
| General hospital accessibility | 0.620522 | 5.723466 | 0.240368 | 2.246450 |
| Accessibility of senior care facilities | / | / | 0.019892 * | 2.183149 |
| district government accessibility | 0.104757 | 1.912072 | 0.019576 * | 1.416074 |
| Downtown accessibility | 0.638305 | 5.522711 | 0.007627 * | 1.899964 |
| Green space accessibility | / | / | 0.792585 | 1.916604 |
| Accessibility of water systems | / | / | 0.000035 * | 1.439254 |
| 2010 | 2020 |
|---|---|
| Density of sports facilities | Density of educational facilities |
| Density of sports facilities | |
| Enterprise density | Enterprise density |
| Commercial density | |
| POI hybrid entropy | General hospital density |
| Density of senior care facilities | |
| Road density | POI hybrid entropy |
| Road density | |
| Accessibility of sports facilities | Connectivity index |
| Business accessibility | Subway accessibility |
| Building density | Accessibility of senior care facilities |
| District government accessibility | |
| Intersection density | Downtown accessibility |
| Accessibility of water systems |
| Model indicators | MGWR | OLS | MGWR | OLS |
|---|---|---|---|---|
| Year | 2010 | 2010 | 2020 | 2020 |
| Adjusted R2 | 0.706 | 0.232 | 0.725 | 0.301 |
| AICc | 1533.545 | 20,163.348 | 3024.997 | 31,542.716 |
| Residual Sum of Squares | 186.503 | / | 391.929 | / |
| Variables | 2010 GWR Bandwidth | 2010 MGWR Bandwidth | 2020 GWR Bandwidth | 2020 MGWR Bandwidth |
|---|---|---|---|---|
| Constant term | 60 | 84 | 156 | 641 |
| Density of educational facilities | - | - | 156 | 215 |
| Density of sports facilities | 60 | 48 | 156 | 1712 |
| Enterprise density | 60 | 147 | 156 | 43 |
| Business density | - | - | 156 | 86 |
| General hospital density | - | - | 156 | 1712 |
| Density of senior care facilities | - | - | 156 | 118 |
| POI hybrid entropy | 60 | 800 | 156 | 364 |
| Road density | 60 | 60 | 156 | 91 |
| Connectivity index | - | - | 156 | 1712 |
| Subway accessibility | - | - | 156 | 352 |
| Accessibility of senior care facilities | - | - | 156 | 1712 |
| District government accessibility | - | - | 156 | 43 |
| Downtown accessibility | - | - | 156 | 1711 |
| Accessibility of water systems | - | - | 156 | 45 |
| Accessibility of sports facilities | 60 | 44 | - | - |
| Business accessibility | 60 | 52 | - | - |
| Building density | 60 | 44 | - | - |
| Intersection density | 60 | 776 | - | - |
Disclaimer/Publisher’s Note: The statements, opinions and data contained in all publications are solely those of the individual author(s) and contributor(s) and not of MDPI and/or the editor(s). MDPI and/or the editor(s) disclaim responsibility for any injury to people or property resulting from any ideas, methods, instructions or products referred to in the content. |
© 2023 by the authors. Licensee MDPI, Basel, Switzerland. This article is an open access article distributed under the terms and conditions of the Creative Commons Attribution (CC BY) license (https://creativecommons.org/licenses/by/4.0/).
Share and Cite
Long, Y.; Lu, Z.; Hu, S.; Luo, S.; Liu, X.; Shao, J.; Zheng, Y.; Liu, X. Study on Influencing Factors and Planning Strategies of Population Spatial Distribution in Urban Fringe Areas from the Perspective of Built Environment—The Case of Wuhan, China. Land 2023, 12, 1739. https://doi.org/10.3390/land12091739
Long Y, Lu Z, Hu S, Luo S, Liu X, Shao J, Zheng Y, Liu X. Study on Influencing Factors and Planning Strategies of Population Spatial Distribution in Urban Fringe Areas from the Perspective of Built Environment—The Case of Wuhan, China. Land. 2023; 12(9):1739. https://doi.org/10.3390/land12091739
Chicago/Turabian StyleLong, Yan, Zhengyuan Lu, Siyu Hu, Shiqi Luo, Xi Liu, Jingmei Shao, Yuqiao Zheng, and Xuejun Liu. 2023. "Study on Influencing Factors and Planning Strategies of Population Spatial Distribution in Urban Fringe Areas from the Perspective of Built Environment—The Case of Wuhan, China" Land 12, no. 9: 1739. https://doi.org/10.3390/land12091739
APA StyleLong, Y., Lu, Z., Hu, S., Luo, S., Liu, X., Shao, J., Zheng, Y., & Liu, X. (2023). Study on Influencing Factors and Planning Strategies of Population Spatial Distribution in Urban Fringe Areas from the Perspective of Built Environment—The Case of Wuhan, China. Land, 12(9), 1739. https://doi.org/10.3390/land12091739