
How Does Land Monopoly Reduce Consumption Levels? Evidence from China


Abstract
:1. Introduction
2. Theoretical Framework
- (1)
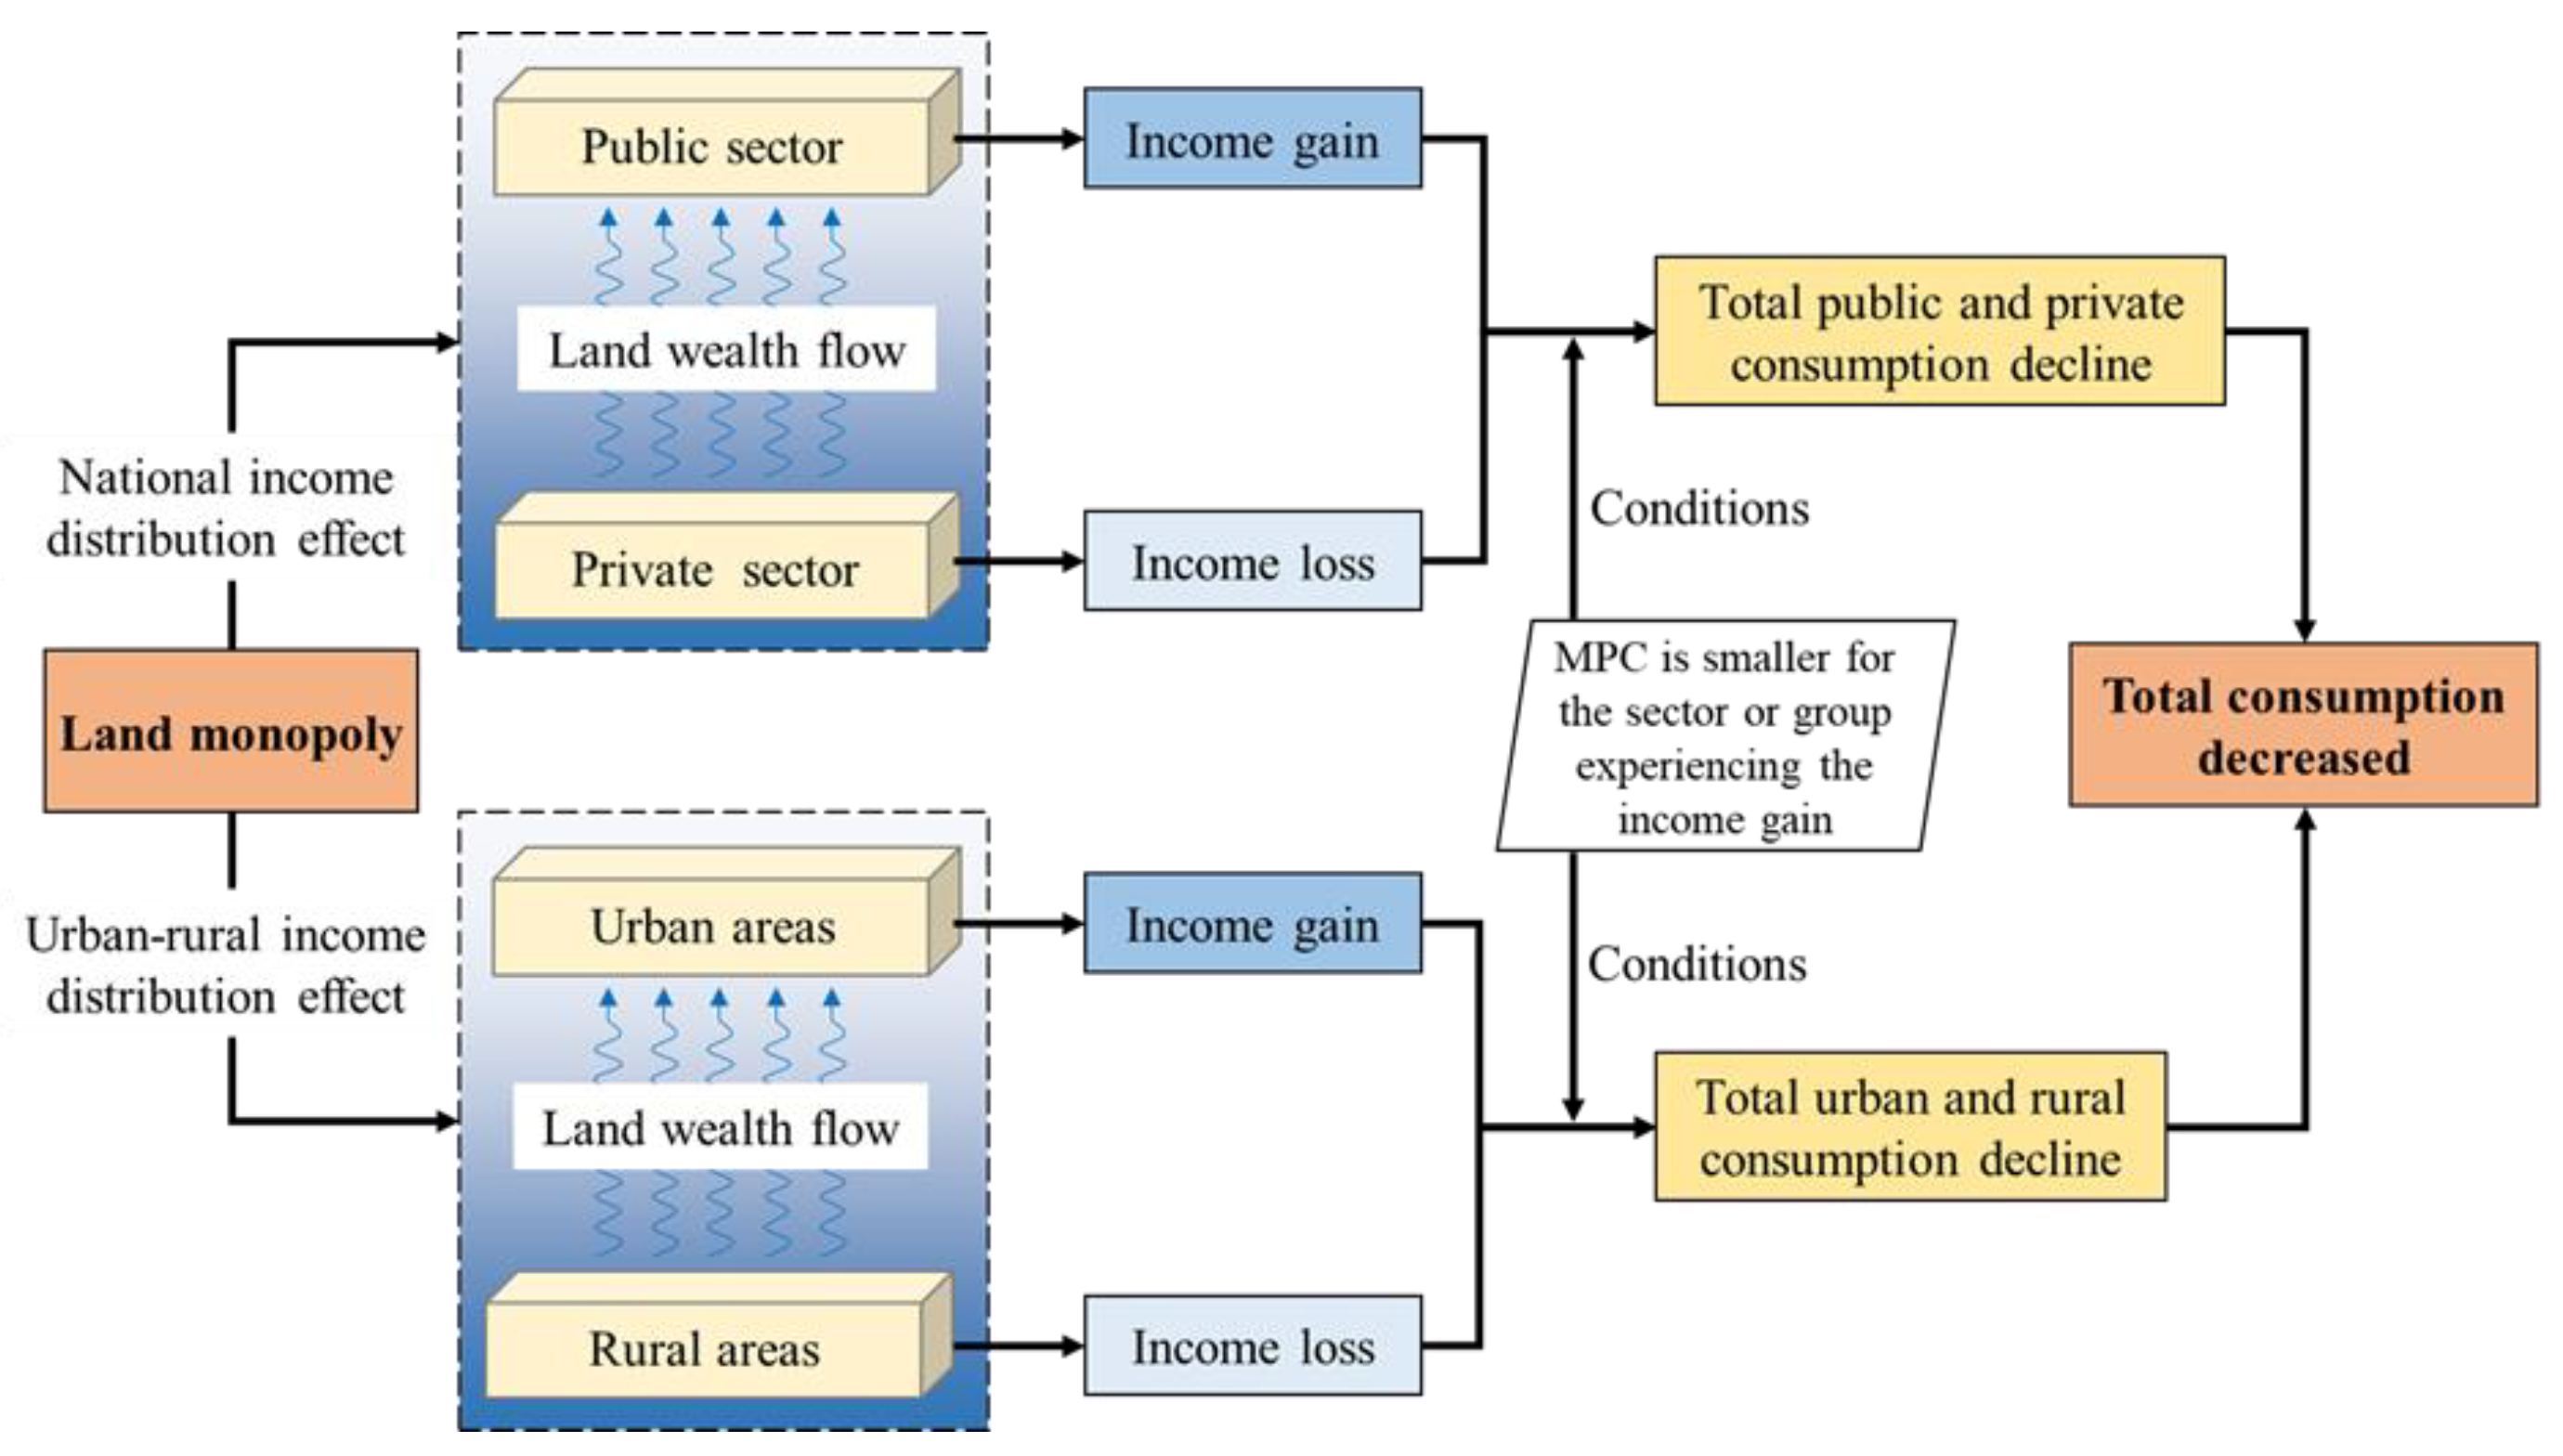
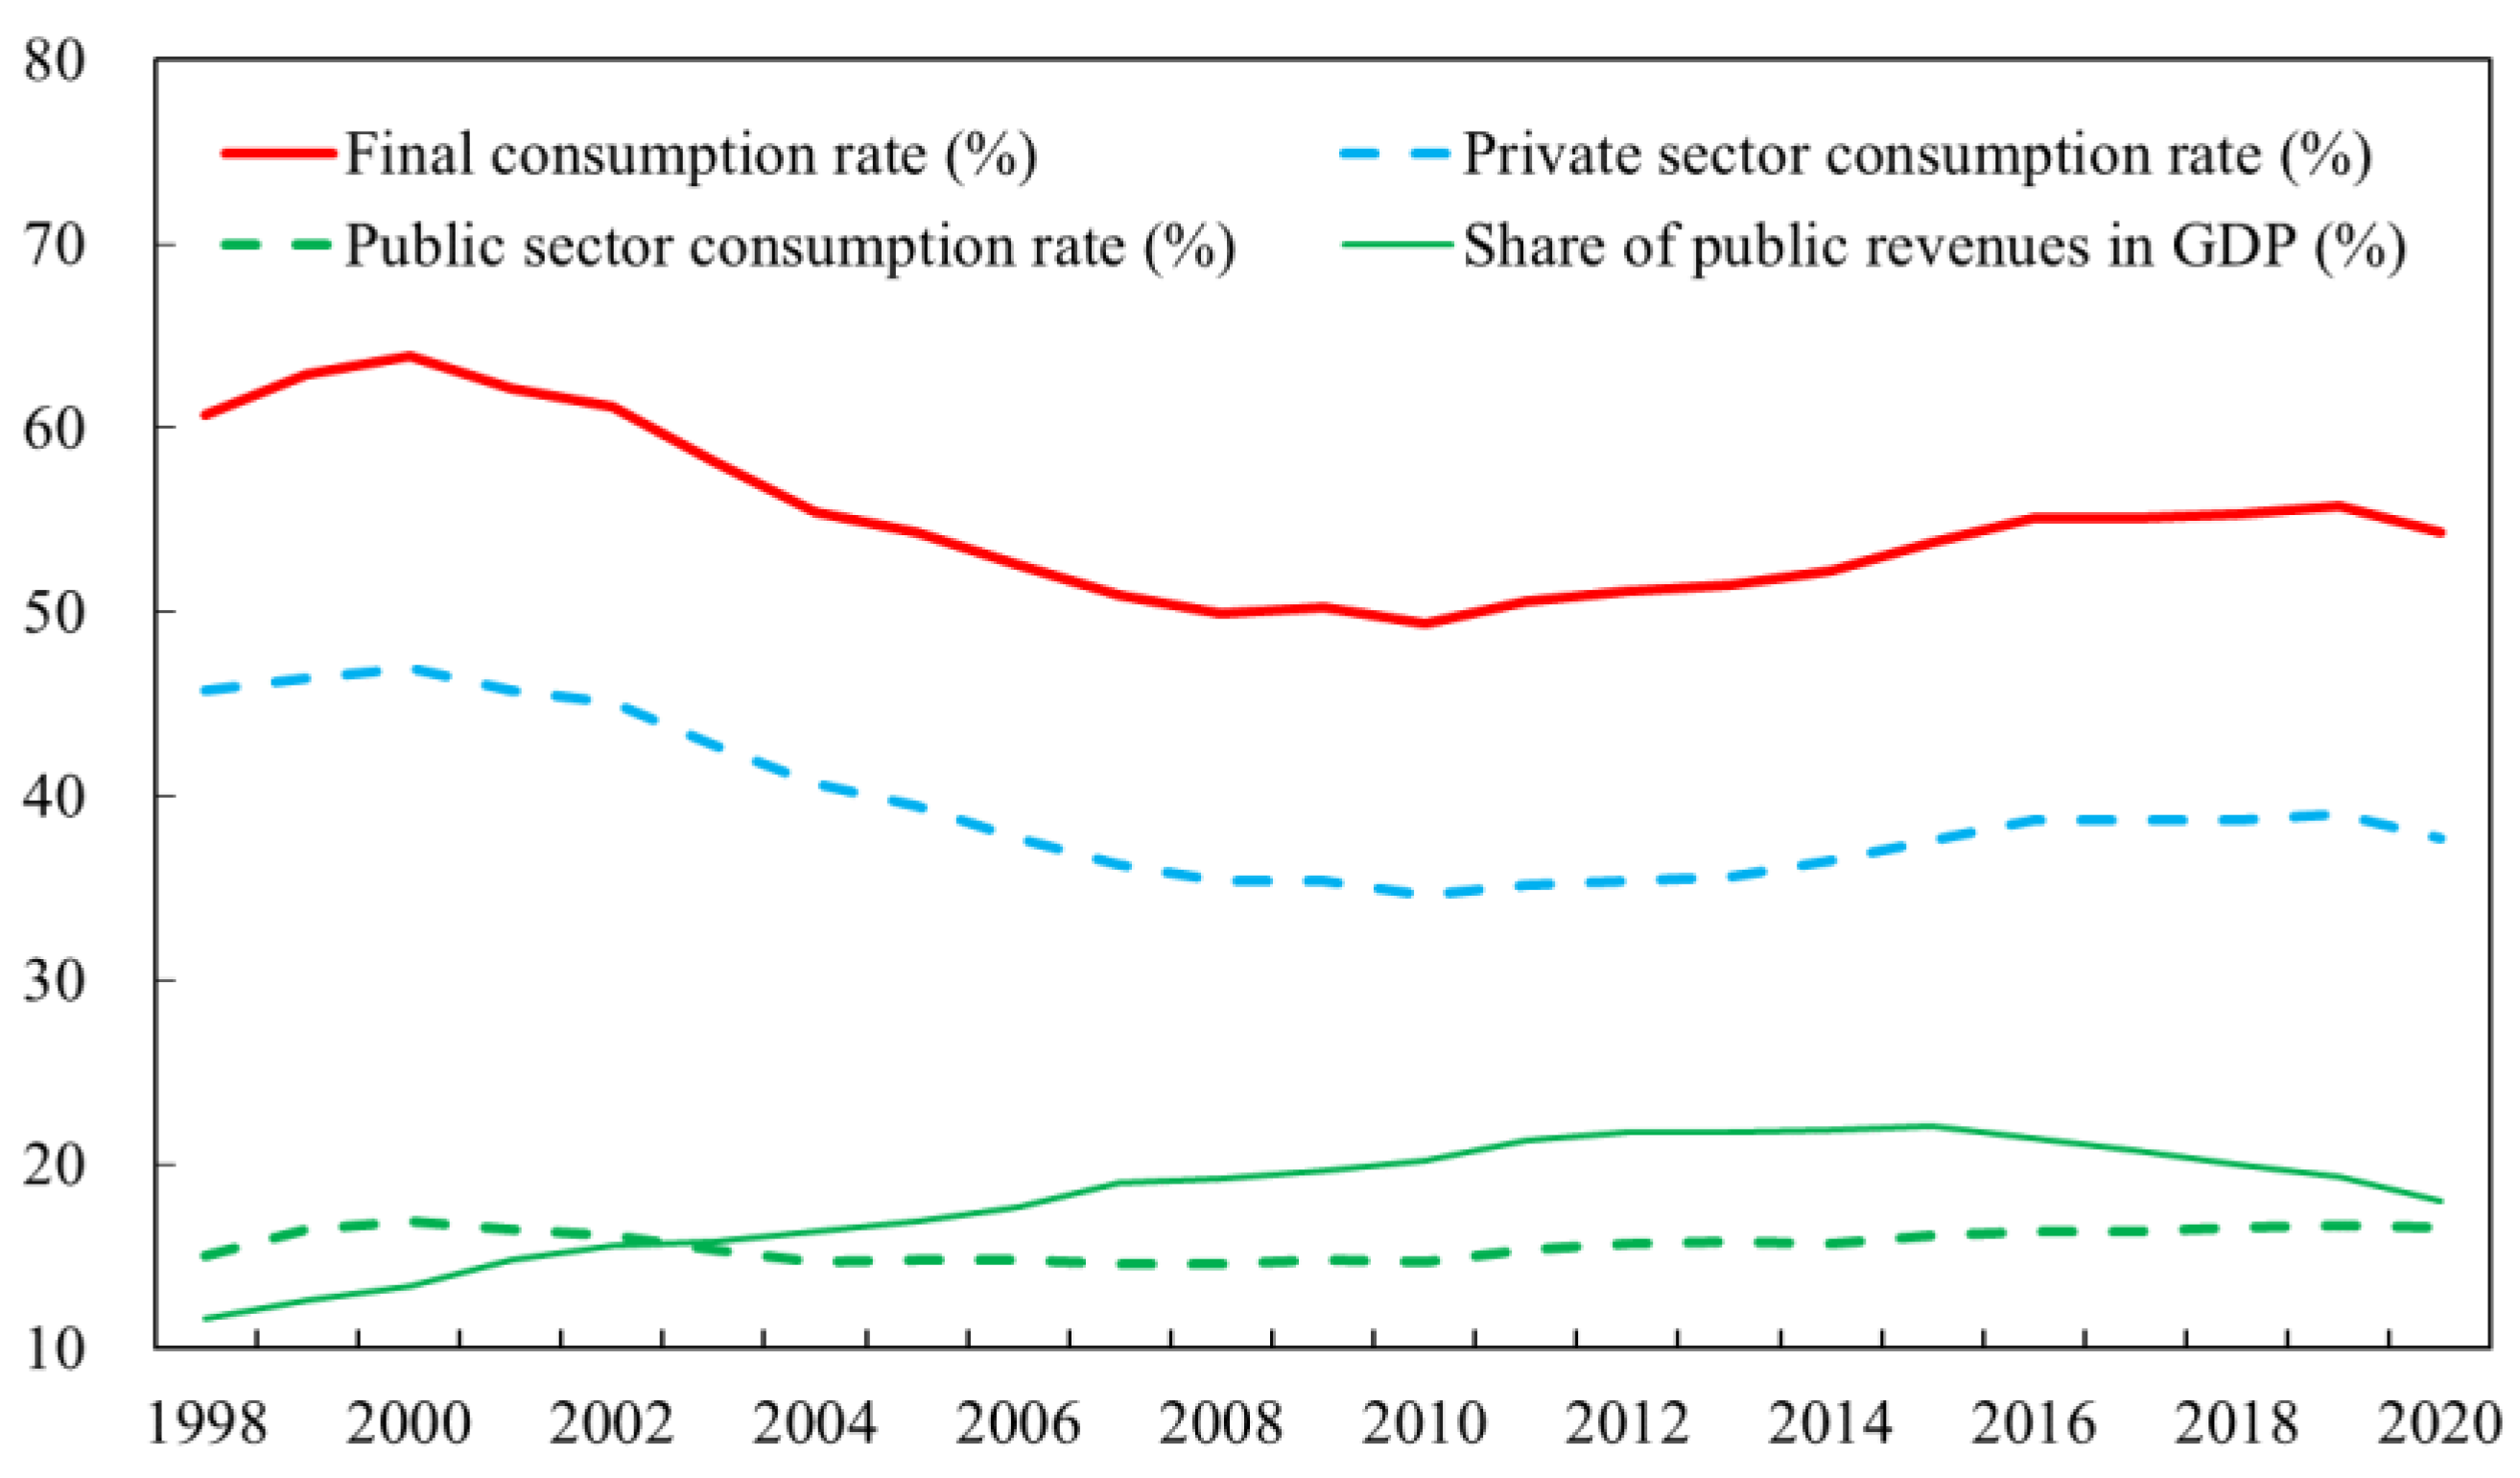
- The national income distribution effect. This means that land monopoly increases the income share of the public sector and reduces the income share of the private sector. Compared to the direct supply of land by farmers’ collectives, land monopoly actually diverts the value-added income of agricultural land conversion from the private sector to the public sector, resulting in a reversal of income share for the two sectors. Based on a rough estimate of the Yangtze River Delta, the average compensation standard for farmland was CNY 375,000–450,000 per hectare, and the average assignment fee for land use right was CNY 2,100,000–5,250,000 per hectare; the former is around one-tenth of the latter [17]. Obviously, land income is distributed in a way that favors the government, greatly increasing the share of public revenues in the national income. According to China’s official statistics, land revenue is maintained at more than half of the local government revenues, so much so that it is able to have a decisive impact on the share of public sector revenues in the GDP. In China, local governments generally prefer investing in infrastructure rather than spending on education, healthcare, and social security [18]. Therefore, the increasing income share of the public sector results in an increase in the share of investment in the GDP, thus squeezing consumption. The decline in the income share of the private sector will certainly restrain the ability to consume, thus reducing the share of consumption in the national economy.
- (2)
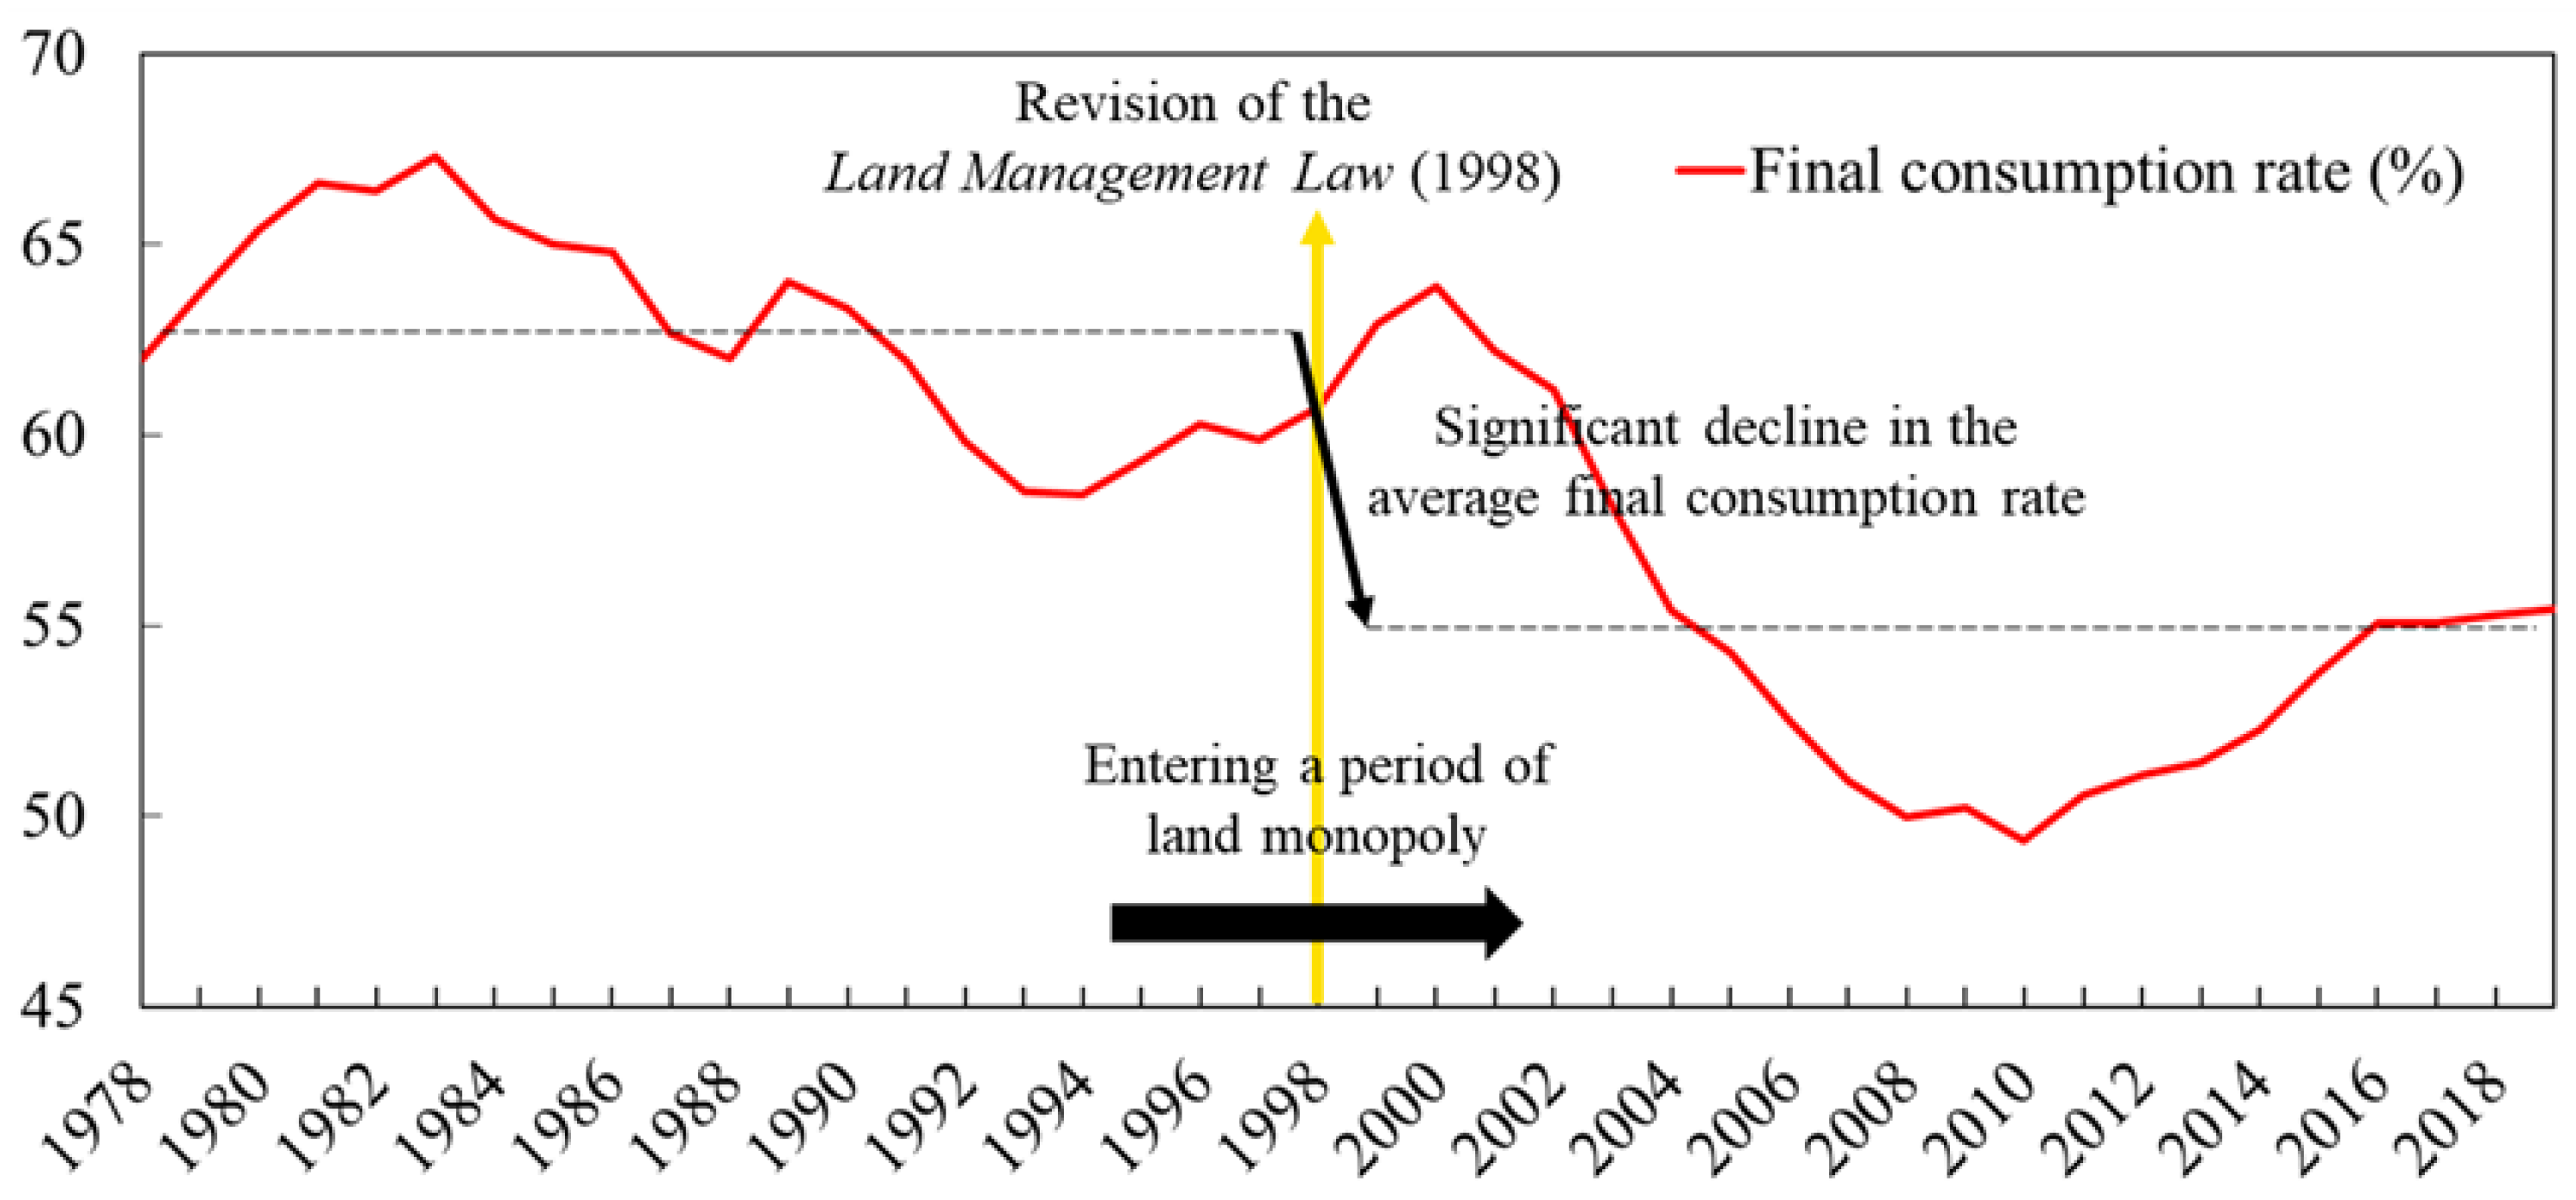
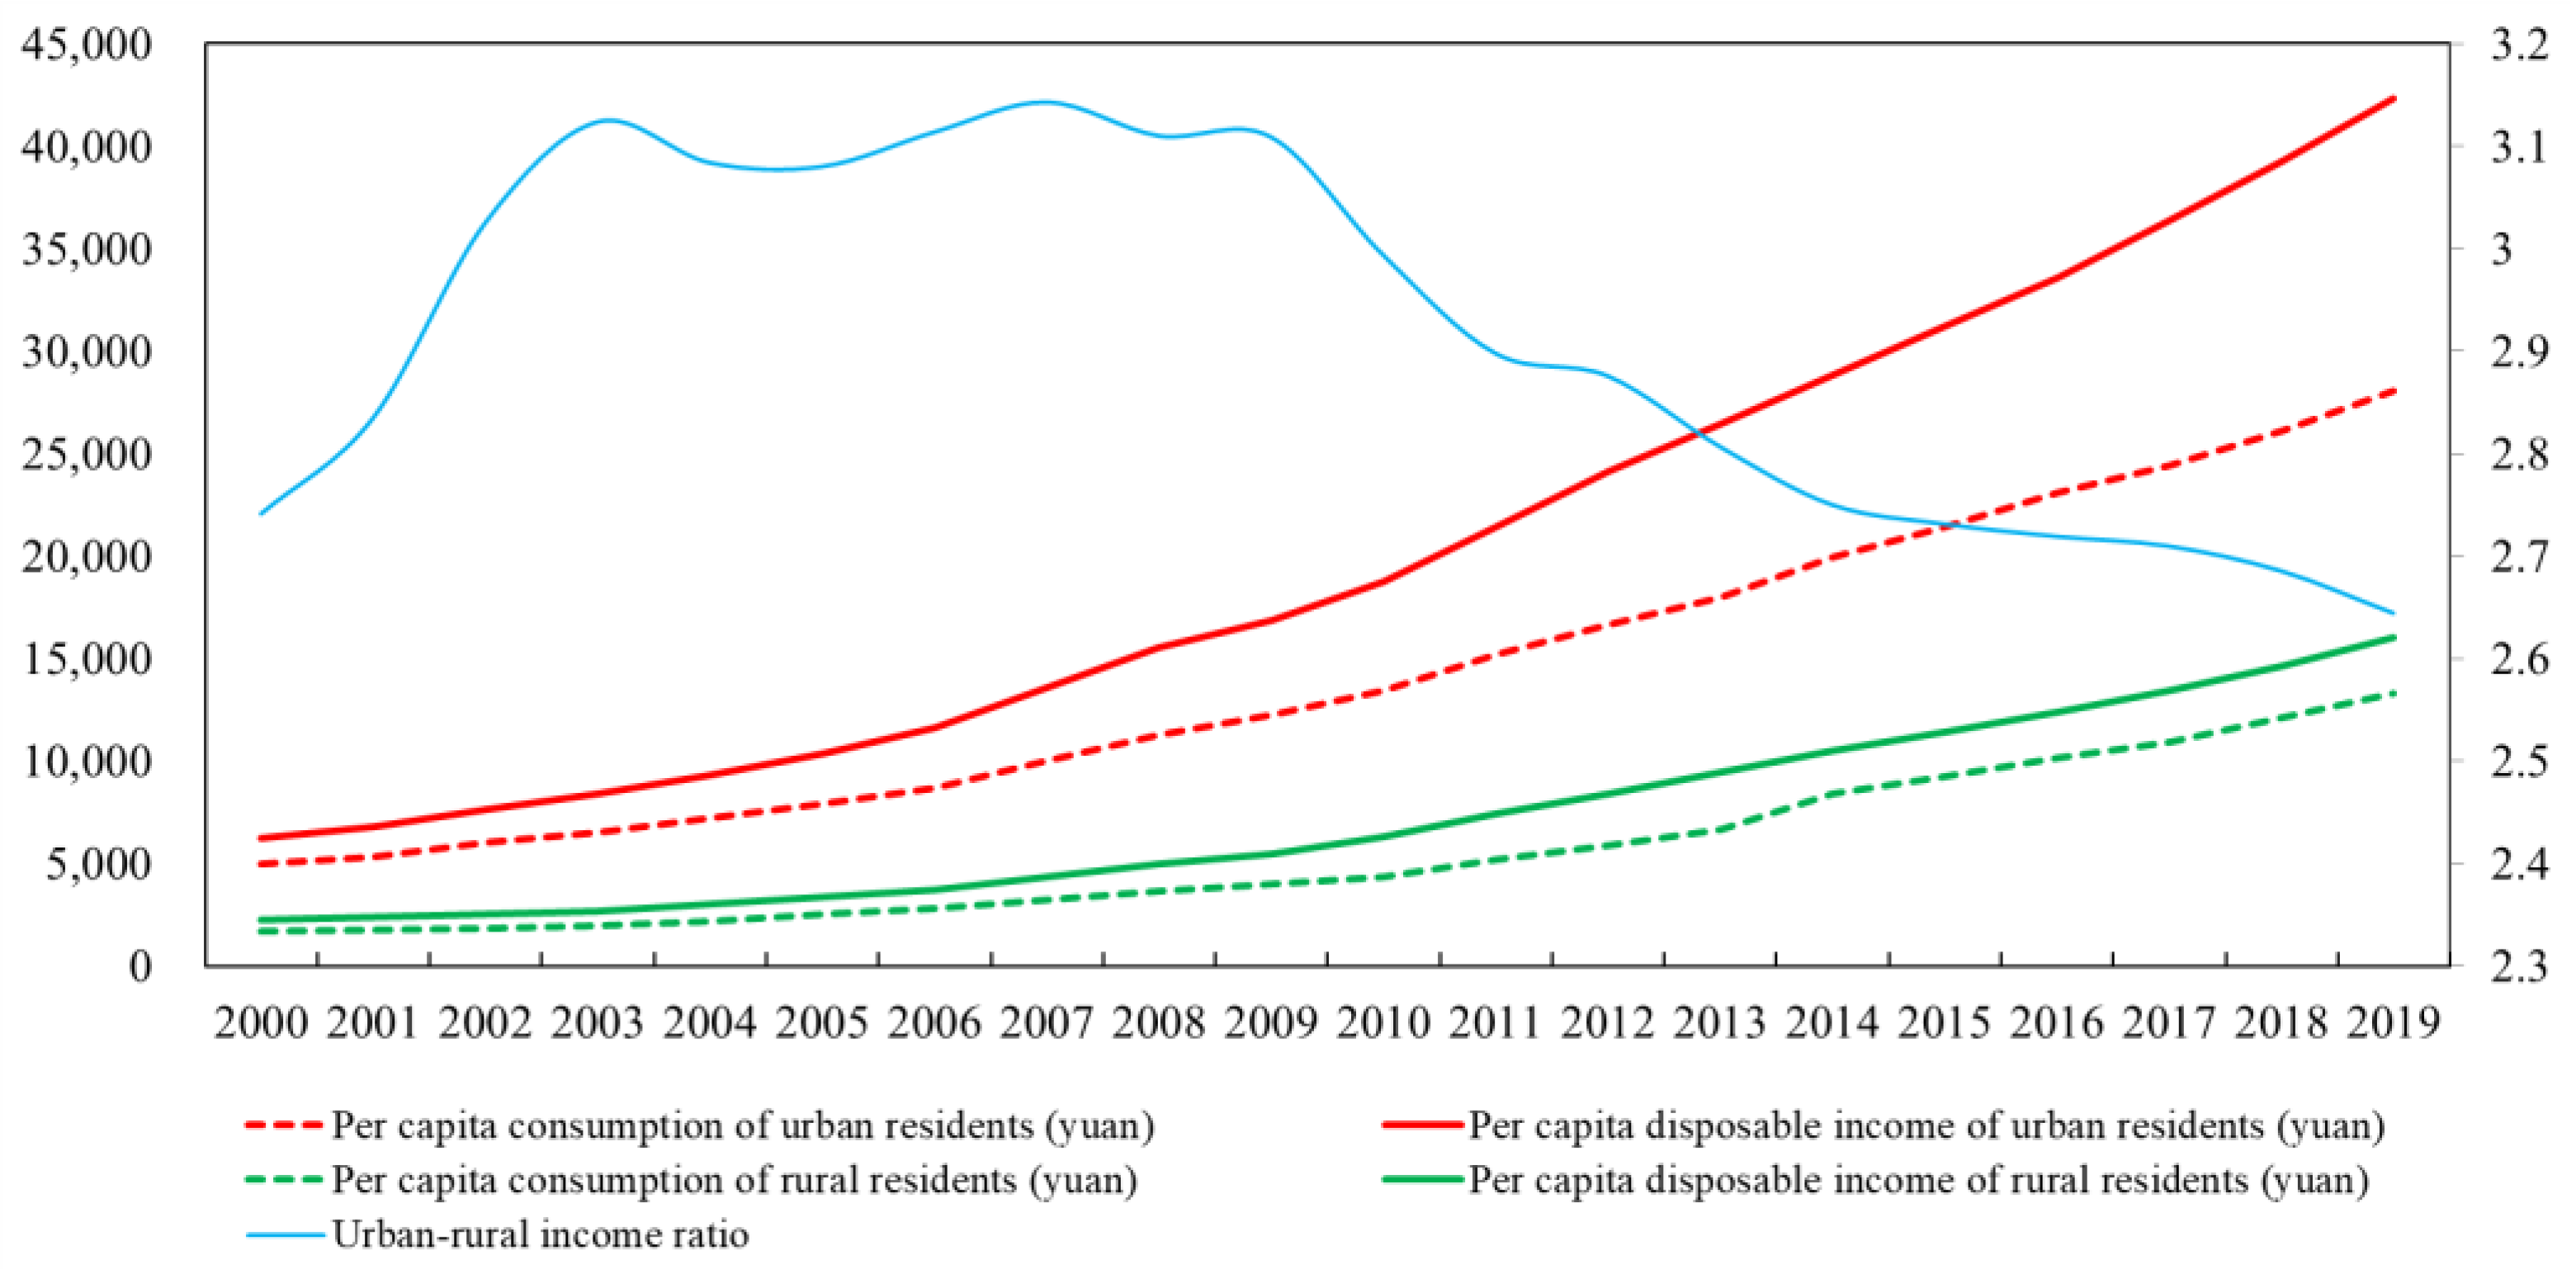
- The urban–rural income distribution effect. This means that land monopoly widens the income gap between urban and rural areas, thereby reducing the total urban and rural consumption. Before the land monopoly system was adopted in 1998, rural areas had the right to develop industries based on collective land, which gave birth to a large number of township enterprises [19]. At that time, China’s economy achieved “golden growth”, which was accompanied by increasing income levels among farmers and a continuously narrowing urban–rural income gap. After 1998, however, the new land monopoly system removed the right to develop industry on collective land. With the demise of rural industries, rural income growth slowed, falling from 12.78% in the 1990s to 10.65% in the 2000s. As a result, the urban–rural income gap widened rapidly, skyrocketing from CNY 1258 in 2000 to CNY 14,295 in 2019. Further, local governments invest most value-added land income in urban areas, which amounts to diverting land wealth from rural areas to urban areas. In other words, the land monopoly system constructs a mechanism of providing a rural subsidy for urban residents, which certainly expands the urban–rural income gap. Previous studies have shown that the continuous expansion of the urban–rural income gap will reduce the average and marginal propensity to consume throughout the entirety of society, resulting in a decline in the consumption rate [8].
3. Methodology and Data
3.1. Methodology
3.2. Variables and Data Sources
- (1)
- Dependent variable: the final consumption rate (final_consum). The final consumption rate is the share of the final consumption in the GDP. Final consumption includes both the private and public sectors or is counted as the sum of urban and rural consumption. In this paper, the final consumption rate is expressed as the ratio of provincial final consumption expenditure to the GDP.
- (2)
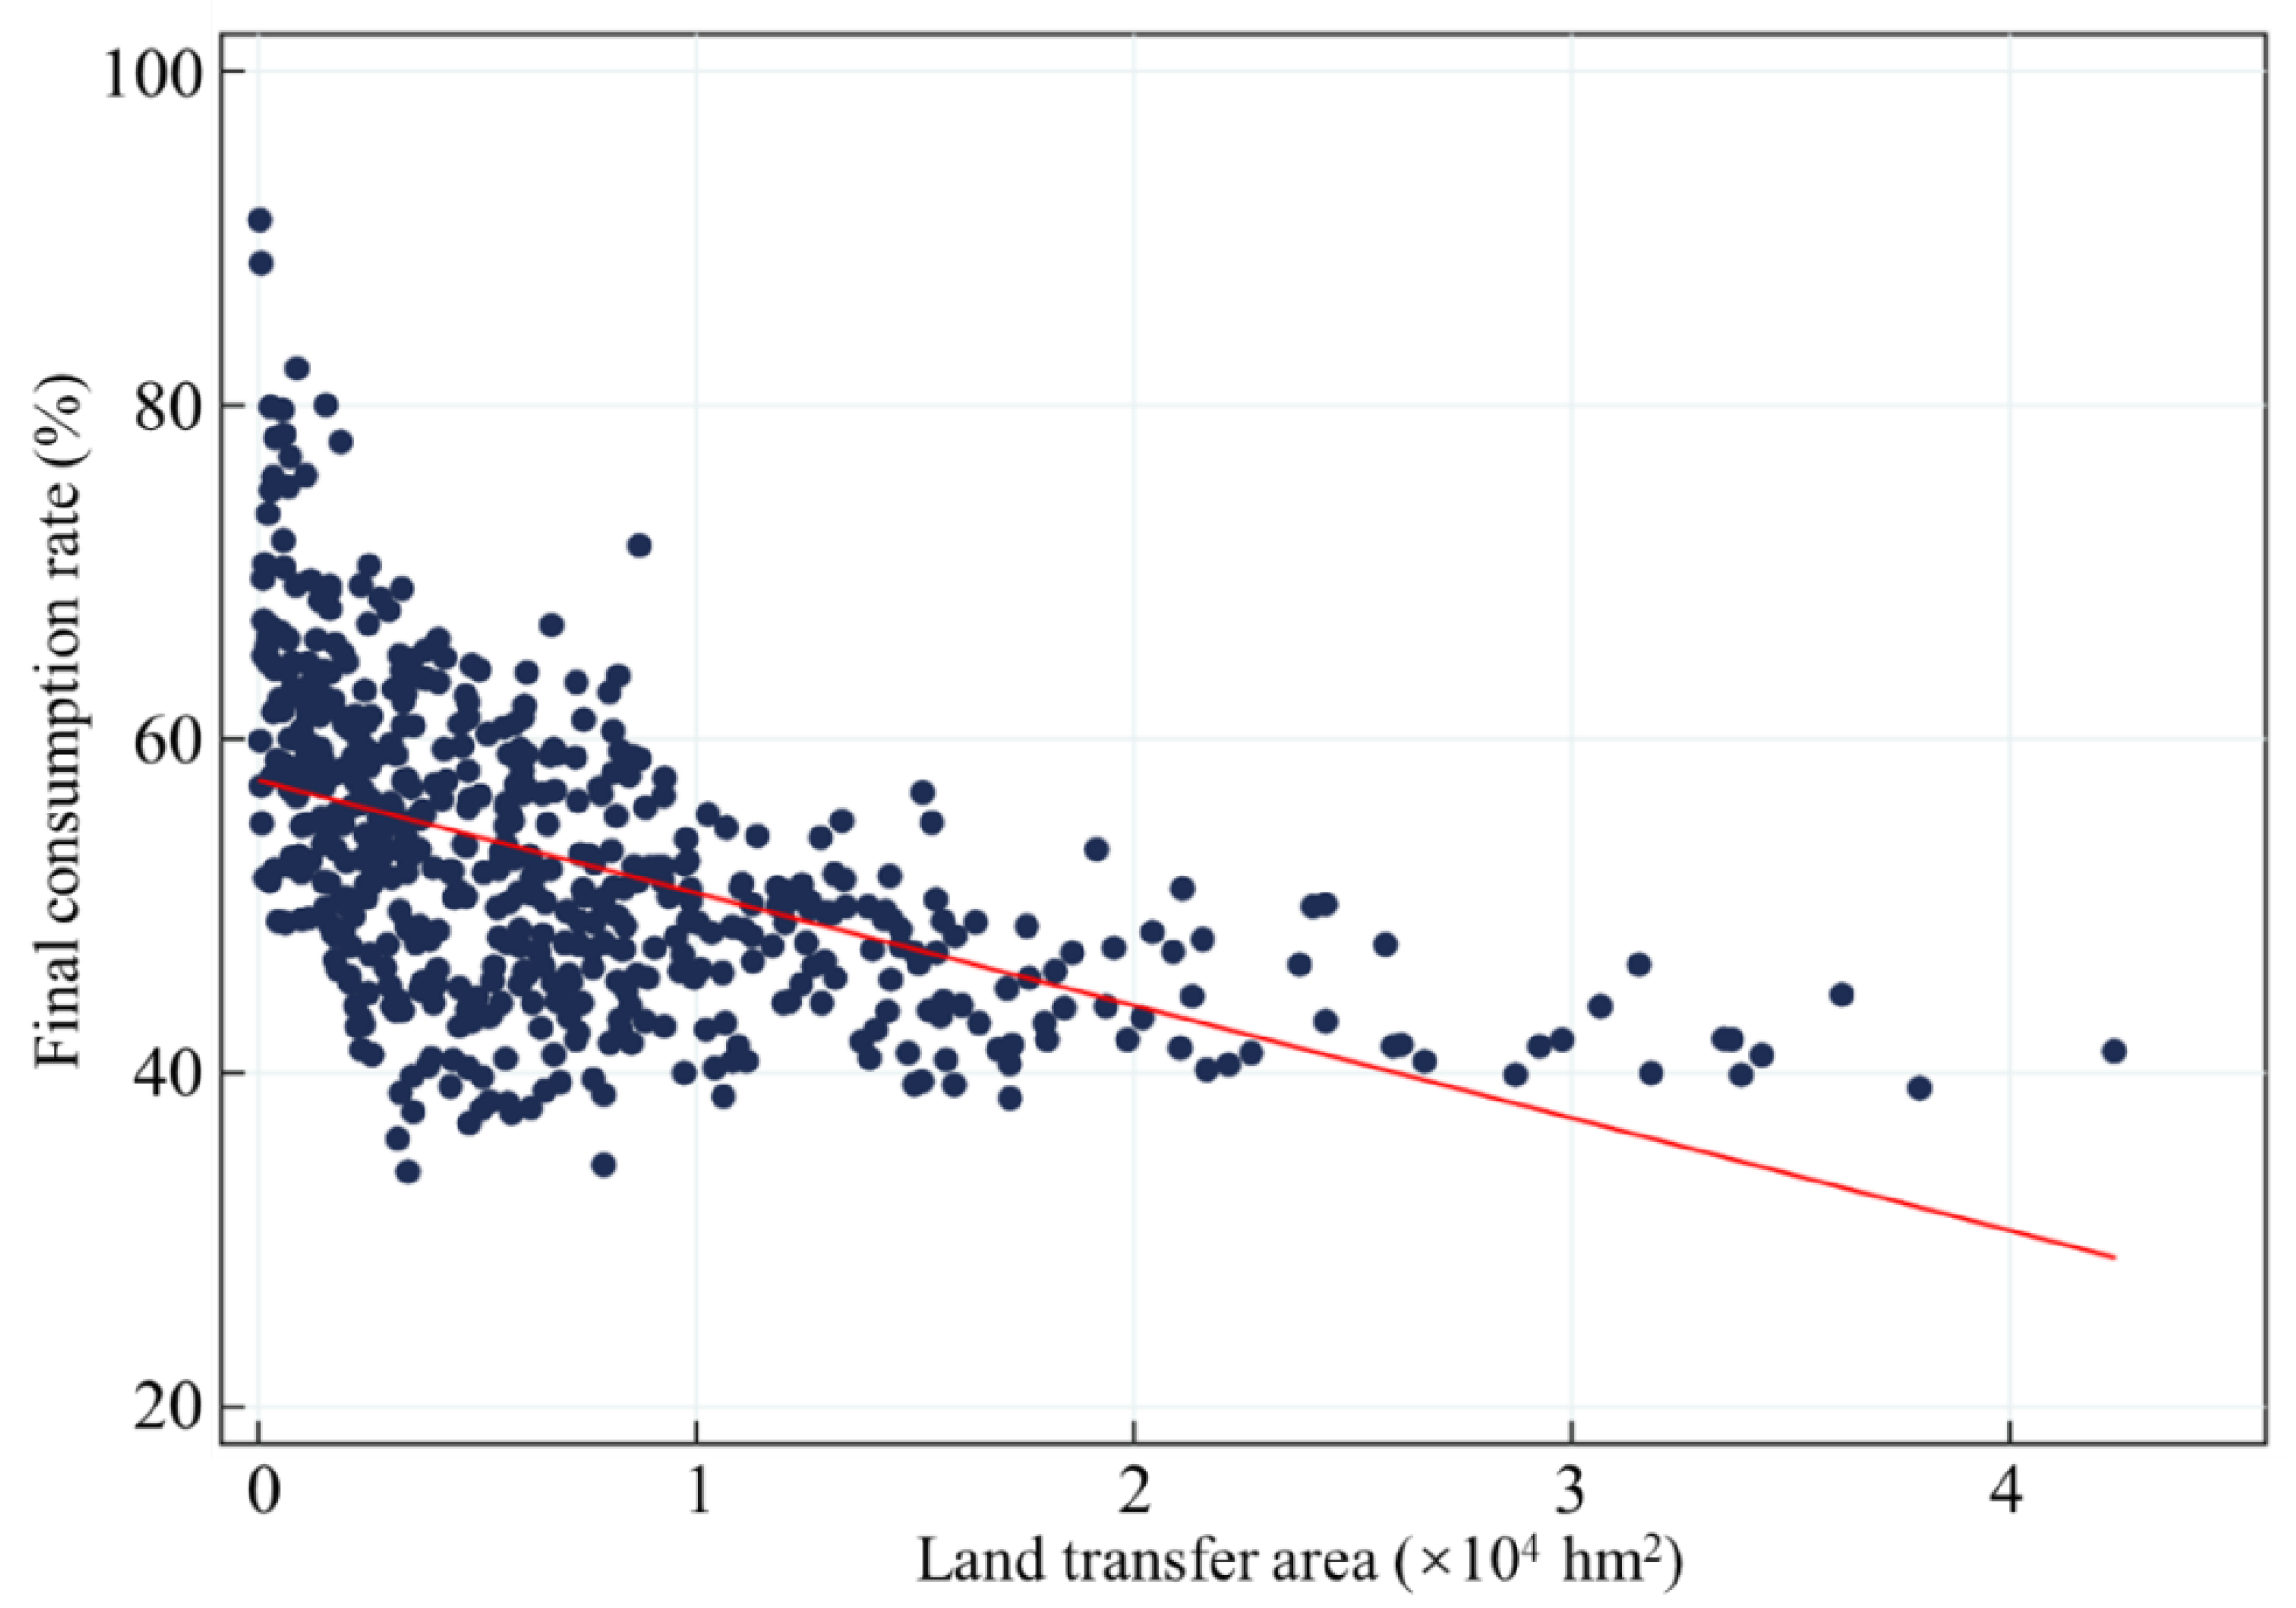
- Core explanatory variable: land monopoly (land). Land monopoly means that the government exclusively supplies land to the market. The government mainly transfers land to land users through bidding (zhaobiao), auction (paimai), and listing (guapai) to obtain monopolistic land income. Therefore, the land transfer area is a valid indicator for investigating the land monopoly system. The land transfer area refers to the area of land sold to land users by the government through bidding, auction, and listing. Since most of these transferred lands are expropriated by the government from rural areas, the land acquisition area is also an alternative measure of land monopoly. In this study, the land transfer area (land_1) was used as the main measurement method, and the land expropriation area (land_2) was used as the alternative independent variable for the robustness test.
- (3)
- Control variables: using studies from the literature, we also controlled a set of variables that might affect consumption in the regression model to alleviate omitted-variable bias as much as possible.
- (4)
- Mediator variable: according to the above theoretical analysis, the land monopoly system leads to a low consumption rate through two channels: the national income distribution effect and the urban–rural income distribution effect. Therefore, two mediator variables are proposed here to test the two effects: ① the share of public revenues in the GDP (public_share), which is expressed as the ratio of the fiscal revenue to the GDP (the fiscal revenue includes tax and non-tax revenue, and the land income is included in the non-tax revenue); and ② the urban/rural income ratio (urban_rural), which is expressed as the ratio of the per capita disposable incomes of urban and rural residents.
- (5)
- Data sources and descriptive statistics: this study used data from 31 provincial units in China from 2000 to 2017. Data for land transfer and expropriation were obtained from the China Land Resources Statistical Yearbook. Data for fiscal revenues and expenditures were obtained from the China Finance Yearbook. Data for employment in state-owned enterprises were obtained from the China Urban Statistical Yearbook. Population data were obtained from the China Population Statistical Yearbook. Other data were obtained from the China Statistical Yearbook. Table 1 shows the descriptive statistics for the variables.
4. Results
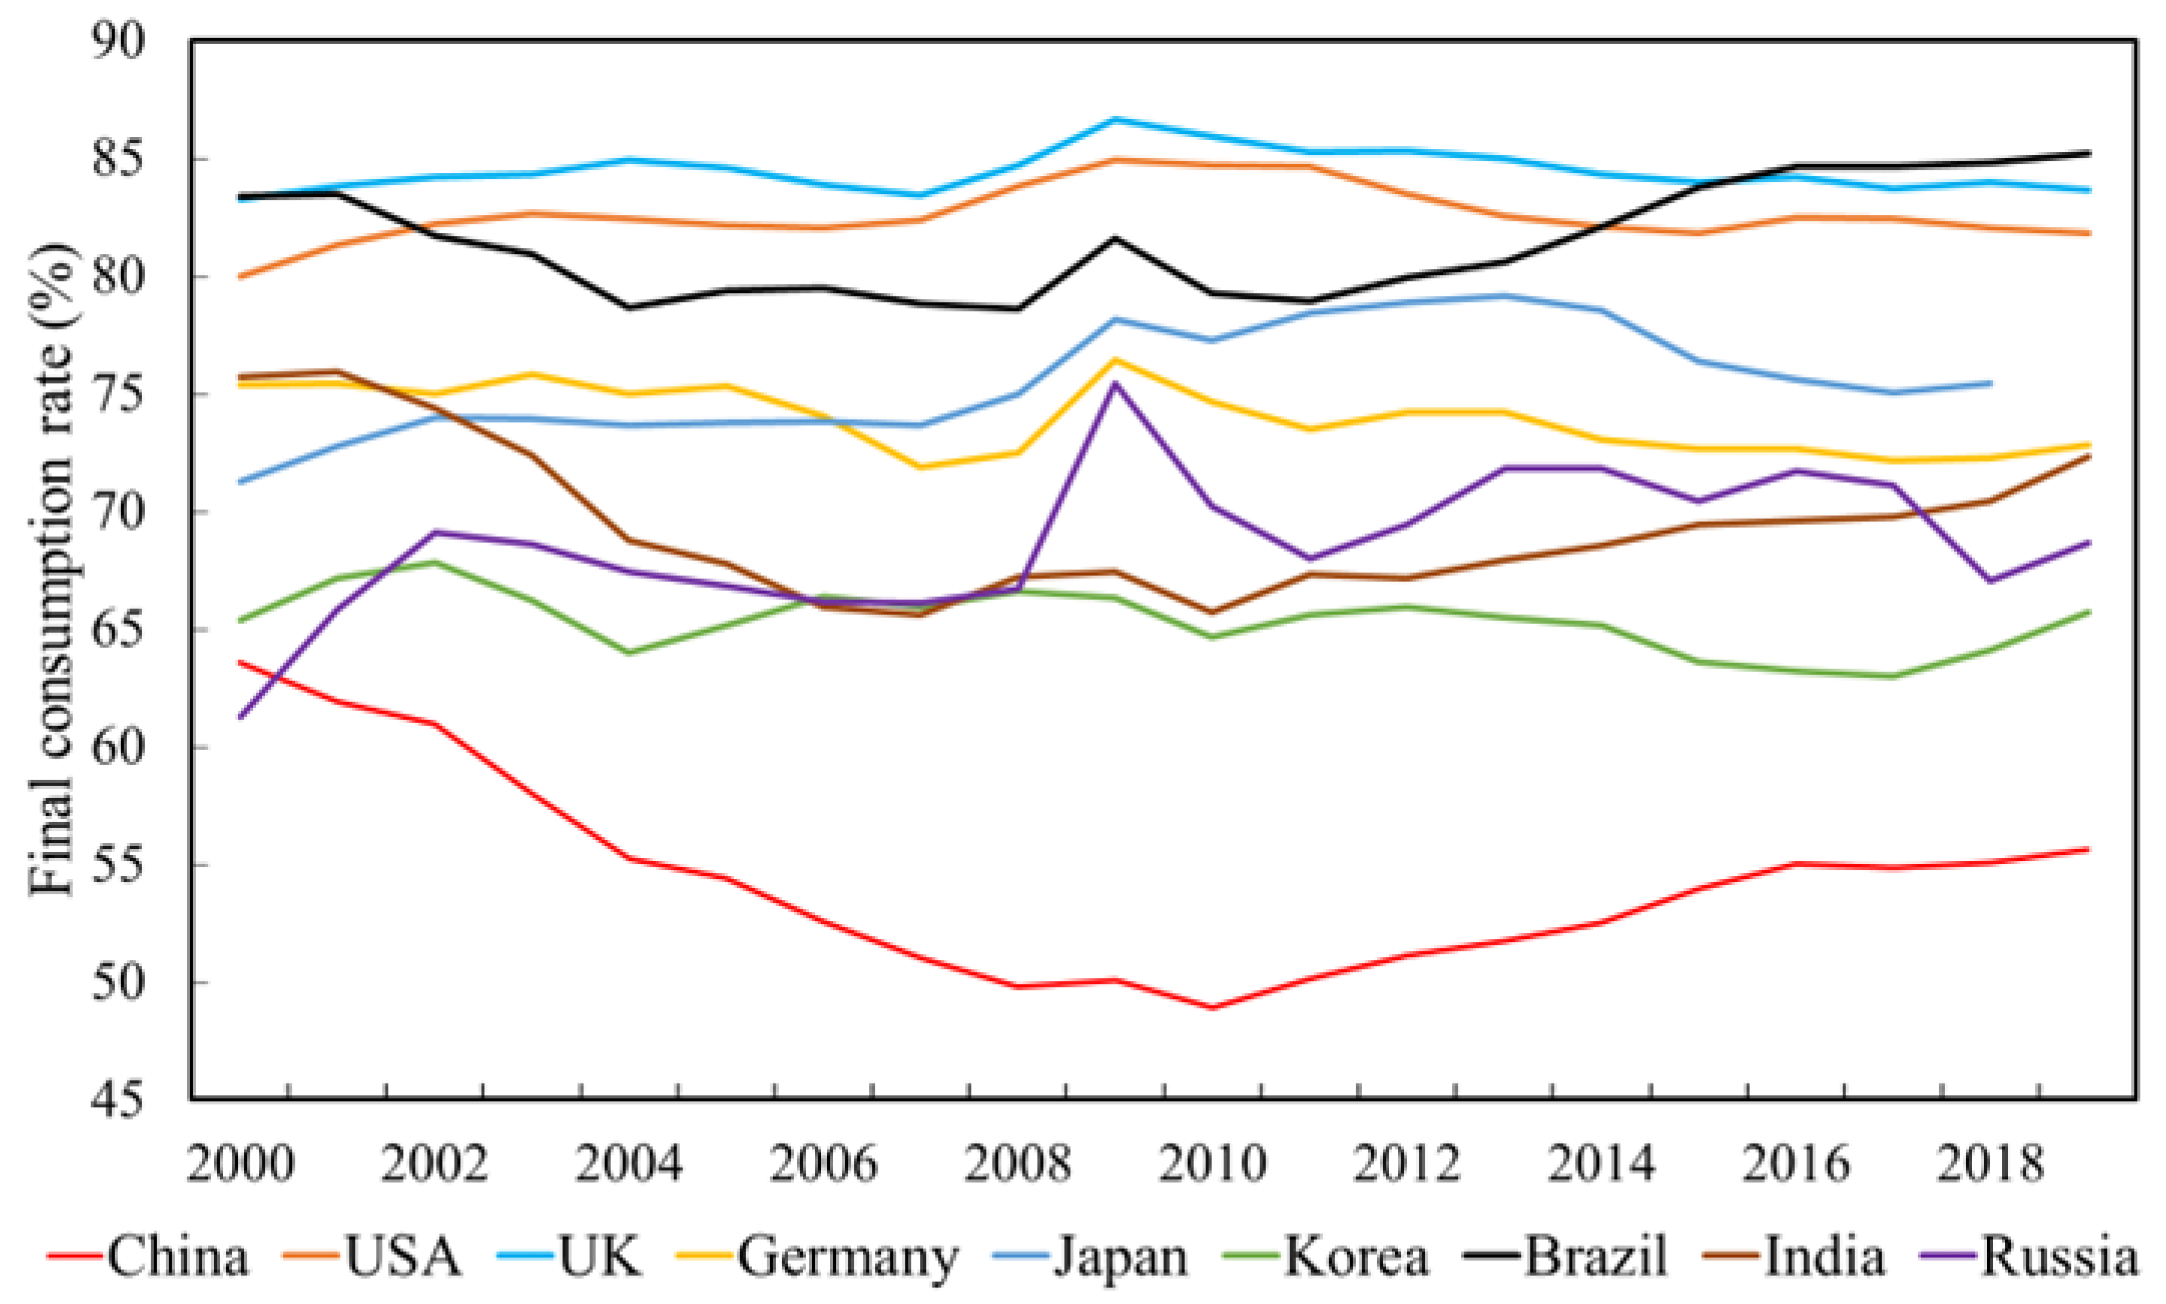
4.1. Descriptive Analysis
4.2. Baseline Results and Robustness
- (1)
- per_gdp was significantly negative, and its square term (per_gdp2) was significantly positive. This suggests a significant U-shaped relationship between the consumption rate and per capita GDP, thus confirming Keynes’ absolute income hypothesis [20]. The U-shaped relationship may be due to the correlation between labor income and economic development stage; when the per capita GDP is at a low level, a larger share of agriculture provides a higher share of labor income and expands household consumption. Then, the increase in the per capita GDP leads the economy into an industry-led development stage, and household consumption decreases as the labor income share drops. Finally, a further increase in the per capita GDP represents the dominant position of the service industry (after 2012, the share of the tertiary industry exceeded the share of the secondary industry in China), and household consumption is pushed up again by the increase in labor income. In addition, the estimated turning point based on the results was CNY 60,000. During our examination period, this value was reached only in the eastern provinces.
- (2)
- urban was significantly positive, indicating that urbanization has a positive effect on promoting consumption. One potential explanation is that urbanization reduces the motive of rural residents to save preventively.
- (3)
- live_ratio was significantly positive, indicating that public expenditure for people’s livelihoods is conducive to household consumption. This may be due to the fact that more public expenditure on people’s livelihoods relieves household spending pressure on health and education, thus reducing the households’ precautionary saving motivation.
- (4)
- depen_ratio was significantly positive, indicating that an increase in the share of the dependent population will promote consumption. This may be due to the fact that dependents contribute to the consumption but not the income of the households to which they belong.
- (5)
- sta_emp was significantly positive, indicating that a higher share of employment in state-owned enterprises may be a favorable factor for consumption because SOEs provide more employment security and thereby diminish the need for precautionary savings for households with one or more members employed by SOEs.
- (6)
- export_ratio was not significant, indicating that export characteristics might not be able to explain changes in consumption. Due to space constraints, control variables are not reported individually below.
4.3. Heterogeneity Analysis
- (1)
- Regional heterogeneity: there are large disparities in regional development levels in China, with the central and western regions lagging behind the eastern regions. Generally speaking, at higher stages of development, urban areas will increase their feedback to rural areas, and much of the land wealth transferred to urban areas will be invested back into rural areas such as rural public infrastructure, thus reducing the urban–rural income gap. In other words, when entering a higher development stage, the return of land income can mitigate the impact of monopolistic land transfer on the mediating variable (the urban/rural income ratio). Based on the statistics from 2000 to 2017, the mean value of the urban/rural income ratio in the eastern provinces was lower than that in the central and western provinces. In 2017, the average value of urban/rural income ratio was 2.34 in the eastern provinces and 2.71 in the central and western provinces. Accordingly, it is reasonable to speculate that the harm of the land monopoly on consumption will decrease in the eastern regions.
- (2)
- The heterogeneity of economic catch-up and government intervention: due to the motivation of political promotion, there is a desire among local governments in China to compete for growth, resulting in a situation of economic catch-up. The motivation to pursue economic catch-up often drives local governments to expand fiscal investment to enhance intervention in economic growth. However, because local governments seek economic growth, government intervention exhibits a distinct structural bias in fiscal investment. In a high-catch-up scenario, local governments prefer to invest (much of which is financed by land revenue) in fields that are more conducive to economic growth [18]. Following this motive, it is clearly more beneficial to invest in more economically efficient urban areas than in rural areas. However, such urban-biased investment policies often incidentally exacerbate urban–rural inequality [25]. Our data indicate the mean government intervention intensity is stronger in the high-economic-catch-up group, while a larger urban–rural income ratio is coupled with strong government intervention. Therefore, we argue that higher levels of economic catch-up may enhance government intervention and thus widen the rural–urban income gap.
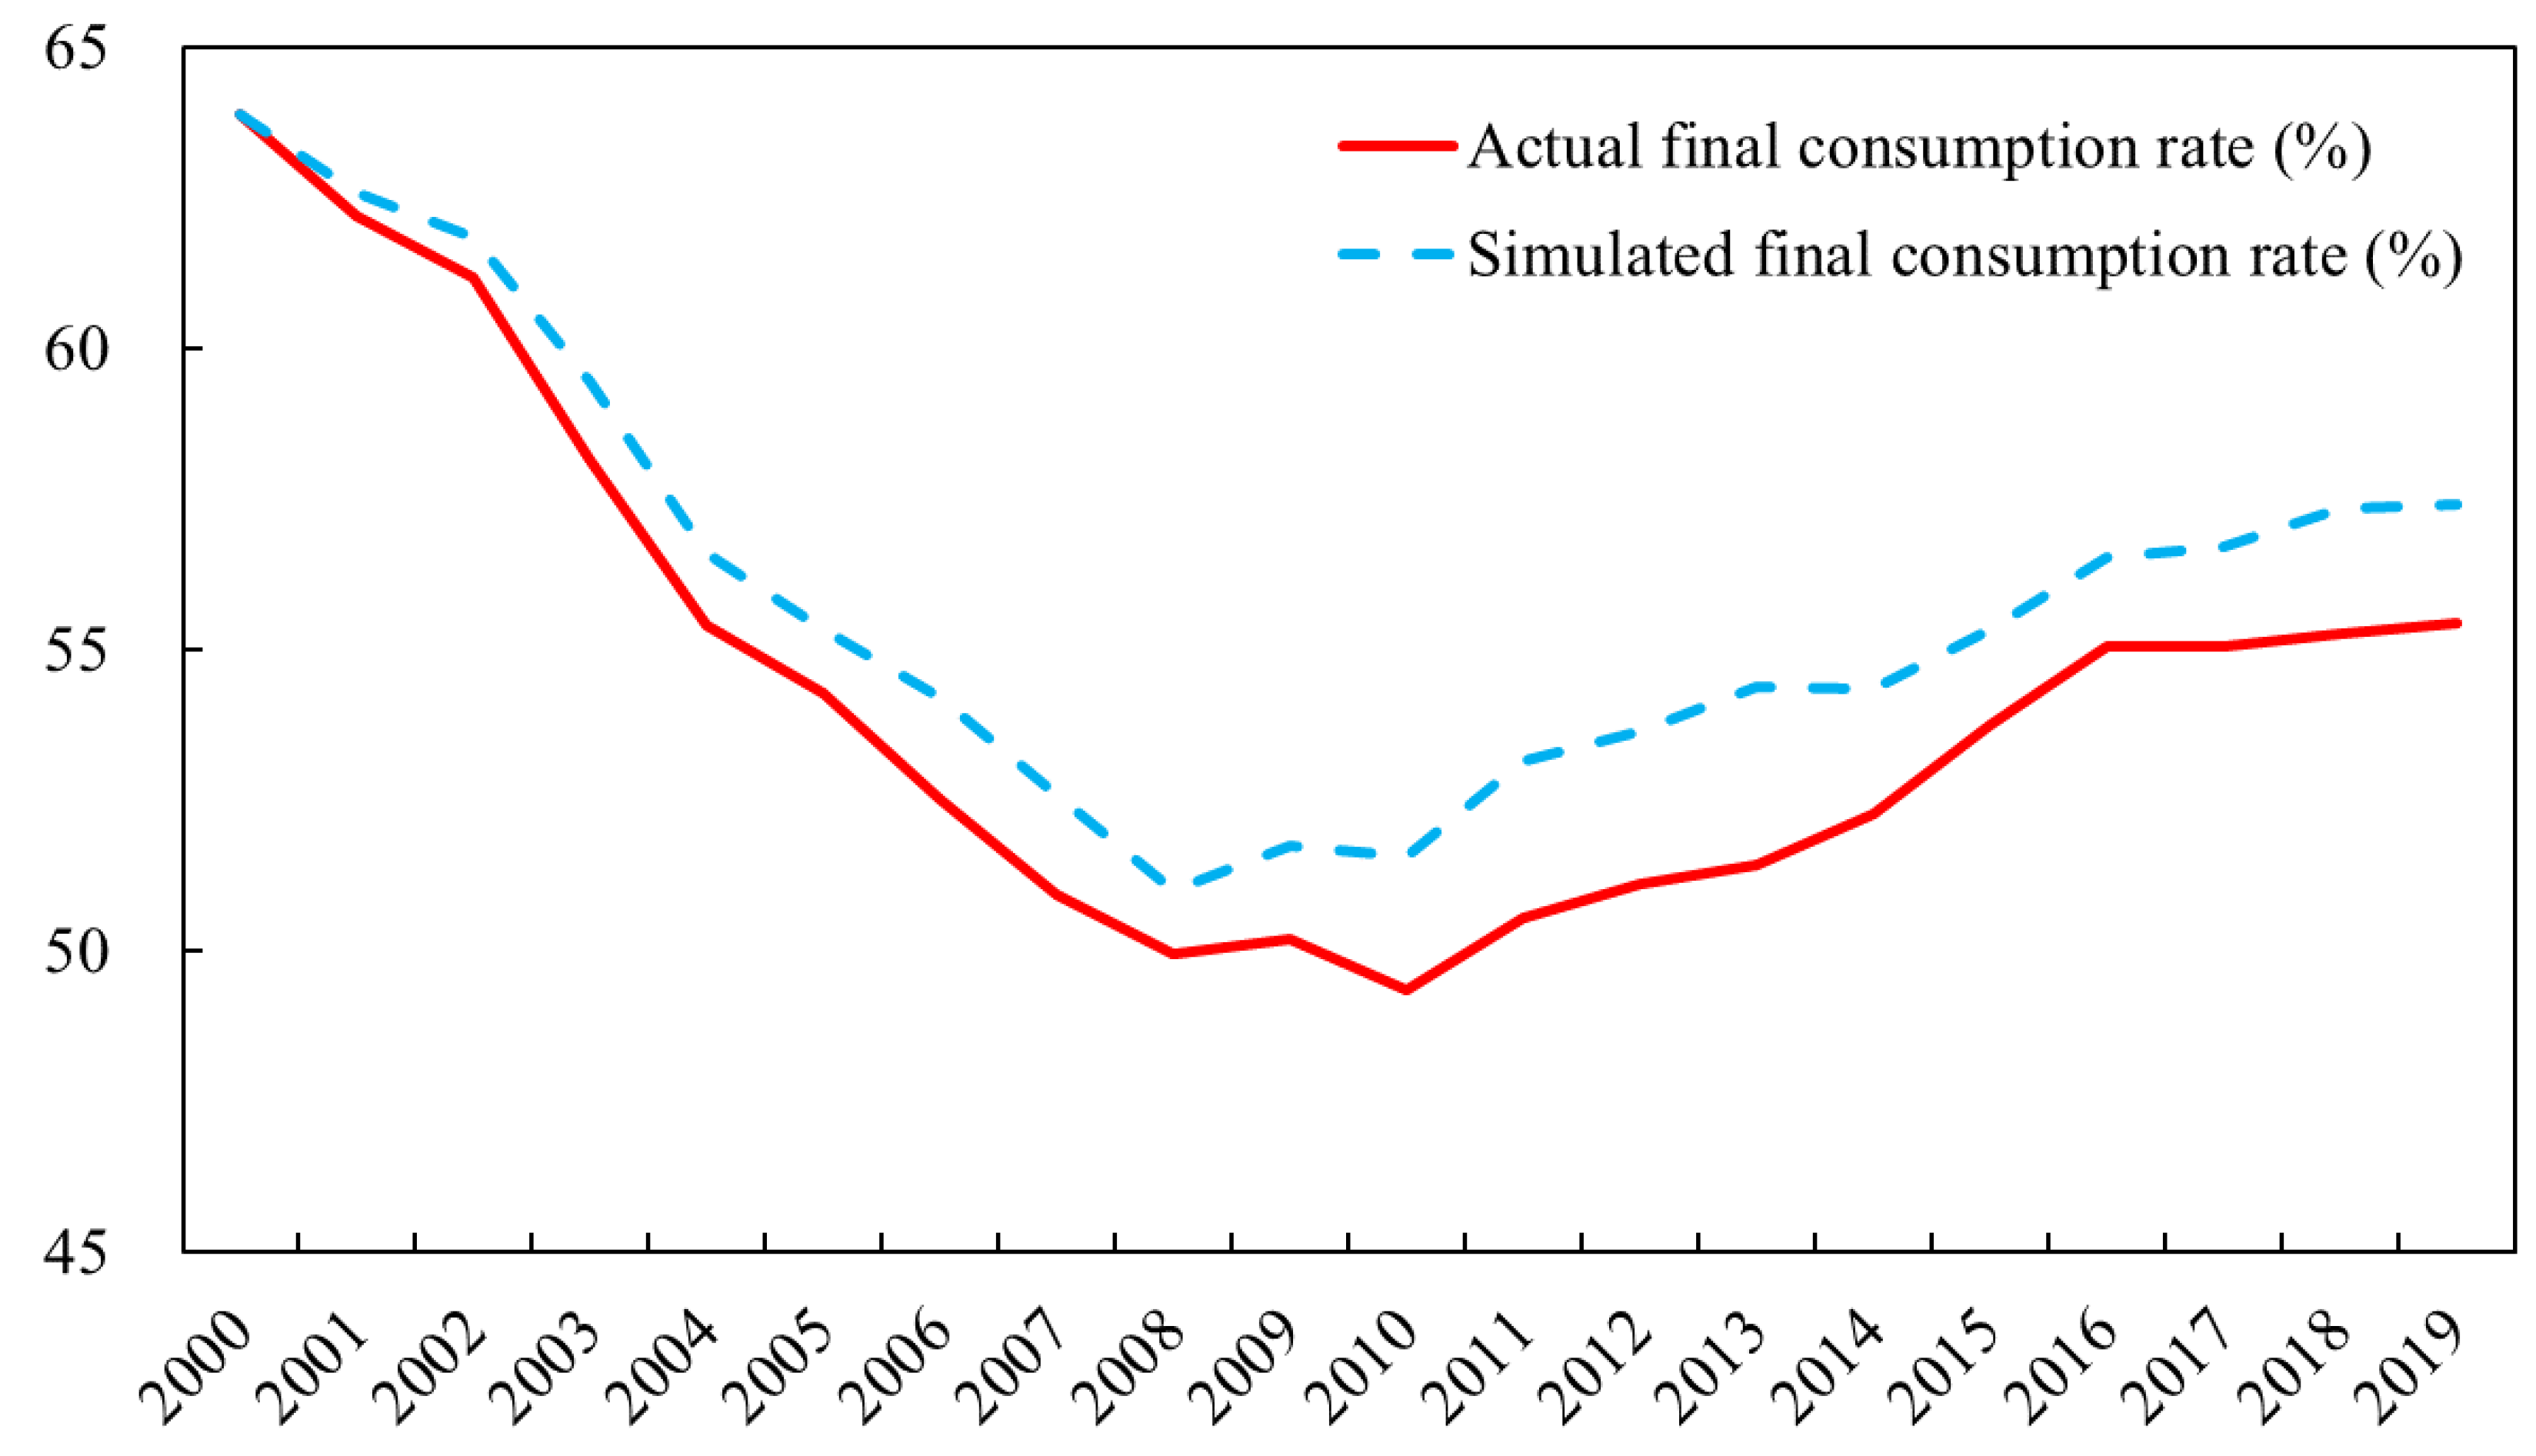
4.4. Influence Mechanism
5. Discussion
6. Conclusions and Implications
Author Contributions
Funding
Data Availability Statement
Conflicts of Interest
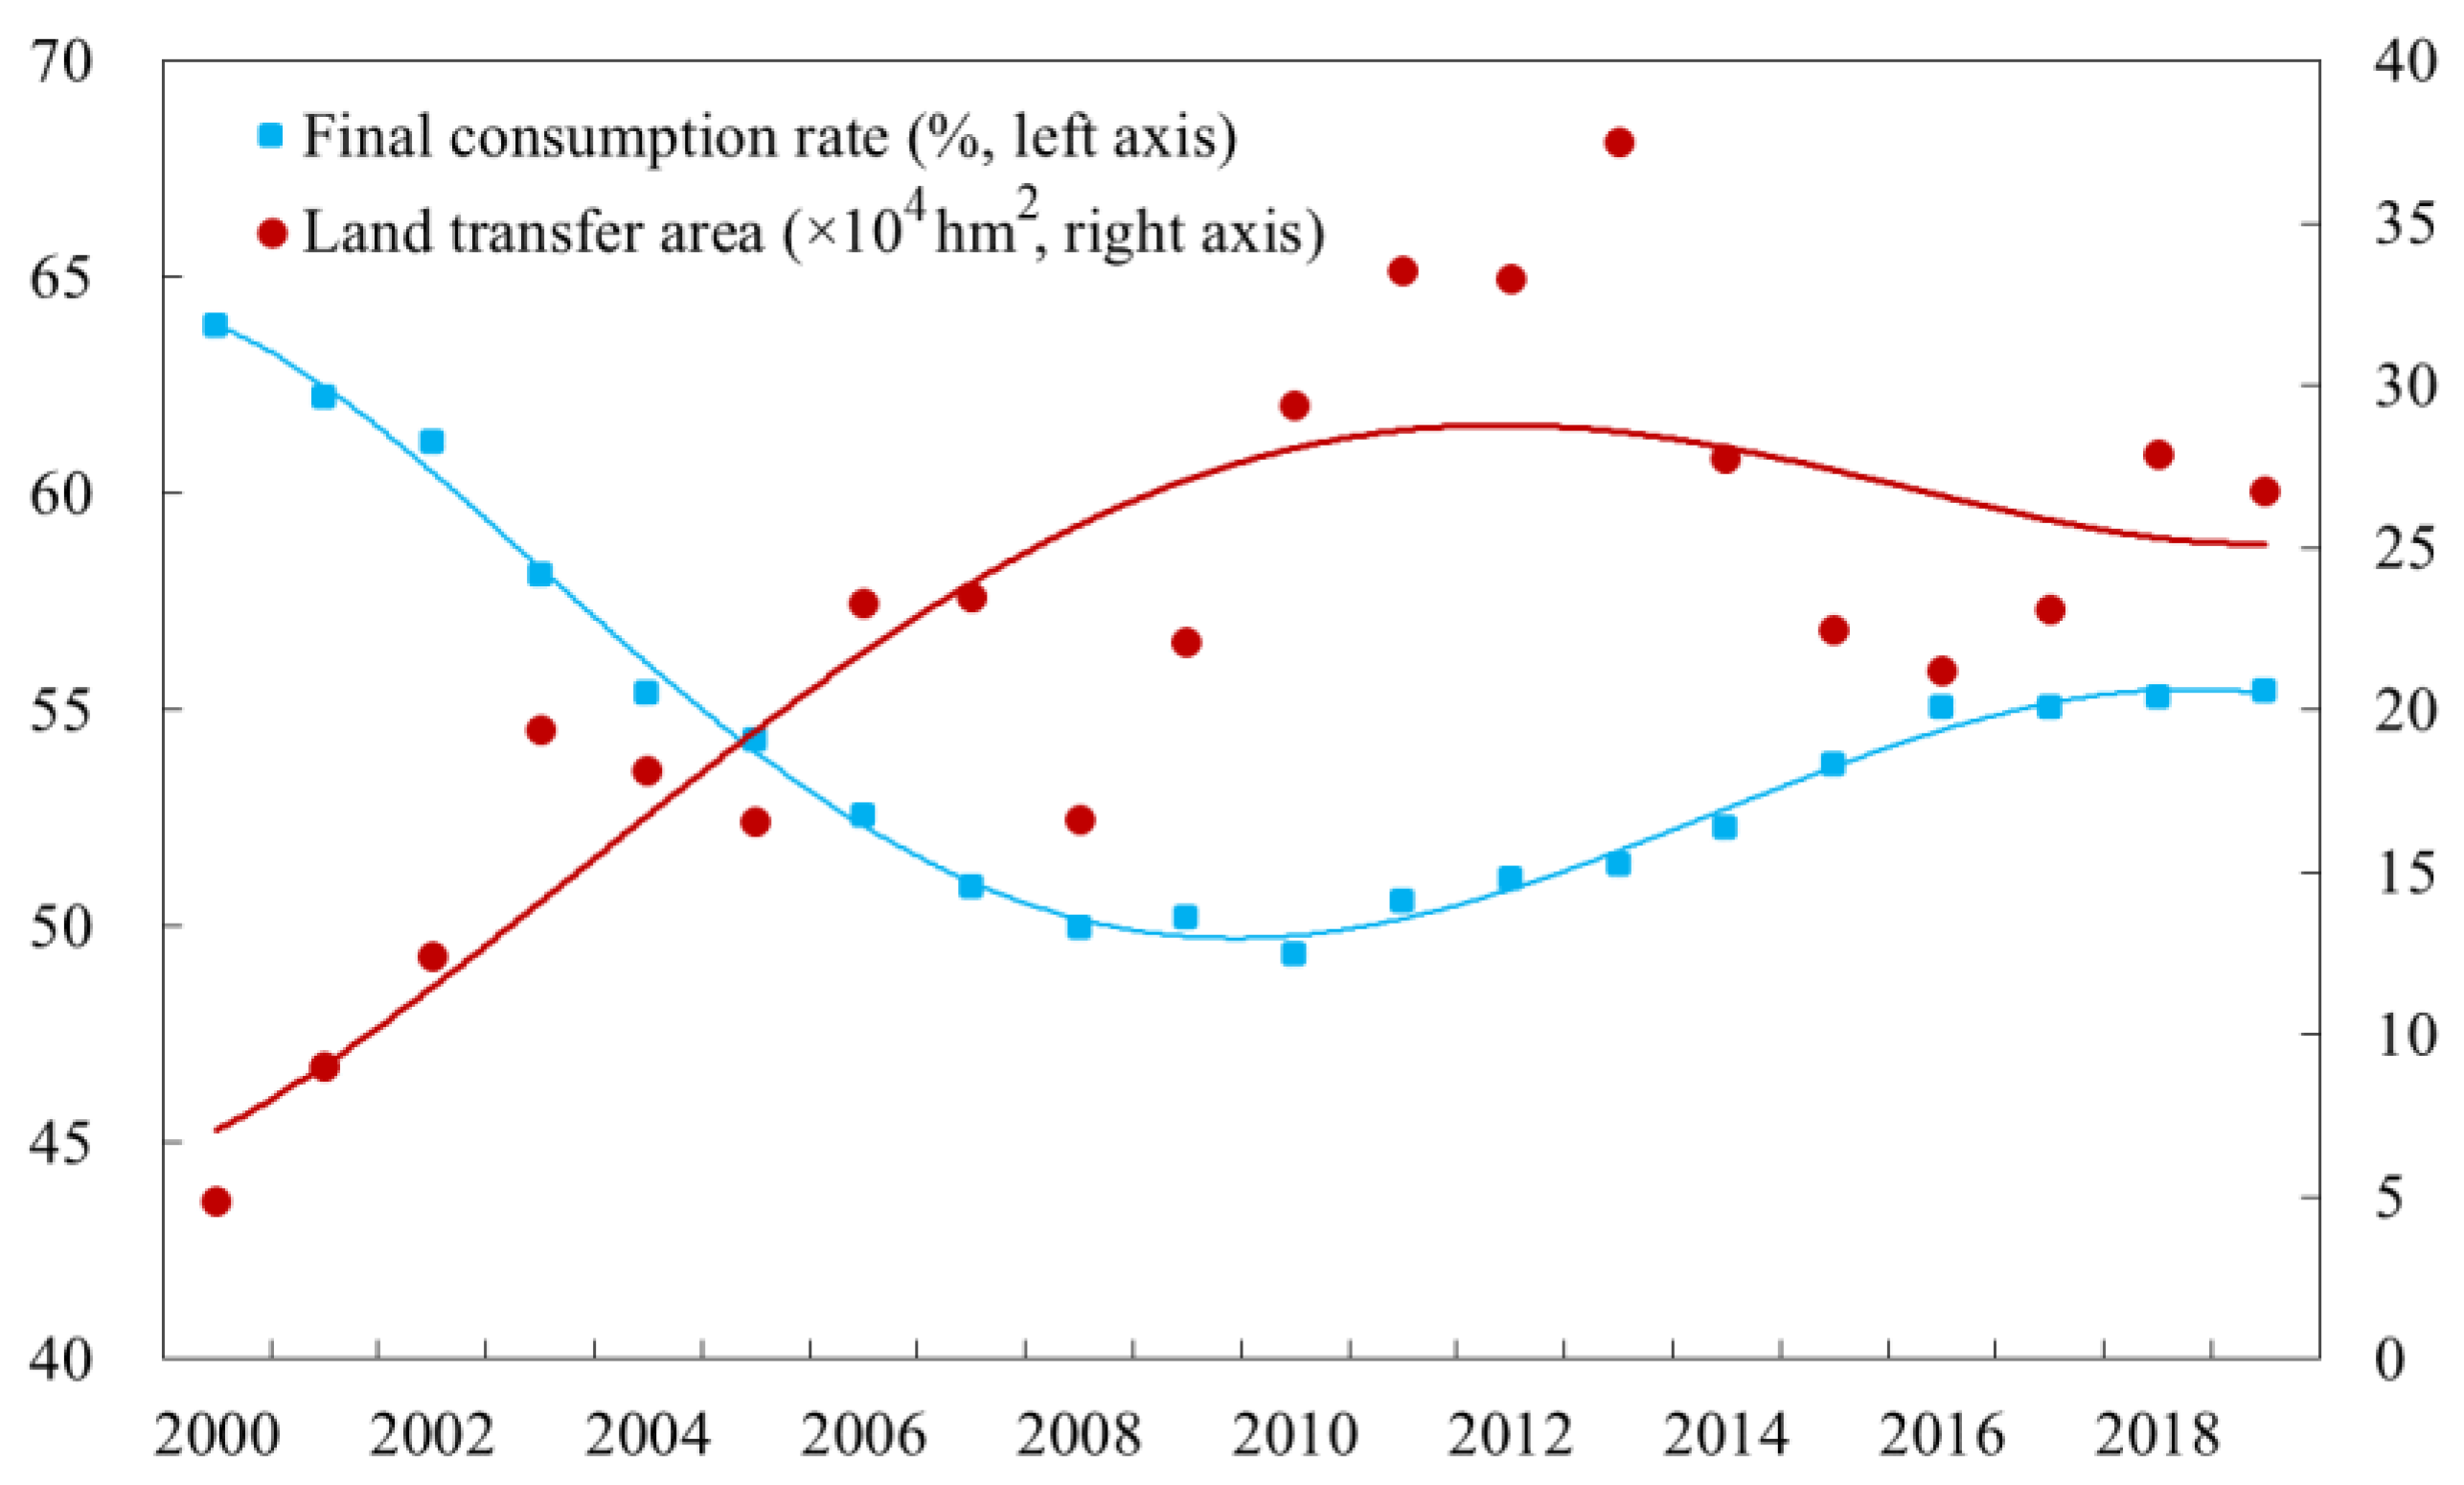
| 1 | “Land transfer area” refers to the area of land sold by the government to land users through bidding, auction, and listing. These lands are exclusively supplied by the government and are therefore monopolistic in nature. |
| 2 | In order to have enough cultivated land to ensure food security, China has implemented a cultivated land requisition–compensation balance policy. The more local governments sell land for construction, the more cultivated land is expropriated, and the more cultivated land needs to be replenished accordingly. Land reclamation is an important way to replenish cultivated land. Therefore, the area of land reclamation is related to the core explanatory variable (land transfer area). However, the land reclamation area has no direct relationship with the final consumption rate. Therefore, the land reclamation area as an instrumental variable is desirable and passes the tests. The data on land reclamation area were obtained from the China Land Resources Statistical Yearbook. |
| 3 | For time series and panel data, using the lagged item of the independent variable as an instrumental variable is a common method for selecting the instrumental variable. In a continuous economic process, the first-order lag term of the land transfer area is strongly related to the current value but is not related to the current error term because it has occurred. |
| 4 | According to the regional division method of the National Bureau of Statistics, the eastern region includes Beijing, Tianjin, Hebei, Liaoning, Shandong, Shanghai, Jiangsu, Zhejiang, Fujian, Guangdong, and Hainan, and the central and western regions include Heilongjiang, Jilin, Shanxi, Henan, Anhui, Jiangxi, Hubei, Hunan, Sichuan, Chongqing, Guangxi, Yunnan, Guizhou, Tibet, Inner Mongolia, Shanxi, Gansu, Qinghai, Ningxia, and Xinjiang. |
References
- Ho, C.; Ho, W.; Li, D. Consumption fluctuations and welfare: Evidence from China. World Dev. 2010, 38, 1315–1327. [Google Scholar] [CrossRef]
- Modigliani, F.; Cao, S.L. The Chinese saving puzzle and the life cycle hypothesis. J. Econ. Lit. 2004, 42, 145–170. [Google Scholar] [CrossRef]
- Chamon, M.; Prasad, E. Why are saving rates of urban households in China rising. Am. Econ. J. Macroecon. 2010, 2, 93–130. [Google Scholar] [CrossRef]
- Meng, X. Unemployment, consumption smoothing, and precautionary saving in urban China. J. Comp. Econ. 2003, 31, 465–485. [Google Scholar] [CrossRef]
- Bai, C.E.; Wu, B. Health insurance and consumption: Evidence from China’s New Cooperative Medical Scheme. J. Comp. Econ. 2014, 42, 450–469. [Google Scholar] [CrossRef]
- Aziz, J.; Cui, L. Explaining China’s Low Consumption: The Neglected Role of Household Income; IMF Working Paper No. 07-181; International Monetary Fund: Washington, DC, USA, 2007. [Google Scholar]
- Kuijs, L. Investment and Saving in China, Policy Research Working Paper No. 3633; World Bank: Washington, DC, USA, 2005. [Google Scholar]
- Chen, B.K. Income inequality and consumption demand: Theory and evidence from China. Nankai Econ. Stud. 2012, 28, 33–49. (In Chinese) [Google Scholar]
- Chen, B.; Lu, M.; Zhong, N. How urban segregation distorts Chinese migrants’ consumption? World Dev. 2015, 70, 133–146. [Google Scholar] [CrossRef]
- Chen, B.K.; Chen, L.; Tan, A.B. Understanding China’s insufficient consumption: A literature review. J. World Econ. 2014, 37, 3–22. (In Chinese) [Google Scholar]
- Liu, Y.S.; Li, J.T.; Yang, Y.Y. Strategic adjustment of land use policy under the economic transformation. Land Use Policy 2018, 74, 5–14. [Google Scholar] [CrossRef]
- Huang, J.; Shen, G.Q.; Zheng, H.W. Is insufficient land supply the root cause of housing shortage? Empirical evidence from Hong Kong. Habitat Int. 2015, 49, 538–546. [Google Scholar] [CrossRef]
- Lin, G.C.S.; Zhang, A.Y. Emerging spaces of neoliberal urbanism in China: Land commodification, municipal finance and local economic growth in prefecture-level cities. Urban Stud. 2015, 52, 2774–2798. [Google Scholar] [CrossRef]
- Wang, D.; Ren, C.; Zhou, T. Understanding the impact of land finance on industrial structure change in China: Insights from a spatial econometric analysis. Land Use Policy 2021, 103, 105323. [Google Scholar] [CrossRef]
- Zhou, Y.; Guo, Y.; Liu, Y.; Wu, W.; Li, Y. Targeted poverty alleviation and land policy innovation: Some practice and policy implications from China. Land Use Policy 2018, 74, 53–65. [Google Scholar] [CrossRef]
- Dai, Y.; Cheng, J.; Zhu, D. Understanding the impact of land supply structure on low consumption: Empirical evidence from China. Land 2022, 11, 516. [Google Scholar] [CrossRef]
- Tian, L.; Ma, W. Government intervention in city development of China: A tool of land supply. Land Use Policy 2009, 26, 599–609. [Google Scholar] [CrossRef]
- Fu, Y.; Zhang, Y. Chinese style decentralization and fiscal expenditure structure bias: The cost of competition for growth. Manag. World 2007, 23, 4–12. (In Chinese) [Google Scholar]
- Liu, S.Y. The structure and changes of China’s land system. China Agric. Econ. Rev. 2019, 11, 471–488. [Google Scholar]
- Keynes, J.M. The General Theory of Employment, Interest and Money; Macmillan: London, UK, 1936. [Google Scholar]
- Fichtenbaum, R. Consumption and the distribution of income. Rev. Soc. Econ. 1985, 43, 234–244. [Google Scholar] [CrossRef]
- Judd, C.M.; Kenny, D.A. Process analysis: Estimating mediation in treatment evaluations. Eval. Rev. 1981, 5, 602–619. [Google Scholar] [CrossRef]
- Baron, R.M.; Kenny, D.A. The moderator-mediator variable distinction in social psychological research: Conceptual, strategic, and statistical considerations. J. Personal. Soc. Psychol. 1986, 51, 1173–1182. [Google Scholar] [CrossRef] [PubMed]
- Loayza, N.; Schmidt-Hebbel, K.; Servén, L. What drives private saving across the world. Rev. Econ. Stat. 2000, 82, 165–181. [Google Scholar] [CrossRef]
- Chen, A. Urbanization and disparities in China: Challenges of growth and development. China Econ. Rev. 2002, 13, 407–411. [Google Scholar] [CrossRef]
- Miu, X.L.; Wang, T.; Gao, Y.G. The effect of fiscal transfer on the gap between urban-rural public services based on a grouping comparison of different economic catching-up provinces. Econ. Res. J. 2017, 52, 52–66. (In Chinese) [Google Scholar]
- Wen, L.; Paudel, K.; Chen, Y.; He, Q. Urban segregation and consumption inequality: Does hukou conversion matter in China? Rev. Dev. Econ. 2021, 25, 2298–2322. [Google Scholar] [CrossRef]
- Lin, G.C.S. China’s landed urbanization: Neoliberalizing politics, land commodification, and municipal finance in the growth of metropolises. Environ. Plan. A 2014, 46, 1814–1835. [Google Scholar] [CrossRef]
- Chen, B.K.; Yang, R.D. Land supply, housing price and household saving in urban China: Evidence from urban household survey. Econ. Res. J. 2013, 48, 110–122. (In Chinese) [Google Scholar]
- Siamwalla, A. The Thai rural credit system: Public subsidies, private information, and segmented markets. World Bank Econ. Rev. 1990, 4, 271–295. [Google Scholar] [CrossRef]
- Feder, G.; Feeny, D. Land tenure and property rights: Theory and implication for development policy. World Bank Econ. Rev. 1991, 5, 135–153. [Google Scholar] [CrossRef]
- Pender, J.; Kerr, J. The effects of land sales restrictions: Evidence from South India. Agric. Econ. 1999, 21, 279–294. [Google Scholar] [CrossRef]
- Carter, M.; Olinto, P. Getting institutions right for whom: Credit constraints and the impact of property rights on the quantity and composition of investment. Am. J. Agric. Econ. 2003, 63, 265–302. [Google Scholar] [CrossRef]
- Kemper, N.; Ha, L.V.; Klump, R. Property rights and consumption volatility: Evidence from a land reform in Vietnam. World Dev. 2015, 71, 107–130. [Google Scholar] [CrossRef]
- Boucher, S.; Barham, B.; Carter, M. The impact of market-friendly reforms on credit and land markets in Honduras and Nicaragua. World Dev. 2005, 33, 107–128. [Google Scholar] [CrossRef]
- Torero, M.; Field, E. Impact of Land Titles over Rural Households; OVE Working Papers, 0705; Inter-American Development Bank: Washington, DC, USA, 2005. [Google Scholar]
- Sikor, T.; Müller, D. The limits of state-led land reform: An introduction. World Dev. 2009, 37, 1307–1316. [Google Scholar] [CrossRef]

| Variable | Definition | Measure | Data Sources | Obs | Mean | Std. Dev. | Min | Max |
|---|---|---|---|---|---|---|---|---|
| final_consum | Final consumption rate | Provincial final consumption expenditure/GDP | China Statistical Yearbook (2001–2018) | 558 | 0.528 | 0.091 | 0.341 | 0.911 |
| land_1 | Land monopoly | Land transfer area (10,000 ha) | China Land Resources Statistical Yearbook (2001–2018) | 558 | 0.706 | 0.682 | 0.003 | 4.239 |
| land_2 | Land monopoly | Land expropriation area (10,000 ha) | China Land Resources Statistical Yearbook (2001–2018) | 558 | 1.135 | 0.887 | 0.000 | 4.507 |
| public_share | Share of public revenues in GDP | Fiscal revenue/GDP | China Finance Yearbook (2001–2018)China Statistical Yearbook (2001–2018) | 558 | 0.182 | 0.046 | 0.032 | 0.327 |
| urban_rural | Urban–rural income ratio | Urban per capita disposable income/rural per capita disposable income | China Statistical Yearbook (2001–2018) | 558 | 2.930 | 0.623 | 1.845 | 5.611 |
| per_gdp | Per capita GDP | GDP/Total population (CNY 10,000) | China Statistical Yearbook (2001–2018) | 558 | 2.274 | 1.842 | 0.266 | 12.272 |
| urban | Urbanization rate | Urban resident population/total population | China Statistical Yearbook (2001–2018) | 558 | 0.484 | 0.155 | 0.139 | 0.896 |
| live_ratio | Share of fiscal expenditures for people’s livelihoods | People’s livelihood public expenditure (including healthcare, education, and social security)/Total financial expenditure | China Statistical Yearbook (2001–2018) | 558 | 0.390 | 0.045 | 0.225 | 0.510 |
| depen_ratio | Population dependency ratio | The population of children and the elderly /total population | China Population Statistical Yearbook (2001–2018) | 558 | 0.378 | 0.070 | 0.193 | 0.576 |
| sta_emp | Employment share of state-owned enterprises | State-owned enterprise employees/total urban employees | China Urban Statistical Yearbook (2001–2018) | 558 | 0.351 | 0.150 | 0.065 | 0.727 |
| export_ratio | Export dependence | Total exports/GDP | China Statistical Yearbook (2001–2018) | 558 | 0.157 | 0.182 | 0.011 | 0.905 |
| Final Consumption Rate | (1) | (2) | (3) |
|---|---|---|---|
| Pooled OLS | Random Effect | Fixed Effect | |
| Land transfer area | −0.048 *** (0.005) | −0.032 *** (0.006) | −0.028 *** (0.006) |
| Per capita GDP | −0.026 *** (0.008) | −0.023 *** (0.007) | −0.024 *** (0.007) |
| Squared items of per capita GDP | 0.003 *** (0.001) | 0.002 *** (0.001) | 0.002 *** (0.001) |
| Urbanization rate | 0.033 (0.037) | 0.081 ** (0.035) | 0.097 *** (0.037) |
| Share of fiscal expenditures for people’s livelihoods | −0.138 * (0.074) | 0.333 *** (0.075) | 0.422 *** (0.079) |
| Population dependency ratio | 0.451 *** (0.063) | 0.371 *** (0.067) | 0.349 *** (0.071) |
| Employment share of SOEs | −0.009 (0.038) | 0.062 * (0.037) | 0.072 * (0.039) |
| Export dependence | −0.024 (0.021) | −0.022 (0.032) | −0.046 (0.042) |
| Constant | 0.472 *** (0.053) | 0.256 *** (0.049) | 0.286 *** (0.055) |
| F-statistic/Wald-statistic | 53.50 | 290.29 | 36.43 |
| R2 | 0.430 | 0.378 | 0.707 |
| Observations | 558 | 558 | 558 |
| Final Consumption Rate | (1) | (2) | (3) | (4) | (5) |
|---|---|---|---|---|---|
| Exclude Municipalities | Core Independent Variable Lags One Period | Replace Core Independent Variable | Instrumental Variable Method | Control Variables Lags One Period | |
| Land transfer area | −0.024 *** (0.007) | −0.026 *** (0.006) | −0.021 *** (0.004) | −0.043 *** (0.012) | −0.037 *** (0.007) |
| Per capita GDP | −0.065 *** (0.015) | −0.020 *** (0.007) | −0.027 *** (0.007) | −0.012 (0.009) | −0.013 * (0.008) |
| Squared items of per capita GDP | 0.008 *** (0.002) | 0.002 *** (0.001) | 0.002 *** (0.001) | 0.001 (0.001) | 0.002 ** (0.001) |
| Urbanization rate | 0.169 *** (0.053) | 0.107 *** (0.038) | 0.117 *** (0.036) | 0.084 *** (0.052) | 0.106 *** (0.038) |
| Share of fiscal expenditures for people’s livelihoods | 0.338 *** (0.091) | 0.522 *** (0.080) | 0.446 *** (0.077) | 0.407 *** (0.094) | 0.248 *** (0.082) |
| Population dependency ratio | 0.335 *** (0.078) | 0.408 *** (0.071) | 0.322 *** (0.071) | 0.387 *** (0.083) | 0.284 *** (0.078) |
| Employment share of SOEs | 0.007 (0.051) | 0.081 ** (0.041) | 0.079 ** (0.038) | 0.047 (0.064) | 0.101 ** (0.043) |
| Export dependence | 0.005 (0.058) | −0.058 (0.044) | −0.103 ** (0.042) | −0.129 ** (0.053) | −0.048 (0.043) |
| Constant | 0.257 *** (0.065) | 0.238 *** (0.058) | 0.335 *** (0.055) | —— | 0.313 *** (0.059) |
| F-statistic/Wald-statistic | 35.51 | 37.15 | 37.59 | 16.97 | 33.25 |
| R2 | 0.708 | 0.723 | 0.714 | —— | 0.700 |
| Observations | 486 | 527 | 558 | 341 | 527 |
| Final Consumption Rate | (1) | (2) | (3) | (4) | (5) | (6) |
|---|---|---|---|---|---|---|
| Eastern Region | Central and Western Regions | Low Catch-Up | High Catch-Up | Weak Intervention | Strong Intervention | |
| Land transfer area | −0.022 *** (0.005) | −0.048 *** (0.013) | −0.018 *** (0.006) | −0.070 *** (0.016) | −0.017 *** (0.005) | −0.107 *** (0.012) |
| Per capita GDP | −0.036 *** (0.007) | −0.107 *** (0.025) | −0.011 (0.007) | −0.192 *** (0.035) | −0.084 *** (0.011) | 0.037 *** (0.013) |
| Squared items of per capita GDP | 0.002 *** (0.000) | 0.018 *** (0.004) | 0.001 *** (0.000) | 0.038 *** (0.008) | 0.008 *** (0.001) | −0.002 * (0.001) |
| Urbanization rate | 0.023 (0.036) | 0.196 *** (0.061) | 0.033 (0.041) | 0.169 *** (0.061) | 0.132 *** (0.031) | −0.314 *** (0.083) |
| Share of fiscal expenditures for people’s livelihoods | 0.519 *** (0.092) | 0.351 *** (0.109) | 0.339 *** (0.087) | 0.321 ** (0.141) | 0.040 (0.091) | 0.094 (0.103) |
| Population dependency ratio | 0.361 *** (0.078) | 0.171 (0.109) | 0.392 *** (0.081) | 0.040 (0.118) | 0.223 *** (0.071) | 0.458 *** (0.093) |
| Employment share of SOEs | −0.181 *** (0.055) | −0.019 (0.061) | 0.049 (0.055) | −0.205 *** (0.074) | −0.070 (0.047) | 0.075 (0.051) |
| Export dependence | −0.005 (0.037) | −0.110 (0.091) | 0.008 (0.040) | −0.185 * (0.107) | 0.040 * (0.024) | 0.093 * (0.053) |
| Constant | 0.395 *** (0.059) | 0.587 *** (0.077) | 0.222 *** (0.061) | 0.645 *** (0.096) | 0.491 *** (0.067) | 0.444 *** (0.073) |
| F-statistic | 27.36 | 28.03 | 15.99 | 20.99 | 41.24 | 34.49 |
| R2 | 0.707 | 0.670 | 0.661 | 0.400 | 0.537 | 0.491 |
| Observations | 198 | 360 | 279 | 279 | 279 | 279 |
| (1) | (2) | (3) | (4) | |
|---|---|---|---|---|
| First stage | Dependent variable: sthe share of public revenues in the GDP | Dependent variable: urban/rural income ratio | ||
| Land transfer area | 0.031 *** (0.003) | 0.238 *** (0.035) | ||
| Land expropriation area | 0.009 *** (0.002) | 0.069 *** (0.022) | ||
| F-statistic | 44.69 | 36.95 | 62.64 | 57.84 |
| R2 | 0.749 | 0.710 | 0.808 | 0.795 |
| Second stage | Dependent variable: final consumption rate | Dependent variable: final consumption rate | ||
| Share of public revenues in GDP | −0.420 *** (0.092) | −0.422 *** (0.084) | ||
| Urban/rural income ratio | −0.028 *** (0.008) | −0.030 *** (0.007) | ||
| Land transfer area | −0.015 ** (0.007) | −0.021 *** (0.007) | ||
| Land expropriation area | −0.017 *** (0.004) | −0.019 *** (0.004) | ||
| Per capita GDP | −0.022 *** (0.007) | −0.024 *** (0.007) | −0.030 *** (0.007) | −0.032 *** (0.007) |
| Squared items of per capita GDP | 0.002 *** (0.001) | 0.002 *** (0.001) | 0.003 *** (0.001) | 0.002 *** (0.001) |
| Urbanization rate | 0.075 ** (0.036) | 0.093 *** (0.036) | 0.109 *** (0.036) | 0.128 *** (0.036) |
| Share of fiscal expenditures for people’s livelihoods | 0.404 *** (0.077) | 0.410 *** (0.076) | 0.459 *** (0.078) | 0.475 *** (0.076) |
| Population dependency ratio | 0.295 *** (0.071) | 0.265 *** (0.070) | 0.338 *** (0.070) | 0.307 *** (0.070) |
| Employment share of SOEs | 0.032 (0.039) | 0.031 (0.039) | 0.100 ** (0.039) | 0.104 *** (0.038) |
| Export dependence | −0.044 (0.041) | −0.085 ** (0.041) | −0.055 (0.042) | −0.105 ** (0.042) |
| Constant | 0.419 *** (0.061) | 0.463 *** (0.060) | 0.345 *** (0.057) | 0.396 *** (0.057) |
| F-statistic | 37.38 | 40.24 | 36.60 | 38.07 |
| R2 | 0.718 | 0.733 | 0.714 | 0.722 |
| Sobel tests p | 0.000 *** | 0.000 *** | 0.002 *** | 0.014 ** |
| Mediating effect | 46% | 19% | 25% | 10% |
| Observations | 558 | 558 | 558 | 558 |
Disclaimer/Publisher’s Note: The statements, opinions and data contained in all publications are solely those of the individual author(s) and contributor(s) and not of MDPI and/or the editor(s). MDPI and/or the editor(s) disclaim responsibility for any injury to people or property resulting from any ideas, methods, instructions or products referred to in the content. |
© 2023 by the authors. Licensee MDPI, Basel, Switzerland. This article is an open access article distributed under the terms and conditions of the Creative Commons Attribution (CC BY) license (https://creativecommons.org/licenses/by/4.0/).
Share and Cite
Cheng, J.; Zhao, J. How Does Land Monopoly Reduce Consumption Levels? Evidence from China. Land 2023, 12, 1688. https://doi.org/10.3390/land12091688
Cheng J, Zhao J. How Does Land Monopoly Reduce Consumption Levels? Evidence from China. Land. 2023; 12(9):1688. https://doi.org/10.3390/land12091688
Chicago/Turabian StyleCheng, Jian, and Jiangmeng Zhao. 2023. "How Does Land Monopoly Reduce Consumption Levels? Evidence from China" Land 12, no. 9: 1688. https://doi.org/10.3390/land12091688
APA StyleCheng, J., & Zhao, J. (2023). How Does Land Monopoly Reduce Consumption Levels? Evidence from China. Land, 12(9), 1688. https://doi.org/10.3390/land12091688