Article

Spatiotemporal Linkages between Administrative Division Adjustment and Urban Form: Political Drivers of the Urban Polycentric Structure

1
School of Economics and Management, Wuhan University, Wuhan 430072, China
2
Institute of Central China Development, Wuhan University, Wuhan 430072, China
3
Department of Building and Real Estate, Research Institute of Sustainable Urban Development, The Hong Kong Polytechnic University, Hong Kong 999077, China
4
School of Resource and Environmental Science, Wuhan University, Wuhan 430079, China
*
Authors to whom correspondence should be addressed.
Land 2023, 12(9), 1674; https://doi.org/10.3390/land12091674
Submission received: 24 July 2023 / Revised: 18 August 2023 / Accepted: 22 August 2023 / Published: 27 August 2023
(This article belongs to the Section Land Socio-Economic and Political Issues)

Abstract

:
As a crucial government strategy for spatial management and resource allocation, administrative division adjustment (ADA) provides interesting insights in the investigation of the polycentric urban structure (POLY). Using high-resolution geographic grid population data, this study aims to interpret complex linkages between ADA and POLY. Specifically, this research explores the dynamic evolution of POLY and ADA, investigates the spatiotemporal impact of ADA on POLY based on geographically and temporally weighted regression models and analyzes the differences in socioeconomic driving forces for POLY in cities with and without ADA. The results demonstrate that the value of POLY had a rising trend during the study periods. In terms of spatial pattern, POLY has a higher value in the Eastern region and a lower value in the Western region. The influences of ADA on POLY are also characterized by spatiotemporal heterogeneity. The impact of ADA on POLY has a higher value in Eastern and Western China and a lower value in Central and Northeastern China. In addition, the impacts of socioeconomic factors on POLY between cities with and without ADA differed significantly in Central and Western China while differing insignificantly in Eastern and Northeastern China. To promote the balanced development of administrative institutional structures and urban spatial transformation, ADA should be selectively implemented to facilitate POLY following the level of population, economic and productive development in each region.

1. Introduction

Currently, the urbanization level in China has risen from 18% in 1978 to 63% in 2020 [1,2]. Although urbanization has created remarkable economic achievements, it also results in serious urban diseases. Problems such as housing shortages [3], traffic congestion [4], air pollution [5] and resource constraints [6] may occur due to the dramatic urban growth and negative externalities of agglomeration. To alleviate the issue of overcrowded cities and promote human-centric approaches to new-type urbanization strategies, the focus of urban growth is gradually changing from extensive expansion to structure optimization [7]. The document “National New Urbanization Plan (2014–2020)” proposed that it is essential to optimize the urban spatial structure and prevent blind expansion, balancing the distribution and allocation of various factors and functions [8]. The rational layout of urban structure optimization can improve land-use efficiency and change land values through intensification and suburbanization, thereby influencing land markets and urban housing [9]. In addition, an efficient urban structure affects commuting patterns and helps to achieve orderly spatial traffic flows across regions, which in turn better serves transit systems and alleviates congestion [10]. Under the new-type urbanization, decentralization and polycentricity by minimizing negative external effects and maximizing positive agglomerative economies have become crucial means to drive the transformation from extensive expansion to structure optimization [11].
The urban polycentric structure (POLY) has been adopted by a growing number of government agencies as an ideal urban form to support urban spatial transformation, release urban vitality and promote sustainable development [12]. In China, the policy of Outline of Vision Goals for 2035 proposed that it is necessary to transfer the urban spatial form from a monocentric structure to a more polycentric and networked structure [13]. Compared with urban monocentric structures, the POLY is regarded as an efficient urban form to promote a balance between employment and housing [14] and improve labor productivity [15]. Therefore, the question of how to promote the development of the POLY is a critical issue for sustainable urban growth.
Since the reform and opening-up policy, China has undergone an urbanization process in the past 40 years that other countries typically experience over a century [16]. To efficiently carry out resource allocation and management, administrative hierarchy systems, including national, provincial, municipal, county and township levels, are implemented in China [17]. However, along with the process of rapid urbanization, there have been significant changes in urban form and administrative institutional structures. Meantime, the existing administrative institutional structures may be inadequate to meet the resource-carrying capacity and factor allocation requirements of current urban spatial structures. The Chinese government has carried out a series of administrative division adjustments (ADAs), which have changed the urban administrative hierarchy and spatial scale and alleviated the mismatch between the administrative institutional structure and socioeconomic development [18]. Specifically, ADA reshapes the urban growth boundary by increasing the authority for land approvals and providing material security for the expansion of population and industry [19]. In addition, ADA promotes suburbanization and has a sizeable circulating effect on economic agglomeration, facilitating urban polycentric development and edge-expansion [20].
From 2009 and 2019, most cities have undergone ADA. Specifically, the number of counties declined from 1464 to 1323 and the number of urban districts increased from 855 to 973 [21]. ADA is a crucial government strategy for China’s spatial management and has a profound influence on POLY. Yet, fewer studies have focused on the impact of state-led administrative forces on POLY. This is mainly due to the complex relationship between policies and urban form, leading to difficulties in quantifying the impact and efficiency of administrative factors [20]. Furthermore, the previous literature paid more attention to the experiences of North America and Western Europe regarding administrative units as networks of horizontally interconnected autonomous entities while ignoring the hierarchical and level-based administrative division system in China [22]. Most scholars in western countries focus on the voluntary and anarchical self-organization processes of the formation of POLY, agreeing that the decentralization of population and employment facilitated new subcenters [23]. Although urban polycentricity in China is an important urban development policy, the impact of political interventions on POLY has not been fully investigated [24]. Hence, it is urgent to identify the complex linkages between ADA and POLY to respond to the evolving needs of urban growth and manage the coordinated development of urban form and administrative institutional structures.
As the highest level of political design for China’s territorial space, ADA has affected the urban spatial structure evolution through spatial rescaling, spatial fragmentation, hybrid urbanization and suburbanization [25]. The administrative hierarchy and administrative boundaries can be reshaped with the implementation of ADA, facilitating the free flow of social, economic and environmental elements between different administrative district governments and promoting the spatial reconstruction of the multinuclei city and POLY [26]. Yet, most studies associated with ADA have focused on issues including urban expansion [27], land-use intensity [28], regional reconstruction [29] and spatial rescaling [18]. The impact of ADA on urban structure is rarely addressed. In addition, most scholars concentrate on qualitative case studies and theoretical discussions at the micro level of cities while neglecting the quantitative analysis of the effects of ADA on POLY at the national macro level [30]. Hence, it is urgent to quantify the relationship between ADA and POLY at the national scale to gain a deeper understanding of urban structure transformation under administrative reconfiguration.
Existing research is mostly based on cross-sectional data and focuses on the impact of ADA during a particular period. A few scholars applied panel data to their analyses, ignoring the issue of spatiotemporal heterogeneity of the urban structure transformation in the process of ADA implementation [31]. However, the dynamic of ADA is a spatiotemporally nonstationarity process, and the effects of ADA on POLY are also inconsistent across time and space. According to Tobler’s first law of geography, any object is spatially interconnected, suggesting that localized changes have profound effects on neighboring regions [32]. To minimize bias in model assessment results, it is important to consider spatial dependence when examining the mechanisms of the impacts of ADA on POLY [33]. Meanwhile, in the process of implementing ADA, the administrative management policy will accelerate the exchange in factors such as population, capital, industry and land among different regions. For example, if a city achieves hierarchical upgrading through ADA, it will attract resources from neighboring cities, thus realizing inter-regional material exchange and information transfer [34]. Moreover, the impact of ADA on POLY is different at different stages of ADA implementation, indicating that the relationship between ADA and POLY changes over time [35]. Consequently, both time and space factors are crucial. Yet, most scholars only consider global regression, such as the ordinary least squares (OLS) regression, neglecting spatiotemporal nonstationary correlation. The geographically and temporally weighted regression model (GTWR) can effectively reflect both temporal and spatial relationships between each location by calculating local regression equations, improving the reliability of model results. Therefore, the GTWR model can be adopted to further examine the spatiotemporal linkages between ADA and POLY.
To further understand state-led polycentric urban development, this study examines the spatiotemporal impact of ADA on POLY based on the GTWR model. Overall, the main contributions of this paper are as follows. Theoretically, this study considers both political and socioeconomic driver factors of POLY, which further deepens the analysis of the mechanisms influencing the development of urban spatial structure. Methodologically, this study examines the spatiotemporal impact of ADA on POLY and fully assesses the spatiotemporal heterogeneity and nonstationarity of the relationship between ADA and POLY. Practically, policy implications associated with urban planning and administrative adjustment are proposed, which provides valuable references for balancing the management of urban spatial structure and administrative system adjustment. The remaining content of this study is organized as follows. Section 2 describes the literature review. Section 3 measures the methodology and data. Section 4 presents the results. Section 5 proposes the discussions. Section 6 summarizes the main conclusions.

2. Literature Review

2.1. ADA and Its Development in China

Different from European countries, urban development policies based on administrative hierarchies have resulted in the urban spatial structure of China being heavily influenced by the administrative system [36]. Apart from market self-organization mechanisms, state-led planning and policy interventions are also essential factors that influence urban spatial structure [37]. Under the high regulation of the administrative hierarchy system and urban planning strategies, the interactive cooperation between political and socioeconomic factors promotes urban growth [27]. As a special political factor within the changes in state-led administrative system management, ADAs can facilitate resource mobilization and are a significant force in optimizing urban spatial transformation [18]. In the process of administrative adjustment, changes in the administrative hierarchy and administrative space can lead to policy reforms such as land function zoning, urban housing guidance and corporate tax subsidies [38]. In addition, ADA will not only promote the networking of public infrastructure, diversification of population movement patterns and decentralization of commercial activities but also further promote the expansion and reconstruction of urban space, resulting in the polycentric development of urban forms and functions [39]. Thus, considering ADA as the main political factor, along with socioeconomic factors, can help us comprehensively understand urban structural changes. It is critical to embed the insights of ADA into the investigation of POLY evolution.

2.2. The Driving Forces of POLY

Polycentric urban development is the consequence of numerous elements as a complex evolutionary process. Most studies have examined the driving forces of polycentric urban development from the perspective of natural and socioeconomic factors [40]. The focus on natural factors includes land cover [41], topographical features [42], elevation grades [43], landscape fragmentation [44] and the patterns of rivers/lakes [45]. The focus on socioeconomic factors includes urban functions and human activities such as transportation networks [46], population distribution [47], economic size [48] and employment figures [14]. Although these factors can impact urban polycentricity and have been comprehensively considered in most studies, equally important to urban polycentricity are the state factors such as government interventions and structural adjustment; however, these have rarely been taken into account [23]. Urban spatial transformation is often affected by top-down government policies and urban planning [36]. Thus, identifying the evolution of polycentric urban structure in terms of state-led factors remains a largely underexplored domain.

3. Methodology and Data

3.1. Methodological Framework
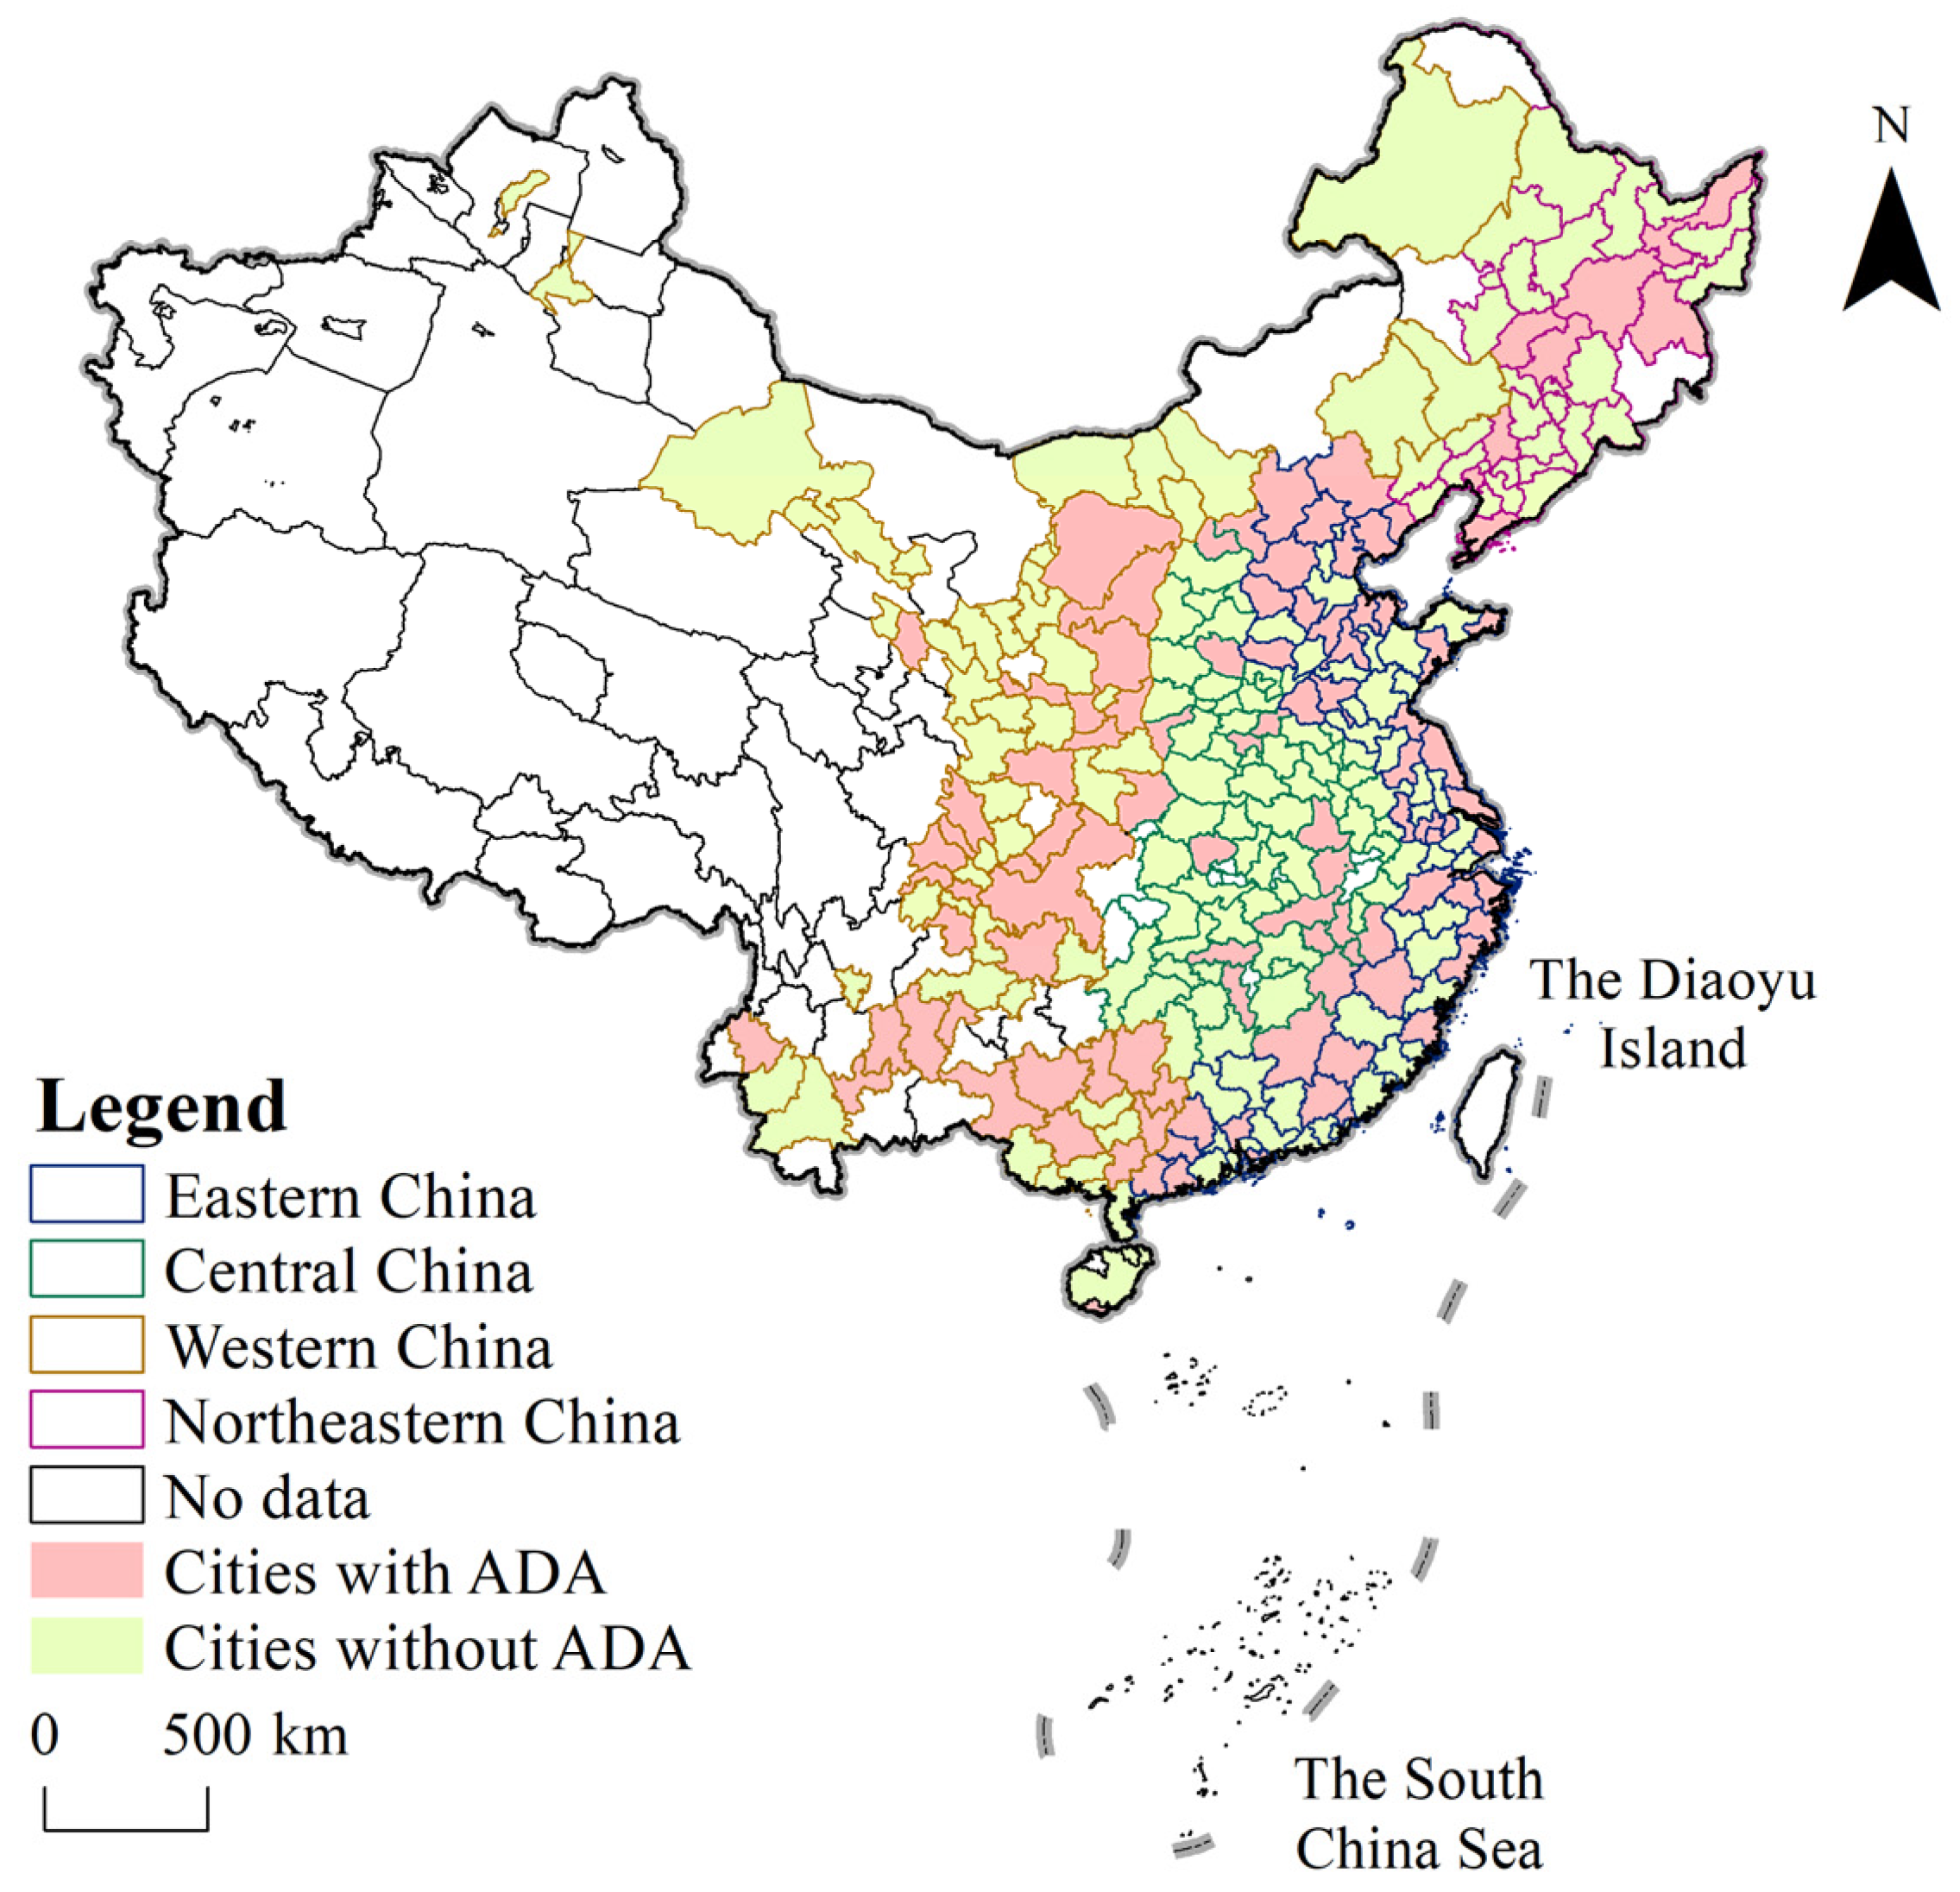
Based on the background above, the following methodological framework is established to further interpret the linkages between ADA and POLY (Figure 1). The GTWR model considers the temporal dimension of the variables by constructing a spatiotemporal weight matrix and calculates the spatiotemporal correlation of the panel data [49]. It can examine the spatiotemporal and nonstationary factors simultaneously, which is suitable for accurately interpreting the spatiotemporal linkages between ADA and POLY [50]. This methodological framework can provide insightful guidance for achieving sustainable urban spatial transformation under administrative division adjustment. Specifically, the methodological framework is implemented according to the following five steps: (1) The data used in this research are sourced from geospatial and socioeconomic data. As typical geospatial remote sensing data, the LandScan high-resolution population dataset records global population density; it is produced by the US Department of Energy, Oak Ridge National Laboratory [51]. Compared to traditional statistical data, it provides convenient insights to understand population distribution on a large spatial scale with relatively low cost, facilitating the more accurate determination of urban form [52]. (2) During preprocessing, the remote sensing data are resampled to 1 km and the ADA is recorded to the prefecture-level city. (3) The morphological POLY is identified by a relative minimum cut-off approach based on population size and standard deviation. (4) The temporal and spatial distribution patterns of the ADA and the POLY are discussed by Moran’s index and hot spots and cold spots. (5) The spatiotemporal impacts of ADA on POLY are examined by the OLS and GTWR models. In addition, this study divides the research samples into Eastern, Central, Western and Northeastern regions to explore the heterogeneity of the impact of ADA and compare the differences in socioeconomic driving forces for POLY in cities with and without ADA.

3.2. Study Area

Due to the change in statistical standards and anomalies of missing data, 268 prefecture-level administrative regions and 4 direct-administrate municipalities are taken as the subjects of this study. To better measure the implementation of ADA, this research defines cities that underwent ADA as cities with changes in administrative space or hierarchy, including the conversion of counties into urban areas, the conversion of counties into urban districts and district-to-district restructuring [27]. As shown in Figure 2, a total of 145 cities in China experienced ADA during the study period from 2013 to 2018. Owing to the vast territory of China, the local economics, natural resources, industry structure and demographics vary greatly among different regions, which further affects the dynamics of ADA and POLY. In addition, China has implemented various development policies in different regions, such as the policy of establishing the coastal economic zones in the Eastern region, promoting the rise of the Central region, facilitating the extensive development of the Western region and revitalizing the Northeastern region. Consequently, according to the geographical location and the zoning standards of the National Bureau of Statistics, this study divides China into Eastern, Central, Western and Northeastern regions to reflect the changes of ADA and POLY in different socioeconomic development regions [53,54]. The Eastern region carried out reform and opening up earlier, has a higher level of urbanization and marketization and has greater demand for the optimization of administration systems and spatial structures [55]. The economic development in the Central and Western regions lags relatively behind the Eastern region, and the government-dominated administrative forces of ADA are an essential driver for urban structure reshaping [27]. As the traditional industrial base, the Northeastern region is highly urbanized and faces the serious issues of resource exhaustion and population loss, hindering the development of ADA and POLY [56].

3.3. Data Sources

The multisource and heterogeneous data including geospatial data and socioeconomic data are utilized in this study as follows: (1) The data used to measure ADA are obtained from the national administrative division information inquiry platform (http://xzqh.mca.gov.cn/map, accessed on 1 February 2023). (2) The LandScan high-resolution global population dataset for identifying urban centers and measuring POLY is sourced from the official website (https://landscan.ornl.gov, accessed on 1 February 2023). (3) Other socioeconomic data are obtained from the China Statistical Yearbook, China City Statistics Yearbook and the China Regional Economic Statistical Yearbook (http://www.stats.gov.cn/sj/ndsj/, accessed on 1 February 2023).

3.4. Research Methods

3.4.1. Assessment of Urban Polycentricity

Although academia lacks a universally accepted definition, the measurement of POLY in numerous studies has predominantly focused on its morphological dimensions [48]. The size and distribution of individual centers play a crucial role in shaping the morphological POLY. This study utilizes a morphologically defined polycentric structure to assess the degree of POLY. The identification of individual centers within a city was based on population size, and the spatial distribution of the population was acquired from the LandScan dataset, which provides high-resolution global population data [57]. For each city, the relative minimum cut-off approach was employed to select densely populated LandScan grids based on their 95th percentile population density [44]. To increase precision, the centers were identified as the top 5% of the densest area within a city from the LandScan dataset [58]. Since a population center should be a contiguous area with a large population, the centers with small areas and low populations were filtered out to increase accuracy [59]. Grid clusters with a population of more than 100,000 and an area of more than 3 km2 were selected to be identified as urban centers [44]. The most populated center was considered the core center, while the other centers were considered subcenters. To better demonstrate the detected urban centers, this paper uses Shanghai as an example to show its core center and subcenters (Figure 3).
Based on the social network theory, we explore the index of POLY using the concept of nodality (the importance of urban centers) [60]. In this study, the more balanced the importance of population size in different urban centers, the more pronounced the polycentric system becomes (Figure 4). Specifically, the POLY was measured by calculating the standard deviation of centers [61], and the formula is represented as follows:
P O L Y = 1 σ o b s σ m a x
where POLY denotes the degree of urban polycentric structure within the city. The value of POLY is between 0 and 1. The higher the value of POLY, the more polycentric the region [60]. σ o b s represents the standard deviation of the population-based size of an individual center within the city. σ m a x denotes the standard deviation of population-based sizes ranging from zero to the maximum.

3.4.2. Moran’s I Index

There may be spatial autocorrelation of variables in different regions. To analyze the dependence of spatial data, the global Moran’s I index is used to measure the degree of spatial autocorrelation, which is calculated as follows [62].
I = i = 1 n j = 1 n w i j ( x i x ¯ ) ( x j x ¯ ) S 2 i = 1 n j = 1 n w i j
S 2 = j = 1 n w i j ( x i x ¯ ) 2 n
where I is the global Moran’s I index and S 2 is the sample variance. w i j denotes the spatial weights between i t h city and j t h city. n is the total number of study samples. x i and x j are the regression residuals of study samples in i t h city and j t h city. x ¯ is the mean value of x . The value of I ranges between [−1, 1]. If I is less than 0 and closer to −1, there is a negative correlation. If I is greater than 0 and closer to 1, there is a positive correlation. If I is equal to 0, there is an independent random distribution and weak spatial correlations. In addition, analysis of hot spots and cold spots is utilized to visualize spatial association patterns of POLY between cities, which can reveal spatial grouping patterns for high- or low-value clusters [63].

3.4.3. Ordinary Least Squares Model

The OLS model is a traditional statistical method that assumes the parameter estimates are constant throughout the space [64]. It ignores the location of the parameter observations and may lead to the loss of spatial heterogeneity information [65]. To further compare with the results in the GTWR model, the OLS model is adopted first to test the significance level. The formulation of the OLS model is defined as follows:
Y i = β 0 + k = 1 m β k X i k + ε i
where Y i denotes the value of the dependent variable of POLY in i t h city. X i k represents the total number of k t h dependent variables in i t h city. β k denotes the coefficients of k t h dependent variables in i t h city. β 0 is the intercept distance. ε i is the random error term.

3.4.4. Geographically and Temporally Weighted Regression Model

Due to variables that may be spatially correlated, a sophisticated regression approach is necessary to further investigate further spatiotemporal heterogeneity [66]. The GTWR model is an important approach for solving the problem of spatial autocorrelation and heterogeneity of variables. Unlike global OLS regression, the coefficients in the GTWR model vary with time and space [67]. GTWR is a local regression model, which uses data from neighboring points around the point to calculate the local regression coefficients [68]. It can measure spatial heterogeneity by the regression coefficients for different regions through the utilization of local regression models fitted at individual sample points. In addition, the GTWR model can consider temporal heterogeneity to accommodate time nonstationarity by constructing spatiotemporal weights [49]. The formulation of the GTWR model is defined as follows:
Y i = β 0 ( u i , v i , t i ) + k = 1 p β k u i , v i , t i X i k + ε i
where u i , v i , t i denote the spatiotemporal coordinates of sample i in the geographical location u i , v i at time t i . ε i is the error term. Furthermore, the Gaussian function is adopted to assess the spatiotemporal weight matrix, and the specific formula is set as follows [50]:
w i j = e x p ( ( d i j s ) 2 + μ λ ( d i j T ) 2 h S T 2 )
where w i j denotes the spatiotemporal weight matrix between i t h city and j t h city. h S T represents the bandwidth. d i j s and d i j T denote the space and time distance between i t h city and j t h city. μ and λ are the spatial and time scale parameters, respectively.

3.5. Variable Measurement

In this study, the index of POLY from 2013 to 2018 is adopted as the dependent variable, which denotes the spatial polycentric pattern of different cities. The dummy variable for whether ADA occurred is set as the key independent variable. If the i t h city underwent ADA in the year t , then the value of ADA is 1 when t t and is 0 otherwise.
In addition, the POLY is influenced not only by the ADA but also by other socioeconomic factors. Therefore, the following socioeconomic driving factors are selected as the control variables: (1) Regional gross domestic product (GDP) is calculated by gross regional product per capita in different cities, which denotes economic development. Social production and activities are significantly influenced by the regional economic development level, which could further change the spatial structure of the city [64]. (2) Transportation infrastructure (ROAD) is measured by the actual paved road area within the city. The level of transportation facilities can influence transportation costs and change the spatial structure of urban agglomeration or sprawl [69]. (3) Land resource (AREA) is assessed by the built-up area within a city. The land is an important material and spatial carrier for urban spatial layout [9]. (4) Level of real estate development (HOUSE) is observed by the amount of completed real estate development investment. In the process of urban agglomeration development and decentralized expansion, the land-use intensity is closely related to the level of real estate investment [70]. (5) The governmental fiscal expenditure (FINANCE) is calculated by the amount of public finance expenditure. Governmental financial support directly affects the allocation of social resources in the process of regional development and plays a critical role in spatial structure transformation [63]. Specifically, the specific statistical descriptions of the variables in this study are shown in Table 1.

4. Results

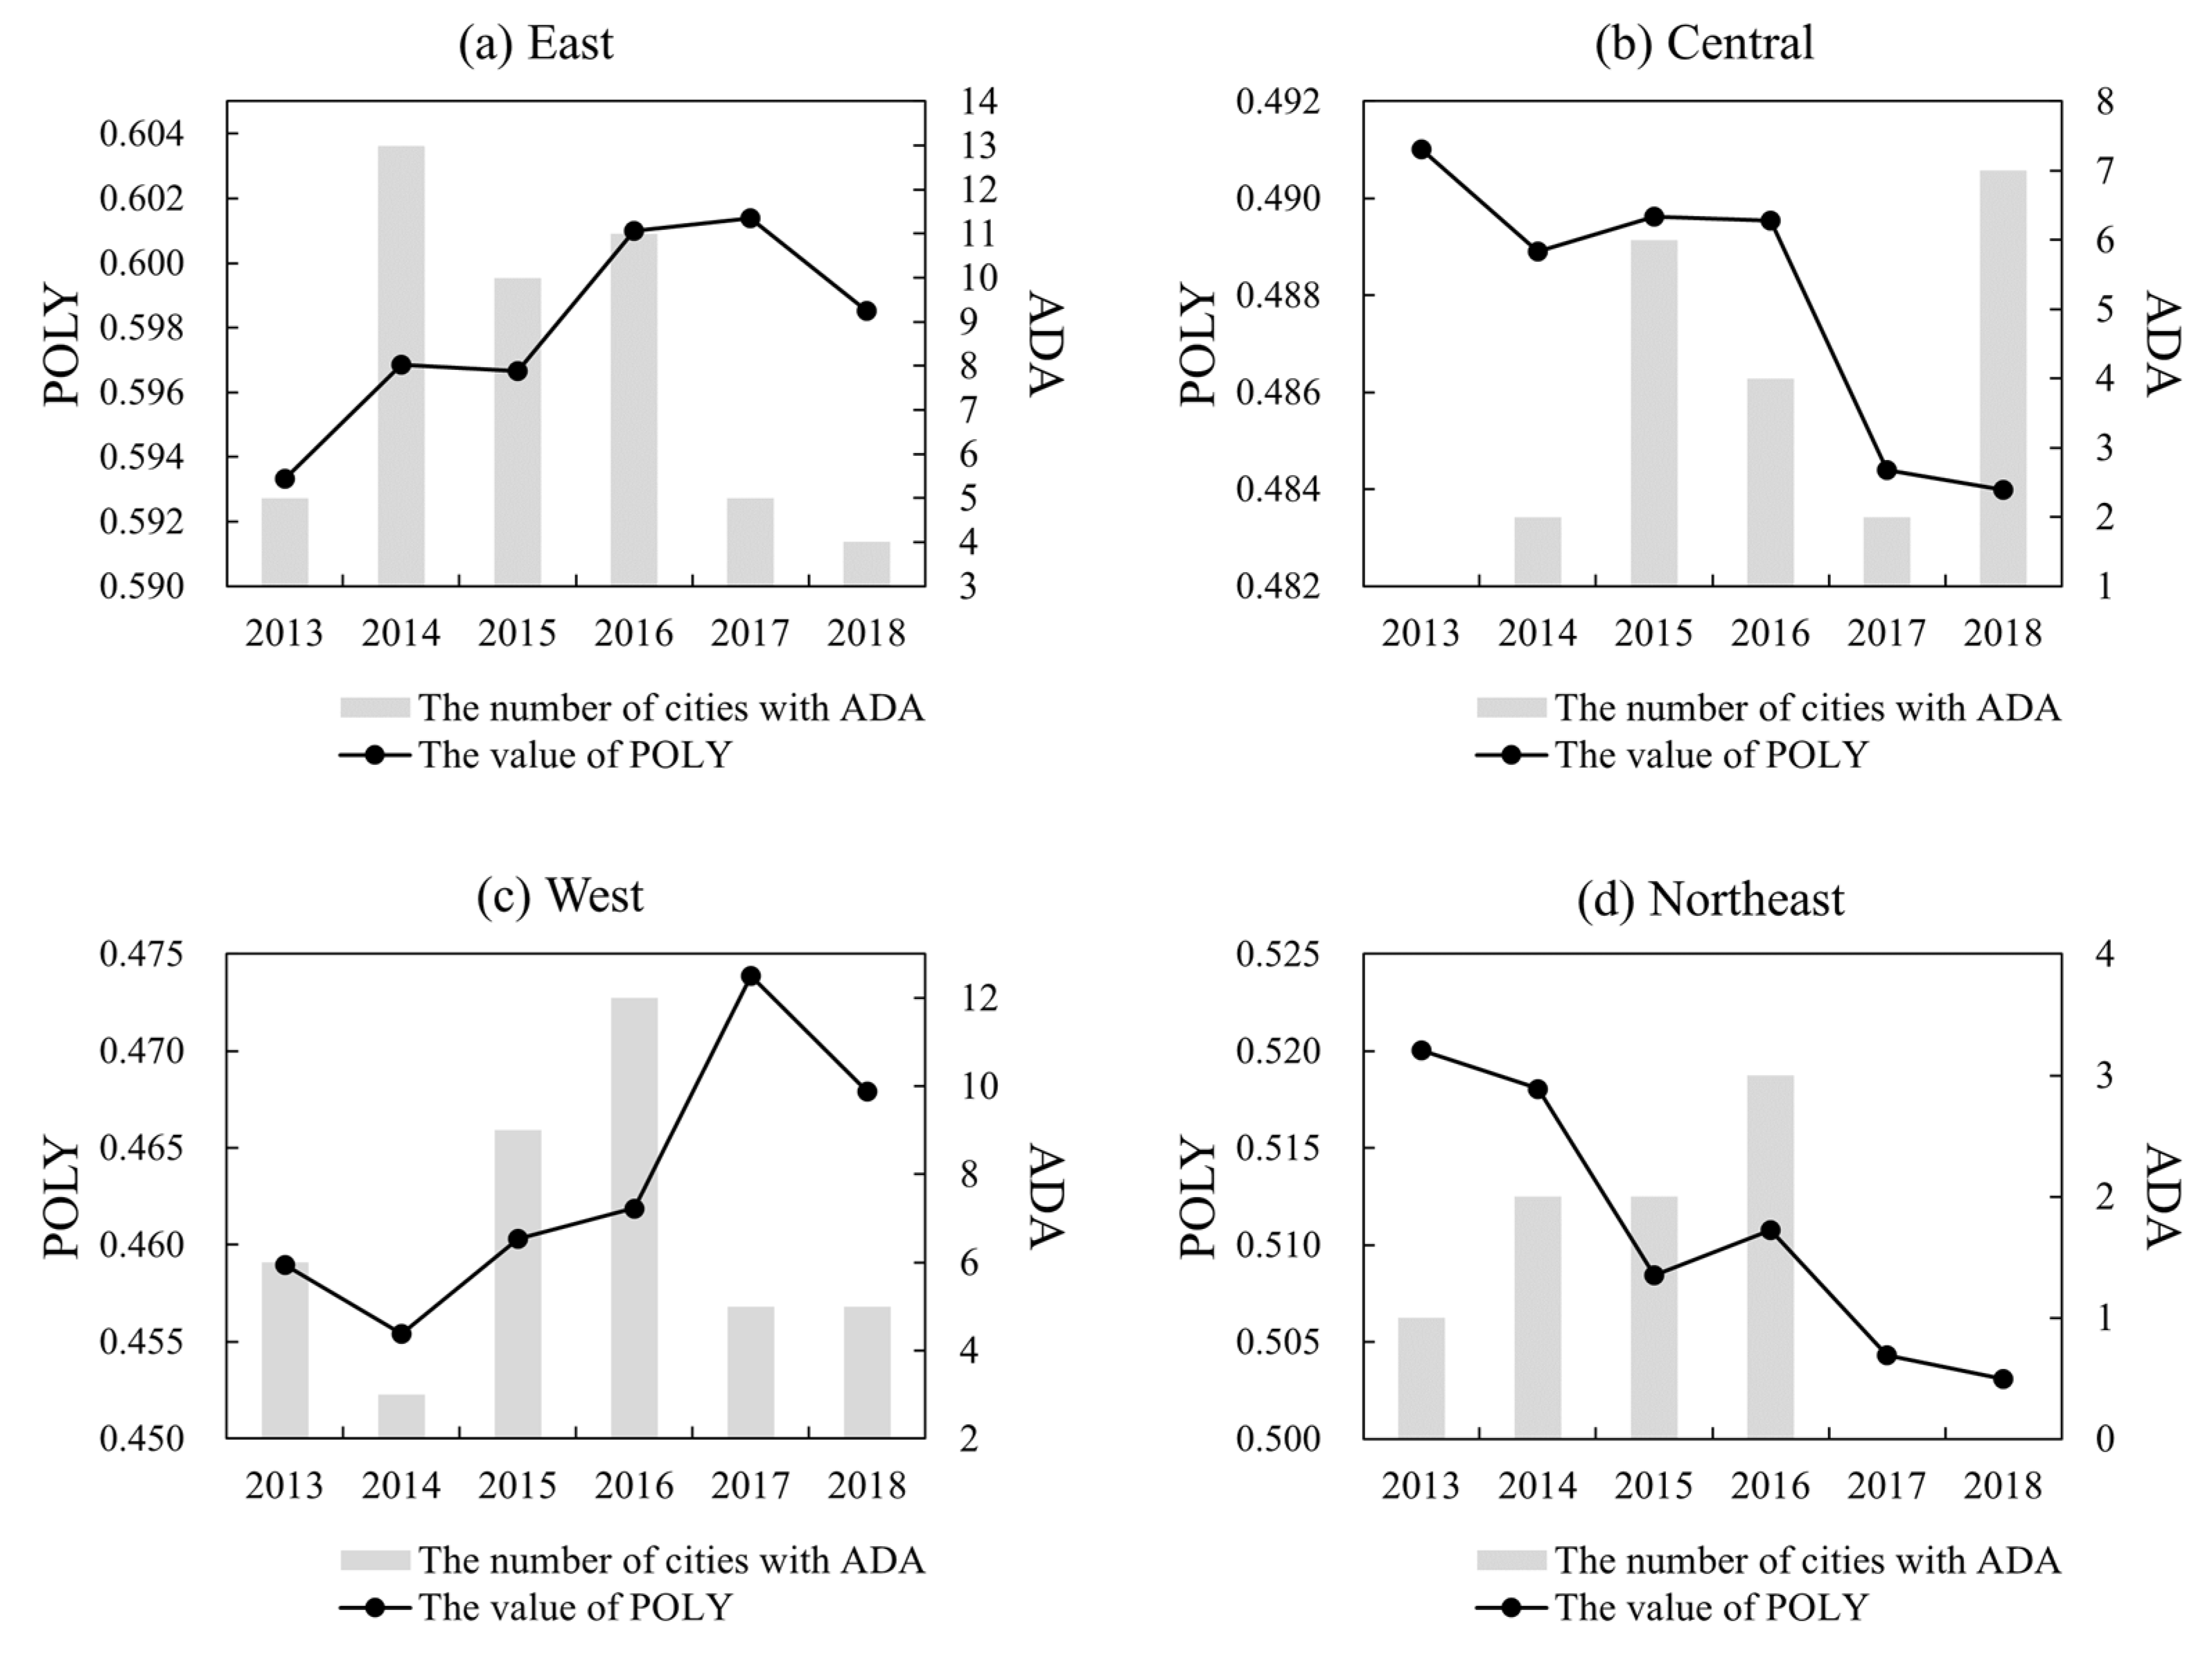
4.1. Characteristics of ADA and POLY

In general, the average POLY of all cities in China exhibits a rising trend (Figure 5). The average value of POLY was 0.497 in 2013 and 0.504 in 2018, with an increase of 2.35%. Such a change illustrates the evolution of urban spatial patterns from agglomerative monocentric to decentralized polycentric during the study period. Overall, cities that underwent ADA exhibit significantly higher levels of POLY compared to cities that did not. Specifically, the values of POLY in cities with ADA are all higher than 0.51, and those in cities without ADA are all lower than 0.51. Furthermore, such gaps in POLY between cities with and without ADA have increased over time. In 2013, the POLY was 0.494 in cities without ADA and 0.522 in cities with ADA. In 2018, the POLY in cities without ADA was 0.503, whereas in cities with ADA, it was 0.551. The gaps have increased from 0.028 in 2013 to 0.048 in 2018.
There are significant differences in the dynamic of POLY and the number of ADAs in China (Figure 6). Higher POLY values indicate the polycentric development and more relatively balanced population clusters within the city. According to the values of the POLY dynamic, this study categorized the evolution patterns of POLY in different regions. The POLY shows a high value with increasing trend in Eastern China, displays a low value with decreasing trend in Central China, demonstrates a low value with increasing trend in Western China and exhibits a high value with decreasing trend in Northeastern China. Notably, in some years, the number of cities that implemented ADA was high but the value of POLY was low, and this phenomenon is different across regions. There are two possible reasons, as follows. On the one hand, the impact of ADA may have lagged effects, and therefore the maximization of POLY cannot be achieved in the same year as ADA implementation [71]. On the other hand, the policies related to ADA do not favor POLY in all regions. Unreasonable ADA may impede the development of POLY in some cities, and thus, the implementation of ADA leads to a reduction in the value of POLY. Hence, the complex linkages between ADA and POLY in different regions need to be further investigated.
Compared with other regions, the values of POLY are generally higher in Eastern China. The highest and lowest values of POLY in Eastern China are approximately 0.601 and 0.593, respectively. Although this change is small, there is still a slight increasing trend. In Central China, the POLY shows a gradually decreasing trend. The reason for this phenomenon may be related to the industrial transfer from the Eastern region to the Central region [63]. Although the average POLY in Western China is relatively low, it shows an increasing evolution trend. In Northeast China, the number of cities with ADA is low, and the average POLY shows a decreasing trend, which may be caused by city shrinkage resulting from population loss [72].

4.2. Spatiotemporal Pattern of POLY Agglomeration

In terms of the spatial distribution of POLY, the cities with higher POLY are mostly located in Eastern China, especially in coastal areas and megacity clusters such as Beijing–Tianjin–Hebei, Yangtze River Delta and Pearl River Delta (Figure 7). Cities with higher POLY generally have higher levels of socioeconomic development and rapid urban growth. The urban expansion in cities with higher POLY may cause a mismatch between administrative division management and socioeconomic development level. Consequently, the implementation of ADA in these cities can better balance and coordinate the development of administrative restructuring and socioeconomic development [19]. In addition, the cities with lower POLY are mostly distributed in Western China where the level of socioeconomic development is not high. In 2013, the proportion of cities with POLY greater than 0.6 was only 25.547%. Yet, this proportion increased to 27.372% in 2018. Because the value of POLY is expressed between 0 and 1, the closer it is to 1, the more polycentric the city is. Consequently, the changes in the value and proportion of POLY indicate that more and more cities are becoming polycentric. The development between centers within most cities has become more balanced over time [73].
The global Moran’s I index of POLY for each year from 2013 to 2018 all pass the 1% significance level test and show a positive spatial autocorrelation relationship (Table 2). Specifically, the value of the global Moran’s I index increased from 0.185 in 2013 to 0.231 in 2014. In addition, the global Moran’s I index of POLY passed 0.2 between 2014 and 2016 and lightly decreased from 0.183 in 2017 to 0.182 in 2018. The significant global Moran’s I index shows that cities with higher POLY are usually adjacent to nearby cities with higher POLY.
Based on the global Moran’s I index, this study further examines the different types of spatial agglomeration characteristics of POLY in localized areas through the analysis of hot spots and cold spots (Figure 8). The cold spots (significant level > 90%) reveal the low-value clusters of POLY, which primarily appear in western regions. The hot spots (significant level > 90%) display high-value clusters of POLY, which are mainly located in the eastern seaboard regions. The random regions (not significant) demonstrate the insignificant spatial agglomeration of POLY, which is widely distributed in Central and Northeastern China. In addition, the global Moran’s I index was higher between 2014 and 2016 than in other study periods, suggesting a stronger spatial connection of high-value clusters and low-value clusters. However, although there have been changes in cold spots and hot spots during the study period, the evolution and migration are relatively small. The spatiotemporal dynamic pattern of POLY is only slightly adjusted, indicating the time inertia and spatial stability.

4.3. Impacts of ADA and Socioeconomic Factors on POLY

To better examine the average effects of the various influencing factors on POLY, the global OLS model is adopted. In addition, because the GTWR model cannot test the significance of variable coefficients, the OLS model is used first to fully explore the relationship between ADA on POLY. As the results in Table 3 show, the coefficients of all variables are significant. In addition, the coefficients of ADA, ROAD, AREA, HOUSE and FINANCE are all positive. However, the coefficient of GDP is negative, which may be related to the different economic levels of cities. Cities usually move towards monocentric development to promote agglomeration economies when the economic levels are low [74]. POLY is usually adopted at higher economic levels to solve the problem of agglomeration diseconomies. Consequently, the POLY first declines as the economy grows and then rises at advanced stages of urban development [14]. The negative coefficient of GDP may be due to the still-low economic level of most Chinese cities. Although all variables passed the significance level of 0.1, the adjusted R2 only was 0.1433. It is necessary to adopt the GTWR model for further studies.
To test the performance of the different models, this study compares the parameters of accuracy evaluation between the OLS and GTWR models. R2 and adjusted R2 represent the goodness of model fitting. RSS corresponds to the residual sum of squares. AICc is Akaike’s information criterion adjusted for small sample sizes, which is also an important criterion for the degree of model fit. In general, the more accurate the model, the smaller the AICc and RSS, and the higher the R2 and adjusted R2. As the results in Table 4 show, the GTWR model is the better choice and shows significant improvement over the OLS model in terms of the results of RSS, AICc and adjusted R2. Specifically, the GTWR model has a higher value of R2 and adjusted R2 than the OLS model. In addition, the RSS and AICc of the GTWR model are 17.4498 and −2605.2158, which are also lower than those of the OLS model. These parameters further indicate that the GTWR model has better explanatory power for exploring the drivers of POLY by integrating temporal and spatial heterogeneity. The mean value of regression coefficients in the GTWR model denotes the average effect of ADA on POLY. Compared to other socioeconomic factors, ADA has a relatively high regression coefficient, second only to that of AREA. This indicates that ADA and AREA have profound impacts on POLY.
To further examine the temporal evolution trend of parameters in the GTWR model, the boxplots of the regression coefficients of different variables are drawn in Figure 9. The regression coefficients of ADA are mostly positive and the changes in regression coefficients are relatively stable, indicating that ADA can promote the development of POLY in most cities. However, the dispersion of the regression coefficients gradually increases, showing that the differences in the effects of ADA on POLY also increase over time.
The regression coefficients of GDP are mostly negative. This may be due to economically developed regions attracting more resources, such as concentration of population, factors and industries [75]. This concentration can lead to a decrease in the distance between different centers and result in the evolution of a monocentric structure [76].
Although most regression coefficients of ROAD are positive, there are many cities with negative coefficients. On the one hand, the improvements in the quality of transportation facilities can reduce the diseconomies of agglomeration and facilitate the clustering of different elements in new centers, thus promoting the development of POLY [77]. Yet, on the other hand, convenient transportation facilities also reduce the cost of commuting from subcenters to core centers, resulting in a greater concentration of population and economic activity in major centers [78].
The regression coefficients of AREA are mostly positive and the changes are stable, suggesting that land resources are essential to the development of POLY. The built-up area denotes the scale and size of construction land during the process of urbanization. It could provide the space carrier for the development of suburban centers, which could promote POLY [44].
The trend of the regression coefficients of HOUSE is similar to AREA, which shows as positive in most cities. However, the changes in HOUSE are unstable. The development of the real estate industry drives the concentration of the population dominated by residential functions, promotes the expansion of tertiary industry land related to social welfare, helps optimize the ratio of different types of land and promotes POLY [79,80].
The regression coefficient of FINANCE shows a trend of negative first and then positive, indicating the shift in government financial intervention in urbanization. This may be related to a change in the focus of governmental policy and planning from the growth of town size and total economic volume to high-quality development that focuses on human well-being, which contributes to the development of POLY [81].
Due to the vast territory of China, the impact of ADA on POLY is different distinctly between regions (Figure 10). The influence of ADA on POLY was positive for 85.036% of cities in 2013, while this proportion increased to 86.131% in 2018. The higher regression coefficients of ADA on POLY are mainly clustered in Eastern and Western China, showing an evolution trend that decreases in Central and Northeast China. On the one hand, ADA can mobilize resources and promote rapid urban spatial expansion. ADA can stimulate the development of new urban growth poles, support transportation infrastructure and merge suburban land by administrative means [27]. However, on the other hand, ADA also has negative impacts on POLY. Irrational ADA will lead to false urbanization and inhibit urban vitality [71]. Therefore, it is necessary to promote ADA prudently and selectively according to the development conditions of different regions.

4.4. Driving Factors of POLY between Cities with and without ADA

In the Eastern region with higher levels of marketization and the Northeastern region with higher levels of industrialization, there are small gaps in the regression coefficients of socioeconomic factors between cities with and without ADA (Figure 11). This suggests that the implementation of ADA has not affected the impact of socioeconomic factors on POLY. For the Eastern region, the resource allocation is mainly driven by the market rather than the government due to the higher level of economic conditions [82]. In terms of the Northeastern region, the industrial construction before the reform and opening up promoted urbanization and set the foundation of the urban spatial structure of POLY. In addition, the population loss in the Northeastern region has further constrained the POLY development [83]. Thus, the impacts of socioeconomic factors on POLY have small gaps between cities with and without ADA in Eastern and Northeastern China.
In the Central and Western regions, the impacts of GDP and AREA have more explanatory powers on POLY in cities with ADA. This indicates that economic development and land resources have played crucial roles in the construction of POLY under the implementation of ADA. With the guidance of policies such as the Western development and Central region revitalization, a large number of counties have undergone ADAs of converting counties into urban areas, promoting the in situ urbanization of the transferred agricultural population and further improving the development of POLY [84]. The urban expansion driven by ADA provides an opportunity for the return of factors such as population, industry and capital from the Eastern region to the Central and Western regions [85]. Different from the Eastern region, the Central and Western regions are lagging in terms of economic development and marketization [86]. Therefore, with government-led ADA, state-dominated economic growth and land approvals contribute to the building of emerging growth poles and facilitate the evolution of POLY [86]. This result further suggests that there are regional differences in the impact of state-driven ADA on POLY.

5. Discussion

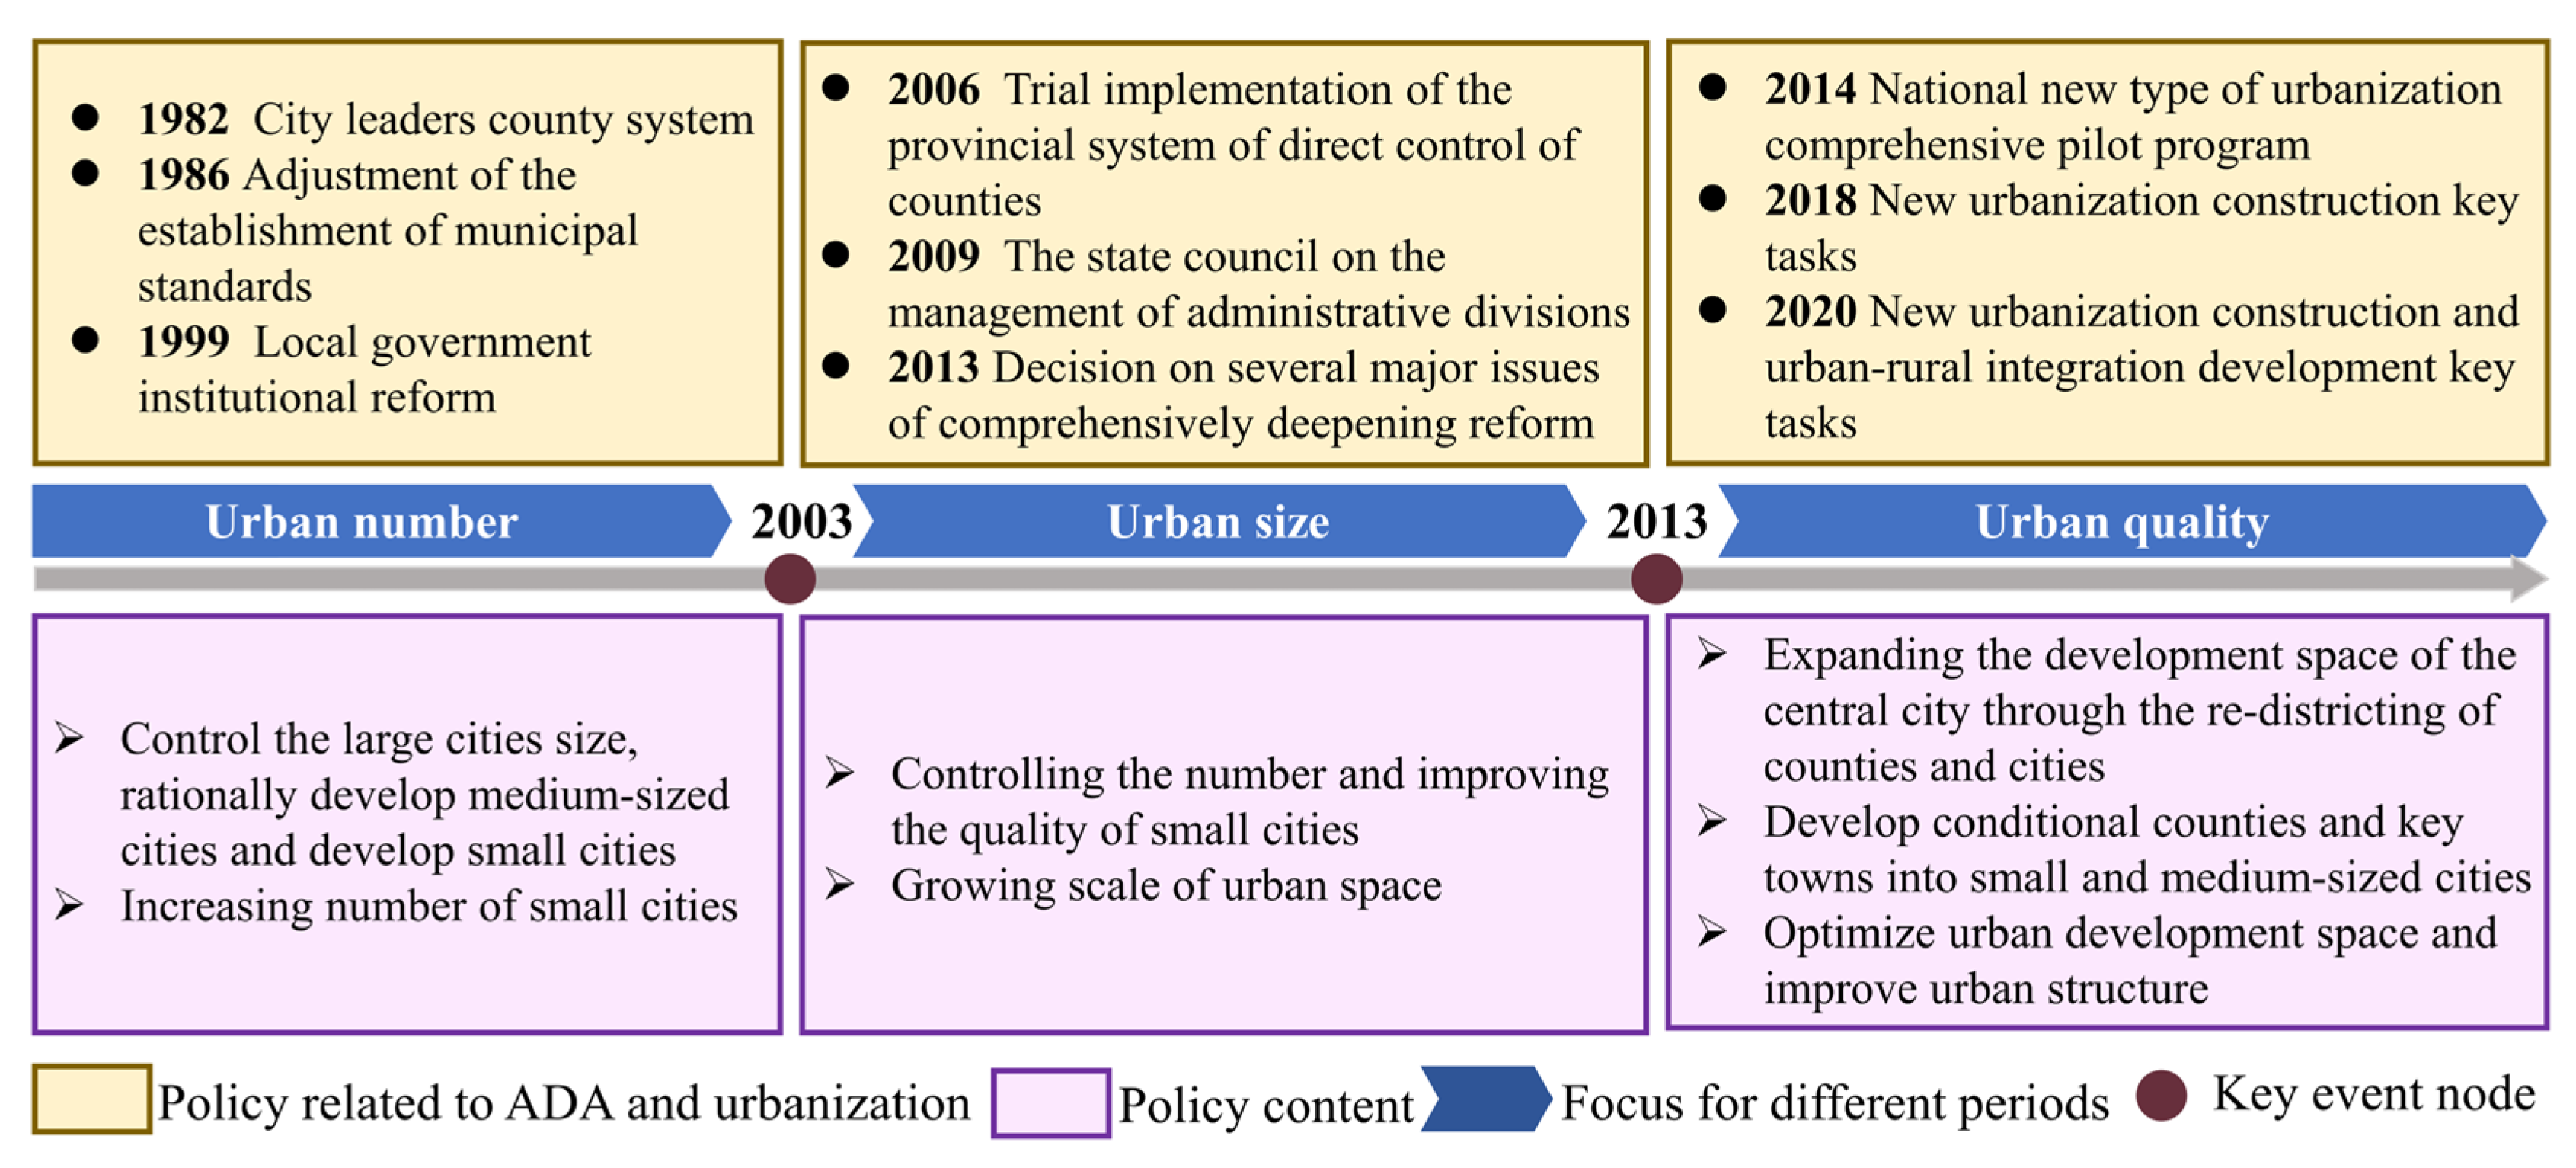
5.1. Policy Related to ADA and Urbanization

The emphasis on policies concerning ADA and urbanization has evolved over time. Before 2003, the primary concern was urban numbers. Between 2003 and 2013, the focus was urban size. Since 2013, the emphasis have shifted to urban quality (Figure 12) [87]. After the establishment of the People’s Republic of China, the administrative division system implemented a framework in which urban areas concentrated on industrial regulation, whereas rural regions emphasized agricultural governance [88]. This framework led to spatial segregation and substantial differentiation between urban and rural localities. The segregation and differentiation underwent a gradual dismantling after 1982, driven by policies associated with ADA, including the consolidation of cities and counties [89]. Furthermore, the hierarchy-reorganization policies under ADA have contributed to the increasingly numerous small cities. Notably, the number of prefecture-level cities rose significantly from 98 to 282 during the period from 1978 to 2003.
The transition of counties into districts emerged as the primary strategy for the ADA and urbanization transformation between 2003 and 2012 [90]. During this period, the count of municipal districts increased from 845 to 860. The policy of converting counties into districts, as implemented by ADA, offers the potential for optimizing resource allocation and distribution, facilitating urban expansion and inducing a profound impact on urban structure [91]. This is achieved through the strategic reconfiguration of territorial space within municipal districts, thus enabling more refined management of the urbanization process.
ADA policies since 2013 have prioritized the enhancement of urban development quality. The pertinent policy of new-type urbanization policy aims to transform eligible counties and strategic towns into small- to medium-sized cities [92]. The potential for urban expansion within the central city can be broadened through an ADA policy of transforming counties or cities into districts [29]. Over this period, there has been a significant rise of 119 in the establishment of new districts, contributing to the enhancement of urban development space and structure. The polycentric urban structure has been notably impacted as a result of the heightened emphasis on urban quality within the emphasis of ADA and urbanization-driven developmental policies since 2013.

5.2. The Relationship between ADA and POLY

Currently, the administrative hierarchy systems in China mainly include the levels of national, provincial, municipal, county and township [93]. However, with the socioeconomic changes, the original administrative space and administrative hierarchy may experience difficulties in meeting existing urban development needs [94]. To further adapt urban transformation and release urban vitality, ADA has become an essential spatial strategy for influencing POLY (Figure 13). Specifically, the types of ADA mainly include administrative spatial reorganization and administrative hierarchical changes. Administrative spatial reorganization involves merging administrative units, splitting administrative units and adjusting administrative units [95]. The reshaping of urban space by ADA could provide spatial resources for the development of POLY and break down the fixed administrative space and administrative boundaries across regions [96]. Moreover, it could also facilitate the free flow of social, economic and ecological elements between different cities and promote the construction of new centers and POLY [19]. Administrative hierarchical changes are dominated by levels of administrative hierarchical upgrades and administrative hierarchical downgrades [34]. The shift in the administrative hierarchy will alter the autonomy and management of urban development, which affects the interaction, cooperation and competition with other cities at higher or lower hierarchy levels [97]. Generally, cities with a higher administrative hierarchy tend to enjoy prioritized power in urban growth, which can influence policy disparities such as land approvals, tax systems and government expenditure distribution [98]. These disparities in policy tendencies will alter the spatial allocation of resources and result in the development of POLY [22].
ADA is also a double-edged sword for urban spatial transformation, with both positive and negative impacts on POLY. On the one hand, ADA has not only changed the urban geographical landscape but also reshaped resource allocation, production activities and lifestyle models [99]. For example, through suburban development such as land expansion and new town construction, most cities have generated financial income and achieved urban renewal, facilitating urban spatial transformation and polycentric form [100]. During the transition of urbanization characteristics from high-quantity to high-quality growth, ADA can improve the industrial structure, transportation facilities, public services and population clustering patterns by matching the urban development and administrative management [21]. On the other hand, some cities have blindly increased the spatial scale and political hierarchy through ADA to irrationally accelerate urban growth. The population and industrial demands of some cities have not kept pace with the speed of suburban development due to blind expansion with ADA, which caused negative impacts on urban spatial transformation and polycentricity [101].
The negative impact of ADA on POLY is closely connected to the mismatch between administrative division management and urban growth. The mismatch means that the ADA implemented does not meet urban development needs. It is mainly caused by the irrational implementation of ADA strategies such as spatial expansion and hierarchical upgrades in cities characterized by limited resources and underdeveloped economies [92]. The mismatch is detrimental to urban sustainable development and it also causes an inefficient allocation of resources and vicious competition between regions [35]. Although some cities have relatively low socioeconomic conditions and find it hard to support the development need of urban growth, the government is still looking to ADA to seek more urban space and higher authority [98]. These unreasonable ADAs will increase the living cost for residents and the production costs for enterprises, thereby leading to issues such as idle land resources and sluggish economic activities [102]. Therefore, it is still worthwhile to further explore the complex impact of ADA on the development of POLY. Governmental administrative intervention and urban planning should prioritize regional productivity and strive to balance the conflicting interests among diverse stakeholders including market-determined enterprises, social-oriented publics and state-led governments [91].

5.3. The Spatiotemporal Pattern of ADA and POLY

The evolution of both ADA and POLY are closely related to socioeconomic development under the rapid urbanization in China. Specifically, the spatiotemporal pattern of POLY and ADA has significant heterogeneity. POLY has a higher value in Eastern and Northeastern China and a lower value in Western and Central China. Eastern China was the first region to benefit from the reform and opening-up policy, with a higher level of marketization and economic development, which is conducive to the construction of POLY [33]. As a traditional industrial area, Northeast China started urbanization earlier, and the urban form has been influenced by the past planned economy system, resulting in a more decentralized and polycentric urban structure [103]. However, the number of cities with ADA is higher in Eastern and Western China than in Central and Northeastern China. This phenomenon is associated with the rapid economic development in the Eastern region and the substantial fiscal support that the Western region receives from the national government [104]. Such economic development and financial support stimulate socioeconomic activities’ reproduction, which leads to changes in the administrative hierarchy system and the implementation of ADA.
Due to the policy advantages such as the industrial dominance before 1978 and economic reform after 1978, most cities in Northeastern and Eastern China have higher levels of POLY and urbanization [105]. Owing to higher marketization and economic condition, cities in Eastern China have larger urban sizes and severe issues of agglomeration diseconomies [106]. It is urgent that such economy-driven cities pursue POLY through ADA to promote the borrowed effect across regions. The higher level of POLY in Northeastern China is derived from the developed heavy industry. The industrialization-based urban planning system laid the foundation for the spatial structure of cities [56]. The early mature industrial infrastructure laid the foundation for a multipolar urban structure of POLY [103]. However, the Northeastern region has shrunk significantly due to population loss and industrial decline. Consequently, the strategies of ADA focused on spatial expansion and hierarchical upgrading demonstrate limited promotion of POLY in the Northeastern region.
Notably, the impact of ADA on POLY is also different between regions. Specifically, the impact of ADA on POLY has higher value in the Eastern and Western regions, while it has lower value in the Central and Northeastern regions, and such a trend has increased over time. In Eastern China, there has been significant urban growth with adequate resource elements, which benefits the construction of POLY in the process of urban expansion with ADA [27]. Although Western China is not as rich in resource factors as Eastern China, ADA has played an essential role in the state-led urban spatial transformation during the in situ urbanization of rural areas [107]. ADA can benefit POLY in Western China by guiding the construction of small towns from the top down and promoting balanced development among cities. As for Central China, the emphasis of ADA is on the establishment of larger economic centers rather than polycentric structures, aimed at enhancing overall regional development efficiency [92]. Moreover, the less developed core urban districts will attract capital and labor from nearby smaller subcenters, resulting in backwash effects. These effects contribute to the growth of core centers with limited resources but hinder the development of peripheral subcenters and POLY [108]. In the case of Northeastern China, the urban shrinkage due to depopulation may cause negative impacts of ADA on POLY [109]. Despite ADA promoting urban hierarchy and expanding urban space, it lacks sufficient population and industry to support outward expansion and multipolarity, which even leads to the phenomenon of ghost towns [36]. Furthermore, the government has built satellite cities and industrial parks through ADA, but it is difficult to attract population and industries to these areas. This leads to inefficient resource allocation and is not conducive to the development of POLY [110].

5.4. Policy Implications

The influence of ADA on POLY in the new urbanization construction still deserves further exploration. To achieve a balanced approach between socioeconomic activities and state governance, it is necessary to selectively implement ADA with the comprehensive consideration of economic foundation, productivity level and natural resources. Based on the conclusions above, the policy implications are proposed as follows.
First, the effects of ADA on POLY vary widely across regions, so policymakers need to tailor their strategies to local conditions. For regions with a high level of socioeconomic development and adequate resource factors, it is necessary to further promote POLY through ADA by improving resource allocation capacity and spatial restructure optimization. However, for regions with limited economic radiation capacity and serious population loss, policymakers require careful consideration of urban expansion through ADA. Under the guidance of ADA, the spatial structure should be transformed from external expansion to endogenous development. The urban growth model should shift from extensive development to high-quality development with effective management of the intensity and scale of development.
Second, it is necessary to promote cooperation and coordinated development across regions. Implementing cross-regional infrastructure investment, talent training and talent importation programs to realize the role of developed core regions as a driving force for backward subregions. This includes conducting different policies for disparate regions, lowering fiscal taxes for less developed regions to attract investment and providing financial subsidies for technological research and scientific innovation in backward regions. Furthermore, this includes establishing functional urban metropolitan areas that decentralize economic activities, resources and services to different locations, thereby facilitating interaction and exchange between different centers in the POLY strategy.
Third, the implementation of ADA and POLY should consider the role of urban population size. The population could increase the influences of POLY on economic performance by alleviating the agglomeration diseconomy caused by the crowding effect in larger cities [15]. The positive externality of agglomeration generally exists in cities with small population sizes. POLY shows a beneficial effect as the population increases when the negative externality of agglomeration diseconomies outweighs the positive externality of agglomeration economies [111]. Consequently, policies related to ADA could be adopted in larger cities with more population to promote the positive impact of POLY on urban sustainable development. For nondensely populated cities, local stakeholders need to consider whether to prioritize the core center and have critical thinking regarding ADA and POLY.
Fourth, policymakers should consider strengthening the role of public participation and market governance in the formulation, implementation and monitoring of ADA policy. The urban form of POLY is not only a geographical space but also a complex policy involving the intricate elements of social organization, political system and economic production. During the process of POLY evolution, ADA not only requires top-down macro-level regulation but also needs to solicit public opinion. It should strengthen market-oriented comprehensive governance and oversight functions to prevent detrimental urban development caused by irrational ADA policies.

5.5. Contribution and Limitation

ADA in China has both differences and similarities compared to that in other countries. In terms of power distribution, China is a highly centralized country, where the administrative division adjustments are mainly controlled by the central government, with the top-down distribution of administrative power [112]. Federal countries such as the United States, Germany and Brazil have administrative divisions comprising federal and state entities [113]. Each of these regions holds substantial autonomy to make local policies. Concerning the number of administrative levels, China has a complex administrative division system due to its vast territory, and each level has different administrative duties and wields designated authority [89]. Other countries such as India, Brazil and Indonesia also have relatively complex administrative divisions systems and are in the process of rapid urbanization. Similar to China, these countries also have large populations and complex administrative systems, experiencing dramatic socioeconomic transformations [114]. While these countries are federal, they still confront the contradiction between old administrative systems and changing urban structures, which requires policies related to ADA to balance urban growth and administrative management. Furthermore, POLY and state-led urban planning are not only practiced in China but also adopted in other countries worldwide such as Singapore, France and Japan [36]. As urbanization reaches a high level, the administrative division of metropolitan areas has also become the focus of POLY research, which also involves the study of issues related to local government [115]. ADA, as an approach to state-led urban planning, provides theoretical insights and valuable guidance for urban spatial transformation and administrative government in these countries.
It is worth noting that although ADA is a special political strategy in rapidly urbanizing China, these findings could be employed in other regions worldwide with similar issues of changing socioeconomic and administrative systems. First, China’s experience in ADA can provide a reference for policymakers in other countries in the fields of population movement, resource integration and economic development. Second, the ADA in China could help other countries to understand how to establish more effective cooperation mechanisms between local and central governments to facilitate the implementation of cross-regional projects. Third, the implementation of ADA may be closely linked to economic development strategies, which could help other countries to think about how to promote economic growth and urban transformation through administrative restructuring.
This paper overcomes the limitation of spatiotemporal nonstationary relationships between ADA and POLY and deeply interprets the state-led driver factors of POLY. Furthermore, the utilization of high-resolution remote sensing data has been employed to depict in detail the evolution of urban structure. However, there are still several limitations to this study that require in-depth analysis. Due to data availability, this study selects only demographic characteristics as identification conditions and singularly analyzes the POLY from a morphological perspective. The demographic and morphological characteristics of POLY are difficult to use to adequately reflect the investigation of urban polycentric development in the multidimensional perspectives of economic activities, social culture and urban functions. Therefore, multisource big data such as nighttime light data, POI data and social media data are needed to measure more accurate findings in the future. Therefore, multisource big data with a higher spatial resolution are needed to measure more accurate findings in the future. In the meantime, the interpretation of POLY is required from an integrated insight of relational, functional and social polycentric structures, rather than focusing only on morphological structures.

6. Conclusions

Over the past few decades, China has witnessed rapid urbanization and a concomitant increase in policies related to ADA. Meanwhile, there are an increasing number of strategies of POLY aimed at promoting sustainable and coordinated urban development. However, the complex relationship between ADA, POLY and urban sustainability has not been well identified. Based on the LandScan population dataset, this exploratory study measured the degree of POLY in different cities and investigated its spatiotemporal pattern. Next, using the OLS and GTWR models, this study analyzed the complex spatiotemporal impacts of ADA on POLY and examined the socioeconomic driving forces for POLY in cities with and without ADA.
The main conclusions are as follows. First, the distribution pattern of POLY has regional heterogeneity. POLY has a higher value in Eastern China and a lower value in Western China. The number of cities with ADA is higher in Eastern and Western China than in Central and Northeastern China. Second, the impacts of ADA on POLY also have regional heterogeneity. The higher impacts of ADA on POLY are mainly clustered in Eastern and Western China, showing an evolution trend that decreases in Central and Northeast China. Third, as a critical state-led political driver, ADA affects POLY more than other socioeconomic factors. Fourth, the impacts of socioeconomic factors on POLY between cities with and without ADA differed significantly in Central and Western China while differed insignificantly in Eastern and Northeastern China.
These findings can provide valuable references and warnings for policymakers. ADA can promote POLY through spatial expansion and hierarchical upgrading. Yet, the spatiotemporal findings of the impact of ADA on POLY in different regions indicate that ADA and POLY are not appropriate in all cities. To further achieve sustainable and coordinated urban development, urban planners and policymakers should consider whether to implement ADA and think critically about POLY based on different urban attributes such as economy, industry, population and productivity.

Author Contributions

Conceptualization, Y.C. (Youlin Chen), L.W., P.Y. and Y.C. (Yiyun Chen); methodology, Y.C. (Youlin Chen); software, Y.C. (Youlin Chen); validation, Y.C. (Youlin Chen); formal analysis, Y.C. (Youlin Chen), L.W. and P.Y.; investigation, Y.C. (Youlin Chen), L.W. and P.Y.; resources, Y.C. (Yiyun Chen); data curation, Y.C. (Youlin Chen); writing—original draft preparation, Y.C. (Youlin Chen); writing—review and editing, Y.C. (Yiyun Chen), L.W. and P.Y.; visualization, Y.C. (Youlin Chen), N.N. and X.Y.; supervision, Y.C. (Youlin Chen), L.W., P.Y. and Y.C. (Yiyun Chen); project administration, Y.C. (Youlin Chen), L.W., P.Y. and Y.C. (Yiyun Chen); funding acquisition, L.W. All authors have read and agreed to the published version of the manuscript.

Funding

This research was funded by the National Social Science Foundation of China, grant number 18ZDA040.

Data Availability Statement

The data in this study are available from the corresponding authors upon request.

Conflicts of Interest

The authors declare no conflict of interest.

References

  1. Wang, J.; Zhang, X. Land-Based Urbanization in China: Mismatched Land Development in the Post-Financial Crisis Era. Habitat Int. 2022, 125, 102598. [Google Scholar] [CrossRef]
  2. Ren, Q.; Liu, D.; Liu, Y. Spatio-Temporal Variation of Ecosystem Services and the Response to Urbanization: Evidence Based on Shandong Province of China. Ecol. Indic. 2023, 151, 110333. [Google Scholar] [CrossRef]
  3. Tian, L.; Yan, Y.; Lin, G.C.S.; Wu, Y.; Shao, L. Breaking the Land Monopoly: Can Collective Land Reform Alleviate the Housing Shortage in China’s Mega-Cities? Cities 2020, 106, 102878. [Google Scholar] [CrossRef]
  4. Sun, C.; Lu, J. The Relative Roles of Socioeconomic Factors and Governance Policies in Urban Traffic Congestion: A Global Perspective. Land 2022, 11, 1616. [Google Scholar] [CrossRef]
  5. Zhang, X.; Han, L.; Wei, H.; Tan, X.; Zhou, W.; Li, W.; Qian, Y. Linking Urbanization and Air Quality Together: A Review and a Perspective on the Future Sustainable Urban Development. J. Clean. Prod. 2022, 346, 130988. [Google Scholar] [CrossRef]
  6. Wu, Y.; Zong, T.; Shuai, C.; Liao, S.; Jiao, L.; Shen, L. Does Resource Environment Carrying Capacity Have a Coercive Effect on Urbanization Quality? Evidence from the Yangtze River Economic Belt, China. J. Clean. Prod. 2022, 365, 132612. [Google Scholar] [CrossRef]
  7. Chen, M.; Liu, W.; Lu, D.; Chen, H.; Ye, C. Progress of China’s New-Type Urbanization Construction since 2014: A Preliminary Assessment. Cities 2018, 78, 180–193. [Google Scholar] [CrossRef]
  8. Zhang, Y.; Wang, L.; Tang, Z.; Zhang, K.; Wang, T. Spatial Effects of Urban Expansion on Air Pollution and Eco-Efficiency: Evidence from Multisource Remote Sensing and Statistical Data in China. J. Clean. Prod. 2022, 367, 132973. [Google Scholar] [CrossRef]
  9. Ding, C.; Zhao, X. Land Market, Land Development and Urban Spatial Structure in Beijing. Land Use Policy 2014, 40, 83–90. [Google Scholar] [CrossRef]
  10. Hu, L.; Sun, T.; Wang, L. Evolving Urban Spatial Structure and Commuting Patterns: A Case Study of Beijing, China. Transp. Res. Part D Transp. Environ. 2018, 59, 11–22. [Google Scholar] [CrossRef]
  11. Zhang, L.; Shu, X.; Luo, J. The Formation of a Polycentric City in Transitional China in a Three-Level Analysis Framework: The Case Study of Hangzhou. Land 2022, 11, 2054. [Google Scholar] [CrossRef]
  12. Wang, T.; Yue, W.; Ye, X.; Liu, Y.; Lu, D. Re-Evaluating Polycentric Urban Structure: A Functional Linkage Perspective. Cities 2020, 101, 102672. [Google Scholar] [CrossRef]
  13. Hu, R. New Directions in Chinese Metropolitan Planning; Taylor & Francis: Abingdon, UK, 2023. [Google Scholar]
  14. Sun, T.; Lv, Y. Employment Centers and Polycentric Spatial Development in Chinese Cities: A Multi-Scale Analysis. Cities 2020, 99, 102617. [Google Scholar] [CrossRef]
  15. Zhang, T.; Sun, B.; Li, W. The Economic Performance of Urban Structure: From the Perspective of Polycentricity and Monocentricity. Cities 2017, 68, 18–24. [Google Scholar] [CrossRef]
  16. Chen, M.; Ye, C.; Lu, D.; Sui, Y.; Guo, S. Cognition and Construction of the Theoretical Connotations of New Urbanization with Chinese Characteristics. J. Geogr. Sci. 2019, 29, 1681–1698. [Google Scholar] [CrossRef]
  17. Zeng, C.; Song, Y.; He, Q.; Liu, Y. Urban–Rural Income Change: Influences of Landscape Pattern and Administrative Spatial Spillover Effect. Appl. Geogr. 2018, 97, 248–262. [Google Scholar] [CrossRef]
  18. Yu, H.; Deng, Y.; Xu, S. Evolutionary Pattern and Effect of Administrative Division Adjustment During Urbanization of China: Empirical Analysis on Multiple Scales. Chin. Geogr. Sci. 2018, 28, 758–772. [Google Scholar] [CrossRef]
  19. Wu, K.Y.; Zhang, H. Land Use Dynamics, Built-up Land Expansion Patterns, and Driving Forces Analysis of the Fast-Growing Hangzhou Metropolitan Area, Eastern China (1978–2008). Appl. Geogr. 2012, 34, 137–145. [Google Scholar] [CrossRef]
  20. Feng, R.; Wang, F.; Wang, K.; Xu, S. Quantifying Influences of Anthropogenic-Natural Factors on Ecological Land Evolution in Mega-Urban Agglomeration: A Case Study of Guangdong-Hong Kong-Macao Greater Bay Area. J. Clean. Prod. 2021, 283, 125304. [Google Scholar] [CrossRef]
  21. Chien, S.-S. New Local State Power through Administrative Restructuring—A Case Study of Post-Mao China County-Level Urban Entrepreneurialism in Kunshan. Geoforum 2013, 46, 103–112. [Google Scholar] [CrossRef]
  22. Wang, J.; Yeh, A.G.O. Administrative Restructuring and Urban Development in China: Effects of Urban Administrative Level Upgrading. Urban Stud. 2020, 57, 1201–1223. [Google Scholar] [CrossRef]
  23. Li, Y.; Derudder, B. Dynamics in the Polycentric Development of Chinese Cities, 2001–2016. Urban Geogr. 2022, 43, 272–292. [Google Scholar] [CrossRef]
  24. Wu, F.; Phelps, N.A. (Post)Suburban Development and State Entrepreneurialism in Beijing’s Outer Suburbs. Environ. Plan. A Econ. Sp. 2011, 43, 410–430. [Google Scholar] [CrossRef]
  25. Chorianopoulos, I. State Spatial Restructuring in Greece: Forced Rescaling, Unresponsive Localities. Eur. Urban Reg. Stud. 2012, 19, 331–348. [Google Scholar] [CrossRef]
  26. Li, H.; Wei, Y.D.; Liao, F.H.; Huang, Z. Administrative Hierarchy and Urban Land Expansion in Transitional China. Appl. Geogr. 2015, 56, 177–186. [Google Scholar] [CrossRef]
  27. Feng, R.; Wang, K. Spatiotemporal Effects of Administrative Division Adjustment on Urban Expansion in China. Land Use Policy 2021, 101, 105143. [Google Scholar] [CrossRef]
  28. Zeng, C.; Zhang, A.; Liu, L.; Liu, Y. Administrative Restructuring and Land-Use Intensity—A Spatial Explicit Perspective. Land Use Policy 2017, 67, 190–199. [Google Scholar] [CrossRef]
  29. Chao, F.; You, C.; Jin, W. Optimizing Urban Stock Space through District Boundary Reorganization: Hangzhou’s Administrative Adjustment. Land 2023, 12, 959. [Google Scholar] [CrossRef]
  30. Liu, Y.; Yin, G.; Ma, L.J.C. Local State and Administrative Urbanization in Post-Reform China: A Case Study of Hebi City, Henan Province. Cities 2012, 29, 107–117. [Google Scholar] [CrossRef]
  31. Zhu, C.H.; Xie, H.M.; Zhou, W.X.; Zhang, S.W. Impact of Administrative Division Adjustment on Location and Accessibility of Heifei, China. Appl. Mech. Mater. 2012, 253–255, 271–277. [Google Scholar] [CrossRef]
  32. Miller, H.J. Tobler’s First Law and Spatial Analysis. Ann. Assoc. Am. Geogr. 2004, 94, 284–289. [Google Scholar] [CrossRef]
  33. He, S.; Yu, S.; Li, G.; Zhang, J. Exploring the Influence of Urban Form on Land-Use Efficiency from a Spatiotemporal Heterogeneity Perspective: Evidence from 336 Chinese Cities. Land Use Policy 2020, 95, 104576. [Google Scholar] [CrossRef]
  34. Zhu, J.; Chen, X.; Chen, T. Spheres of Urban Influence and Factors in Beijing-Tianjin-Hebei Metropolitan Region Based on Viewpoint of Administrative Division Adjustment. Chin. Geogr. Sci. 2017, 27, 709–721. [Google Scholar] [CrossRef]
  35. Feng, R.; Wang, K.; Wang, F. Quantifying Influences of Administrative Division Adjustment on PM2.5 Pollution in China’s Mega-Urban Agglomerations. J. Environ. Manag. 2022, 302, 113993. [Google Scholar] [CrossRef]
  36. Cheng, H.; Shaw, D. Polycentric Development Practice in Master Planning: The Case of China. Int. Plan. Stud. 2018, 23, 163–179. [Google Scholar] [CrossRef]
  37. Fang, C. Important Progress and Future Direction of Studies on China’s Urban Agglomerations. J. Geogr. Sci. 2015, 25, 1003–1024. [Google Scholar] [CrossRef]
  38. Wang, K.; Feng, R. Quantitative Measurement of the Effects of Administrative Division Adjustments on Regional Development. J. Geogr. Sci. 2021, 31, 1775–1790. [Google Scholar] [CrossRef]
  39. Zeng, C.; Zhang, A.; Xu, S. Urbanization and Administrative Restructuring: A Case Study on the Wuhan Urban Agglomeration. Habitat Int. 2016, 55, 46–57. [Google Scholar] [CrossRef]
  40. Derudder, B.; Meijers, E.; Harrison, J.; Hoyler, M.; Liu, X. Polycentric Urban Regions: Conceptualization, Identification and Implications. Reg. Stud. 2022, 56, 1–6. [Google Scholar] [CrossRef]
  41. Zhao, Z.Q.; He, B.J.; Li, L.G.; Wang, H.B.; Darko, A. Profile and Concentric Zonal Analysis of Relationships between Land Use/Land Cover and Land Surface Temperature: Case Study of Shenyang, China. Energy Build. 2017, 155, 282–295. [Google Scholar] [CrossRef]
  42. Cai, J.; Huang, B.; Song, Y. Using Multi-Source Geospatial Big Data to Identify the Structure of Polycentric Cities. Remote Sens. Environ. 2017, 202, 210–221. [Google Scholar] [CrossRef]
  43. Douglas, I. Urban Geomorphology. In The Routledge Handbook of Urban Ecology; Routledge: London, UK, 2020; pp. 186–209. ISBN 0429506759. [Google Scholar]
  44. Liu, X.; Wang, M. How Polycentric Is Urban China and Why? A Case Study of 318 Cities. Landsc. Urban Plan. 2016, 151, 10–20. [Google Scholar] [CrossRef]
  45. Huang, J.; Lu, X.X.; Sellers, J.M. A Global Comparative Analysis of Urban Form: Applying Spatial Metrics and Remote Sensing. Landsc. Urban Plan. 2007, 82, 184–197. [Google Scholar] [CrossRef]
  46. Liu, X.; Derudder, B.; Wu, K. Measuring Polycentric Urban Development in China: An Intercity Transportation Network Perspective. Reg. Stud. 2016, 50, 1302–1315. [Google Scholar] [CrossRef]
  47. Huang, D.; Liu, Z.; Zhao, X.; Zhao, P. Emerging Polycentric Megacity in China: An Examination of Employment Subcenters and Their Influence on Population Distribution in Beijing. Cities 2017, 69, 36–45. [Google Scholar] [CrossRef]
  48. Yu, H.; Yang, J.; Li, T.; Jin, Y.; Sun, D. Morphological and Functional Polycentric Structure Assessment of Megacity: An Integrated Approach with Spatial Distribution and Interaction. Sustain. Cities Soc. 2022, 80, 103800. [Google Scholar] [CrossRef]
  49. Huang, B.; Wu, B.; Barry, M. Geographically and Temporally Weighted Regression for Modeling Spatio-Temporal Variation in House Prices. Int. J. Geogr. Inf. Sci. 2010, 24, 383–401. [Google Scholar] [CrossRef]
  50. Yu, P.; Chen, Y.; Xu, Q.; Zhang, S.; Yung, E.H.K.; Chan, E.H.W. Embedding of Spatial Equity in a Rapidly Urbanising Area: Walkability and Air Pollution Exposure. Cities 2022, 131, 103942. [Google Scholar] [CrossRef]
  51. Elvidge, C.D.; Sutton, P.C.; Ghosh, T.; Tuttle, B.T.; Baugh, K.E.; Bhaduri, B.; Bright, E. A Global Poverty Map Derived from Satellite Data. Comput. Geosci. 2009, 35, 1652–1660. [Google Scholar] [CrossRef]
  52. Yu, P.; Yung, E.H.K.; Chan, E.H.W.; Wang, S.; Chen, Y.; Chen, Y. Capturing Open Space Fragmentation in High–Density Cities: Towards Sustainable Open Space Planning. Appl. Geogr. 2023, 154, 102927. [Google Scholar] [CrossRef]
  53. Zhou, Y.; Li, X.; Liu, Y. Land Use Change and Driving Factors in Rural China during the Period 1995–2015. Land Use Policy 2020, 99, 105048. [Google Scholar] [CrossRef]
  54. Meng, M.; Qu, D. Understanding the Green Energy Efficiencies of Provinces in China: A Super-SBM and GML Analysis. Energy 2022, 239, 121912. [Google Scholar] [CrossRef]
  55. Zhang, J.; Wu, F. China’s Changing Economic Governance: Administrative Annexation and the Reorganization of Local Governments in the Yangtze River Delta. Reg. Stud. 2006, 40, 3–21. [Google Scholar] [CrossRef]
  56. Wang, Y.; Liu, Y.; Li, Y.; Li, T. The Spatio-Temporal Patterns of Urban-Rural Development Transformation in China since 1990. Habitat Int. 2016, 53, 178–187. [Google Scholar] [CrossRef]
  57. Dobson, J.E.; Bright, E.A.; Coleman, P.R.; Durfee, R.C.; Worley, B.A. LandScan: A Global Population Database for Estimating Populations at Risk. In Remotely-Sensed Cities; CRC Press: Boca Raton, FL, USA, 2003; Volume 66, pp. 301–314. [Google Scholar]
  58. Yu, P.; Chan, E.H.W.; Yung, E.H.K.; Wong, M.S.; Chen, Y. Open Space Fragmentation in Hong Kong’s Built–up Area: An Integrated Approach Based on Spatial Horizontal and Vertical Equity Lenses. Environ. Impact Assess. Rev. 2023, 102, 107174. [Google Scholar] [CrossRef]
  59. Leslie, T.F. Identification and Differentiation of Urban Centers in Phoenix through a Multi-Criteria Kernel-Density Approach. Int. Reg. Sci. Rev. 2010, 33, 205–235. [Google Scholar] [CrossRef]
  60. Bartosiewicz, B.; Marcińczak, S. Investigating Polycentric Urban Regions: Different Measures—Different Results. Cities 2020, 105, 102855. [Google Scholar] [CrossRef]
  61. Green, N. Functional Polycentricity: A Formal Definition in Terms of Social Network Analysis. Urban Stud. 2007, 44, 2077–2103. [Google Scholar] [CrossRef]
  62. Anselin, L. Local Indicators of Spatial Association-LISA. Geogr. Anal. 2010, 27, 93–115. [Google Scholar] [CrossRef]
  63. Liu, Y.; Chen, X.; Liu, D. How Does Urban Spatial Structure Affect Economic Growth? Evidence from Landsat Data in China. J. Econ. Issues 2020, 54, 798–812. [Google Scholar] [CrossRef]
  64. Horrace, W.C.; Oaxaca, R.L. Results on the Bias and Inconsistency of Ordinary Least Squares for the Linear Probability Model. Econ. Lett. 2006, 90, 321–327. [Google Scholar] [CrossRef]
  65. Yu, P.; Zhang, S.; Yung, E.H.K.; Chan, E.H.W.; Luan, B.; Chen, Y. On the Urban Compactness to Ecosystem Services in a Rapidly Urbanising Metropolitan Area: Highlighting Scale Effects and Spatial Non–Stationary. Environ. Impact Assess. Rev. 2023, 98, 106975. [Google Scholar] [CrossRef]
  66. Chen, Y.; Yu, P.; Chen, Y.; Chen, Z. Spatiotemporal Dynamics of Rice–Crayfish Field in Mid-China and Its Socioeconomic Benefits on Rural Revitalisation. Appl. Geogr. 2022, 139, 102636. [Google Scholar] [CrossRef]
  67. Chen, E.; Ye, Z.; Wang, C.; Zhang, W. Discovering the Spatio-Temporal Impacts of Built Environment on Metro Ridership Using Smart Card Data. Cities 2019, 95, 102359. [Google Scholar] [CrossRef]
  68. Pagliara, F.; Mauriello, F. Modelling the Impact of High Speed Rail on Tourists with Geographically Weighted Poisson Regression. Transp. Res. Part A Policy Pract. 2020, 132, 780–790. [Google Scholar] [CrossRef]
  69. Garcia-López, M.À. Urban Spatial Structure, Suburbanization and Transportation in Barcelona. J. Urban Econ. 2012, 72, 176–190. [Google Scholar] [CrossRef]
  70. Wen, H.; Tao, Y. Polycentric Urban Structure and Housing Price in the Transitional China: Evidence from Hangzhou. Habitat Int. 2015, 46, 138–146. [Google Scholar] [CrossRef]
  71. Feng, R.; Wang, K. The Direct and Lag Effects of Administrative Division Adjustment on Urban Expansion Patterns in Chinese Mega-Urban Agglomerations. Land Use Policy 2022, 112, 105805. [Google Scholar] [CrossRef]
  72. Chen, Y.; Zhang, D. Multiscale Assessment of the Coupling Coordination between Innovation and Economic Development in Resource-Based Cities: A Case Study of Northeast China. J. Clean. Prod. 2021, 318, 128597. [Google Scholar] [CrossRef]
  73. Li, Y. Towards Concentration and Decentralization: The Evolution of Urban Spatial Structure of Chinese Cities, 2001–2016. Comput. Environ. Urban Syst. 2020, 80, 101425. [Google Scholar] [CrossRef]
  74. Wang, X.; Liu, J.; Zhang, W. Impact of High-Speed Rail on Spatial Structure in Prefecture-Level Cities: Evidence from the Central Plains Urban Agglomeration, China. Sustainability 2022, 14, 16312. [Google Scholar] [CrossRef]
  75. Ma, Y.; Xu, R. Remote Sensing Monitoring and Driving Force Analysis of Urban Expansion in Guangzhou City, China. Habitat Int. 2010, 34, 228–235. [Google Scholar] [CrossRef]
  76. Liu, X.; Derudder, B.; Wang, M. Polycentric Urban Development in China: A Multi-Scale Analysis. Environ. Plan. B Urban Anal. City Sci. 2018, 45, 953–972. [Google Scholar] [CrossRef]
  77. Garcia-López, M.À.; Hémet, C.; Viladecans-Marsal, E. Next Train to the Polycentric City: The Effect of Railroads on Subcenter Formation. Reg. Sci. Urban Econ. 2017, 67, 50–63. [Google Scholar] [CrossRef]
  78. Sun, B.; He, Z.; Zhang, T.; Wang, R. Urban Spatial Structure and Commute Duration: An Empirical Study of China. Int. J. Sustain. Transp. 2016, 10, 638–644. [Google Scholar] [CrossRef]
  79. Pain, K.; Shi, S.; Black, D.; Blower, J.; Grimmond, S.; Hunt, A.; Milcheva, S.; Crawford, B.; Dale, N.; Doolin, S.; et al. Real Estate Investment and Urban Density: Exploring the Polycentric Urban Region Using a Topological Lens. Territ. Polit. Gov. 2023, 11, 241–260. [Google Scholar] [CrossRef]
  80. Feng, J.; Wang, F.; Zhou, Y. The Spatial Restructuring of Population in Metropolitan Beijing: Toward Polycentricity in the Post-Reform Era. Urban Geogr. 2009, 30, 779–802. [Google Scholar] [CrossRef]
  81. Huang, X.; Li, Y.; Hay, I. Polycentric City-Regions in the State-Scalar Politics of Land Development: The Case of China. Land Use Policy 2016, 59, 168–175. [Google Scholar] [CrossRef]
  82. Zhang, W.; Wang, M.Y. Spatial-Temporal Characteristics and Determinants of Land Urbanization Quality in China: Evidence from 285 Prefecture-Level Cities. Sustain. Cities Soc. 2018, 38, 70–79. [Google Scholar] [CrossRef]
  83. Liu, S.; Zhang, P.; Wang, Z.; Liu, W.; Tan, J. Measuring the Sustainable Urbanization Potential of Cities in Northeast China. J. Geogr. Sci. 2016, 26, 549–567. [Google Scholar] [CrossRef]
  84. Liu, Y.; Zhang, X. Does Labor Mobility Follow the Inter-Regional Transfer of Labor-Intensive Manufacturing? The Spatial Choices of China’s Migrant Workers. Habitat Int. 2022, 124, 102559. [Google Scholar] [CrossRef]
  85. Yin, G.; Liu, Y. Administrative Urbanization and City-Making in Post-Reform China: A Case Study of Ordos City, Inner Mongolia. Chin. Geogr. Sci. 2017, 27, 891–903. [Google Scholar] [CrossRef]
  86. Yin, G.; Liu, Y.; Wang, F. Emerging Chinese New Towns: Local Government-Directed Capital Switching in Inland China. Cities 2018, 79, 102–112. [Google Scholar] [CrossRef]
  87. Furlong, K. Geographies of Infrastructure III: Infrastructure with Chinese Characteristics. Prog. Hum. Geogr. 2022, 46, 915–925. [Google Scholar] [CrossRef]
  88. Chan, K.W.; Wei, Y. Two Systems in One Country: The Origin, Functions, and Mechanisms of the Rural-Urban Dual System in China. Eurasian Geogr. Econ. 2019, 60, 422–454. [Google Scholar] [CrossRef]
  89. Ma, L.J.C. Urban Administrative Restructuring, Changing Scale Relations and Local Economic Development in China. Polit. Geogr. 2005, 24, 477–497. [Google Scholar] [CrossRef]
  90. Wang, X.; Shi, R.; Shi, Q. Spatiotemporal Evolution of Regional Green Economy under Administrative Division Adjustment on Applications of Artificial Intelligence: A Case Study of the Guangdong-Hong Kong-Macao Greater Bay Area. Wirel. Commun. Mob. Comput. 2022, 2022, 9217915. [Google Scholar] [CrossRef]
  91. Shen, J. Scale, State and the City: Urban Transformation in Post-Reform China. Habitat Int. 2007, 31, 303–316. [Google Scholar] [CrossRef]
  92. Guan, X.; Wei, H.; Lu, S.; Dai, Q.; Su, H. Assessment on the Urbanization Strategy in China: Achievements, Challenges and Reflections. Habitat Int. 2018, 71, 97–109. [Google Scholar] [CrossRef]
  93. Liu, Y.; Zhou, Y. Territory Spatial Planning and National Governance System in China. Land Use Policy 2021, 102, 105288. [Google Scholar] [CrossRef]
  94. Li, H.; Wei, Y.D.; Zhou, Y. Spatiotemporal Analysis of Land Development in Transitional China. Habitat Int. 2017, 67, 79–95. [Google Scholar] [CrossRef]
  95. Wang, K.; Qi, W. Space-Time Relationship between Urban Municipal District Adjustment and Built-up Area Expansion in China. Chin. Geogr. Sci. 2017, 27, 165–175. [Google Scholar] [CrossRef]
  96. Wang, P.; Zeng, C.; Song, Y.; Guo, L.; Liu, W.; Zhang, W. The Spatial Effect of Administrative Division on Land-Use Intensity. Land 2021, 10, 543. [Google Scholar] [CrossRef]
  97. Cartier, C. Territorial Urbanization and the Party-State in China. Territ. Polit. Gov. 2015, 3, 294–320. [Google Scholar] [CrossRef]
  98. Chao, H.; Lin, G.C.S. Spatializing the Project of State Rescaling in Post-Reform China: Emerging Geography of National New Areas. Habitat Int. 2020, 97, 102121. [Google Scholar] [CrossRef]
  99. Wang, K.; Wang, F. Theory and Measurement Model of Administrative Region Potential from a Perspective of Administrative Division Adjustment: Taking Chongqing City as a Case Study. J. Geogr. Sci. 2020, 30, 1341–1362. [Google Scholar] [CrossRef]
  100. Spórna, T.; Krzysztofik, R. ‘Inner’ Suburbanisation—Background of the Phenomenon in a Polycentric, Post-Socialist and Post-Industrial Region. Example from the Katowice Conurbation, Poland. Cities 2020, 104, 102789. [Google Scholar] [CrossRef]
  101. Lin, W.; Wu, M.; Zhang, Y.; Zeng, R.; Zheng, X.; Shao, L.; Zhao, L.; Li, S.; Tang, Y. Regional Differences of Urbanization in China and Its Driving Factors. Sci. China Earth Sci. 2018, 61, 778–791. [Google Scholar] [CrossRef]
  102. Zhang, X.; Sun, Y. Investigating Institutional Integration in the Contexts of Chinese City-Regionalization: Evidence from Shenzhen–Dongguan–Huizhou. Land Use Policy 2019, 88, 104170. [Google Scholar] [CrossRef]
  103. Deng, H.; Zhang, K.; Wang, F.; Dang, A. Compact or Disperse? Evolution Patterns and Coupling of Urban Land Expansion and Population Distribution Evolution of Major Cities in China, 1998–2018. Habitat Int. 2021, 108, 102324. [Google Scholar] [CrossRef]
  104. Schneider, A.; Chang, C.; Paulsen, K. The Changing Spatial Form of Cities in Western China. Landsc. Urban Plan. 2015, 135, 40–61. [Google Scholar] [CrossRef]
  105. Ma, M.; Lang, Q.; Yang, H.; Shi, K.; Ge, W. Identification of Polycentric Cities in China Based on Npp-Viirs Nighttime Light Data. Remote Sens. 2020, 12, 3248. [Google Scholar] [CrossRef]
  106. Lv, Y.; Zhou, L.; Yao, G.; Zheng, X. Detecting the True Urban Polycentric Pattern of Chinese Cities in Morphological Dimensions: A Multiscale Analysis Based on Geospatial Big Data. Cities 2021, 116, 103298. [Google Scholar] [CrossRef]
  107. Kan, K.; Chen, J. Rural Urbanization in China: Administrative Restructuring and the Livelihoods of Urbanized Rural Residents. J. Contemp. China 2022, 31, 626–643. [Google Scholar] [CrossRef]
  108. Deng, N.; Feng, B.; Partridge, M.D. A Blessing or Curse: The Spillover Effects of City–County Consolidation on Local Economies. Reg. Stud. 2022, 56, 1571–1588. [Google Scholar] [CrossRef]
  109. Tong, Y.; Liu, W.; Li, C.; Zhang, J.; Ma, Z. Understanding Patterns and Multilevel Influencing Factors of Small Town Shrinkage in Northeast China. Sustain. Cities Soc. 2021, 68, 102811. [Google Scholar] [CrossRef]
  110. Xian, Y.; Chen, M. Population Evolution at the Prefecture-Level City Scale in China: Change Patterns and Spatial Correlations. J. Geogr. Sci. 2022, 32, 1281–1296. [Google Scholar] [CrossRef]
  111. Shi, K.; Liu, G.; Cui, Y.; Wu, Y. What Urban Spatial Structure Is More Conducive to Reducing Carbon Emissions? A Conditional Effect of Population Size. Appl. Geogr. 2023, 151, 102855. [Google Scholar] [CrossRef]
  112. Charnes, A.; Cooper, W.W.; Li, S. Using Data Envelopment Analysis to Evaluate Efficiency in the Economic Performance of Chinese Cities. Socioecon. Plann. Sci. 1989, 23, 325–344. [Google Scholar] [CrossRef]
  113. Borchert, J. Ambition and Opportunity in Federal Systems: The Political Sociology of Political Career Patterns in Brazil, Germany, and the United States. In Proceedings of the APSA 2009 Toronto Meeting Paper, Toronto, ON, Canada, 3–6 September 2009; p. 21. [Google Scholar]
  114. Milanovic, B. Half a World: Regional Inequality in Five Great Federations. J. Asia Pacific Econ. 2005, 10, 408–445. [Google Scholar] [CrossRef]
  115. Zhao, B.; Xi, X. Economic Effects of Conversion from County (or County-Level City) to Municipal District in China. PLoS ONE 2022, 17, e0272267. [Google Scholar] [CrossRef] [PubMed]
Figure 1. The methodological framework for the linkages between ADA and POLY.
Land 12 01674 g001
Figure 2. The geographic locations of the four regions and the cities with and without ADA.
Land 12 01674 g002
Figure 3. The core center and subcenters of Shanghai. (AD) show part of the circled subcenters.
Land 12 01674 g003
Figure 4. The conceptual figures of extremely polycentric, intermediate, and extremely monocentric with five theoretical centers A, B, C, D and E (due to visibility, figures do not show the connection of all the nonadjacent centers).
Land 12 01674 g004
Figure 5. The temporal distribution of POLY from 2013 to 2018.
Land 12 01674 g005
Figure 6. The value of average POLY and number of ADAs in different regions in China. (a) Eastern China; (b) Central China; (c) Western China and (d) Northeast China.
Land 12 01674 g006
Figure 7. The spatial distribution of the POLY: (a) 2013; (b) 2014; (c) 2015; (d) 2016; (e) 2017 and (f) 2018.
Land 12 01674 g007
Figure 8. The hot spots and cold spots analysis of POLY: (a) 2013; (b) 2014; (c) 2015; (d) 2016; (e) 2017 and (f) 2018.
Land 12 01674 g008
Figure 9. The boxplots of the regression coefficients of different variables in the GTWR model: (a) ADA; (b) GDP; (c) ROAD; (d) AREA; (e) HOUSE and (f) FINANCE.
Land 12 01674 g009
Figure 10. The spatial distribution of regression coefficients of ADA in the GTWR model.
Land 12 01674 g010
Figure 11. The regression coefficient of socioeconomic driving factors of POLY between cities with and without ADA: (a) Eastern China, (b) Central China, (c) Western China and (d) Northeastern China.
Land 12 01674 g011
Figure 12. Policy related to ADA and urbanization.
Land 12 01674 g012
Figure 13. The relationship between ADA and POLY.
Land 12 01674 g013
Table 1. Variable definition and statistical description.
VariablesMeanStd. DevMin.Max.
POLY (-)0.51990.12890.00930.9574
ADA (-)0.22630.41850.00001.0000
GDP (1010 CNY)0.06810.03730.00410.4393
ROAD (102 km2)0.13640.09180.01171.0837
AREA (104 km2)0.27070.32240.00974.3263
HOUSE (1011 CNY)0.27390.55010.00074.2363
FINANCE (108 CNY)0.03440.06850.00090.8351
Note: CNY denotes the Chinese yuan.
Table 2. The global Moran’s I index of POLY from 2013 to 2018.
YearMoran’s IMeanStandard Deviationp Value
20130.185−0.00200.04120.001 ***
20140.231−0.00220.04080.001 ***
20150.223−0.00220.04030.001 ***
20160.223−0.00250.04060.001 ***
20170.183−0.00220.04010.001 ***
20180.182−0.00220.04030.001 ***
Note: *** reflect the significance of 1%.
Table 3. The calculation results of the OLS model.
VariablesCoefficientStandard DeviationT Valuep Value
ADA0.0332 ***0.00734.530.000
GDP−0.0261 ***0.0066−3.920.000
ROAD0.0155 **0.00762.040.042
AREA0.0233 ***0.00872.670.008
HOUSE0.0096 **0.00412.320.021
FINANCE0.0071 *0.00431.660.096
Constant0.3461 ***0.06974.970.000
R20.1464
Adjusted R20.1433
RSS23.3284
AICc−2316.1072
Note: ***, ** and *, respectively, reflect the significance of 1%, 5%, and 10%.
Table 4. The calculation results of the GTWR model.
VariablesMeanMax.MedianMin.
ADA0.02650.12160.0260−0.0474
GDP−0.02310.1150−0.0155−0.1444
ROAD0.00740.18460.0091−0.2030
AREA0.03550.10410.0366−0.1075
HOUSE0.00780.03840.0079−0.0856
FINANCE0.00420.06540.0038−0.0589
Constant0.38152.02240.3111−0.3468
R20.3619
Adjusted R20.3596
RSS17.4498
AICc−2605.2158
Disclaimer/Publisher’s Note: The statements, opinions and data contained in all publications are solely those of the individual author(s) and contributor(s) and not of MDPI and/or the editor(s). MDPI and/or the editor(s) disclaim responsibility for any injury to people or property resulting from any ideas, methods, instructions or products referred to in the content.

