Abstract
Wind erosion is a worldwide phenomenon for which several recent studies have shown that the intensity is expected to evolve because of climate and land use changes. Identifying the areas where wind erosion is the most active and its associated drivers may help to define efficient solutions to protect the environment from this hazard. The south of Tunisia is a region highly prone to wind erosion and presents a variety of landscapes and land uses in a relatively small area. Thus, from November 2012 to June 2016, six sites were instrumented to monitor wind erosion in the most extended land uses existing in southern Tunisia. The main results are that wind erosion: (i) is nil in the oasis, (ii) is weak (<120 kg m−1 yr−1) in the olive grove even if the surface is be ploughed up to eight times a year, (iii) is moderate (~1000 kg m−1 yr−1) in the barley field, for which the sowing date is a driving parameter of wind erosion seasonality, (iv) can occur in the Chott El Jerid except when it is flooded, (v) is the most intense in rangelands on sand (~2500 kg m−1 yr−1) and on flatbeds (>3000 kg m−1 yr−1).
1. Introduction
Wind erosion is the entrainment of soil particles by wind. It occurs when the energy transmitted by the wind to the soil surface is sufficient to counterbalance the forces that maintain soil particles on the surface, namely their weight and the interparticle cohesive forces, and in addition, when the soil surface is wet, capillarity forces [1]. It is a natural phenomenon that mainly takes place in the Earth’s arid and semi-arid areas [2], and depends on meteorology (mainly wind speed and rainfall) and soil surface characteristics (texture, soil size distribution, roughness, vegetation cover, etc.) [3]. Recent regional studies suggest that dust storms consecutive to wind erosion have been intensified by the effects of climate change (in the Middle East [4] or in Inner Mongolia [5], for instance), and by land surface changes due to anthropogenic factors [6]. In the agricultural sector, dust storms and wind erosion were identified as one of the emerging consequences of climate change [7,8].
Several field experiments quantified on an annual basis how much wind erosion intensity varies depending on the surface land cover. In southwestern Niger, Rajot [9] and Abdourhamane Touré et al. [10] showed that wind erosion fluxes were systematically higher in a millet field than in a fallow. From May 2012 to May 2016, Abdourhamane Touré et al. [11] conducted the same type of measurements in rangeland, a millet field, and a mobile dune in southeastern Niger. They drew similar conclusions: annual wind erosion fluxes measured in the millet field were systematically higher than those measured in the rangeland while wind erosion was two and forty times higher on the mobile dune than on the millet field and on the rangeland, respectively. In northern China, Zhang and Dong [12] showed that sediment transport by wind differed among surfaces, with the greatest transport being observed above mobile dunes, followed by cultivated land, semi-fixed dunes, fixed dunes, and a shrub community. From these field experiments, it can be concluded that wind erosion strongly depends on surface land cover and land use. However, these experiments only cover a restricted panel of land units. Conducting similar experiments in other regions of the world in order to identify the areas where wind erosion is the most active and its associated drivers (meteorology, land use, land management, etc.) may help to define efficient solutions to limit the effects of this hazard on the environment and consequently on the human way of life.
The south of Tunisia (Figure 1) is a region highly prone to wind erosion because the soils have a fine sand texture, vegetation is sparse, and precipitation is scarce [13,14,15]. The region also presents a variety of landscapes and land uses that can be experienced over a relatively limited area. Based on the analysis of the agricultural map developed in 2004 for the whole country at the scale of each CRDA (Commissariat Régional au Développement Agricole/regional commissions for agricultural development) by the Tunisian Ministry of Agriculture, Labiadh et al. [14] showed that five types of cultivation and six types of rangelands can be encountered in the four southernmost Tunisian Governorates (Tataouine, Medenine, Kebili, and Gabes; ~77,676 km2). This region thus offers the opportunity to study wind erosion intensity on different types of land surface, but also on different types of land use. Thus, from November 2012 to June 2016, six sites representing the most abundant land units of southern Tunisia were instrumented to monitor wind erosion and to investigate the possible differences in wind erosion fluxes according to land use and landscape. The aim of this study was to document wind erosion intensity as a function of land units to determine the most vulnerable areas to this phenomenon and propose, when feasible, solution(s) to mitigate its occurrence.
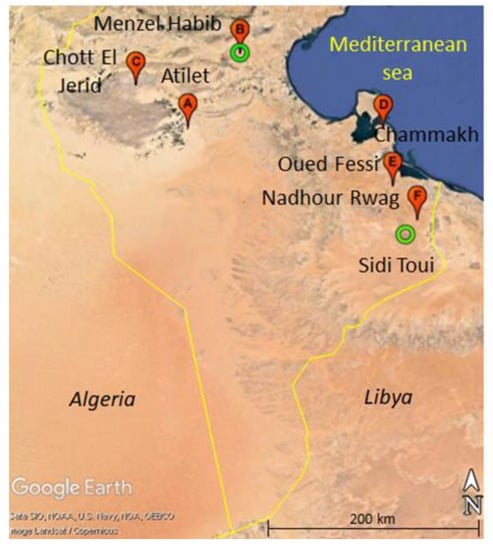
Figure 1.
Google Earth Image of southern Tunisia. Red pins locate the measurement sites of wind erosion fluxes and green circles the sites where a meteorological station was installed.
2. Materials and Methods
2.1. Methodology
According to the agricultural map developed by the Tunisian Ministry of Agriculture in 2004, 11 land use types can be encountered in southern Tunisia (Table 1). The dominant land use in southern Tunisia is rangeland (~87%) (Table 1). Among rangelands, rangeland on sand and rangeland on flatbeds are the vastest areas as they cover ~36% and 25% of south Tunisia, respectively (Table 1). Cultivated areas (including croplands, olive groves, tree-growing, market gardening, and oases) only represent ~5% of the domain. This equates to an area quite similar to that covered by the sebkhas and Chotts (~7%), which are encrusted salty depressions that can be seasonally flooded (Table 1). Among cultivated areas, olive groves, cereal fields, and oases cover the largest areas with 3.73%, 0.77%, and 0.39%, respectively (Table 1). Thus, we chose to instrument six of the most abundant land units of southern Tunisia (rangeland on sand, rangeland on a flatbed, Chott, olive grove, cereal field, and oasis). In the following sections, the main characteristics of each sampling site are presented (Section 2.2) as well as the method and instrumentation used to measure and analyse wind erosion fluxes (Section 2.3, Section 2.4, Section 2.5, Section 2.6).

Table 1.
Occupation (in %) of the different land uses in southern Tunisia (defined as the four southernmost Governorates, i.e., Tataouine, Medenine, Kebili, and Gabes) (after Labiadh et al. [14]).
2.2. Description of the Measurement Sites
Six sites were instrumented to monitor wind erosion in the most extended land uses existing in southern Tunisia. One of them (Menzel Habib) and an additional site (Sidi Toui) were equipped with a meteorological station. The location and land use characteristics of the seven sites are given in Figure 1 and Table 2.
Table 2.
Land use, geographical coordinates, and location of the measurement sites.
2.2.1. Rangeland on Sand
Nadhour Rwag (Figure 2a) is located in the plain of El Ouara in the Governorate of Medenine. The steppe vegetation is mainly composed of Rhanterium suaveolens and Anabasis articulata.
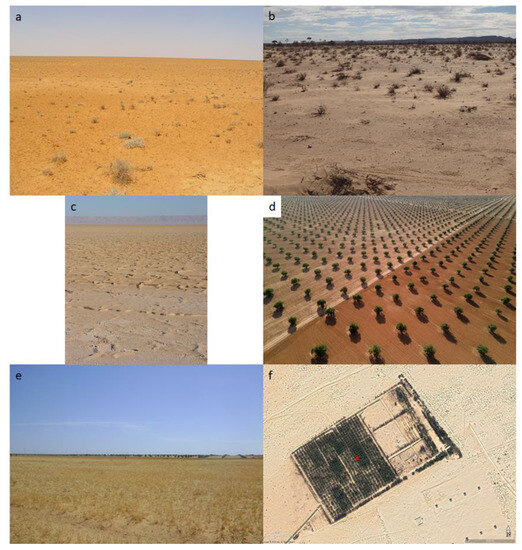
Figure 2.
(a) Photograph of the Nadhour Rwag landscape; (b) Photograph of the Menzel Habib landscape; (c) Photograph of the Chott El Jerid landscape (dry period); (d) Aerial photograph of one of the Chammakh olive groves [©IRD-IRA, Christian Lamontagne]; (e) Photograph of the barley field in the Oued Fessi just before harvest on 5 May 2014; (f) Google Earth Image (01/2013) of the experimental oasis of Atilet in Kébili (the red dot locates the position of the measurement device).
2.2.2. Rangeland on a Flatbed
The measurement site on the rangeland on a flatbed was installed inside the ROSELT/OSS (Réseau d’Observatoires de Surveillance Ecologique à Long-Terme/Observatoire du Sahara et du Sahel) Observatory of Menzel Habib (80,000 ha), located in the Tunisian arid region (34°02′ N to 34°19′ N and 9°33′ E to 9°58′ E). Our measurement site (Figure 2b) was located in an area of Rhanterium suaveolens steppes on sandy soils, which is the dominant vegetation in the Observatory [16].
2.2.3. Chott El Jerid
The Chott El Jerid (Figure 2c) is a closed ephemeral salty lake located in a large depressed basin [17]. It is located on both sides of the Tunisia/Algeria border. It is bordered to the north by the Cherb Mountains and to the south by the Sahara, and it is linked to the Chott Fjej to the east. With a surface of 5360 km2 [18], the Chott El Jerid is one of the largest endorheic basins in the world and the largest ephemeral salty lake in northern Africa. It is regularly flooded during the cold period. During the dry period, from May to August, it is generally covered by continental evaporites (mainly composed of halites and gypsum), which result from the desiccation of the soil after a flooding event [19]. It was identified by Prospero et al. [2] using satellite observations as a major source of mineral dust in northern Africa.
2.2.4. Olive Grove
Chammakh is one of the largest olive-growing regions in Tunisia with more than 80,000 olive trees [20]. Inside this orchard, the “Chemlali of Sfax” variety is dominant. In this region, olive trees, which are 3 to 4 m high, are evenly spaced in a square pattern with each tree 24 m apart (Figure 2d). The soil surface is regularly (up to 8 times a year) ploughed with a tiller plough in order to remove grasses to aerate the soil and to favour water penetration through the destruction of the superficial crust that forms after each rain event. Olive harvesting is done during wintertime (December to February), followed by pruning in March.
2.2.5. Cereal Field
The site called Oued Fessi is located in the Jeffara plain in the Governorate of Medenine. In southern Tunisia, barley (Hordeum vulgare L., cultivar Ardhaoui—a unique cultivar of southern Tunisia [21]) is a rainfed crop that is sown on the fly according to rainfall: barley is sown only when soil moisture is sufficiently high to ensure the correct growth of the cereal. The field is tilled with a disc plough immediately after sowing. Barley is ready to be harvested about 4 months after it was sown. Harvesting is performed manually: barley tufts are removed by hand to collect at the same time seeds, roots, and straws, the latest being used as fodder for sheep. Consequently, the field soil surface is left bare and trampled after harvest [22]. In the present study, barley was sown on the fly before the field was tilled with a disc plough on 31 December 2013. Harvesting was performed manually from 5 to 7 May 2014 (Figure 2e). Barley was not sown again in autumn 2014/winter 2015.
2.2.6. Oasis
Atilet (Figure 2f) is an experimental oasis on about 15 ha of the IRA (Institut des Régions Arides) Kébili station. It is located in the region of the Nefzaoua to the southeastern edge of the Chott El Jerid. In 1989, about 950 palm trees (Deglet Nour variety) were planted on 9 ha of the Atilet experimental site according to several organizations to determine the configuration and water supply that provide the best yield [23]. Consequently, the palm trees are evenly spaced in a square pattern with each tree being either 12 m, 10 m, or 8 m apart. Later on, in some squares, some fruit trees (pomegranate and fig trees) were planted in order to test the best association.
2.3. Characterization of Superficial Soil Properties
For each site, a composite sample made of 15 individual samples of the upper 5 cm soil surface was collected and analysed to determine the texture and the dry soil size distribution. For Chott El Jerid, we used the measurements of Labiadh et al. ([14]; the site called Kébili 10).
Texture was determined using Robinson’s pipette method [24].
The dry soil size distribution was determined following the methodology established by Chatenet et al. [25], and using the same system as the one described in Labiadh et al. [14]: the samples were dried at 105 °C for 24 h before being slowly sieved on a column of 13 sieves (For Nadhour Rwag, Menzel Habib, Chammakh, and Oued Fessi, the column of 13 sieves was: <50, 50–63, 63–100, 100–125, 125–160, 160–250, 250–350, 350–500, 500–630, 630–1000, 1000–1250, 1250–2000, >2000 μm. For Chott El Jerid and Atilet, the column of 13 sieves was: <50, 50–75, 75–100, 100–125, 125–150, 150–200, 200–300, 300–400, 400–500, 500–600, 600–800, 800–1000, >1000 μm) using a vibratory sieve shaker (Retsch, AS200). Sieving lasted 20 min with an intensity of 40, and each fraction was then weighed on an electronic balance with a precision of 0.0001 g. The results of the sieving were adjusted to log-normal distribution(s) using a least squares method as described in Labiadh et al. [14]. An example of such an adjustment is given in Figure 3 for a monomodal (top) and a bimodal (bottom) size distribution.
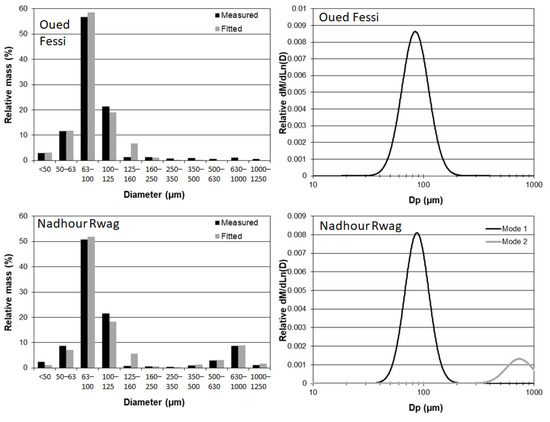
Figure 3.
Comparison of the result of the fitting of log-normal distribution(s) to the measured relative mass by size class (left) and the resulting continuous size distribution (right). Top: Example of monomodal size distribution (Oued Fessi). Bottom: Example of bimodal size distribution (Nadhour Rwag).
2.4. Measurement of the Sediment Horizontal Mass Flux
Horizontal flux (Fh) is defined as the amount of sediment mass crossing a section of unit length perpendicular to the wind over the total duration of an erosive event. Several authors [26,27,28] showed that the equations of the exponential form originally proposed by Williams [29] (Equation (1)) give the best representation of the vertical distribution of mass flux density, q(z), from the soil surface to the average maximum saltation height.
with q0 being the value of q at z = 0 m and B being a positive empirical constant.
Therefore, the horizontal flux can be computed by vertically integrating the mass flux density in a layer extending up to a height of 50 cm [30], using Equation (2):
The mass flux density was monitored using Big Spring Number Eight (BSNE) sand traps [31] mounted on a mast equipped with a wind vane, which ensures that the opening of all BSNEs always faced the wind (Figure 4). The highest BSNE sand traps on the mast had an opening of ~10 cm2, while the lowest one had a smaller opening (2 cm2) to prevent the sampler from overloading as the flux is the highest close to the soil surface. The position of the mast was chosen to ensure that the fetch was maximum to avoid any disturbance from the surrounding areas with a different land unit [32].
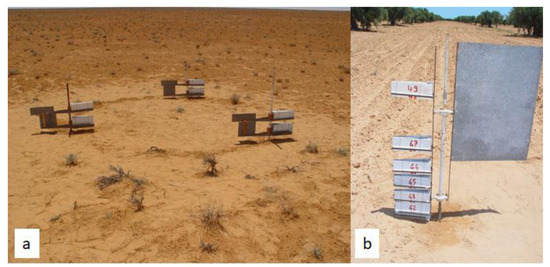
Figure 4.
BSNE masts installed in (a) Nadhour Rwag, and (b) Chammakh.
The mass flux density q(z) (with z as the height of the centre of the sand trap opening) was determined for each BSNE by dividing the collected mass of sediment, M(z), by the surface of the opening s(z):
The efficiency of the different sand traps has been discussed thoroughly in the literature. Goossens et al. [33] estimated the efficiency of the BSNE sand trap to be close to 100% based on wind tunnel and field measurements. However, the efficiency may depend on the soil size distribution and the wind speed [34,35]. For aeolian sand, Shao et al. [36] found the overall efficiency of the BSNE sand traps to be 90 ± 5% in the wind tunnel. Based on these results, we consider that the BSNE efficiency is higher than 90% for the Tunisian sandy soils (see Table 3), and the value of 100% obtained by Goossens et al. [33] was assumed in Equation (3).
Table 3.
Texture of the soil surface of some of the measurement sites. * For the Chott El Jerid, results correspond to site Kébili 10 of Labiadh et al. [14].
BSNE sand traps were collected once a month except from March to May, which is the period during which wind erosion is the most active in southern Tunisia [13], when they were collected twice a month (Figure A1 in Appendix A). Each sample was weighed on an electronic balance with a precision of 0.01 g.
One mast of the 7 BSNE sand traps was installed on each site except in Nadhour Rwag (Figure 4a), where 3 masts of 3 BSNE sand traps were installed to account for the variability in wind erosion. In Chammakh (Figure 4b), the mast of 7 BSNE sand traps was installed at the centre of a square delimited by olive trees.
2.5. Procedure of the Statistical Analysis of the Horizontal Fluxes of Aeolian Sediments
Analysis of variance (ANOVA) [37] is a powerful and easy method to determine whether several groups of data can be considered statistically identical. In our case, it was used to show whether a horizontal mass flux of aeolian sediments (Fh) from one site is different from another. However, ANOVA may yield inaccurate estimates of the probability value when each group of data is far from being normally distributed. To satisfy the normality conditions, we normalized these data by using a log conversion. ANOVA also requires homoscedasticity, i.e., homogeneity of variances. Thus we first checked the normality of our data (sediment flux collected for each site over the whole period of sampling; samples for which the measured sediment fluxes were zero were discarded) by using the Shapiro–Wilk test because our data set includes less than 50 values per site [38]. We controlled the homogeneity of variances by using Levene’s test, a test less sensitive than others to departures from normality [39]. When the conditions of normality and homogeneity of variances were fulfilled for these data, a t-Student test was used to identify the groups of samples that can be considered different from a statistical point of view. This ANOVA was performed using R software (version 4.1.1).
2.6. Meteorological Measurements
We decided to instrument the two stations that were the most far apart (i.e., Nadhour Rwag and Menzel Habib) with a meteorological station. However, it was not possible to install a meteorological station at Nadhour Rwag for security reasons. Therefore, we instrumented the Sidi Toui site, some ten kilometres away from Nadhour Rwag. Wind speed and direction were measured using a two-dimensional (2D) sonic anemometer (WindSonicTM Gill Instruments Ltd.) installed at 3 m above ground level (AGL). Data acquisition was performed using a CR200X data logger (Campbell® Scientific Instruments, Shepshed, Loughborough, UK) powered by a solar panel, with a nominal data acquisition time of 5 min for all the parameters measured with a frequency of 0.1 Hz. Considering the high variability of both wind speed and direction over a 5 min time step, the maximum and mean values of wind speed and the mean and standard deviation of wind direction measured over this interval were recorded. Rainfall was measured using an ARG100 Tipping Bucket rain gauge (Campbell® Scientific company) installed at 1.5 m AGL with a 5 min time step. The 5 min rainfall corresponds to the accumulation of bucket tippings over this time interval with one tipping corresponding to 0.2 mm of rainfall.
2.7. Computation of the Dust Uplift Potential
It is classically admitted that the wind erosion flux can be estimated using a power law of the wind friction velocity when it exceeds the wind erosion threshold [40,41]. In order to isolate the specific role of the wind from that of the surface properties in the variability of aeolian fluxes, Marsham et al. [42] proposed to compute a diagnostic parameter, the Dust Uplift Potential (DUP):
where U(z) is the wind speed (in m s−1) at height z (in m) and Ut(z) is the minimum threshold wind speed (in m s−1) above which wind erosion can occur.
The DUP allows for the calculation of the maximum wind erosion that could be produced for a given wind speed for ideally a totally smooth erodible surface. Therefore, in Equation (4), Ut(z) is the minimum Ut(z) corresponding to the smooth bare surfaces of southern Tunisia. In the Dust Production Model developed by Marticorena and Bergametti [43] for northern Africa, the minimum Ut at 10 m AGL over southern Tunisia was close to 7 m s−1 at 10 m AGL [44]. In the study in Menzel Habib and Sidi Toui, wind speed was measured at 3 m AGL (see Section 2.5). Considering that the wind profile follows the logarithmic law of Priestley [45], a minimum Ut at 3 m AGL can be computed knowing the aerodynamic roughness length, z0, of the site. In March 2000, Marticorena et al. [46] performed an intensive field campaign in southern Tunisia to measure this parameter over 10 sites with different surface roughness. Among these sites, site S10 (Bir Zoui) shares the same surface characteristics as the Menzel Habib and Nadhour Rwag sites. Consequently, we used the value of z0 = 1.73 × 10⁻³ m measured in near-neutral conditions in Bir Zoui to compute Ut at 3 m AGL in Menzel Habib and Nadhour Rwag, which leads to a value of 6 m s−1. In order to account for the uncertainty that may exist in z0, DUP was also computed using 5 and 7 m s−1 for Ut(z) at both sites.
3. Results and Discussion
3.1. Soil Surface Properties
Whatever the location, the soil surface has a sandy texture, with %sand being at least equal to 80% (Table 3). The two crusted soils (Menzel Habib and the Chott El Jerid) present a higher clay content than in other sites where no crust was observed at the soil surface. For the size distribution of loose aggregates at the soil surface, a fine population with a mode centred around 90 µm and very well sorted (with a standard deviation, σ, ranging between 1.20 and 1.30) is systematically observed as the dominant population whatever the considered site (Table 4), except in the Chott El Jerid for which the median diameter is larger (130 µm) and the unique population exhibits a larger scattering (σ = 1.85). The ever-present fine population observed in our study sites is in agreement with the results obtained by Labiadh et al. [14], who also observed such a mode in 179 out of 180 soil samples collected throughout southern Tunisia. The quasi-ubiquitous presence of this mode explains the high susceptibility of south Tunisian soils to wind erosion as a diameter equal to 90 µm is close to the optimum soil grain diameter for wind erosion (see for instance Iversen et al. [47]). This suggests that the differences that would be observed in the annual flux of aeolian sediments among the different sites would not be explained by the slight differences observed in soil surface characteristics, except for the Chott El Jerid. In Chammakh and Atilet, a second mode is observed at 135 µm and at 450 µm, respectively, which is also in agreement with the results obtained by Labiadh et al. [14]. Finally, in Nadhour Rwag, a second mode (15.8%) is also observed around 750 µm. It is explained by its proximity to the Dahars mountains, from which coarse sand can be transported by water erosion [14].
Table 4.
Median diameter (Dmed in µm), standard deviation (σ), and percentage of the population(s) composing the dry size distribution of the surface soil samples of the measurement sites. The values given in parenthesis correspond to the standard deviation associated with each parameter. * For the Chott El Herid, results correspond to site Kébili 10 of Labiadh et al. [14].
3.2. Meteorological Parameters
Figure 5 presents the monthly DUP computed for Menzel Habib and Nadhour Rwag. In both sites, a similar trend is observed even though the DUP is higher in Nadhour Rwag than in Menzel Habib. This is especially marked during wintertime (December, January, and February), when the DUP is the highest at both sites. The lowest DUP values were computed in summer and the beginning of autumn (July, August, September, and October) in Menzel Habib.
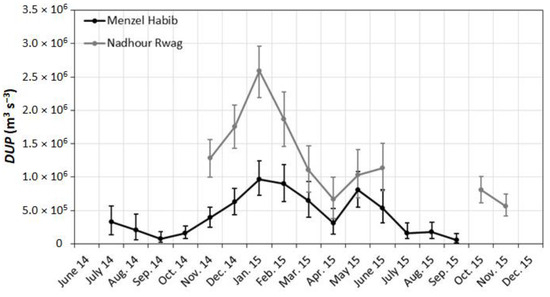
Figure 5.
Monthly accumulated DUP (in m3 s−3) computed for Menzel Habib (black line) and Nadhour Rwag (grey line). Error bars correspond to DUP computed using Ut(z) = 5 and 7 m s−1. DUP was reported only if the monthly recovery rate of meteorological measurements was >90% (see Table A1 in Appendix A).
When assessing aeolian transport in Menzel Habib, Khatelli and Gabriels [13] showed that a prevailing wind direction of erosive winds (defined as wind speed > 3 m s−1 at 1.5 m height by these authors) existed: on an annual basis, winds from the north to the southeast were more erosive than those coming from the south and from the west. Figure 6 presents the annual wind rose for Menzel Habib, and shows that the erosive winds were dominantly from the northeast to the east–south–east in agreement with Khatelli and Gabriels [13].
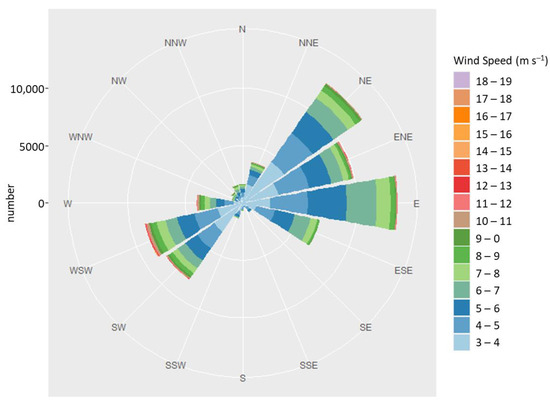
Figure 6.
Wind rose of the wind speed > 3 m s−1 measured in Menzel Habib from 24 June 2014 to 13 October 2015 at 3 m AGL by the 2D sonic anemometer at a 5 min time step.
Rainfall in Menzel Habib and in Sidi Toui were 143.8 mm (from June 2014 to October 2015) and 150.4 mm (from October 2014 to December 2015), respectively. At both sites, rain was the most abundant in autumn and in winter (Figure 7).
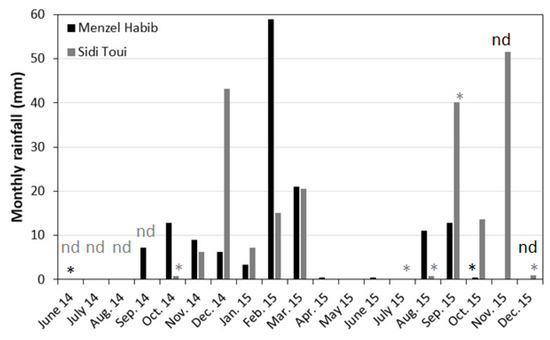
Figure 7.
Rainfall measured in Menzel Habib from 24/06/2014 to 13/10/2015 and in Sidi Toui from 14/10/2014 to 22/12/2015. “nd” stands for “no data”; the asterisk (*) highlights the months for which the monthly recovery rate of meteorological measurements was <90% (see Table A1 in Appendix A).
3.3. Statistical Analysis of the Horizontal Fluxes of Aeolian Sediments
Table 5 presents the results of the Shapiro–Wilk test for all sites where measurements of horizontal fluxes of aeolian sediments were conducted, except Atilet (for which all values are equal to zero; see Section 3.4), after values had been normalized. It can be seen that p-values are significant for all sites (p > 0.05), except Chammakh even though the QQ-plot seems quite satisfying (Figure A2d).
Table 5.
Result of the Shapiro–Wilk test for all measurement sites except Atilet (for which all values are equal to zero).
Levene’s test gives a value of p = 0.005591, which is significant (p < 0.05) and means that variances are homogeneous. Finally, Table 6 presents the results of the t-student test by pairs of sites. It can be seen that most sites are statistically independent except Nadhour Rwag and Oued Fessi. Consequently, a direct comparison between these two sites should be avoided. Considering Nadhour Rwag and Oued Fessi, the absence of a statistically significant difference in their averages could be explained by their very sandy textures (~95%—see Table 3).
Table 6.
Result of the t-Student tests. n1 and n2 are the number of values used for site 1 and site 2, respectively. “ns” stands for “not significant”. “*” and “****” means that p < 0.05 and p < 0.0001, respectively.
3.4. Annual Horizontal Fluxes of Aeolian Sediments
For the oasis site, Atilet, annual horizontal fluxes were zero (Figure 8; Table 7). This is probably due to the density of palm trees and the effectiveness of their canopy in reducing wind speed and in protecting the surface.
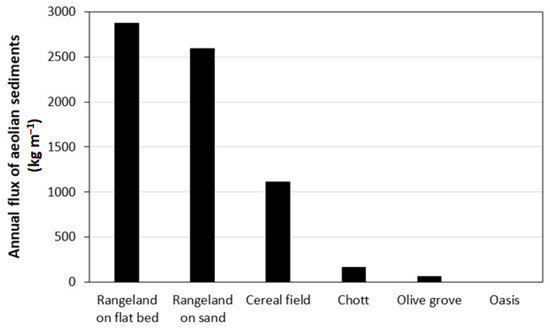
Figure 8.
Average annual horizontal flux of aeolian sediments (in kg m−1) measured on each type of land use.
Table 7.
Annual flux of aeolian sediments (in kg m−1) measured on each site.
The highest values were measured on rangelands, i.e., in Menzel Habib and Nadhour Rwag, where annual fluxes can reach more than 3000 kg m−1 (Table 7). These values are of the same order of magnitude as the annual horizontal fluxes measured for mobile dunes in northern China (1163 kg m−1) by Zhang and Dong [12] and in eastern Niger (from 2000 to 6000 kg m−1) by Abdourhamane Touré et al. [11]. By comparison, Abdourhamane Touré et al. [11] in eastern Niger measured annual aeolian fluxes on rangelands from 110 to 633 kg m−1. From 1999 to 2004, Bergametti and Gillette [48] measured wind erosion flux in the five dominant plant/soil complexes encountered in the Jornada Long Term Ecological Research (LTER) site (mesquite, creosote, tarbush, grama grass, and playa grass). These authors showed that only the annual horizontal flux of aeolian sediments measured in the mesquite area was significantly higher (up to more than 300 kg m−1 on average) than those measured in the other sites (less than 20 kg m−1 on average). This was explained by a specific organization of the vegetation in “mesquite streets” separated by bare soil streets that favours high wind erosion. The high values measured in south Tunisian rangelands, similar to those measured on bare soils in China and Niger, may be explained by the sparse vegetation of the sites (Figure 2a,b), which was randomly distributed and whose density is too low to offer effective protection to the soil from the wind.
In the Oued Fessi (barley field), annual horizontal fluxes are also high (1109 kg m−1 for 2014—Figure 8; Table 7). It is of the same order as the annual saltation flux measured on traditionally cultivated millet fields by different authors using the same sand traps. In western Niger, from 1996 to 1998, Rajot [9] measured an annual saltation flux of 209 to 601 kg m−1, and Abdourhamane Touré et al. [49] measured an annual saltation flux of 137 to 320 kg m−1 from 2006 to 2008. More recently, in western Niger, Abdourhamane Touré et al. [11] measured an annual saltation flux of 368 to 2902 kg m−1 from 2012 to 2016.
In Chammakh (olive grove), annual horizontal fluxes are lower (from 29 to 120 kg m−1 in 2014–2015 and in 2013–2014, respectively; Table 7), which may be explained by the presence of olive trees which significantly reduces the shear stress at the surface [50]. This is the same mechanism as in the oasis, but as olive trees are taller and the space between them is larger, the reduction of shear stress at the surface is lower than in the oasis. An important inter-annual variation is observed in the Chott El Jerid (from 5 to 333 kg m−1 in 2013–2014 and in 2014–2015, respectively; Table 7). This can be explained by the number of months during which it is flooded: in 2015, the Chott El Jerid was flooded for 5 months whereas it was only flooded for 3 months in 2014 (see Figure A1 in Appendix A).
3.5. Seasonal Variations in Wind Erosion
As recalled in the introduction, wind erosion is driven by meteorology and soil surface characteristics. When the latter is constant with time, wind speed will be the main driver of wind erosion seasonality. In regions where rainfall induces important modifications of the soil surface (such as flooding, development of seasonal vegetation, etc.), wind erosion will not only depend on wind speed but also on the state of the soil surface (wetness, vegetation cover rate, roughness, etc.). Finally, in areas where agricultural activities develop, the influence of human practices (such as tillage/no tillage, leaving/collecting crop residues in the field after harvest, etc.) will also play a non-negligible role. For example, using a modelling approach, Pierre et al. [51] showed that in southwestern Niger, the variability of annual horizontal fluxes induced by agricultural practices could be of the same order as the variability induced by meteorological factors (wind speed, precipitation).
Figure 9 presents a comparison of the seasonal variations of horizontal fluxes in all sites except Atilet. A total of 69% of wind erosion occurred in winter (December–January–February) and spring (March–April–May) in the rangeland on a flatbed while 90% of the annual horizontal flux of wind-eroded sediments was measured during autumn and winter (September to February) in the rangeland on sand.
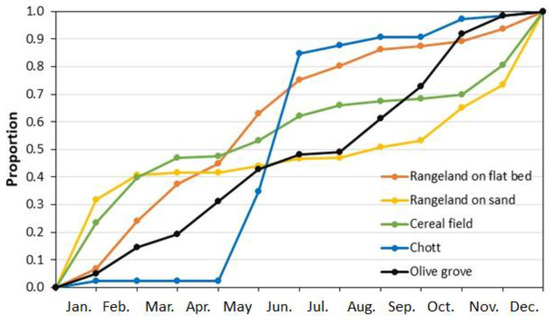
Figure 9.
Normalised accumulated horizontal flux of wind-eroded particles for the sites of Menzel Habib (orange line—rangeland on a flatbed), Nadhour Rwag (yellow line—rangeland on sand), Oued Fessi (green line—cereal field), Chott El Jerid (blue line), and Chammakh (black line—olive grove).
Figure 10 compares the DUP computed for Menzel Habib, accounting for the impact of precipitation or not, and the wind erosion flux measured on this site. It can be seen that the seasonal evolution of the DUP is similar to the seasonal evolution of the wind erosion flux with little impact of precipitation on the general trend of the DUP, which means that the seasonal evolution of wind erosion is mainly driven by wind speed on the rangeland on a flatbed.
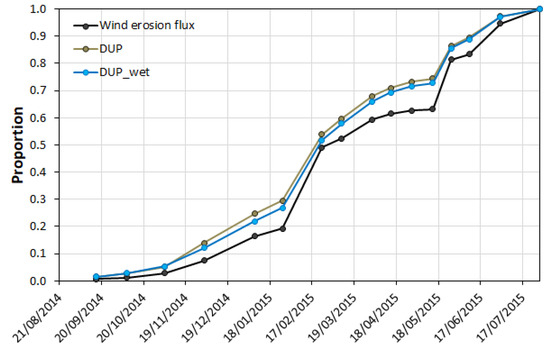
Figure 10.
Normalised accumulated horizontal flux of wind-eroded sediments (black line) and corresponding DUP, accounting for precipitation impact (blue line) or not (brown line), for the site of Menzel Habib (rangeland on a flatbed) from 21 August 2014 to 29 July 2015 (comparison was done only when the monthly recovery rate of meteorological measurements was 100%; see Table A1 in Appendix A).
In the Chott El Jerid, about 90% of wind erosion occurred in late spring/early summer, i.e., when the Chott surface has dried. This suggests, as expected, that this source is clearly a seasonal source, emitting only after the rainy season and mainly in May and June (Figure 9).
In Chammakh (olive grove), horizontal fluxes of wind-eroded sediments were low. Wind erosion mostly occurred in spring (40%) and during late summer and autumn (40%). This seasonality can be explained by the high wind speed occurring in spring in this region, and by the olive harvest that is conducted from the end of autumn which disturbs the soil surface.
In the oued Fessi (barley field), 59% of wind erosion occurred in winter (Figure 9). This seasonality is different from that observed by Bouet et al. [22] in a barley field located in Dar Dhaoui (which is about 30 km northwest of the oued Fessi), where wind erosion only occurred between mid-May and mid-November. These authors showed that the seasonality of wind erosion depended on several factors. In particular, when barley grows, it reaches intermediate heights, which produces a roughness of the order of cm. The soil surface is then well-protected from wind erosion by the vegetation, and wind erosion fluxes remain almost nil. In the oued Fessi, barley was sown on 31 December 2013. Consequently, barley height was at its maximum by the end of March 2014, which corresponds to the minimum measured horizontal flux (Figure 11). In Dar Dhaoui, barley was sown two months earlier (on 21 October 2015), so barley height was at its maximum in mid-February, offering effective protection to the soil surface during winter. This result confirms that agricultural practices (in the present case, the date of sowing) can have a considerable impact on the intensity of wind erosion in croplands.
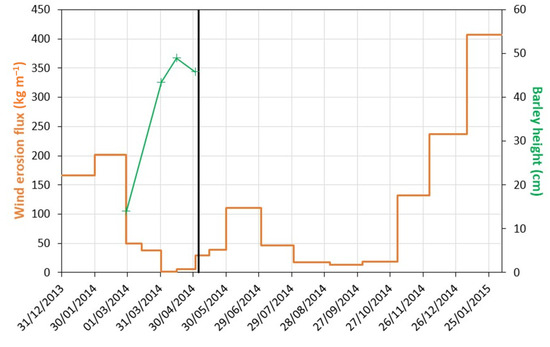
Figure 11.
Horizontal flux of wind-eroded sediments (in kg m−1—orange line; left scale) and barley height (in cm—green line; right scale) measured from 31 December 2013 (sowing date) to 6 February 2014 in the oued Fessi. Vertical black line recalls the beginning of harvest (from 5 to 7 May 2014). Barley was not sown again in autumn 2014/winter 2015.
4. Conclusions
Wind erosion was measured in southern Tunisia on six sites representing different types of land use and landscapes from November 2012 to June 2016. The aim of this study was to document wind erosion intensity as a function of land units to determine the most vulnerable areas to this phenomenon and propose, when feasible, solution(s) to mitigate its occurrence. The results showed that the horizontal flux of wind-eroded sediments was different according to land use and landscape:
- In olive groves and oases, the ever-present vegetation (composed of trees) protected the soil from wind erosion by minimizing the shear stress acting on the surface. Thus, fluxes of wind-eroded sediments were low to nil, respectively;
- Wind erosion was the highest in the rangelands because the Steppic vegetation encountered in these south Tunisian landscapes is sparse and the density of the small bushes of Rhanterium suaveolens and Anabasis articulata was too low to offer effective protection from the wind. Consequently, the seasonality of wind erosion in the rangelands is mainly driven by the seasonality of the wind speed;
- In the Chott El Jerid, wind erosion was intermittent and occurred during late spring/early summer at the beginning of the dry period;
- In the barley field, the date of sowing was shown to be a crucial parameter to control the seasonality of wind erosion.
The differences observed between sites were explained by the difference in land cover and land use as well as agricultural practices for cultivated areas. In the Sahel, Rajot [9] and Abdourhamane Touré et al. [10,11] showed that wind erosion was systematically higher in millet fields than in fallows. In southern Tunisia, the reverse is observed: wind erosion is lower in the barley field than in the rangelands. In both cases, this can be explained only if the seasonality of both wind speed and vegetation is taken into account. Indeed, in the Sahel, wind speed is the highest when vegetation cover is the lowest in the fields [52], while in southern Tunisia barley is at its maximum development when the wind speed is at its highest.
If we assume that the results presented in Figure 8 are representative of the wind erosion that occurs on each studied land use, we can roughly estimate the annual sediment flux for each type of land use at the scale of southern Tunisia by multiplying the fluxes measured on each surface by the area they occupy. In southern Tunisia, fluxes of wind-eroded sediments are mostly from rangelands on sand and on flatbeds (938 kg m−1 yr−1, and 710 kg m−1 yr−1, respectively—Table 8). Even if they cover a large area of the studied domain, especially compared to croplands (olive groves occupy about five times more area than croplands), fluxes of wind-eroded sediments from olive groves are lower than those from croplands (2 kg m−1 yr−1, and 9 kg m−1 yr−1, respectively—Table 8). This result highlights that particular attention must be paid to croplands, and that agricultural practices that limit wind erosion (e.g., using a mouldboard plough instead of a disc plough [20], leaving crop residues in the field after harvest [49,53,54]) must be encouraged. The Chott can be an active dust source but does not seem to be the major one in the area during the period of measurement, contrary to the observations reported by Prospero et al. [2].
Table 8.
Annual flux of aeolian sediments (in kg m−1 yr−1) estimated by land use at the scale of southern Tunisia.
The results obtained in this study confirm that wind erosion varies not only because of meteorology, but also according to land use and land management. In agricultural areas, wind erosion is a threat to sustainable agriculture: plant nutrients are transported in windblown sediments [55]. Consequently, documenting wind erosion in other regions must be carried on with the systematic documentation of land management (crops vs. grazing vs. fallows) and land use practices (tillage techniques, grazing practices, etc.). This will help develop strategies to limit worse effects on the environment.
Author Contributions
Conceptualization, M.T.L., J.L.R., G.B. and C.B.; Data curation, S.S., M.L., A.T., B.A., M.H. and T.H.d.T.; Formal analysis, M.T.L., J.L.R., G.B. and C.B.; Funding acquisition, C.B.; Investigation, M.T.L., J.L.R., G.B. and C.B.; Project administration, M.T.L. and C.B.; Validation, G.B. and C.B.; Writing—original draft, M.T.L., J.L.R., G.B. and C.B. All authors have read and agreed to the published version of the manuscript.
Funding
This research was funded by the French INSU/LEFE (Institut National des Sciences de l’Univers/Les Enveloppes Fluides et l’Environnement) program, project “Quantification des émissions d’aérosols terrigènes en fonction de l’usage des sols: exemple du sud tunisien”.
Data Availability Statement
The data used in this manuscript [56] are available for download for research and educational purposes in DataSuds at https://doi.org/10.23708/AO2YFT (accessed on 16 July 2023).
Acknowledgments
The authors would like to thank Houcine Khatteli, Director of the Institut des Régions Arides (IRA), for the constant support of IRA in all research related to wind erosion. The authors also would like to thank the Office des Terres Domaniales (OTD) of Chammakh, and the Cellule Territoriale de Vulgarisation (CTV) of Menzel Habib who allowed the installation of the measurements in Chammakh and Menzel Habib, respectively. Wind rose (Figure 6) was made adapting the R program by Andy Clifton.
Conflicts of Interest
The authors declare no conflict of interest.
Notations and Abbreviations
| 2D | 2 dimensional |
| AGL | above ground level |
| ANOVA | Analysis of variance |
| B | a positive empirical constant in Equation 1 |
| BSNE | Big Spring Number Eight |
| CRDA | Commissariat Régional au Développement Agricole (regional commissions for agricultural development) |
| DUP | Dust Uplift Potential |
| Fh | horizontal mass flux of aeolian sediments |
| IRA | Institut des Régions Arides (Arid Regions Institute) |
| IRD | Institut de Recherche pour le Développement (French National Research Institute for Sustainable Development) |
| LTER | Long Term Ecological Research |
| M(z) | collected mass of sediment at height z |
| OSS | Observatoire du Sahara et du Sahel (Sahara and Sahel Observatory) |
| q(z) | mass flux density at height z |
| q0 | the value of q at z = 0 m |
| ROSELT | Réseau d’Observatoires de Surveillance Ecologique à Long-Terme (Long Term Ecological Surveillance Observatories Network) |
| s(z) | surface of the opening at height z |
| U(z) | wind speed at height z |
| Ut(z) | minimum threshold wind speed at height z above which wind erosion can occur |
| Z | measurement height |
| z0 | aerodynamic roughness length |
| Σ | standard deviation |
Appendix A

Figure A1.
Date of installation and BSNE uptakes for the 6 measurement sites. Bolded dates correspond to installation of the BSNE sand traps. The blue-coloured cells refer to the period during which the Chott was flooded (F).
Table A1.
Recovery rate (in %) of meteorological measurement in Menzel Habib and Sidi Toui.
Table A1.
Recovery rate (in %) of meteorological measurement in Menzel Habib and Sidi Toui.
| Month | Menzel Habib | Sidi Toui |
| June 2014 | 22% | - |
| July 2014 | 91% | - |
| August 2014 | 100% | - |
| September 2014 | 100% | - |
| October 2014 | 100% | 56% |
| November 2014 | 100% | 100% |
| December 2014 | 100% | 100% |
| January 2015 | 100% | 100% |
| February 2015 | 100% | 100% |
| March 2015 | 100% | 100% |
| April 2015 | 100% | 100% |
| May 2015 | 100% | 100% |
| June 2015 | 100% | 98% |
| July 2015 | 97% | 77% |
| August 2015 | 100% | 33% |
| September 2015 | 90% | 42% |
| October 2015 | 40% | 100% |
| November 2015 | - | 100% |
| December 2015 | - | 69% |
Appendix B
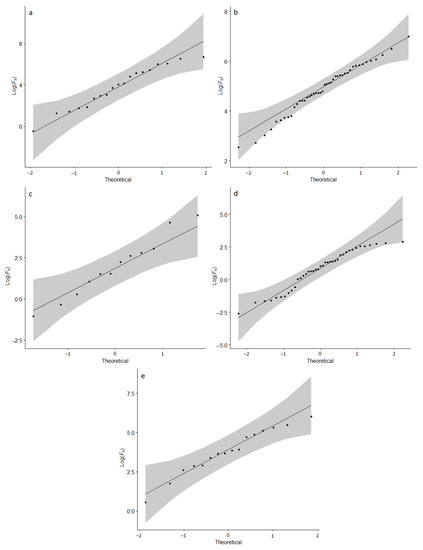
Figure A2.
QQ-plots for (a) Nadhour Rwag, (b) Menzel Habib, (c) Chott El Jerid, (d) Chammakh, and (e) Oued Fessi measurement sites.
References
- Fécan, F.; Marticorena, B.; Bergametti, G. Parametrization of the Increase of the Aeolian Erosion Threshold Wind Friction Velocity due to Soil Moisture for Arid and Semi-Arid Areas. Ann. Geophys. 1999, 17, 149–157. [Google Scholar] [CrossRef]
- Prospero, J.M.; Ginoux, P.; Torres, O.; Nicholson, S.E.; Gill, T.E. Environmental Characterization of Global Sources of Atmospheric Soil Dust Identified with the NIMBUS 7 Total Ozone Mapping Spectrometer (TOMS) Absorbing Aerosol Product. Rev. Geophys. 2002, 40, 2-1–2-31. [Google Scholar] [CrossRef]
- Bagnold, R.A. The Physics of Blown Sand and Desert Dunes; Methuen: London, UK, 1941. [Google Scholar]
- Parolari, A.J.; Li, D.; Bou-Zeid, E.; Katul, G.G.; Assouline, S. Climate, Not Conflict, Explains Extreme Middle East Dust Storm. Environ. Res. Lett. 2016, 11, 114013. [Google Scholar] [CrossRef]
- Zhang, H.; Fan, J.; Cao, W.; Harris, W.; Li, Y.; Chi, W.; Wang, S. Response of Wind Erosion Dynamics to Climate Change and Human Activity in Inner Mongolia, China during 1990 to 2015. Sci. Total Environ. 2018, 639, 1038–1050. [Google Scholar] [CrossRef] [PubMed]
- Chi, W.; Zhao, Y.; Kuang, W.; He, H. Impacts of Anthropogenic Land Use/Cover Changes on Soil Wind Erosion in China. Sci. Total Environ. 2019, 668, 204–215. [Google Scholar] [CrossRef] [PubMed]
- Mirzabaev, A.; Wu, J.; Evans, J.; García-Oliva, F.; Hussein, I.A.G.; Iqbal, M.H.; Kimutai, J.; Knowles, T.; Meza, F.; Nedjraoui, D.; et al. Desertification. In Climate Change and Land: An IPCC Special Report on Climate Change, Desertification, Land Degradation, Sustainable Land Management, Food Security, and Greenhouse Gas Fluxes in Terrestrial Ecosystems; Shukla, P.R., Skea, J., Calvo Buendia, E., Masson-Delmotte, V., Pörtner, H.-O., Roberts, D.C., Zhai, P., Slade, R., Connors, S., van Diemen, R., et al., Eds.; IPCC: Geneva, Switzerland, 2019. [Google Scholar]
- Gholizadeh, H.; Zoghipour, M.H.; Torshizi, M.; Nazari, M.R.; Moradkhani, N. Gone with the Wind: Impact of Soil-Dust Storms on Farm Income. Ecol. Econ. 2021, 188, 107133. [Google Scholar] [CrossRef]
- Rajot, J.L. Wind Blown Sediment Mass Budget of Sahelian Village Land Units in Niger. Bull. Société Géologique Fr. 2001, 172, 523–531. [Google Scholar] [CrossRef]
- Abdourhamane Touré, A.; Tidjani, A.D.; Rajot, J.-L.; Bouet, C.; Garba, Z.; Marticorena, B.; Ambouta, K.J.-M. Impacts de la variabilité spatiale de l’occupation des sols sur l’érosion éolienne et les transports de nutriments dans le terroir de Banizoumbou (sud-ouest du Niger). Alger. J. Arid. Environ. 2017, 7, 78–89. [Google Scholar] [CrossRef]
- Abdourhamane Touré, A.; Tidjani, A.D.; Rajot, J.L.; Marticorena, B.; Bergametti, G.; Bouet, C.; Ambouta, K.J.M.; Garba, Z. Dynamics of Wind Erosion and Impact of Vegetation Cover and Land Use in the Sahel: A Case Study on Sandy Dunes in Southeastern Niger. Catena 2019, 177, 272–285. [Google Scholar] [CrossRef]
- Zhang, Z.; Dong, Z. Characteristics of Aeolian Sediment Transport over Different Land Surfaces in Northern China. Soil Till. Res. 2014, 143, 106–115. [Google Scholar] [CrossRef]
- Khatelli, H.; Gabriels, D. Effect of Wind Direction on Aeolian Sand Transport in Southern Tunisia. Int. Agrophys. 2000, 14, 291–296. [Google Scholar]
- Labiadh, M.; Bergametti, G.; Attoui, B.; Sekrafi, S. Particle Size Distributions of South Tunisian Soils Erodible by Wind. Geodin. Acta 2011, 24, 39–49. [Google Scholar] [CrossRef]
- Bouajila, A.; Omar, Z.; Ajjari, A.; Bol, R.; Brahim, N. Improved Estimation and Prediction of the Wind-Erodible Fraction for Aridisols in Arid Southeast Tunisia. Catena 2022, 211, 106001. [Google Scholar] [CrossRef]
- Hanafi, A.; Jauffret, S. Are Long-Term Vegetation Dynamics Useful in Monitoring and Assessing Desertification Processes in the Arid Steppe, Southern Tunisia. J. Arid Environ. 2008, 72, 557–572. [Google Scholar] [CrossRef]
- Gueddari, M. Géochimie et Thermodynamique des Evaporites Continentales: Etude du lac Natron (Tanzanie) et du Chott el Jerid (Tunisie). Ph.D. Thesis, Université Louis Pasteur, Strasbourg, France, 1984. [Google Scholar]
- Millington, A.C.; Drake, N.A.; Townshend, J.R.G.; Quarmby, N.A.; Settle, J.J.; Reading, A.J. Monitoring Salt Playa Dynamics Using Thematic Mapper Data. IEEE Trans. Geosci. Remote Sens. 1989, 27, 754–761. [Google Scholar] [CrossRef]
- Abbas, K.; Deroin, J.-P.; Bouaziz, S. Monitoring of Playa Evaporites as Seen with Optical Remote Sensing Sensors: Case of Chott El Jerid, Tunisia, from 2003 to Present. Arab. J. Geosci. 2018, 11, 92. [Google Scholar] [CrossRef]
- Labiadh, M.; Bergametti, G.; Kardous, M.; Perrier, S.; Grand, N.; Attoui, B.; Sekrafi, S.; Marticorena, B. Soil Erosion by Wind over Tilled Surfaces in South Tunisia. Geoderma 2013, 202–203, 8–17. [Google Scholar] [CrossRef]
- Thameur, A.; Lachiheb, B.; Ferchichi, A. Drought Effect on Growth, Gas Exchange and Yield, in Two Strains of Local Barley Ardhaoui, under Water Deficit Conditions in Southern Tunisia. J. Environ. Manag. 2012, 113, 495–500. [Google Scholar] [CrossRef] [PubMed]
- Bouet, C.; Labiadh, M.T.; Pierre, C.; Sekrafi, S.; Henry des Tureaux, T.; Ltifi, M.; Bergametti, G.; Marticorena, B.; Abdourhamane Touré, A.; Rajot, J.L. What Drives Wind Erosion in Cropped Areas? A Case Study in Southern Tunisia. Catena 2023, 223, 106964. [Google Scholar] [CrossRef]
- Slimani, M.S.; Zayani, K. Apport d’eau, développement et rendement de jeunes palmiers Deglet Nour dans la parcelle expérimentale d’Atilet-Nefzaoua (Tunisie). Medit 1998, 9, 58–62. [Google Scholar]
- Robinson, G.W. Note on the Mechanical Analysis of Humic Soils. J. Agric. Sci. 1922, 12, 287–291. [Google Scholar] [CrossRef]
- Chatenet, B.; Marticorena, B.; Gomes, L.; Bergametti, G. Assessing the Microped Size Distributions of Desert Soils Erodible by Wind. Sedimentology 1996, 43, 901–911. [Google Scholar] [CrossRef]
- Ellis, J.T.; Li, B.; Farrell, E.J.; Sherman, D.J. Protocols for Characterizing Aeolian Mass-Flux Profiles. Aeolian Res. 2009, 1, 19–26. [Google Scholar] [CrossRef]
- Namikas, S.L. Field Measurement and Numerical Modelling of Aeolian Mass Flux Distributions on a Sandy Beach. Sedimentology 2003, 50, 303–326. [Google Scholar] [CrossRef]
- Panebianco, J.E.; Buschiazzo, D.E.; Zobeck, T.M. Comparison of Different Mass Transport Calculation Methods for Wind Erosion Quantification Purposes. Earth Surf. Proc. Land. 2010, 35, 1548–1555. [Google Scholar] [CrossRef]
- Williams, G. Some Aspects of the Eolian Saltation Load. Sedimentology 1964, 3, 257–287. [Google Scholar] [CrossRef]
- Gillette, D.A.; Fryrear, D.W.; Xiao, J.B.; Stockton, P.; Ono, D.; Helm, P.J.; Gill, T.E.; Ley, T. Large-Scale Variability of Wind Erosion Mass Flux Rates at Owens Lake 1. Vertical Profiles of Horizontal Mass Fluxes of Wind-Eroded Particles with Diameter Greater than 50 Μm. J. Geophys. Res. 1997, 102, 25977–25987. [Google Scholar] [CrossRef]
- Fryrear, D.W. A Field Dust Sampler. J. Soil Water Conserv. 1986, 41, 117–120. [Google Scholar]
- Gillette, D.A.; Herbert, G.; Stockton, P.H.; Owen, P.R. Causes of the Fetch Effect in Wind Erosion. Earth Surf. Proc. Land. 1996, 21, 641–659. [Google Scholar] [CrossRef]
- Goossens, D.; Offer, Z.; London, G. Wind Tunnel and Field Calibration of Five Aeolian Sand Traps. Geomorphology 2000, 35, 233–252. [Google Scholar] [CrossRef]
- Goossens, D.; Buck, B.J. Can BSNE (Big Spring Number Eight) Samplers Be Used to Measure PM10, Respirable Dust, PM2.5 and PM1.0? Aeolian Res. 2012, 5, 43–49. [Google Scholar] [CrossRef]
- Mendez, M.J.; Funk, R.; Buschiazzo, D.E. Field Wind Erosion Measurements with Big Spring Number Eight (BSNE) and Modified Wilson and Cook (MWAC) Samplers. Geomorphology 2011, 129, 43–48. [Google Scholar] [CrossRef]
- Shao, Y.; McTainsh, G.H.; Leys, J.F.; Raupach, M.R. Efficiencies of Sediment Samplers for Wind Erosion Measurement. Aust. J. Soil Res. 1993, 31, 519–532. [Google Scholar] [CrossRef]
- Miller, I.; Freund, J.E. Probability and Statistics for Engineers; Prentice-Hall: Englewood Cliffs, NJ, USA, 1977. [Google Scholar]
- Ghasemi, A.; Zahediasl, S. Normality Tests for Statistical Analysis: A Guide for Non-Statisticians. Int. J. Endocrinol. Metab. 2012, 10, 486–489. [Google Scholar] [CrossRef] [PubMed]
- Brown, M.B.; Forsythe, A.B. Robust Tests for the Equality of Variances. J. Am. Stat. Assoc. 1974, 69, 364–367. [Google Scholar] [CrossRef]
- Kawamura, R. Study of Sand Movement by Wind; Hydraulic Engineering Laboratory; University of California: Berkeley, CA, USA, 1964; pp. 99–108. [Google Scholar]
- White, B.R. Soil Transport by Winds on Mars. J. Geophys. Res. 1979, 84, 4643–4651. [Google Scholar] [CrossRef]
- Marsham, J.H.; Knippertz, P.; Dixon, N.S.; Parker, D.J.; Lister, G.M.S. The Importance of the Representation of Deep Convection for Modeled Dust-Generating Winds over West Africa during Summer. Geophys. Res. Lett. 2011, 38, L16803. [Google Scholar] [CrossRef]
- Marticorena, B.; Bergametti, G. Modeling the Atmospheric Dust Cycle: 1. Design of a Soil-Derived Dust Emission Scheme. J. Geophys. Res. 1995, 100, 16415–16430. [Google Scholar] [CrossRef]
- Marticorena, B.; Bergametti, G.; Aumont, B.; Callot, Y.; N’Doumé, C.; Legrand, M. Modeling the Atmospheric Dust Cycle 2. Simulation of Saharan Dust Sources. J. Geophys. Res. 1997, 102, 4387–4404. [Google Scholar] [CrossRef]
- Priestley, C.H.B. Turbulent Transfer in the Lower Atmosphere; University of Chicago Press: Chicago, IL, USA, 1959. [Google Scholar]
- Marticorena, B.; Kardous, M.; Bergametti, G.; Callot, Y.; Chazette, P.; Khatteli, H.; Le Hégarat-Mascle, S.; Maillé, M.; Rajot, J.-L.; Vidal-Madjar, D.; et al. Surface and Aerodynamic Roughness in Arid and Semiarid Areas and Their Relation to Radar Backscatter Coefficient. J. Geophys. Res. 2006, 111, F03017. [Google Scholar] [CrossRef]
- Iversen, J.D.; Pollack, J.B.; Greeley, R.; White, B.R. Saltation Threshold on Mars: The Effect of Interparticle Force, Surface Roughness, and Low Atmospheric Density. Icarus 1976, 29, 381–393. [Google Scholar] [CrossRef]
- Bergametti, G.; Gillette, D.A. Aeolian Sediment Fluxes Measured over Various Plant/Soil Complexes in the Chihuahuan Desert. J. Geophys. Res. 2010, 115, F03044. [Google Scholar] [CrossRef]
- Abdourhamane Touré, A.; Rajot, J.L.; Garba, Z.; Marticorena, B.; Petit, C.; Sebag, D. Impact of Very Low Crop Residues Cover on Wind Erosion in the Sahel. Catena 2011, 85, 205–214. [Google Scholar] [CrossRef]
- Dupont, S.; Bergametti, G.; Simoëns, S. Modeling Aeolian Erosion in Presence of Vegetation. J. Geophys. Res. Earth Surf. 2014, 119, 168–187. [Google Scholar] [CrossRef]
- Pierre, C.; Kergoat, L.; Hiernaux, P.; Baron, C.; Bergametti, G.; Rajot, J.-L.; Abdourhamane Toure, A.; Okin, G.S.; Marticorena, B. Impact of Agropastoral Management on Wind Erosion in Sahelian Croplands. Land Degrad. Develop. 2018, 29, 800–811. [Google Scholar] [CrossRef]
- Bergametti, G.; Rajot, J.-L.; Marticorena, B.; Féron, A.; Gaimoz, C.; Chatenet, B.; Coulibaly, M.; Koné, I.; Maman, A.; Zakou, A. Rain, Wind, and Dust Connections in the Sahel. J. Geophys. Res. Atmos. 2022, 127, e2021JD035802. [Google Scholar] [CrossRef]
- Pi, H.; Webb, N.P.; Huggins, D.R.; Sharratt, B. Critical Standing Crop Residue Amounts for Wind Erosion Control in the Inland Pacific Northwest, USA. Catena 2020, 195, 104742. [Google Scholar] [CrossRef]
- Vos, H.C.; Karst, I.G.; Eckardt, F.D.; Fister, W.; Kuhn, N.J. Influence of Crop and Land Management on Wind Erosion from Sandy Soils in Dryland Agriculture. Agronomy 2022, 12, 457. [Google Scholar] [CrossRef]
- Larney, F.J.; Bullock, M.S.; Janzen, H.H.; Ellert, B.H.; Oslon, E.C.S. Wind Erosion Effects on Nutrient Redistribution and Soil Productivity. J. Soil Water Conserv. 1998, 53, 133–140. [Google Scholar]
- Labiadh, M.T.; Bouet, C.; Sekrafi, S.; Ltifi, M.; Attoui, B.; Tlili, A.; Hlel, M.; Rajot, J.L.; Henry des Tureaux, T. Wind Erosion Flux Measured Over Various Land Cover Types in the Arid Region of Southern Tunisia During 2012—2016. DataSuds 2023, V1 [Data set]. [Google Scholar] [CrossRef]
Disclaimer/Publisher’s Note: The statements, opinions and data contained in all publications are solely those of the individual author(s) and contributor(s) and not of MDPI and/or the editor(s). MDPI and/or the editor(s) disclaim responsibility for any injury to people or property resulting from any ideas, methods, instructions or products referred to in the content. |
© 2023 by the authors. Licensee MDPI, Basel, Switzerland. This article is an open access article distributed under the terms and conditions of the Creative Commons Attribution (CC BY) license (https://creativecommons.org/licenses/by/4.0/).