Article

Rotational Grazing Strategies Minimally Impact Soil Microbial Communities and Carbon Dynamics—A Texas Case Study

by
Jennifer M. Moore
1,*,
Daniel K. Manter
2 and
Kristie A. Maczko
3
1
USDA—Agricultural Research Service, Forage Seed and Cereal Research Unit, Corvallis, OR 97331, USA
2
USDA—Agricultural Research Service, Soil Management and Sugar Beet Research Unit, Fort Collins, CO 80526, USA
3
Sustainable Rangelands Roundtable, Department of Ecosystem Science and Management, University of Wyoming, Laramie, WY 82071, USA
*
Author to whom correspondence should be addressed.
Land 2023, 12(8), 1517; https://doi.org/10.3390/land12081517
Submission received: 12 June 2023 / Revised: 20 July 2023 / Accepted: 22 July 2023 / Published: 30 July 2023

Abstract

:
The goal of our study was to evaluate the long-term (>12 years) influence of stocking density and herd rotation frequency on plant and soil microbial community and carbon dynamics in three working ranches in Texas. One ranch utilized a high stocking density and high-frequency (HIGH) rotation where cattle were moved multiple times each day; the second ranch used a medium stocking density and rotation frequency (MED) where herds were moved every 2–3 weeks; and the third ranch used a low stocking density with continuous grazing (LOW). Neither plant nor microbial diversity measures differed between the ranches, but plant functional and microbial community compositions differentiated management strategies. The MED ranch was characterized by a plant community dominated by little bluestem (Schizachyrium scoparium) and had the greatest soil organic matter content (2.8%) and soil respiration rates compared to the LOW (SOM = 2.2%) and HIGH (SOM = 2.1%) ranches. The HIGH ranch had a relatively high abundance and diversity of forbs and introduced grasses, and the LOW ranch had an even mixture of tall, introduced, and cool-season grasses. All three ranches had relatively high levels of Gram-positive bacteria (>70%) with MED having a higher relative abundance of bacteria important for carbon cycling. Furthermore, network analyses suggest that soil microbial communities at all ranches were highly synergistic and exhibited well-defined ecological niches. Differences in soil properties between ranches tended to be minor and suggest that grazing strategies can differ without any substantial shifts in soil and microbial function.

1. Introduction

Globally, grazing lands account for approximately 40% of the terrestrial surface [1]. According to the United States Department of Agriculture (USDA), privately owned range and pasture lands in the USA occur on over 213 M hectares and form the largest single land cover/use type, exceeding both forest and cropland. The ecosystem services grazing lands provide are numerous and include supporting biodiversity, carbon storage, forage production, nutrient cycling, and water filtration, capture, and storage [2]. Depending upon the management practices used, grazing can positively or negatively affect ecological sustainability [3].
Prescribed grazing involves managing the harvest of vegetation with grazing animals and is often applied as part of a broader conservation management system, including reduction of soil erosion and maintenance and improvement of soil condition [4]. Soil vegetative cover, as influenced by grazing intensity/stocking density, and inherent soil characteristics are key variables impacting soil loss at the site level [5]. Inappropriate stocking densities that reduce soil surface vegetative cover will increase the mobilization of soil particles due to raindrop impact and wind and decrease soil organic matter and soil aggregate stability [6]. Continuous grazing systems are designed where livestock have access to all grassland on a ranch throughout the grazing system. A disadvantage of this approach is that livestock tends to preferentially graze in areas near shade and water sources resulting in areas that are then underutilized [7]. When managed with relatively low stocking rates, continuous grazing management has been shown to reduce ecological damage caused by heavy grazing pressures from chronic, intensive grazing [8]. This finding highlights the importance of designing grazing management plans to meet the goals and resources available for the producer while balancing the ecological capabilities of the environment.
Among prescribed grazing practices, rotational grazing systems are designed to redistribute ecological pressures induced by grazing in time and space for any given stocking rate [8]. Cattle are collectively moved through a series of paddocks in a planned sequence. This allows rest periods for plants to regenerate and distributes manure and associated nutrients more evenly across the landscape [9]. Numerous versions of rotational grazing systems exist that vary in stock density, length of grazing, length of rest, number of paddocks, and number of herds [8,10,11,12]. Approximately 40% of cow–calf operations in the USA report using rotation grazing, with the majority using relatively simple systems that rely on five or fewer paddocks of 16.2 ha or more [13].
Although soil health research on croplands has increased in recent years, research on grazing lands is limited [14]. Much research has been conducted investigating the impact on cattle and vegetation production under prescribed or rotational grazing [11,15], yet more focus is needed to understand its full ecological impact on soil health and the ecosystem services provided by healthy soil [9,16]. A recent global analysis has reported increased soil organic carbon and decreased soil compaction under rotational grazing compared to continuous grazing [9], but other soil biological measures (e.g., soil respiration, microbial community composition, enzyme activity potential, and nutrient cycling) responses were not included.
Soil microbes maintain and drive key ecosystem functions including the cycling of carbon and formation of soil organic matter, nutrient cycling, and overall plant health through increasing resistance to pests, pathogens, and weed pressure, formation of beneficial relationships that aid plant growth, and increasing resilience to environmental stressors [17,18]. Despite known linkages between vegetation and soil microbes, a recent meta-analysis [19] revealed that microbial abundance was only impacted by heavy grazing, whereas no change in fungal or bacterial abundance was observed under light and moderate grazing. Soil health focuses on the soil functioning as a vital, living ecosystem emphasizing the importance of soil biota in supporting soil functions. However, relatively little research has evaluated the impacts of grazing management and its influence on the linkages between vegetation, soil properties, and microbial structure and function.
Nearly 60% of Texas land is categorized as native rangeland and covers 37.5 M hectares of native rangeland [20]. This vast area helps support beef production in the state, which leads the nation and has a $12 B US market value. The objective of this study was to evaluate the long-term (>12 years) influence of stocking density and herd rotation frequency on plant and soil microbial community composition and soil carbon dynamics in three working ranches in Texas. Two of the ranches followed rotational grazing practices: one ranch utilized a high-density, short grazing duration, and long rest period strategy, and the other ranch followed a more moderate approach. The third ranch followed a continuous seasonal grazing approach. We hypothesized that the two rotational grazing ranches would support greater soil organic matter and microbial diversity than the ranch using continuous grazing. Furthermore, these differences were expected to be driven in large part due to shifts in the vegetation composition as previously observed by the ranchers and local conservationists.

2. Materials and Methods

2.1. Site Descriptions

Soil and vegetation data were collected in April 2017 from three working ranches that differed in stocking densities, frequency of herd rotation, and stocking rates. Ranches were located within the Texas North Central Prairie major land resource area (MLRA 080 B) as described by the USDA Natural Resources Conservation Service [21]. The climate is subtropical, subhumid with hot humid summers and relatively mild winters. The mean annual temperature is 15 °C, and the average annual precipitation is approximately 78 cm, with 75% of the annual rainfall occurring between April 1 and October 31. This ecological region is characterized by gently rolling, dissecting plains with steep hillsides and side slopes. Sample collection, however, was restricted to the near level (0–2%) shoulder or side slope positions.
Rangeland management strategies for each ranch were classified according to stocking density and rotation frequency. The reported management approaches used by each ranch had been in place for at least 12 years and all have been working ranches for multiple generations. The first ranch occupied a total of 5747 ha and followed a high stocking density and high-frequency rotation (HIGH), where approximately 5000 mixed breed steers were moved up to six times each day as a single herd. Approximately 140 permanent paddocks ranging from 18–59 ha have grazed an average of 2.5 days each year, with a minimum rest period of 50 days and a maximum of 120 days. The median stocking density was 97.4 animal units (AU) ha−1, and the stocking rate was 8 animal unit months (AUM) ha−1 (Table 1).
The second ranch utilized a medium stocking density and rotation frequency (MED) where 630 Hereford cow–calf pairs and approximately 200 yearlings were moved every 1–2 weeks. Total ranch size was 1358 ha and cattle were rotated using 3–4 paddocks with a 30- to 90-day rest period. The median stocking density was estimated at 2 AU ha−1, and the median stocking rate was 2.1 AUM ha−1.
The third ranch used a low stocking density with continuous grazing (LOW) and was 4856 ha in size. Approximately 400 Black Angus cow–calf pairs and 300 yearlings are divided among approximately eight paddocks ranging in size from 405 to 607 ha. Each paddock supports an average of 55 cow–calf pairs, 41 yearlings, and one bull. Pastures receive a three-month rest period every four years. The median stocking density is 0.17 AU ha−1, and the stocking rate is 2.0 AUM ha−1.

2.2. Vegetation and Soil Sampling

Vegetation and soil sampling was conducted on 3–5 April 2017. Although each ranch is independent, the vast geographical hectarage provided landscape-level replication under similar management practices (Figure 1). At each ranch, five geographically distinct locations (at least 0.5 km apart) were identified that were within the same or similar soil type, landscape position, and ecological site description to minimize site-to-site variability and allow equal comparisons between ranches. The ecological site description for the sampling area was the Loamy Prairie 26–33” PZ ecological site (https://edit.jornada.nmsu.edu/catalogs/esd/080B/R080BY152TX, accessed on 1 March 2018). Using USDA Soil Survey Geographic Database data, the Renfrow-Kirkland-Anocon association, nearly level, was identified as the dominant map unit across all three ranges. The Renfrow or Kirkland soil series (Fine, mixed, superactive, thermic Udertic Paleustolls) was the target soil series with representative soil consisting of a loam texture with 22% clay and 2% soil organic matter (SOM). The LOW and HIGH ranches shared a common border with each other; however, the sampling locations (i.e., transects) between each were separated by at least 2 km (up to 11 km). The MED ranch was approximately 30 km from the nearest transect at LOW (Figure 1).
At each location, one 30 m north-south transect was run. For vegetation sampling, the line-point intercept method [22] was used to quantify soil cover, plant species composition, and aggregation of species into one of seven functional groups: introduced species, forbs, cool-season grasses, short grasses, medium grasses, tall grasses, and grass-like species (Supplementary Table S1). At the LOW ranch, vegetation sampling was only conducted on three transects due to time constraints with the vegetation survey team.
At 0, 15, and 30 m along the transect, three sub-replicate soil samples (0–15 cm) were collected. Each sub-replicate was made up of four homogenized subsamples (two east and two west of the transect line). Soil samples were split in the field into two bags and stored on ice in coolers. One bag was shipped within 48 h to Cornell University Soil Health Lab, Cornell, NY, USA. A frozen subsample was shipped on dry ice to the soil microbiology lab at the USDA-Agricultural Research Service in Fort Collins, CO, USA for molecular microbial community composition (16S rRNA amplicon sequencing).

2.3. Soil Assessments

Soil properties specific to carbon cycling, soil pH, and soil texture were selected for the purpose of this study. Details of all protocols are provided by Schindelbeck and Moebius-Clune [23]. Soil organic matter (SOM) is determined using the loss-on-ignition method where pre-weighed air-dried soil is placed in an oven at 500 °C for 2 h, cooled, reweighed, and the difference in weight is calculated according to the equation reported by Nelson and Sommers [24]. Active carbon (C) was measured following the potassium permanganate oxidation method as described by Weil et al. [25] and expressed in mg kg−1 soil. Mineralizable C (respiration) was estimated by measuring the amount of CO2 released over a 4-day incubation. Briefly, 20 g of air-dried soil is rewetted with water delivery from the bottom via capillarity, incubated at room temperature (approximately 25 °C) in 0.5 L jars, and CO2 released is measured via electrical conductivity of 0.5 M KOH trap [23,26]. Soil pH is measured in a 2:1 water:soil ratio using a pH robot (Lignin, Albuquerque, NM, USA). Soil texture was determined using the rapid soil particle-size method as described by Kettler et al. [27].

2.4. 16S rRNA Amplicon Sequencing

DNA was extracted from 0.25 g of soil from each plot using the Qiagen DNeasy Powersoil Pro Kit (Qiagen, Germantown, MD, USA). The extraction process was carried out using a fully automated Qiagen QIAcube robot with a 10-min vortex lysis step. Extracted nucleic acids were analyzed with spectrophotometric quantification using a Nanodrop 1000 (Thermo Scientific, Wilmington, DE, USA) or fluorometric quantification using a Qubit 2.0 (Life Technologies, Carlsbad, CA, USA). PCR amplifications were performed using the primer pair, 341F/806R [28], which targets the V3–V4 region of the 16S rRNA gene.
Extracted DNA was amplified in triplicate, in 20 µL quantitative PCR (qPCR) reactions containing 10 µL of Maxima SYBR-green (Thermo Scientific, Waltham, MA, USA), 2 µL of each forward and reverse primer (10 µM concentration), 4 µL of molecular grade H2O, and 2 µL of soil DNA diluted 1:20 with nuclease-free water. Reactions were held at 95 °C for 5 min, with amplification proceeding for 28 cycles at 95 °C for 40 s, 55 °C for 120 s, 72 °C for 60 s, and a final extension at 72 °C for 7 min. Thermocycling was performed with a Roche 96 Lightcycler (Roche, Indianapolis, IN, USA).
Following amplification, replicate qPCR reactions were pooled, and rRNA amplicon libraries were prepared based on the methods of Leite-Mondin et al. [29] and sequenced at Colorado State University, Fort Collins, CO, USA using an Illumina MiSeq v3 600-cycle Kit (Illumina, Inc., San Diego, CA, USA). Briefly, raw sequences were processed by removing primers from demultiplexed raw fastq files using Cutadapt 3.2 [30], and amplicon sequence variants were inferred using the default settings in the default DADA2 pipeline. Each sequence variant was classified to the NCBI-linked default reference database available from EMU [31] using minimap2 2.22 [32]; the primary alignment for each sequence was chosen with SAMtools 1.9 [33] and used for taxonomic assignments. For the 45 samples, a total of 842,799 high-quality reads were obtainedin the 16S rRNA library, with a minimum of 4043, a maximum of 36,947, and an average of 18,729 reads per sample. Species α-diversity indices were calculated on rarefied data (4043 reads per sample).
The 16S and functional gene copies per genome (CPG) were predicted for each amplicon sequence variant (ASV) using the following PICRUSt2 python scripts [34] and Enzyme Classification Numbers for seven enzymes associated with carbon, nitrogen, phosphorus, and sulfur cycling (BG: b-glucosidase (EC3.2.1.21), CBH: cellobiohydrolase (EC3.2.1.91), AMI: amidase (EC3.5.1.4), LAP: leucyl aminopeptidase (EC3.4.11.1), NAG: chitinase (EC3.2.1.14), URE: urease (EC3.5.1.15), AP: alkaline phosphatase (EC3.1.3.1), ASL: arylsulfatase (EC3.1.6.1)). The PICRUSt2 python script (place_seqs.py), which utilizes HMMER [35], was used to add the query sequences to the default PICRUSt2 prokaryotic 16S rRNA phylogenetic tree using EPA-NG [36]. The PICRUSt2 python script (hsp.py), which utilizes the castor R package [37], was used to predict relative functional abundances (RFA) for each gene, and it was calculated as follows:
R F A = i = 1 S o b s n i N × F G . C P G i 16 S . C P G i
where,
Sobs = number of observed ASVs
ni = number of sequence reads in ASV i
N = number of sequence reads
FG.CPGi = functional gene copies per genome for ASV i
16S.CPGi = 16S rRNA copies per genome for ASV i

2.5. Statistical Analysis

Differences between ranches for each soil health indicator were tested using a mixed model analysis of variance (ANOVA) with clay + silt content as a covariate (if significant at p < 0.05), with each transect treated as a replicate and each of the three points along the transect treated as a sub-replicate and included in the error term using the lmerTest package [38] in R, version 4.2.2 [39]. For 16S libraries, differences between ranches in species richness, Shannon’s Diversity Index, and the Inverse Simpson’s Diversity Index were tested using a mixed model ANOVA as described above.
Ranch differences in soil microbial community 16S rRNA profiles were visualized by distance-based redundancy analysis (db-RDA) using Bray-Curtis distances of square root-transformed genera relative abundances and constrained by ranch, and statistical differences between ranches were tested by non-parametric multivariate ANOVA (NPMANOVA) using a mixed model similar to that used for the soil biological properties.
Microbial correlation networks were constructed for each ranch from genera relative abundances calculated from the 16S rRNA profiles using the microeco [40] and meconetcomp [41] packages in R. Pearson correlation matrices were calculated for only those genera with a relative abundance greater than 0.1%, and only significant correlations (r > 0.3 and p < 0.05) were included in the final network to avoid spurious connections. Global network properties were calculated using the cal_network_attr function in meconetcomp and included average degree, average path length, connectivity, and modularity [42,43,44].

3. Results and Discussion

This case study was conducted on three sites in Texas, each with its own management history. The lack of true replication and randomization of management strategies for each of the three ranches limits our ability to assign cause and effect. We cannot discount the possibility that land use histories and breed differences could explain any observed differences. To minimize historical influences, the three ranches sampled had been working ranches for multiple generations with the current management strategies in place for at least 12 years. Our goal was to select multiple, geographically distinct locations within each ranch, to serve as quasi-replication where sampling was constrained to limit site-to-site variability by sampling similar soil types, landscape positions, and ecological site characteristics.

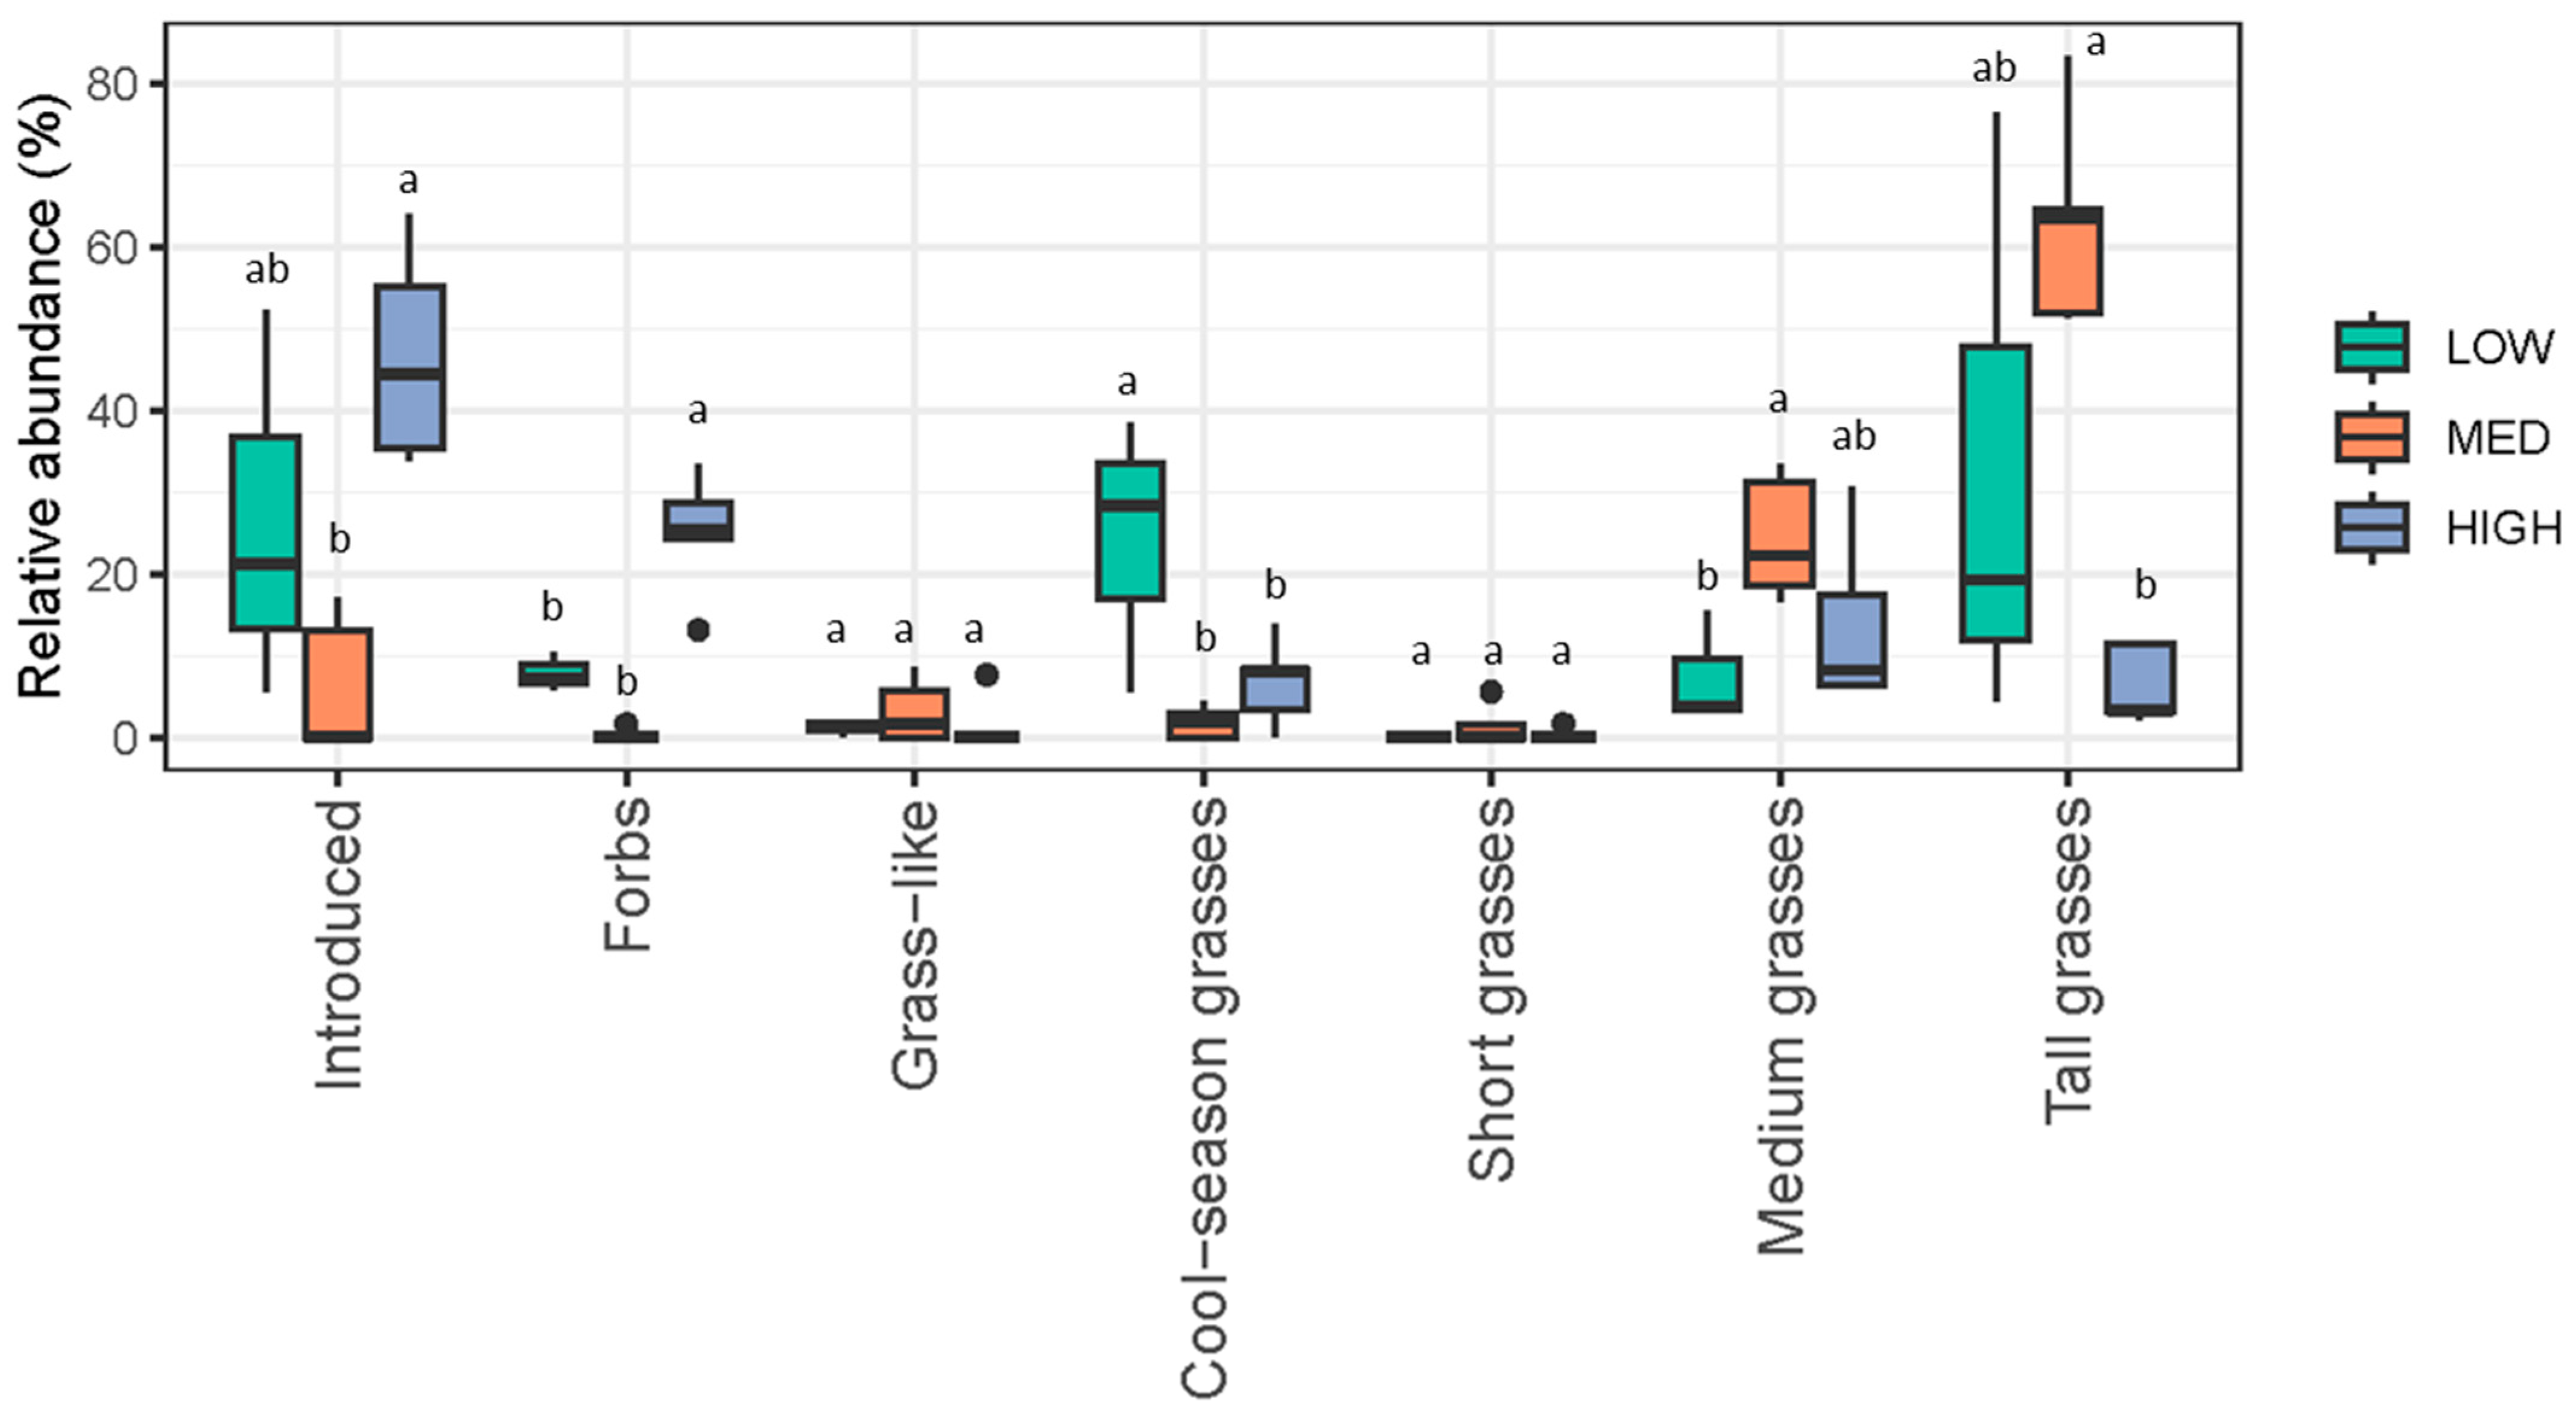
3.1. Ranch Management Goals Were Reflected in Vegetation Data

Multi-paddock, rotational grazing that relies on short but intensive grazing periods with high stock densities and long recovery periods is intended to enhance vegetation composition and increase diversity [10,45]. Management at the HIGH ranch was based on this type of program, yet overall species richness was not different from the other two ranches (Table 2). Within the functional groups, species richness only differed for the forbs (HIGH > MED) and cool-season grasses (LOW > MED).
Although overall species richness did not differ between ranches, each ranch was characterized by a community that differed at the functional and species levels. Tall grasses were the dominant functional group at MED (64%) and were significantly greater compared to HIGH and not different from LOW (Figure 2). At HIGH, the dominant vegetation group was introduced grasses at 47%, which was significantly greater than that at MED and similar to LOW. HIGH was also characterized by a high relative abundance of 25% of forbs (compared to less than 10% for the other two ranches). Among these forbs, Western ragweed (Ambrosia psilostachya) made up 46%, and although it is considered a weed, ragweed can be a source of forage early in the season with grass production not negatively affected in mixed prairie systems [46]. The relative abundance of forbs, however, was greatest at HIGH at 25% with an average of 4.6 species per transect. In contrast to HIGH, forbs made up 8% of the total plant composition at LOW with an average of 2.3 species per transect. The dominant functional groups for LOW were comprised of three relatively equal groups and included tall, introduced, and cool season grasses at 33, 26, and 24%, respectively. The presence of more cool-season perennials, such as Scribner’s panicum, and the relatively high tall grasses with a mixture of forbs aligned well with the production goals for this rancher (personal communication). All ranches had minimal bare ground within the surveyed area (LOW = 0%, MED = 2.4%, HIGH = 0%), suggesting a high level of soil protection from the erosive forces of wind and water.
At the species level, plant community composition was statistically different due to the main effect of ranch based on NPMANOVA (p = 0.001), and pairwise comparisons revealed that HIGH was different from LOW (p = 0.046) and MED (p = 0.007), but LOW and MED were not different from each other (p = 0.121). A db-RDA ordination, constrained by ranch, showed that the MED and HIGH ranches separated along axis 1 and the LOW and HIGH separated along axis 2 (Figure 3). The three plant species that differentiated the ranches the most were little bluestem (Schizachyrium scoparium var. frequens), a warm season, tall grass, whose abundance increases along axis 1 toward the MED centroid, annual brome (Bromus spp.); an introduced annual cool-season species, which decreases along axis 1 toward the HIGH centroid; and Scribner’s panicum (Panicum oligosanthes), a cool-season grass, which increases along axis 2 toward the LOW centroid. High variability of these species was observed within the ranches. For example, at the LOW ranch, the relative abundance of Scribner’s panicum ranged from 8 to 33% and annual brome ranged from 5 to 52%. At the MED ranch, little bluestem ranged from 26 to 83% (54% average) and was in alignment with the rancher’s goals where previous applications of herbicide to reduce forbs and strategic grazing were used to maximize bluestem production and a diverse mix of other grasses such as sideoats grama (Bouteloua curtipendula var. curtipendula), and vinemesquite (Panicum obtusum).
Repeated samplings, including those collected during late spring when maximal growth is occurring, are needed to fully understand and more accurately quantify total forage biomass quality and quantity, which are key drivers of cattle weight gain. For example, as the growing season progresses, the abundance of annual brome, a cool season introduced grass, at HIGH, was expected to decrease and be replaced with a greater abundance of warm season grasses. The primary goal for this rancher was to support a high diversity of forbs and abundant biomass in a diverse mix of cool and warm-season grasses.

3.2. Ranch Management Showed Minor but Significant Differences in Soil Biological Properties

SOM, respiration, and soil pH were significantly different between ranches (Table 3). Most of these indicators were highest at the MED ranch as compared to either the LOW or HIGH ranches, except for soil pH, which was highest at HIGH (Table 3). Although soil pH was highest at HIGH (6.4) and lowest at MED (6.2), these values are within the optimal range expected for soils in the region and for grass and forb production for grazing.
Soil organic matter showed a significantly greater percentage at MED (2.8%) compared to both LOW (2.2%) and HIGH (2.1%). We expected rangeland that experienced continuous grazing pressure (i.e., LOW) to have the lowest SOM and other soil biological properties because frequent grazing can reduce the potential for soil carbon sequestration since root growth is reduced [47]. The slightly lower SOM at HIGH and LOW may be the result of the intensive but short-lived grazing regime at HIGH or the year-round grazing at LOW but herd management is equally important in maintaining high functioning soils. All three ranches had higher SOM content relative to the representative soil (approximately 2.0%) for this region [48]. Although comparing samples to the representative soil used by NRCS for mapping is beyond the intended use, the higher values measured in the three ranches suggest that decades of grazing have not had a deleterious effect on SOM. Thus, even though these sites experience intense grazing periods relative to the moderate grazing regime of MED, the duration is either brief as in the case of HIGH, or at a low enough stocking density found at LOW that maintains vegetative cover and productivity to levels that can sustain SOM.
Although LOW and HIGH were spatially close to each other, which may have contributed to the lack of differences between the two ranches, it was surprising that 12 years of very contrasting management strategies and differences in vegetative composition had not translated to measurable differences between the two ranches in most soil properties. Specific details of ranch management prior to 12 years ago at the time of sampling were not provided except that the land had been used for ranching for multiple generations. Rotational grazing is a relatively new management practice, and it is likely that management practices similar to those used at LOW were more common across the region. Thus, it is also possible that 12 years is not long enough to result in detecting differences due to management. Our observational study contradicts a recent study in the southeastern USA where short-duration rotational grazing at high stocking densities similar to those used by HIGH resulted in 13% more soil carbon than continuously grazed sites [49]. This study was conducted on relatively small plots (all less than 850 ha) with different land use histories (e.g., all had historically been in annual row crop production) and under a different climate regime and soil types than our three ranches. Other studies in Australia have reported conflicting impacts from rotational grazing [50], thus, highlighting the need for multi-regional studies at appropriate scales, replication, and duration. SOM is critical to numerous soil functions influencing microbial dynamics, nutrient storage, and cycling, aggregate stability, and water availability, storage, and flow [51]. SOM is comprised of multiple fractions ranging from readily decomposable compounds important for fueling the microbial community to more stable forms associated with carbon sequestration [52]. Two soil biological indicators that target the more active pools of soil organic matter are soil respiration, which is a measure of CO2 released from soil and reflects the functional capability of the microbial community to decompose organic residues and cycle nutrients [53], and active carbon, which is an organic carbon fraction that acts as an energy source for soil microbes [54]. In this study, soil respiration was significantly greater at MED (0.48 mg CO2 g−1 soil) compared to HIGH (0.40 mg CO2 g−1 soil) and not different from LOW (0.45 mg CO2 g−1 soil). Although not statistically significant, active carbon followed a similar pattern (Table 3). Few studies on rangelands have measured these soil health indicators, thus limiting interpretation of our results; however, the differences detected in these soil health indicators were all relatively minor and do not indicate any major deficiencies.

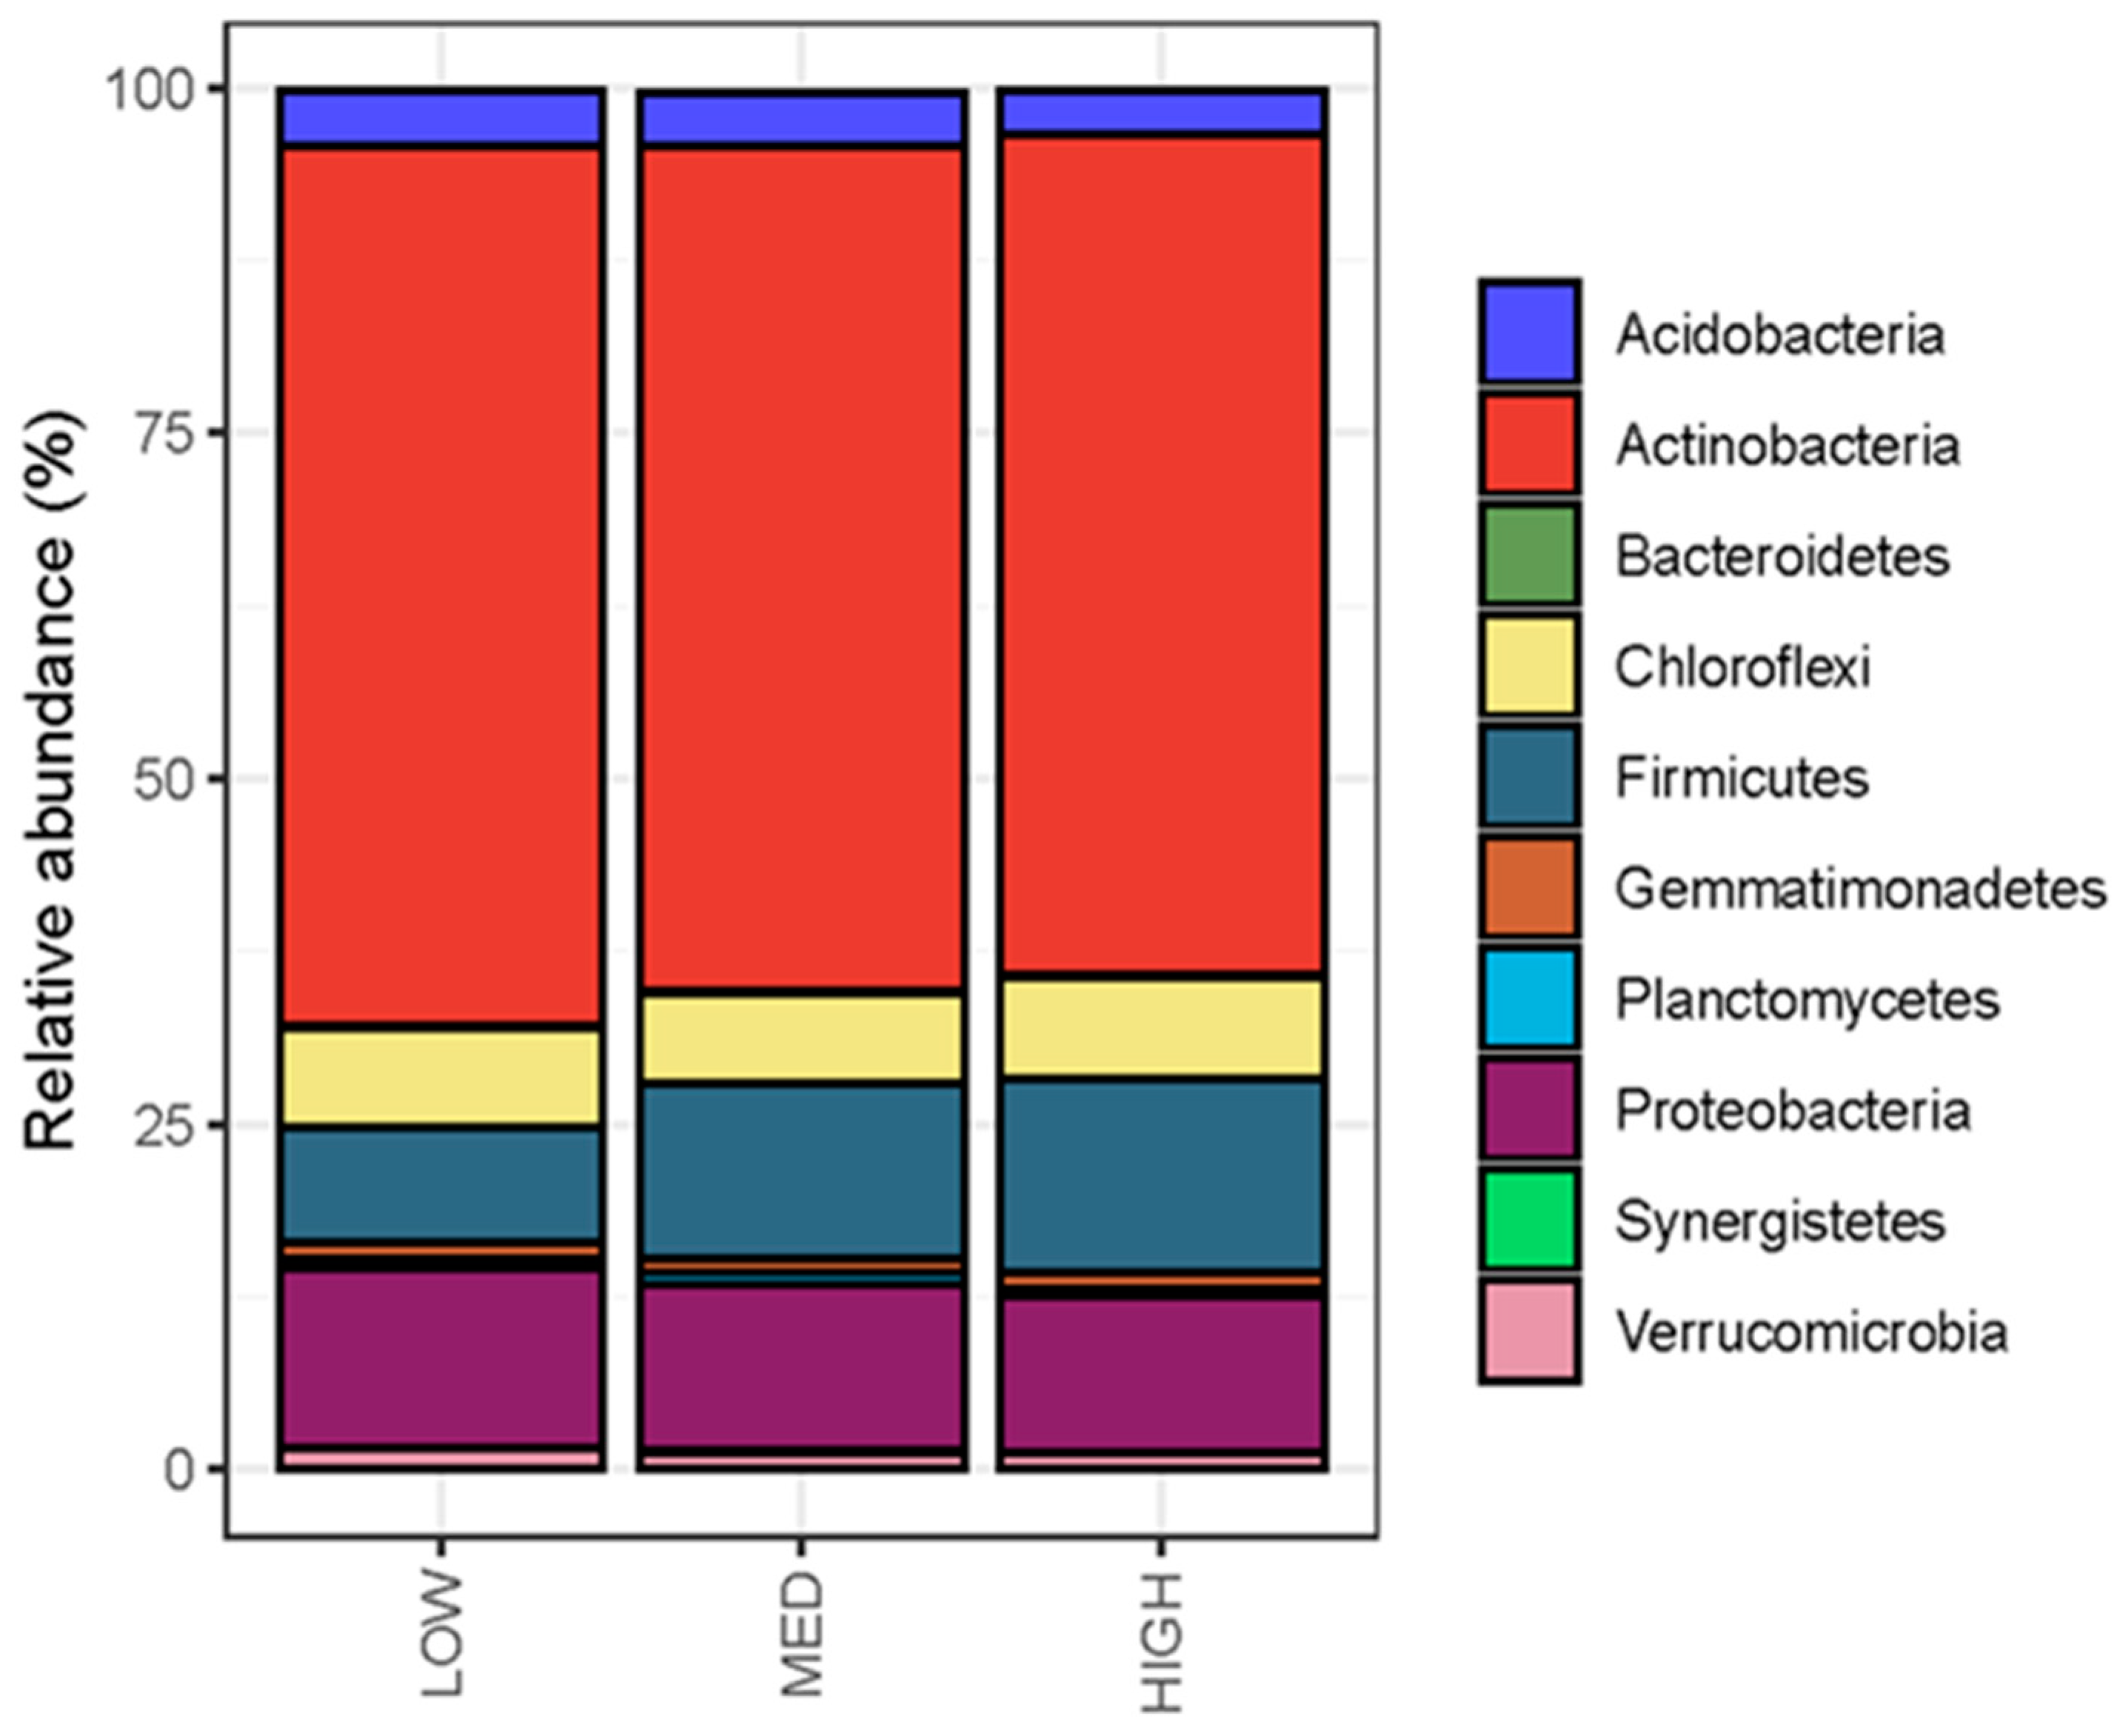
3.3. Rangeland Management Had No Effect on Microbial Diversity, but Management Differences Were Reflected in Microbial Community Composition and Enzymatic Potential

Similar to plant species richness, microbial α-diversity estimates did not statistically differ between ranches (Table 4). Additionally, total bacterial abundance, as estimated by qPCR, was not statistically different. The influence of grazing intensity on soil microbial communities in previous studies has been inconsistent. For example, Li et al. [2] did not find a significant effect of grazing treatments on soil microbial community composition using 16S/ITS amplicon sequencing, whereas Gram-positive bacteria (e.g., Firmicutes) have previously been shown to increase under intensive grazing [55,56]. The top 10 bacterial phyla comprised over 99% of the bacterial communities at each ranch (Figure 4). Across all ranches, Gram-positive bacteria comprised nearly 75% of the total population (i.e., Actinobacteria, 62%; Firmicutes, 12%), and the five most abundant Gram-negative phyla were Proteobacteria (12%), Chloroflexi (7%), Acidobacteria (4%), Verrucomicrobia (1%), and Gemmatimonadetes (1%).
At the genus level, the overall community profile was significantly different between all three ranches (p = 0.004) with MED different from LOW (p = 0.004) and HIGH (p = 0.012) and HIGH not significantly different from LOW (p = 0.510) based on an NPMANOVA. A db-RDA constrained by the ranch showed that the MED ranch separated along axis 1 from the LOW and HIGH ranches (Figure 5). Nine of the top ten bacterial genera contributing to the separation of MED from HIGH and LOW on axis 1 were all Actinobacteria. Those associated with MED included Actionallomurus, Rugosimonospora, Actinomadura, Niallia, and Egibacter. There were no specific taxa that helped to differentiate between HIGH and LOW, but the taxa that tended to be greater in HIGH and LOW relative to MED included Rubrobacter, Kineococus, Geodermatophilus, Blastococcus, and Microlunatus. There is scant literature about the function of these genera in the soil; however, they are all Actinobacteria, except the Firmicutes, Niallia, and represent the major phyla present at each of these sites.
Enrichment of these Gram-positive phyla in grasslands as compared to croplands is not uncommon [57,58,59], and several different hypotheses have been proposed to explain the shifts from Gram-negative to Gram-positive bacteria. For example, Gram-positive bacteria tend to use more recalcitrant sources of C, while Gram-negative bacteria use more labile sources of C [60,61]. Labile C pools tend to initially increase when croplands are converted to grasslands, but the effect may be transient as plant productivity and labile C decrease over time in converted grasslands [62]. It has also been proposed that Gram-positive bacteria are ‘late-successional’ species indicative of a lack of disturbance [60]. Actinobacteria are widely distributed in soils and are thought to play a critical role in the decomposition and synthesis of SOM [63,64]. The relatively high proportion of Actinobacteria across all ranches in our study suggests that the long-term (>12 years) management styles support a bacterial community reflective of stable carbon cycling and relatively low soil disturbance.
Typically, microbial consortia work synergistically to degrade complex plant-derived compounds, with some microbes utilizing metabolites or taking advantage of broken-down products of extracellular enzymes produced by other taxa [65,66]. These synergistically active microbes are expected to be correlated with each other in tightly coupled consortia [2,67], and such groups may be related to soil and plant compositional differences at each site. Microbial correlation network analyses explore the relationships between microbial taxa abundances [68] and have been used to determine the degree of niche specialization and synergism in the microbial community. For example, positive interactions have been suggested to reflect cooperation and niche overlap among species, and negative interactions reflect competition and niche separation among species [69,70]. The microbial networks at each ranch have more than 93% positive interactions suggesting high species cooperation (Figure 6).
Network modularity values greater than 0.4 indicate high niche specialization in the microbial community [71] and the modularity values ranged from 0.64 (LOW) to 0.70 (HIGH) and 0.73 (MED). A total of 15 (LOW), 12 (MED), and 10 (HIGH) modules or co-occurring species were identified in each network. Module hubs have been described as key regulators and/or early colonizers of a functional niche, whereas the absence of a hub is an indicator of functional resiliency [72,73]. Despite the more than 10 modules at each ranch, no module hubs were detected based on the criteria of Zhou et al. [44]. A network with high modularity, and high positive interactions, but no module hubs suggest a “core-periphery” structure [43], and these highly connected networks are thought to facilitate communication and provide a more stable and resilient structure even when perturbed [74]. Collectively, the network analysis suggests all three ranches support a complex microbial community, interacts synergistically, and is likely to be resilient to perturbations.
Soil enzyme activities have been proposed as sensitive indicators of soil health and quality reflecting soil biogeochemical cycling potential and SOM dynamics. Cellulose is the most abundant carbohydrate from plant biomass, and its decomposition is an important component of the carbon cycle. Due to the structural complexity of cellulose, a community of soil microbes is often involved in the complete decomposition of cellulose ultimately to glucose, a major energy source. Two key enzymes involved in cellulose decomposition are CBH and BG, where CBH catalyzes the decomposition of cellulose into cellobiose, which is in turn hydrolyzed by BG into glucose monomers. Among the suite of enzymes often assessed in soils, BGs are widely distributed and considered good indicators of soil quality and an active carbon cycle [75]. For the C cycling enzymes, the functional relative abundances of BG and CBH were significantly greater at the MED as compared to the LOW and HIGH ranches (Figure 7) and were significantly correlated with SOM values (BG: r = 0.377; CBH: r = 0.402).
Chitinase (NAG) has been associated with both C and N cycling and is involved with the breakdown of chitin, which is present in fungal and insect cell walls, to N-acetylglucosamine. The relative abundance of bacteria containing NAG was significantly higher at the MED ranch (Figure 7) and significantly correlated with SOM (r = 0.368) in each soil sample. The only other enzyme tested that was significantly different between ranches was the leucyl aminopeptidase (LAP) enzyme, which was also highest in the MED ranch and significantly correlated with SOM (r = 0.351). In general, the MED ranch was characterized by a bacterial community that supported increased carbon and nitrogen cycling, which may partially explain the relatively high SOM values found at this ranch compared to LOW and HIGH.

4. Conclusions

In this study, we evaluated plant species composition, soil properties important for carbon and nutrient cycling, and soil microbial communities at three working ranches in Texas under different management strategies (HIGH: high stocking density and herd rotation frequency; MED: medium stocking density and herd rotation frequency; and LOW: low stocking density and continuous grazing). Each ranch was characterized by a plant community that differed in its functional attributes and tended to align with the goals of each rancher. Our results partially supported our hypothesis that rotational grazing increased SOM, soil biological properties, and shifts in microbial communities with the MED ranch differentiating from the LOW and HIGH ranches based on soil and microbial metrics. The HIGH rotational ranch, however, was only different from LOW based on plant community composition. Overall, our survey represents a single snapshot of vegetation, soil health, and microbial properties under three independent ranches with markedly different grazing management strategies. Overall, each ranch showed no obvious signs of poor vegetation growth or soil health status. Across all three ranches, soil microbial communities were dominated by Actinobacteria and Firmicutes, which were linked with SOM cycling and overall ecosystem stability. Although each ranch differs in management strategies and had subtle changes in microbial composition, all communities were highly synergistic, exhibited well-defined ecological niches, and were adapted to each ranch management style. The minor differences in soil and microbial characteristics may also be influenced by differences in herd breeds as well as historical management of the sites although long-term management had been ranching for multiple generations with at least 12 years under current management practices. Given the complexity and large areas needed for cattle on native rangelands, replicated trials are extremely challenging and may require many years to detect differences. Regardless, additional research on more ranches coupled with comprehensive, long-term management histories, or repeated samplings over multiple years on the same ranch, would provide greater insights into the observed trends reported here.

Supplementary Materials

The following supporting information can be downloaded at: https://www.mdpi.com/article/10.3390/land12081517/s1, Table S1: List of vegetation identified during plant surveys, including their assigned functional type and scientific names.

Author Contributions

Conceptualization, J.M.M. and K.A.M.; methodology, J.M.M. and D.K.M.; formal analysis, D.K.M. and J.M.M.; investigation, J.M.M. and K.A.M.; data curation, J.M.M. and D.K.M.; writing—original draft preparation, J.M.M. and D.K.M.; writing—review and editing, J.M.M., D.K.M. and K.A.M.; visualization, J.M.M. and D.K.M.; supervision, J.M.M. and K.A.M.; project administration, J.M.M. and K.A.M.; funding acquisition, D.K.M. and K.A.M. All authors have read and agreed to the published version of the manuscript.

Funding

This research was funded in part by USDA-NRCS soil health initiative “ARS Soil Management Assessment Framework (SMAF) meta-analysis for indicator interpretations and tool development for use by NRCS Conservation Planners” under agreement number 67-3A75-17-391.

Data Availability Statement

The data presented in this study are available on request from the corresponding author.

Acknowledgments

The authors would like to thank the assistance of local USDA-NRCS staff and conservation scientists who assisted with sample collection and plant identification. We also are grateful to the ranchers who provided access to their land and management information. Trade names and company names are included for the benefit of the reader and do not infer any endorsement or preferential treatment of the product by USDA-ARS and the universities involved in this review. USDA-ARS and all institutions involved are equal opportunity providers and employers.

Conflicts of Interest

The authors declare no conflict of interest.

References

  1. Briske, D.D.; Richards, J.H. Plant responses to defoliation: A physiological, morphological, and demographic evaluation. In Wildland Plants: Physiological Ecology and Developmental Morphology; Bedunah, D.J., Sosebee, R.E., Eds.; Society for Range Management: Denver, CO, USA, 1995; pp. 635–710. [Google Scholar]
  2. Li, Y.; Dong, S.; Gao, Q.; Fan, C.; Fayiah, M.; Ganjurjav, H.; Hu, G.; Wang, X.; Yan, Y.; Gao, X.; et al. Grazing changed plant community composition and reduced stochasticity of soil microbial community assembly of alpine grasslands on the Qinghai-Tibetan plateau. Front. Plant Sci. 2022, 13, 864085. [Google Scholar] [CrossRef]
  3. Vetter, S. Rangelands at equilibrium and non-equilibrium: Recent developments in the debate. J. Arid Environ. 2005, 62, 321–341. [Google Scholar] [CrossRef]
  4. Briske, D.D. Conservation Benefits of Rangeland Practices: Assessment, Recommendations, and Knowledge Gaps; Allen Press: Lawrence, KS, USA, 2011. [Google Scholar]
  5. Pierson, F.B.; Spaeth, K.E.; Weltz, M.A.; Carlson, D.H. Hydrologic response of diverse western rangelands. Rangel. Ecol. Manag. 2002, 55, 558–570. [Google Scholar] [CrossRef]
  6. Blackburn, W.H. Impacts of grazing intensity and specialized grazing systems on watershed characteristics and responses. In Developing Strategies for Rangeland Management, 1st ed.; Gardner, B.D., Brothov, J.H., Eds.; CRC Press: Boca Raton, FL, USA, 1985; pp. 927–983. [Google Scholar]
  7. Teague, W.R.; Dowhower, S.L.; Baker, S.A.; Haile, N.; DeLaune, P.B.; Conover, D.M. Grazing management impacts on vegetation, soil biota and soil chemical, physical and hydrological properties in tall grass prairie. Agric. Ecosyst. Environ. 2011, 141, 310–322. [Google Scholar] [CrossRef]
  8. Briske, D.D.; Derner, J.D.; Brown, J.R.; Fuhlendorf, S.D.; Teague, W.R.; Havstad, K.M.; Gillen, R.L.; Ash, A.J.; Willms, W.D. Rotational grazing on rangelands: Reconciliation of perception and experimental evidence. Rangel. Ecol. Manag. 2008, 61, 3–17. [Google Scholar] [CrossRef] [Green Version]
  9. Byrnes, R.C.; Eastburn, D.J.; Tate, K.W.; Roche, L.M. A global meta-analysis of grazing impacts on soil health indicators. J. Environ. Qual. 2018, 47, 758–765. [Google Scholar] [CrossRef] [PubMed]
  10. Teague, R.; Barnes, M. Grazing management that regenerates ecosystem function and grazingland livelihoods. Afr. J. Range Forage Sci. 2017, 34, 77–86. [Google Scholar] [CrossRef]
  11. Augustine, D.J.; Derner, J.D.; Fernández-Giménez, M.E.; Porensky, L.M.; Wilmer, H.; Briske, D.D. Adaptive, multipaddock rotational grazing management: A ranch-scale assessment of effects on vegetation and livestock performance in semiarid rangeland. Rangel. Ecol. Manag. 2020, 73, 796–810. [Google Scholar] [CrossRef]
  12. Roche, L.M.; Cutts, B.B.; Derner, J.D.; Lubell, M.N.; Tate, K.W. On-ranch grazing strategies: Context for the rotational grazing dilemma. Rangel. Ecol. Manag. 2015, 68, 248–256. [Google Scholar] [CrossRef]
  13. Witt, C.; Wallander, S. Rotational Grazing Adoption by Cow-Calf Operations; Economic Information Bulletin No. (EIB-243); USDA-Economic Research Service: Washington, DC, USA, 2022; 38p. [CrossRef]
  14. Derner, J.D.; Smart, A.J.; Toombs, T.P.; Larsen, D.; McCulley, R.L.; Goodwin, J.; Sims, S.; Roche, L.M. Soil health as a transformational change agent for us grazing lands management. Rangel. Ecol. Manag. 2018, 71, 403–408. [Google Scholar] [CrossRef]
  15. Porensky, L.M.; Augustine, D.J.; Derner, J.D.; Wilmer, H.; Lipke, M.N.; Fernández-Giménez, M.E.; Briske, D.D. Collaborative adaptive rangeland management, multipaddock rotational grazing, and the story of the regrazed grass plant. Rangel. Ecol. Manag. 2021, 78, 127–141. [Google Scholar] [CrossRef]
  16. Spaeth, K.; Weltz, M.; Briske, D.D.; Jolley, L.W.; Metz, L.J.; Rossi, C. Rangeland CEAP: An assessment of natural resources conservation service practices. Rangelands 2013, 35, 2–10. [Google Scholar] [CrossRef] [Green Version]
  17. Chaparro, J.M.; Sheflin, A.M.; Manter, D.K.; Vivanco, J.M. Manipulating the soil microbiome to increase soil health and plant fertility. Biol. Fertil. Soils 2012, 48, 489–499. [Google Scholar] [CrossRef]
  18. Manter, D.; Delgado, J.; Moore-Kucera, J. Integrated soil health management: A framework for soil health, conservation and regeneration. In Managing Soil Health for Sustainable Agriculture; Reicosky, D., Ed.; Burleigh Dodds Science Publishing: Cambridge, UK, 2018; Volume 1, pp. 87–106. [Google Scholar]
  19. Zhao, F.; Ren, C.; Shelton, S.; Wang, Z.; Pang, G.; Chen, J.; Wang, J. Grazing intensity influence soil microbial communities and their implications for soil respiration. Agric. Ecosyst. Environ. 2017, 249, 50–56. [Google Scholar] [CrossRef]
  20. Wilkins, R.; Neal, A.G.; Fitzsimons, B.G.; Stevener, B.M.; Skow, K.L.; Anderson, R.E.; Dube, A.M. Current Land Use Trends, Texas land Trends. 2009. Available online: https://tpwd.texas.gov/business/feedback/meetings/2009/0827/agenda/item_3/media/exhibitc.pdf (accessed on 3 March 2023).
  21. Natural Resources Conservation Service—USDA. Land Resource Regions and Major Land Resource Areas of the United States, the Caribbean, and the Pacific Basin; U.S. Department of Agriculture, Agriculture Handbook 296; USDA-NRCS: Washington, DC, USA, 2022.
  22. Herrick, J.E.; Van Zee, J.W.; McCord, S.E.; Courtright, E.M.; Karl, J.W.; Burkett, L.M. Monitoring Manual for Grassland, Shrubland, and Savanna Ecosystems, 2nd ed.; Volume I: Core Methods; USDA-ARS Jornada Experimental Range: Las Cruces, NM, USA, 2017. [Google Scholar]
  23. Schindelbeck, R.R.; Moebius-Clune, B.N.; Moebius-Clune, D.J.; Kurtz, K.S.; van Es, H.M. Cornell University Comprehensive Assessment of Soil Health Laboratory Standard Operating Procedures; Cornell University: Geneva, NY, USA, 2016. [Google Scholar]
  24. Nelson, D.W.; Sommers, L.E. Total carbon, organic carbon, and organic matter. In Methods of Soil Analysis; Part 3; Sparks, D.L., Page, A.L., Helmke, P.A., Loeppert, R.H., Soltanpour, P.N., Tabatabai, M.A., Johnston, C.T., Sumner, M.E., Eds.; SSSA Book Series: Madison, WI, USA, 1996; pp. 961–1010. [Google Scholar]
  25. Weil, R.R.; Islam, K.R.; Stine, M.A.; Gruver, J.B.; Samson-Liebig, S.E. Estimating active carbon for soil quality assessment: A simplified method for laboratory and field use. Am. J. Altern. Agric. 2003, 18, 3–17. [Google Scholar]
  26. Fine, A.K.; van Es, H.M.; Schindelbeck, R.R. Statistics, scoring functions, and regional analysis of a comprehensive soil health database. Soil Sci. Soc. Am. J. 2017, 81, 589–601. [Google Scholar] [CrossRef] [Green Version]
  27. Kettler, T.A.; Doran, J.W.; Gilbert, T.L. Simplified method for soil particle-size determination to accompany soil-quality analyses. Soil Sci. Soc. Am. J. 2001, 65, 849–852. [Google Scholar] [CrossRef] [Green Version]
  28. Klindworth, A.; Pruesse, E.; Schweer, T.; Peplies, J.; Quast, C.; Horn, M.; Glöckner, F.O. Evaluation of general 16S ribosomal RNA gene PCR primers for classical and next-generation sequencing-based diversity studies. Nucleic Acids Res. 2013, 41, e1. [Google Scholar] [CrossRef]
  29. Leite-Mondin, M.; DiLegge, M.J.; Manter, D.K.; Weir, T.L.; Silva-Filho, M.C.; Vivanco, J.M. The gut microbiota composition of trichoplusia ni is altered by diet and may influence its polyphagous behavior. Sci. Rep. 2021, 11, 5786. [Google Scholar] [CrossRef]
  30. Martin, M. Cutadapt removes adapter sequences from high-throughput sequencing reads. EMBnet J. 2011, 17, 10–12. [Google Scholar] [CrossRef]
  31. Curry, K.D.; Wang, Q.; Nute, M.G.; Tyshaieva, A.; Reeves, E.; Soriano, S.; Wu, Q.; Graeber, E.; Finzer, P.; Mendling, W.; et al. EMU: Species-level microbial community profiling of full-length 16S RNA Oxford Nanopore sequencing data. Nat. Methods 2022, 19, 845–853. [Google Scholar] [CrossRef] [PubMed]
  32. Li, H. Minimap2: Pairwise alignment for nucleotide sequences. Bioinformatics 2018, 34, 3094–3100. [Google Scholar] [CrossRef] [PubMed] [Green Version]
  33. Li, H.; Handsaker, B.; Wysoker, A.; Fennell, T.; Ruan, J.; Homer, N.; Marth, G.; Abecasis, G.; Durbin, R. The sequence alignment/map format and SAMtools. Bioinformatics 2009, 25, 2078–2079. [Google Scholar] [CrossRef] [Green Version]
  34. Douglas, G.M.; Maffei, V.J.; Zaneveld, J.R.; Yurgel, S.N.; Brown, J.R.; Taylor, C.M.; Huttenhower, C.; Langille, M.G. PICRUSt2 for prediction of metagenome functions. Nat. Biotechnol. 2020, 38, 685–688. [Google Scholar] [CrossRef] [PubMed]
  35. Finn, R.D.; Clements, J.; Eddy, S.R. HMMER web server: Interactive sequence similarity searching. Nucleic Acids Res. 2011, 39, W29–W37. [Google Scholar] [CrossRef] [Green Version]
  36. Barbera, P.; Kozlov, A.M.; Czech, L.; Morel, B.; Darriba, D.; Flouri, T.; Stamatakis, A. EPA-NG: Massively parallel evolutionary placement of genetic sequences. Syst. Biol. 2019, 68, 365–369. [Google Scholar] [CrossRef]
  37. Louca, S.; Doebeli, M. Efficient comparative phylogenetics on large trees. Bioinformatics 2018, 34, 1053–1055. [Google Scholar] [CrossRef] [Green Version]
  38. Kuznetsova, A.; Brockhoff, P.B.; Christensen, R.H.B. LMERtest package: Tests in linear mixed effects models. J. Stat. Softw. 2017, 82, 1–26. [Google Scholar] [CrossRef] [Green Version]
  39. R Core Team. R: A Language and Environment for Statistical Computing; R Foundation for Statistical Computing: Vienna, Austria, 2021. [Google Scholar]
  40. Liu, C.; Cui, Y.; Li, X.; Yao, M. Miroeco: An R package for data mining in microbial community ecology. FEMS Microbiol. Ecol. 2021, 97, fiaa255. [Google Scholar] [CrossRef]
  41. Liu, C.; Li, C.; Jiang, Y.; Zeng, R.J.; Yao, M.; Li, X. A guide for comparing microbial co-occurrence networks. iMeta 2023, 2, e71. [Google Scholar] [CrossRef]
  42. Deng, Y.; Jiang, Y.-H.; Yang, Y.; He, Z.; Luo, F.; Zhou, J. Molecular ecological network analyses. BMC Bioinform. 2012, 13, 113. [Google Scholar] [CrossRef] [PubMed] [Green Version]
  43. Olesen, J.M.; Bascompte, J.; Dupont, Y.L.; Jordano, P. The modularity of pollination networks. Proc. Natl. Acad. Sci. USA 2007, 104, 19891–19896. [Google Scholar] [CrossRef] [PubMed]
  44. Zhou, H.; Gao, Y.; Jia, X.; Wang, M.; Ding, J.; Cheng, L.; Bao, F.; Wu, B. Network analysis reveals the strengthening of microbial interaction in biological soil crust development in the Mu Us sandy land, northwestern China. Soil Biol. Biochem. 2020, 144, 107782. [Google Scholar] [CrossRef]
  45. Stinner, D.H.; Stinner, B.R.; Martsolf, E. Biodiversity as an organizing principle in agroecosystem management: Case studies of holistic resource management practitioners in the USA. Agric. Ecosyst. Environ. 1997, 62, 199–213. [Google Scholar] [CrossRef]
  46. Vermeire, L.T.; Gillen, R.L.; Bidwell, T.G. Ecology and Management of Western Ragweed on Rangeland; Cooperative Extension Service, Division of Agricultural Sciences and Natural Resources, Oklahoma State University: Stillwater, OK, USA, 2017. [Google Scholar]
  47. Skinner, R.H. High biomass removal limits carbon sequestration potential of mature temperate pastures. J. Environ. Qual. 2008, 37, 1319–1326. [Google Scholar] [CrossRef] [PubMed] [Green Version]
  48. Natural Resources Conservation Service, United States Department of Agriculture. Soil Survey Geographic (SSURGO) Database. Available online: https://websoilsurvey.sc.egov.usda.gov/App/HomePage.htm (accessed on 5 September 2018).
  49. Mosier, S.; Apfelbaum, S.; Byck, P.; Calderon, F.; Teague, R.; Thompson, R.; Cotrufo, M.F. Adaptive multi-paddock grazing enhances soil carbon and nitrogen stocks and stabilization through mineral association in southeastern U.S. grazing lands. J. Environ. Manag. 2021, 288, 112409. [Google Scholar] [CrossRef]
  50. Waters, C.M.; Orgill, S.E.; Melville, G.J.; Toole, I.D.; Smith, W.J. Management of grazing intensity in the semi-arid rangelands of southern Australia: Effects on soil and biodiversity. Land Degrad. Dev. 2017, 28, 1363–1375. [Google Scholar] [CrossRef]
  51. Gregorich, E.G.; Carter, M.R.; Angers, D.A.; Monreal, C.M.; Ellert, B.H. Towards a minimum data set to assess soil organic matter quality in agricultural soils. Can. J. Soil Sci. 1994, 74, 367–385. [Google Scholar] [CrossRef] [Green Version]
  52. Magdoff, F.; Van Es, H.M. Building Soils for Better Crops: Sustainable Soil Management, 3rd ed.; Sustainable Agriculture Research and Education (SARE) Program; SARE: Fullerton CA, USA, 2009. [Google Scholar]
  53. Franzluebbers, A.J. Assessment and interpretation of soil-test biological activity. In Soil Health Series: Volume 2 Laboratory Methods for Soil Health Analysis; Karlen, D.L., Stott, E.E., Mikha, M.M., Eds.; ASA, CSSA, SSSA Books; Wiley: Hoboken, NJ, USA, 2021; pp. 126–151. [Google Scholar] [CrossRef]
  54. Culman, S.W.; Hurisso, T.T.; Wade, J. Permanganate oxidizable carbon. In Soil Health Series: Volume 2 Laboratory Methods for Soil Health Analysis; Karlen, D.L., Stott, E.E., Mikha, M.M., Eds.; ASA, CSSA, SSSA Books; Wiley: Hoboken, NJ, USA, 2021; pp. 152–175. [Google Scholar] [CrossRef]
  55. Xun, W.; Yan, R.; Ren, Y.; Jin, D.; Xiong, W.; Zhang, G.; Cui, Z.; Xin, X.; Zhang, R. Grazing-induced microbiome alterations drive soil organic carbon turnover and productivity in meadow steppe. Microbiome 2018, 6, 170. [Google Scholar] [CrossRef] [Green Version]
  56. Klumpp, K.; Fontaine, S.; Attard, E.; Le Roux, X.; Gleixner, G.; Soussana, J.-F. Grazing triggers soil carbon loss by altering plant roots and their control on soil microbial community. J. Ecol. 2009, 97, 876–885. [Google Scholar] [CrossRef]
  57. Su, J.; Ji, W.; Sun, X.; Wang, H.; Kang, Y.; Yao, B. Effects of different management practices on soil microbial community structure and function in alpine grassland. J. Environ. Manag. 2023, 327, 116859. [Google Scholar] [CrossRef] [PubMed]
  58. Sengupta, A.; Hariharan, J.; Grewal, P.S.; Dick, W.A. Bacterial community dissimilarity in soils is driven by long-term land-use practices. Agrosyst. Geosci. Environ. 2020, 3, e20031. [Google Scholar] [CrossRef] [Green Version]
  59. Fierer, N.; Leff, J.W.; Adams, B.J.; Nielsen, U.N.; Bates, S.T.; Lauber, C.L.; Owens, S.; Gilbert, J.A.; Wall, D.H.; Caporaso, J.G. Cross-biome metagenomic analyses of soil microbial communities and their functional attributes. Proc. Natl. Acad. Sci. USA 2012, 109, 21390–21395. [Google Scholar] [CrossRef] [PubMed]
  60. Fanin, N.; Kardol, P.; Farrell, M.; Nilsson, M.-C.; Gundale, M.J.; Wardle, D.A. The ratio of Gram-positive to Gram-negative bacterial PLFA markers as an indicator of carbon availability in organic soils. Soil Biol. Biochem. 2019, 128, 111–114. [Google Scholar] [CrossRef]
  61. Kramer, C.; Gleixner, G. Soil organic matter in soil depth profiles: Distinct carbon preferences of microbial groups during carbon transformation. Soil Biol. Biochem. 2008, 40, 425–433. [Google Scholar] [CrossRef]
  62. Zhang, Q.; Liu, K.; Shao, X.; Li, H.; He, Y.; Sirimuji; Wang, B. Microbes require a relatively long time to recover in natural succession restoration of degraded grassland ecosystems. Ecol. Indic. 2021, 129, 107881. [Google Scholar] [CrossRef]
  63. Piao, Z.; Yang, L.; Zhao, L.; Yin, S. Actinobacterial community structure in soils receiving long-term organic and inorganic amendments. Appl. Environ. Microbiol. 2008, 74, 526–530. [Google Scholar] [CrossRef] [Green Version]
  64. de Menezes Alexandre, B.; Prendergast-Miller Miranda, T.; Poonpatana, P.; Farrell, M.; Bissett, A.; Macdonald Lynne, M.; Toscas, P.; Richardson Alan, E.; Thrall Peter, H. C/N ratio drives soil actinobacterial cellobiohydrolase gene diversity. Appl. Environ. Microbiol. 2015, 81, 3016–3028. [Google Scholar] [CrossRef] [Green Version]
  65. Alessi, A.M.; Bird, S.M.; Bennett, J.P.; Oates, N.C.; Li, Y.; Dowle, A.A.; Polikarpov, I.; Young, J.P.W.; McQueen-Mason, S.J.; Bruce, N.C. Revealing the insoluble metasecretome of lignocellulose-degrading microbial communities. Sci. Rep. 2017, 7, 2356. [Google Scholar] [CrossRef] [Green Version]
  66. Lynd, L.R.; Welmer, P.J.; van Zyl, W.H.; Pretorius, I.S. Microbial cellulose utilization: Fundamental and biotechnology. Microbiol. Mol. Biol. Rev. 2002, 66, 506–577. [Google Scholar] [CrossRef] [Green Version]
  67. Eldridge, D.J.; Travers, S.K.; Val, J.; Wang, J.-T.; Liu, H.; Singh, B.K.; Delgado-Baquerizo, M. Grazing regulates the spatial heterogeneity of soil microbial communities within ecological networks. Ecosystems 2020, 23, 932–942. [Google Scholar] [CrossRef]
  68. Röttjers, L.; Faust, K. From hairballs to hypotheses–biological insights from microbial networks. FEMS Microbiol. Rev. 2018, 42, 761–780. [Google Scholar] [CrossRef] [PubMed] [Green Version]
  69. Deng, Y.; Zhang, P.; Qin, Y.; Tu, Q.; Yang, Y.; He, Z.; Schadt, C.W.; Zhou, J. Network succession reveals the importance of competition in response to emulsified vegetable oil amendment for uranium bioremediation. Environ. Microbiol. 2016, 18, 205–218. [Google Scholar] [CrossRef]
  70. Ghoul, M.; Mitri, S. The ecology and evolution of microbial competition. Trends Microbiol. 2016, 24, 833–845. [Google Scholar] [CrossRef]
  71. Newman, M.E.J. Modularity and community structure in networks. Proc. Natl. Acad. Sci. USA 2006, 103, 8577–8582. [Google Scholar] [CrossRef]
  72. Paine, R.T. A note on trophic complexity and community stability. Am. Nat. 1969, 103, 91–93. [Google Scholar] [CrossRef]
  73. Berry, D.; Widder, S. Deciphering microbial interactions and detecting keystone species with co-occurrence networks. Front. Microbiol. 2014, 5, 219. [Google Scholar] [CrossRef] [Green Version]
  74. Dong, G.; Fan, J.; Shekhtman, L.M.; Shai, S.; Du, R.; Tian, L.; Chen, X.; Stanley, H.E.; Havlin, S. Resilience of networks with community structure behaves as if under an external field. Proc. Natl. Acad. Sci. USA 2018, 115, 6911–6915. [Google Scholar] [CrossRef] [Green Version]
  75. Almeida, R.F.; Naves, E.R.; Mota, R.P. Soil quality: Enzymatic activity of b-glucosidase. Glob. J. Agric. Res. Rev. 2017, 3, 146–150. [Google Scholar]
Figure 1. Map showing the three ranches and each sampling transect (red: HIGH, green: MED, blue: LOW).
Land 12 01517 g001
Figure 2. Box and whisker plot of vegetation relative abundances by plant functional group and ranch. LOW: low stocking density, continuous grazing; MED: medium stocking density, medium herd rotation frequency; HIGH: high stocking density, high herd rotation frequency. Percentages were calculated from the total number of individuals for each transect (LOW, n = 3; MED & HIGH, n = 5). Each box depicts the interquartile range (IQR), where the bottom of the bar is the 25th percentile, the middle bar is the 50th percentile or median, and the top of the bar is the 75th percentile; whiskers extend 1.5-times above or below the IQR range, and points outside this range are outliers. Different letters within each plant functional group indicate significant differences between ranches.
Land 12 01517 g002
Figure 3. db-RDA for vegetation data. Each point represents an individual transect at each ranch (LOW, n = 3; MED and HIGH, n = 5). Ordination was constructed using Bray-Curtis distances of plant species relative abundances. Vectors are the top species scores on the first two axes. LOW: low stocking density, continuous grazing; MED: medium stocking density, medium herd rotation frequency; HIGH: high stocking density, high herd rotation frequency.
Land 12 01517 g003
Figure 4. Relative abundances for the ten most abundant bacterial phyla by the ranch. No differences were observed between ranches (p > 0.05). LOW: low stocking density, continuous grazing; MED: medium stocking density, medium herd rotation frequency; HIGH: high stocking density, high herd rotation frequency.
Land 12 01517 g004
Figure 5. db-RDA for 16S rRNA amplicon sequencing. Ordination was constructed using Bray-Curtis distances of square-root transformed genera relative abundances. Vectors are the top species scores on the first two axes. LOW: low stocking density, continuous grazing; MED: medium stocking density, medium herd rotation frequency; HIGH: high stocking density, high herd rotation frequency.
Land 12 01517 g005
Figure 6. Bacterial correlation networks for the three different ranches (AC) and global network properties (D). The node size is proportional to node connectivity and node color represents different modules. Blue lines indicate positive interactions and red lines indicate negative interactions. (A) LOW: low stocking density, continuous grazing; (B) MED: medium stocking density, medium herd rotation frequency; (C) HIGH: high stocking density, high herd rotation frequency.
Land 12 01517 g006
Figure 7. Functional relative abundances for the bacteria with different nutrient cycling enzymes. Bars with significantly different values (p < 0.05) are indicated by a different letter. LOW: low stocking density, continuous grazing; MED: medium stocking density, medium herd rotation frequency; HIGH: high stocking density, high herd rotation frequency. See Figure 2 for a description of each box and whisker. BG: β-glucosidase (EC3.2.1.21), CBH: cellobiohydrolase (EC3.2.1.91); AMI: amidase (EC3.5.1.4); LAP: leucyl aminopeptidase (EC3.4.11.1); NAG: chitinase (EC3.2.1.14); URE: urease (EC3.5.1.15); AP: alkaline phosphatase (EC3.1.3.1).
Land 12 01517 g007
Table 1. Ranch and grazing management descriptions.
RanchRanch Size (ha)Paddock Size (ha)Animal Units 1 (AU)Stocking Density (AU ha−1)Grazing Period and Stocking Rate
Grazing Period (Days)Rest
Period (Days)
Season (Days)Total Grazing (Days)Total Grazing (Months)Stocking Rate
(AUM ha−1)
HIGH574741400097.40.2552.53652.50.088
MED135838877221060365311.73.4
LOW4856500960.23650365365122
1 cow/calf: 1 AU, steer: 0.8 AU, yearling: 0.7 AU, bull: 1.2 AU.
Table 2. ANOVA table for plant species richness by functional groups and total. Arithmetic means and individual standard deviations (SD) for each ranch management with significantly different values indicated by a different letter.
Dependent
Variable
F-ValuePr (>F)Mean (SD)
LOWMEDHIGH
Introduced4.2310.0471.33 (0.58) a0.40 (0.55) a1.20 (0.50) a
Forbs12.970.0022.33 (0.58) ab0.20 (0.45) b4.60 (2.16) a
Grass-like1.0580.3830.667 (0.58) a0.60 (0.55) a0.20 (0.50) a
Cool-season grasses4.2310.0471.67 (0.58) a0.60 (0.55) b0.80 (0.50) ab
Short grasses0.7690.4890 (0) a0.40 (0.55) a0.20 (0.50) a
Medium grasses3.1230.0881.67 (0.58) a4.20 (1.79) a2.80 (1.41) a
Tall grasses1.0580.3832.33 (1.15) a2.20 (1.30) a1.40 (0.58) a
Total0.7420.50110.0 (2.00) a8.60 (4.39) a11.2 (2.31) a
Table 3. ANOVA table for soil properties. Arithmetic means and individual standard deviations (SD) for each ranch management with significantly different values are indicated by a different letter.
Dependent VariableF-ValuePr (>F)Mean (SD)
LOWMEDHIGH
Soil organic matter (%) *11.5<0.0012.18 (0.32) b2.77 (0.48) a2.14 (0.41) b
Respiration
(mg CO2 g−1 soil)
6.2560.0040.45 (0.06) ab0.48 (0.08) a0.40 (0.05) b
Active C (ppm) *1.1770.318377 (75.3) a412 (75.1) a357 (86.6) a
pH3.590.0366.32 (0.15) ab6.22 (0.19) b6.37 (0.12) a
* clay + silt covariate included in the final model.
Table 4. ANOVA table for soil microbial abundance and microbial α-diversity. Arithmetic means and individual standard deviations (SD) for each ranch management with significantly different values are indicated by a different letter.
Dependent VariableF-ValuePr (>F)Mean (SD)
LOWMEDHIGH
qPCR
(log10 16S copies g−1 soil)
1.740.1898.79 (0.347) a8.96 (0.306) a8.73 (0.455) a
Species Richness0.6610.522183 (47.1) a196 (28.7) a198 (33.3) a
Shannon’s Diversity Index0.3950.6763.95 (0.323) a4.04 (0.246) a3.97 (0.231) a
Simpson’s Diversity Index0.1480.86319.9 (7.45) a20.9 (7.38) a18.9 (7.78) a
Disclaimer/Publisher’s Note: The statements, opinions and data contained in all publications are solely those of the individual author(s) and contributor(s) and not of MDPI and/or the editor(s). MDPI and/or the editor(s) disclaim responsibility for any injury to people or property resulting from any ideas, methods, instructions or products referred to in the content.

