Abstract
In the current context of aging and urbanization, the rapid increase in the prevalences of disabilities (PoDs) has become an important consideration in healthy urban planning. Previous studies have focused on the spatial prevalence of total disabilities based on large-scale survey data. However, few studies have examined different types of PoDs and the factors contributing to spatial disparities in micro-urban units at the municipal level. This study aims to fill this gap by exploring the spatial PoDs, related built environments, and socio-economic factors across the Tianjin municipality in 2020. The study employed Getis–Ord GI* analysis to identify urban-rural disparities and ordinary least square (OLS) and quantile regression (QR) analyses to model the heterogeneous effects of the spatial PoDs-associated factors across quantiles. The results reveal that the PoDs, especially of visual, hearing, and limb disabilities, in the urban center, are significantly higher than those in rural areas, which is inconsistent with previous studies conducted in China. The urbanization rate, medical facilities, and education facilities significantly reduced the total PoDs, while the elderly population, migrant population, bus route density, and road density significantly increased it. The built environments and socio-economic factors had heterogeneous impacts on different types of PoDs, which were summarized into three categories based on these dominant factors: (1) visual and hearing disabilities were medical facility-dominated; (2) intellectual and limb disabilities were urbanization- and aging-dominated; and (3) mental and speech disabilities were migrant-dominated. This study provides scientific advice to adapt to the expected increase in demand for disability-related medical and public health services and to expand the range of effective strategies and interventions aimed at preventing the deterioration of disability and improving disability management in the population.
1. Introduction
Approximately 1.3 billion individuals, or 16% of the global population, live with some form of disability. The increasing prevalences of disabilities (PoDs), coupled with factors such as an aging population, advancements in medical technology, evolving definitions of disability, environmental degradation, and unhealthy lifestyles, have garnered significant scholarly attention. Previous studies have explored the spatial distribution in PoDs that varies significantly across the globe, continents, countries, provinces, and cities [1,2]. Moreover, the prevalence of specific disability types and the factors influencing their spatial distribution exhibit substantial variation [3]. However, given the significant disparities in rural–urban development, there is currently limited research on the PoDs within cities. Furthermore, there is a lack of in-depth analysis on the incidence of different types of disabilities and their associated factors. Therefore, there is a pressing need for more comprehensive studies to enhance our understanding of disability prevalence and its multifaceted aspects within urban settings.
1.1. Urban–Rural Disparities of PoDs
Evaluations of spatial disparities in PoDs at different scales have yielded inconsistent results. Globally, PoDs are lower in the Global North and higher in the Global South due to factors such as limited healthcare access, poverty, malnutrition, insufficient education and employment opportunities, and unsafe living conditions [4]. Urban–rural disparities in PoDs are prevalent in the Global South. Velayutham et al. demonstrated that disability rates in India were higher in rural areas compared to urban ones (5593 vs. 4181 per 100,000) [5]. Zheng et al. found that, between 1987 and 2006 in China, PoDs in rural areas were consistently higher than in urban areas, exhibiting a notable upward trend [6]. A study in Monaco also revealed that factors such as older age, lower education levels, unemployment, being single, and living in rural areas were associated with higher prevalence rates of disability, which varied widely geographically [7].
Different types of PoDs also vary between urban and rural settings. In the United States, for instance, adults living in rural counties were 9% more likely to report having a disability in 2016, 24% more likely to report having three or more disabilities, and 7% to 35% more likely to report cognition and hearing disabilities than those living in large metropolitan centers [8]. Hajjioui et al. found that individuals living in rural areas in Morocco were associated with higher PoDs, with visual and motor impairments being the most common disability modalities [7]. Research on limb disability shows conflicting findings: urban areas may exhibit diverse limb disabilities from aging, accidents, violence, and congenital conditions [9], while rural areas may have higher rates due to agricultural accidents, lack of safety regulations, and limited access to rehabilitation services [10]. Research findings on the prevalence of intellectual disabilities in urban and rural areas are inconclusive, as various factors such as genetic conditions, prenatal care, and environmental factors contribute to the complexity of the relationship [11,12]. Furthermore, urban areas may have higher rates of mental health disorders and emotional disabilities due to various stressors, lifestyle factors, and the availability of mental health services [13].
1.2. Associated Factors Contributing to Urban–Rural Disparities of PoDs
Differences in PoDs between urban and rural areas primarily stem from variations in socio-economic and built environments. [5,6] On one hand, research on disability, which originated in the medical field, emphasized the medicalization of disability as a significant factor in society’s marginal treatment of disability issues. Consequently, disability-related medical and public health services play a crucial role in the rehabilitation and treatment of disabled individuals, as well as in the urban–rural disability prevalence gap [14]. A 1997 study found that communicable, maternal, perinatal, and nutritional disorders accounted for 43.9% of the causes of death and disability worldwide [15]. These disorders disproportionately burden rural areas, particularly in the Global South [16]. The World Health Organization noted that the rising PoDs were attributable to aging populations, higher risks of disability among older individuals, and the global increase in chronic health conditions such as diabetes, cardiovascular disease, cancer, and mental health disorders. Numerous studies confirmed that a wider prevalence gap between rural and urban areas is observed among older groups, particularly concerning hearing, visual, and limb disabilities [17]. Due to persistent inefficiencies and uneven resource distribution, as well as differences in economics, healthcare, urbanization, and population density between urban and rural areas, it is challenging to foresee significant improvements in care services and elderly care in rural areas anytime soon [9]. Urbanization and industrialization, reflected in the development of transport systems such as station density and road network density, introduce environmental factors that may contribute to disability incidence. For example, higher pollution levels or exposure to toxins in densely populated areas could potentially impact respiratory health, leading to respiratory disabilities [18]. Similarly, increased traffic density might raise the risk of accidents, resulting in various types of disabilities [19].
On the other hand, the social model reconceptualized the medical model, positing that social, attitudinal, and environmental barriers in society play a significant role in disabling individuals with physical and/or mental impairments [20]. This perspective raised academic concerns about whether rural and urban contexts are more or less likely to facilitate participation and social inclusion for those with or without disabilities. It also determines the role of social participation in shaping subjective feelings of social integration. People living in rural areas are more likely to be less educated, unemployed, single, and alienated from friends and relatives, factors associated with higher disability prevalence rates [9]. Individuals working in rural areas or rural migrants often encounter challenging work environments and perceptions of compensability, which significantly contribute to the incidence of chronic disability. Moreover, they may encounter barriers in accessing social activities, community events, or maintaining social connections, leading to social isolation and negative impacts on mental health, such as higher rates of depression, anxiety, and reduced overall well-being [21].
1.3. Research Gaps
To summarize, most empirical studies predominantly support disparities in disability prevalence attributed to unequal development and urban–rural heterogeneity across various disability types. However, these studies have been limited to an urban/rural binary perspective and seldom visualize spatial differences in disability prevalence based on urban spatial structure. Furthermore, explaining the spatial distribution of different types of disability within urban spaces has proven challenging. Secondly, although studies have investigated the influence of socio-economic factors and built environments on disparities in disability prevalence between urban and rural areas, there is a limited exploration of the heterogeneity of these effects across different disability types. Furthermore, the diverse spatial patterns of disability prevalence, especially in less developed countries and regions, have received insufficient attention.
As a developing country with the world’s largest disabled population, China has always prioritized disability issues in the World Health Organization’s agenda. This study choses Tianjin, a representative large city in China, as the research area. It divides Tianjin into urban centers, urban fringes, and rural areas to examine the spatial patterns of PoDs and urban–rural disparities in the prevalence of different disability types within the municipality, using aggregated registration information from the Tianjin Disability Database 2020. It also analyzes the impacts of related socio-economic factors and built environments on the spatial prevalence of different disability types, extracting various dominant elements. Specifically, two key research questions will be answered: (1) Whether significant urban–rural disparities exist in the spatial distribution of PoDs, and which disability types are concentrated in urban areas, urban fringes, or rural areas? (2) What are the associated factors influencing PoDs, and which factors dominate for different disability types?
2. Methods
2.1. Study Area
Tianjin, a significant industrial megacity southeast of Beijing, was chosen as the study area. According to the Tianjin Master Plan (2021–2035), Tianjin’s sub-districts can be classified into three regions: urban center (the central urban area, encompassing inner circles), urban fringe (located between urban and rural areas surrounding the central urban area), and rural areas (outer city regions and predominantly rural areas) (Figure 1). In 2020, the number of certified disabled individuals reached approximately 350,000, representing a diverse cross-section of ages, genders, and types of disabilities. There are seven types of disabilities, including up to 235,200 persons with limb disabilities, fewer than 10,000 individuals with speech and multiple disabilities, and between 20,000 and 30,000 persons with intellectual, mental, hearing, and visual disabilities (Figure 2).
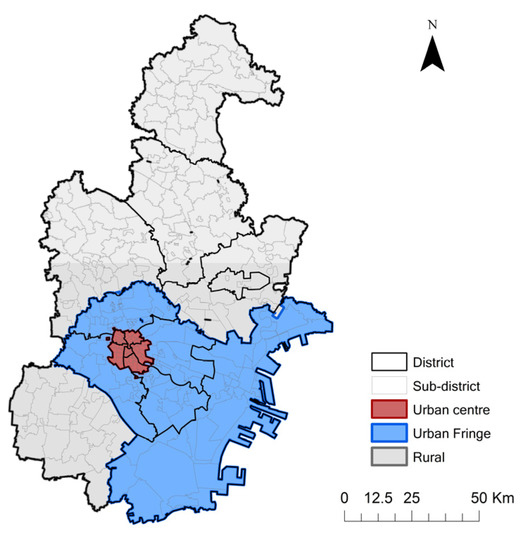
Figure 1.
The administrative structure and classification of Tianjin municipality.
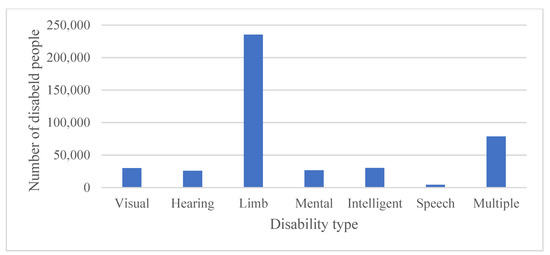
Figure 2.
The number of disabled people based on disability types in Tianjin.
2.2. Data Collection
This study utilized four primary data sources. Firstly, we collated the spatial location data of different types of certified disabled people at the sub-district level from the Tianjin Disability Database. Secondly, we collected information on the location and descriptors of disability service facilities, such as disability schools, disabilities daycare centers, rehabilitation centers, integrated disabled services, and disability employment services, including their type, year of construction, area, medical and nursing personnel numbers, from the Database of Disabled Facilities in Tianjin. Both types of data sources used in this study were obtained through a cooperation project with the Tianjin Disabled Persons’ Federation (TDPD). The project aimed to assess the adequacy of public service facility planning for individuals with disabilities, primarily based on the distribution of the disabled population. The details of the data processing have been described elsewhere [22]. Thirdly, we obtained location data on public service facilities from Gaode Map POI data (Gaode Map, 2020). Fourthly, we acquired population data at the sub-district (or town) level from the Seventh Census in 2020. Economic and urbanization data were drawn from the Tianjin district-level statistical yearbook for 2021.
2.3. Hotspot Analysis of PoDs
We initially performed a normality test on both the total PoDs and different types of PoDs. The results revealed that neither the total PoDs nor individual types of PoDs followed a normal distribution. This non-normal distribution made them suitable for the application of the Getis–Ord Gi statistics. Subsequently, we then utilized the Getis–Ord statistic to identify PoD hotspots. This test assesses whether the clusters of crashes are statistically significant. The resultant z value expressed either high or low values of neighboring features. Features with a high value may not be a statistically significant hot spot. To be a statistically significant hotspot, a feature will have a high value and be surrounded by other features with high values as well. A positive z score indicates a hotspot, and the larger the z scores, the more intense the clustering, while a z score indicates cold spot and the smaller the z score indicates the more intense clustering of low values (cold spot) [23]. The Getis–Ord General G and Getis–Ord local statistics are given as Equations (1) and (2):
where n is the number of spatial units, xi is the attribute value for feature i, xj is the attribute value for feature j, and wij is the spatial weight between feature i and j.
2.4. Modeling the Associated Factors of PoDs
2.4.1. Variables
(1) Dependent variables
The number and proportion of individuals with disabilities serve to elucidate the connection between disability and socio-economic and built environments. It is important to highlight that the proportion of persons with disabilities signifies the prevalence of disability and can offer more insightful information when examined within microspatial units of cities, considering the significant variation in total population sizes. In this study, we used total PoDs and different types of PoDs as dependent variables. PoDs were calculated by determining the percentage of persons with disabilities (or persons with various types of disabilities) per sub-district, relative to the total population.
(2) Independent variables
To effectively address the challenges of disability prevention and rehabilitation, it is imperative to have a comprehensive understanding of its associated factors. Building upon existing studies on the prevalence of disability [24], this study incorporates various socioeconomic variables. Per capita GDP serves as an indicator of overall economic conditions, influencing resource availability, services, and support systems for individuals with disabilities. The urbanization rate reflects the extent of urban development and population concentration in urban areas. The elderly population rate was included due to the association between aging and a higher probability of disability and age-related impairments. Moreover, the migrant population rate was considered to explore the impact of factors such as language barriers, cultural differences, and limited resource access on the well-being and inclusion of migrants with disabilities.
The study also incorporates several built environment factors such as access to public services, traffic density, and access to disability service facilities. These factors fall within the category of built environments, which focuses on the services that directly impact the accessibility and quality of life for persons with disabilities. Basic public services, encompassing education, medical, commercial, and sports facilities, are vital for ensuring equal opportunities and inclusion. Transport density influences mobility and access to employment, education, and healthcare facilities. Moreover, public services specifically designed for persons with disabilities, such as special schools, nursing centers, rehabilitation facilities, and employment service facilities, play a crucial role in promoting independent living and social participation.
A detailed description of variables is presented in Table 1, and all variables were calculated at the sub-district level. To improve the distributional symmetry of the variables and mitigate potential heteroskedasticity issues, a log transformation is applied to all variables.

Table 1.
The associated factors of PoDs.
2.4.2. Quantile Regression (QR)
Ordinary least square (OLS) regression is the minimum variance unbiased estimator, which requires the random disturbance term of the OLS regression to have a zero mean and be identically distributed (i.i.d.). Additionally, the error term must follow a normal distribution. However, De Silva et al. (2016) argue that these assumptions do not hold true in real economic life, as the data for socioeconomic indicators may exhibit different distributional patterns [25]. To overcome the limitations of OLS analysis, the quantile regression (QR) estimation method, established by Koenker and Bassett Jr (1978), is widely employed [26].
There are three primary motivations for implementing QR estimation. First, QR does not require the presence of a moment function assumption. Second, QR offers more accurate and robust findings in the presence of outliers and heavy-tailed distributions, as demonstrated by Bera et al. [27]. Finally, the QR method does not impose any distributional assumptions, as noted by Sherwood an Wang (2016) [28].
This study employs the QR approach to examine the associated factors of PoDs. The quantile estimator is obtained by solving the following optimization problem, as shown in Equation (3):
For the quantile (0 << 1), where is the dependent variable and is k by 1 vector of the explanatory variables.
3. Results and Discussion
3.1. Urban–Rural Disparities of PoDs
3.1.1. Spatial Pattern of Total PoDs
In this study, we employed the natural breaks method to examine the spatial distribution of the PoDs at the sub-district level in Tianjin, as depicted in Figure 3 (left). The findings revealed that disabled individuals were predominantly concentrated in the urban center, with only a handful of sub-districts on the urban periphery exhibiting substantial disabled populations. In contrast, rural areas generally displayed low PoDs. Moreover, using Getis–Ord General G and Getis–Ord GI* analyses, we determined that PoDs demonstrated a significant spatial clustering pattern. As illustrated in Figure 3 (right), the distribution of PoDs in Tianjin displayed persistent concentration and relative dispersion, with hotspots mainly situated in the urban core and a limited number of rural areas. Conversely, cold spots were dispersed across the urban fringes and suburban rural areas.
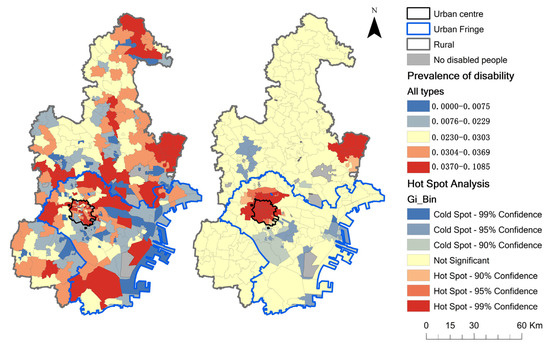
Figure 3.
Spatial distribution and cold and hot spot spatial pattern of the PoDs in Tianjin.
3.1.2. Spatial Pattern of Different Types of PoDs
As illustrated in Figure 4, the spatial patterns of different types of PoDs displayed noticeable urban–rural disparities. The global spatial autocorrelation results demonstrated that the Getis–Ord General G value for all types of PoDs was greater than 0 and passed the significance test, signifying the presence of spatial autocorrelation in this study (Table 2).
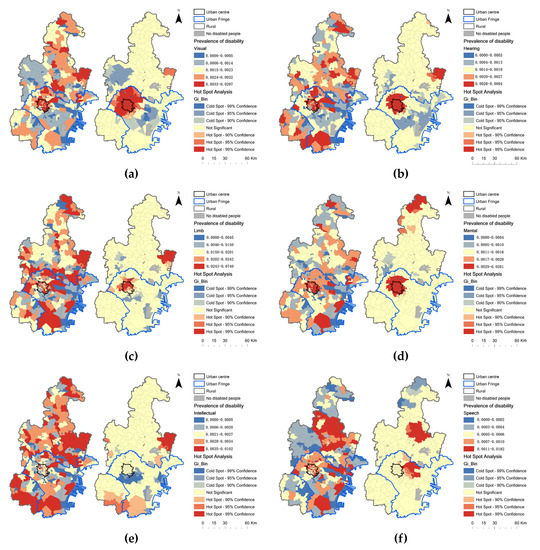
Figure 4.
Spatial distribution and cold and hot spot spatial pattern of different types of PoDs in Tianjin. (a) PoD_visual; (b) PoD_hearing; (c) PoD_limb; (d) PoD_mental; (e) PoD_intellectual; (f) PoD_speech.
Table 2.
Getis–Ord General G and the significance of PoDs.
The hotspots for the prevalence of visual (PoD_visual, Figure 4a), hearing (PoD_hearing, Figure 4b), and limb (PoD_limb, Figure 4c) disabilities were situated in the urban center, with PoDs exceeding 0.033% (visual), 0.028% (hearing), and 2.43% (limb). Cold spots were located in urban fringes with PoDs below 0.5% (visual), 0.3% (hearing), and 4.5% (limb).
The distribution of hotspots for the prevalence of mental disabilities (PoD_mental) (Figure 4d) was relatively dispersed, with significant hotspots primarily concentrated in the urban center, where the PoDs for all sub-districts was approximately over 2.9%, and in remote rural areas with PoDs exceeding 1.7% for some sub-districts. Cold spots were identified in suburban rural areas with PoDs below 0.4%.
The hotspots for the prevalence of intellectual and speech disabilities were found in rural areas. The prevalence of intellectual disabilities (PoD_intellectual) (Figure 4e) had significant hotspots mainly concentrated in suburban rural areas with PoDs exceeding 0.35%. Cold spots were identified in urban fringes with PoDs for most sub-districts below 0.05%. The hotspots for the prevalence of speech disability (PoD_speech) (Figure 4f) were concentrated in urban fringes with PoDs over 0.07% and in the north-central rural area with PoDs exceeding 0.11%. Cold spots were located in remote rural areas with PoDs below 0.02%.
Overall, PoD_limb was significantly higher than that of the other disability types, while PoD_speech was notably lower. The urban center and its neighboring areas were the primary hotspots for PoD_visual, PoD_hearing, PoD_limb, and PoD_mental in Tianjin, with urban fringes being hotspots for PoD_speech, and rural areas for PoD_intellectual and PoD_speech.
3.2. Associated Factors of PoDs
3.2.1. Associated Factors of Total PoDs
QR was utilized to investigate whether socio-economic factors and the built environment were associated factors of PoDs. The results are presented in Table 3, which reports the 10th, 20th, 30th, 40th, 50th, 60th, 70th, 80th, and 90th percentiles for the total PoDs and different types of PoDs. For the total PoDs, the OLS result demonstrates that the impact of urbanization (URB) is negatively associated with PoDs, and the QR results show an increasing trend from −0.403 in the 10th quantile to −0.366 in the 90th quantile. Although research by Gong et al. found that rapid urbanization in China was linked with an increasing disease burden, this finding provides evidence of the potential advantages of urbanization on PoDs [29]. It suggests that the benefits of urbanization, such as improved access to healthcare, sanitation, and secure nutrition outweigh the negative impacts of issues like overcrowding, pollution, social deprivation, crime, and stress-related illnesses.
Table 3.
Results of the quantile regression analysis.
Medical facilities (MED_FACS) also emerged as a significant negative predictor of PoDs, which is consistent with the disability and medical theory asserting that medical status is a critical determinant of disability [19]. Bus and road density (BUS_DEN and ROAD_DEN) were significant positive predictors of PoDs. The rapid development of road traffic has increased traffic injuries in developing countries, leading to a rising number of disabled individuals [19]. Migrant population (MIG_POP) positively impacted PoDs at the 30th–60th quantile levels, indicating that the migrant population increased PoDs in rural areas with mid-level PoDs. Rural migrants often engage in the informal economy, such as construction, transport, and other manual labor industries, which can result in injury, instability, and limb and mental disabilities [22]. The QR coefficients of the elderly population (ELD_POP) were significant at the 70th–90th quantiles, suggesting that population aging increased PoDs in urban centers where life expectancy for elderly individuals is highest. Education facilities (EDU_FACS) were negatively significant at the 80th and 90th quantiles, implying that education levels reduced PoDs in urban centers. These results confirmed that higher education levels help raise awareness of prenatal diagnosis and disease prevention, which are closely related to the causes of disability.
3.2.2. Dominant Factors of Different Types of PoDs
To examine the association between socio-economic factors, the built environment, and different types of PoDs, separate OLS and QR analyses were conducted. The study demonstrates significant heterogeneity in the impact of associated factors on various PoD types. Most factors are significantly associated with specific PoDs only at particular quantile levels.
For the PoD_visual and PoD_hearing, OLS analyses demonstrate that the coefficients of medical facilities had a significantly negative effect. QR results indicate that the correlation is only significant at high percentiles. The effect size decreased from −0.069 in the 50th percentile to −0.140 in the 90th percentile for PoD_visual, and from −0.188 in the 60th percentile to −0.474 in the 90th percentile for PoD_hearing, respectively. Moreover, the results of OLS and QR indicated a positive correlation between public transportation and PoD_visual or PoD_hearing (excluding PoD_hearing in the 90th quantile). Notably, for PoD_hearing, the correlation increased from 0.089 in the 10th percentile to 0.113 in the 80th percentile, suggesting that it was gradually increasing with the growth of public transportation density.
For PoD_limb and PoD_intellectual, both OLS and QR analyses demonstrate that the coefficients of URB have a significantly negative effect. In the case of PoD_limb, urbanization (URB) coefficients are higher in the low (10th–20th) and high (70th–90th) quantiles. On the other hand, for PoD_intellectual, urbanization (URB) coefficients are higher in the middle (40th–70th) quantiles. This suggests that urbanization reduces PoD_limb in urban centers and fringes, as well as PoD_intellectual in urban centers. Furthermore, the OLS results reveal that the elderly population (ELD_POP) increases both PoD_limb and PoD_intellectual. The QR results indicate significance at high quantiles, suggesting that the effect of an aging population is more pronounced for higher levels of PoD_limb and PoD_intellectual. Additionally, the density of roads (ROAD_DEN) had contrasting effects, leading to a decrease in PoD_intellectual, but an increase in PoD_limb. Finally, QR results show that medical and education facilities (MED_FAC and EDU_FAC) decrease PoD_limb and PoD_intellectual at middle-high quantiles (predominantly in rural areas), respectively.
For PoD_mental and PoD_speech, both OLS and QR results reveal a significant positive correlation with the migrant population. The coefficients of the migrant population increase across quantile levels, indicating a stronger association between the migrant population and higher levels of PoD_mental and PoD_speech. For PoD_mental, study found that urbanization (URB) had a negative correlation with prevalence in the low quantile levels (10th–20th), but a positive correlation in the middle to high quantile levels (30th–90th). Additionally, the elderly population (ELD_POP) and bus and road density (BUS_DEN, ROAD_DEN) were significantly correlated with the increase in PoD_mental at high quantile levels. Regarding PoD_speech, density of bus stops (BUS_DEN) has a significant negative impact on middle to low quantiles (10th, 20th, 30th, 50th), indicating that areas with lower bus density (typically on urban fringes or rural areas) have higher levels of PoD_speech.
4. Discussion
4.1. Urban–Rural Disparities of PoDs
The spatial distribution of total PoDs in Tianjin municipality showed significant urban–rural disparities, with higher PoDs in urban centers. These findings demonstrated that the majority of disabilities exhibited an urbanization phenomenon, which contradicts some previous studies that reported higher PoDs in rural areas [30]. The high-density urban environment and serious aging trends in urban areas may contribute to the distinct distribution of disabilities and chronic diseases [31]. It underscores the need to re-evaluate the health implications of significant changes in urban and rural demographic structures and the rapid pace of urbanization [32].
The prevalence of different types of disability varies across urban and rural areas, indicating differences in the causes of disability between these settings. Contrary to previous conclusions, PoD_visual, PoD_hearing, and PoD_limb show significant accumulation in urban centers, challenging the notion of rural dominance. These findings suggest that ongoing changes in disability factors and trends will influence projections of incidence and disability prevalence [33]. However, the higher PoD_intellectual and PoD_speech were still found in rural areas due to higher prevalence among children and adolescents, associated with socio-economic development [34].
4.2. Categories Based on the Dominant Factors
The study found that urbanization rate, migrant population, elderly population, medical facilities, education facilities, bus route density, and road density had significant impacts on PoDs, with varying effects on different types of disabilities. Based on the dominant factors, the six types of disabilities were categorized into three groups.
4.2.1. Medical-Dominated Type
The first type is medical facility-dominated, which includes PoD_visual and PoD_hearing. According to the data from the second national sample survey of people with disabilities (2nd National Disability Survey) in Tianjin, the leading causes of visual disability were cataracts (42.6%) and retinal and pigment membrane lesions (11.8%), while the leading causes of hearing disability were presbycusis (53.6%), otitis media (12.2%), and systemic disease (6.2%). These diseases are age-related and have become more prevalent as life expectancy has increased [5]. However, they can now be effectively treated or alleviated through medical and rehabilitation means [35]. Due to their unique communication and sensory needs and higher risk of chronic diseases, individuals with visual and hearing impairments, particularly older adults, often require adequate medical facilities and care.
Moreover, as urban public transportation facilities become more accessible, they can increase employment, education, and other opportunities, improve the overall quality of life for those with sensory disabilities, and reduce social isolation [36]. Consequently, individuals with visual or hearing disabilities might cluster in areas with more developed public transportation facilities [37].
4.2.2. Urbanization- and Aging-Dominated Type
In the second type, urbanization and population aging predominate, encompassing both limb and intellectual disabilities. The 2nd National Disability Survey reveals that cerebrovascular diseases (38.5%), osteoarthrosis (18.5%), other injuries (7.5%), industrial accidents (6%), and traffic accidents (5%) are the primary causes of limb disabilities. Brain diseases (41%) and hereditary factors (15%) account for most intellectual disabilities. It confirms that in advanced societies, degenerative diseases such as cerebrovascular and brain diseases have supplanted nutritional deficiencies and infectious diseases as primary causes of death and disability [38]. The prevalence of these diseases increases with age, and urbanization improves access to healthcare facilities, leading to significant reductions in disability rates [39].
However, urbanization was also associated with an increase in the migrant population, which in turn led to an increase in PoD_limb. This finding supports previous research suggesting that high rates of PoD_limb can be partly attributed to industrial accidents and other injuries resulting from informal employment [22].
Additionally, road density (ROAD_DEN) had divergent effects on PoD_intellectual and PoD_limb. This highlights the importance of road traffic development in rehabilitating intellectual disabilities. However, it also confirms the higher rates of traffic accidents observed in developing countries, which contribute to an increased prevalence of limb disabilities [40].
Furthermore, the results indicate that medical facilities are associated with a decrease in PoD_limb, consistent with previous findings on improved medical conditions reducing osteoarthrosis-related disability rates. Educational facilities (EDU_FACS) are linked to a reduction in PoD_intellectual, potentially due to improved medical knowledge through enhanced education in rural areas, including better prenatal care to mitigate hereditary-related intellectual disabilities [41].
4.2.3. Migrant-Dominated Type
The third type is characterized by a migrant population and encompasses both mental and speech disabilities. The 2nd National Disability Survey identifies schizophrenia (60.8%) and dementia (8.2%) as the primary causes of mental disabilities, while cerebral infarction (40.9%) and hearing impairment (15.5%) are the leading causes of speech disabilities. This is in line with previous research suggesting that factors such as environmental stressors, language barriers, discrimination, and social isolation may lead to higher mental illness rates among migrants [42]. Migrants (MIG_POP), who often have temporary residence and frequent relocation, may face higher speech disability risks than permanent residents. While no conclusive evidence links language disabilities to this population, research indicates that lifestyle differences and limited healthcare access, including health insurance, may contribute to increased risk. Factors like migrant status, unstable residence, and limited healthcare resources may further exacerbate this vulnerability.
Furthermore, several additional factors have been identified as being linked to mental disability. Firstly, higher natural environmental exposure is associated with better mental health outcomes, while increased urbanization may elevate the risk of mental illness [43]. Secondly, studies have consistently shown a positive correlation between the elderly population (ELD_POP) and mental disabilities, which can be attributed to chronic health conditions, social isolation, and cognitive decline [44]. Moreover, transportation factors (ROAD_DEN) are also linked to mental disabilities. The results support previous research indicating that living near busy roads may increase the incidence of mental illness due to air pollution compared to quieter areas [45]. Additionally, exposure to public transportation and car traffic has been found to raise the risks of anxiety and depression, potentially stemming from low satisfaction with public transportation [46].
In the context of speech disability, it has been found that areas situated on the urban fringes or rural areas are negatively affected by bus density (BUS_DEN). This can result in reduced mobility for individuals with speech disabilities due to factors such as noise pollution, traffic congestion, and limited accessibility. These difficulties can contribute to communication barriers, which in turn may lead to increased social isolation.
5. Conclusions and Policy Recommendations
Although there is a certain awareness of disability in the field of healthcare, the spatial distribution of the prevalence of disability within Chinese municipalities remains relatively under-researched. This study uses aggregated registration information from the Tianjin Disability Database 2020 to identify urban–rural disparities in PoDs. Additionally, it investigates the heterogeneous impacts of socio-economic and built environment variables on different types of PoDs. The methodological approach employed in this study can serve as a framework for conducting comparative studies in other regions or countries. Researchers can adapt and apply our methodology to different geographic contexts to explore the associations between disability and relevant factors in those specific areas. By employing a similar approach, these studies can gain valuable insights into the unique challenges and opportunities related to disability in diverse socio-cultural settings. Furthermore, the findings of this study have implications for policy and urban planning, aiming to improve accessibility and inclusion for individuals with disabilities. Policymakers and urban planners can use the research outcomes to identify priority areas and develop targeted interventions, addressing specific needs and promoting inclusivity to enhance well-being.
First, the spatial distribution of total PoDs in the Tianjin municipality showed significant urban–rural disparities, with higher PoDs in urban centers. This finding contradicts previous studies in developing countries, which found higher PoDs in rural areas [6], and prompts the Global South to re-examine the health implications of dramatic changes in urban and rural demographic structures and rapid urbanization [29]. Similarly, PoD_visual, PoD_hearing, and PoD_limb also exhibit significant urban center accumulation, contradicting previous conclusions indicating rural dominance [8]. This suggests that current changes in disability factors and trends will impact projections of incidence and disability prevalence [33].
Second, urbanization rate, migrant population, elderly population, medical facilities, education facilities, bus route density, and road density (Figure A1) significantly impacted PoDs and had heterogeneous impacts on different types of PoDs. This study summarized them into three categories based on the dominant factors: medical facility-dominated (visual and hearing disabilities), urbanization- and aging-dominated (intellectual and limb disabilities), and migrant-dominated (mental and speech disabilities). These categories are closely related to the socio-economic and built environment differences between urban and rural areas behind various types of disability. Adequate medical facilities and care benefit functional disabilities [47], such as visual and hearing disabilities, while having weaker impacts on cognitive disabilities, such as intellectual and mental disabilities. Rapid urbanization has a dual effect on disability: improved access to healthcare, sanitation, and secure nutrition benefit intellectual and limb disabilities, while overcrowding, pollution, social deprivation, crime, and stress-related illnesses exacerbate mental and speech disabilities [48]. The increased PoDs due to aging are confirmed [49], particularly in intellectual and physical disabilities and visual and hearing disabilities in urban centers. Inequalities in healthcare, education, and social isolation faced by migrant populations have increased the prevalence of some types of disability, providing new empirical research for social models of disability [20].
Our results have important policy implications for the spatial governance of disability. First, focusing on the sharp increase in disability burden in the context of an aging population, specific services should be provided to the elderly in various areas, including disease prevention, treatment, disability rehabilitation, and care. Second, despite the high availability of medical services in urban centers, gaps in health service provision related to the surge in disability prevalence will persist. Strengthening medical service provision in urban centers could curb this surge. Third, specialized clinics and rehabilitation institutions should be established for individuals with intellectual and psychological disabilities in rural areas to meet their urgent needs for early rehabilitation and long-term treatment. Finally, for migrant populations, especially rural migrant workers, vocational training should be strengthened, and working conditions and social security should be improved to reduce the risk of occupational disability and social isolation [50].
This study has limitations. First, this study relies on cross-sectional data and cannot demonstrate the changing pattern of the prevalence of disability over time. Vertical cross-sectional studies with time spans will play a greater role in exploring the spatial and temporal patterns of disability and changes in disabling factors. Second, because of the availability of data, the selection of socio-economic variables still has some limitations. More variables, such as income level, birth rate, etc., will be added to future studies. Thirdly, to ensure overall data availability, the study was conducted at the sub-district level, albeit with the compromise of certain data, such as access to public facility. However, it is acknowledged that conducting the study at a more detailed spatial unit would enhance its accuracy. Furthermore, although the current single-city study is more detailed in the spatial unit, it does not fully represent the overall prevalence of disability in Chinese cities. Future studies should select multiple types of cities of different sizes for comparison.
Author Contributions
Conceptualization, Y.J. and X.H.; Methodology, N.Q.; Formal analysis, Y.J. and N.Q.; Investigation, M.D.; Data curation, Y.J.; Writing—original draft, Y.J. and N.Q.; Writing—review & editing, M.D. and L.Z.; Visualization, Y.J.; Supervision, X.H. and L.Z. All authors have read and agreed to the published version of the manuscript.
Funding
This research was funded by the Natural Science Foundation of Shandong Province grant number ZR2023QE242.
Data Availability Statement
The data cannot be made available due to confidentiality reasons.
Conflicts of Interest
The authors declare no conflict of interest.
Appendix A


Figure A1.
Spatial distribution of significant factors in Tianjin. (a) Urbanization rate; (b) Migrant population; (c) Urbanization rate; (d) Migrant population; (e) Urbanization rate; (f) Bus route density; (g) Road density.
References
- Vos, T.; Barber, R.M.; Bell, B.; Bertozzi-Villa, A.; Biryukov, S.; Bolliger, I.; Charlson, F.; Davis, A.; Degenhardt, L.; Dicker, D. Global, regional, and national incidence, prevalence, and years lived with disability for 301 acute and chronic diseases and injuries in 188 countries, 1990–2013: A systematic analysis for the Global Burden of Disease Study 2013. Lancet 2015, 386, 743–800. [Google Scholar] [CrossRef] [PubMed]
- Herningtyas, E.H.; Ng, T.S. Prevalence and distribution of metabolic syndrome and its components among provinces and ethnic groups in Indonesia. BMC Public Health 2019, 19, 377. [Google Scholar] [CrossRef]
- Guzman-Castillo, M.; Ahmadi-Abhari, S.; Bandosz, P.; Capewell, S.; Steptoe, A.; Singh-Manoux, A.; Kivimaki, M.; Shipley, M.J.; Brunner, E.J.; O’Flaherty, M. Forecasted trends in disability and life expectancy in England and Wales up to 2025: A modelling study. Lancet Public Health 2017, 2, e307–e313. [Google Scholar] [CrossRef]
- Zenebe, Y.; Akele, B.; Necho, M. Prevalence and determinants of depression among old age: A systematic review and meta-analysis. Ann. Gen. Psychiatr. 2021, 20, 55. [Google Scholar] [CrossRef]
- Velayutham, B.; Kangusamy, B.; Joshua, V.; Mehendale, S. The prevalence of disability in elderly in India–Analysis of 2011 census data. Disabil. Health J. 2016, 9, 584–592. [Google Scholar] [CrossRef] [PubMed]
- Zheng, X.Y.; Chen, S.J. Life expectancy of people with physical disabilities in China. Zhonghua Liu Xing Bing Xue Za Zhi 2011, 32, 693–696. [Google Scholar]
- Hajjioui, A.; Abda, N.; El Guenouni, R.; Fourtassi, M. Epidemiology of disability and participation in Morocco: Results from 2014 National household survey. Ann. Phys. Rehabil. Med. 2018, 61, e548–e549. [Google Scholar] [CrossRef]
- Zhao, G.; Okoro, C.; Hsia, J.; Garvin, W.; Town, M. Prevalence of Disability and Disability Types by Urban-Rural County Classification-U.S., 2016. Am. J. Prev. Med. 2019, 57, 749–756. [Google Scholar] [CrossRef]
- Qiao, R.; Jia, S.; Zhao, W.; Xia, X.; Su, Q.; Hou, L.; Li, D.; Hu, F.; Dong, B. Prevalence and correlates of disability among urban–rural older adults in Southwest China: A large, population-based study. BMC Geriatr. 2022, 22, 517. [Google Scholar] [CrossRef]
- Huck, J.J.; Atim, P.; Moro, E.B.; Nirmalan, M. Prevalence and spatial patterns of major limb loss in the acholi sub-region of Uganda. Prosthesis 2022, 4, 369–382. [Google Scholar] [CrossRef]
- Hayes, S.C. Prevalence of intellectual disability in local courts. J. Intellect. Dev. Disabil. 1997, 22, 71–85. [Google Scholar] [CrossRef]
- Christianson, A.L.; Zwane, M.E.; Manga, P.; Rosen, E.; Venter, A.; Downs, D.; Kromberg, J. Children with intellectual disability in rural South Africa: Prevalence and associated disability. J. Intell. Disabil. Res. 2002, 46, 179–186. [Google Scholar] [CrossRef] [PubMed]
- Jablensky, A.; McGrath, J.; Herrman, H.; Castle, D.; Gureje, O.; Evans, M.; Carr, V.; Morgan, V.; Korten, A.; Harvey, C. Psychotic disorders in urban areas: An overview of the Study on Low Prevalence Disorders. Aust. N. Z. J. Psychiatry 2000, 34, 221–236. [Google Scholar] [CrossRef]
- Jana, A.; Chattopadhyay, A. Prevalence and potential determinants of chronic disease among elderly in India: Rural-urban perspectives. PLoS ONE 2022, 17, e264937. [Google Scholar] [CrossRef] [PubMed]
- Murray, C.J.; Lopez, A.D. Global mortality, disability, and the contribution of risk factors: Global Burden of Disease Study. Lancet 1997, 349, 1436–1442. [Google Scholar] [CrossRef] [PubMed]
- Yadav, J.; Menon, G.R.; Mitra, M.; Allarakha, S.; John, D. Burden and cost of communicable, maternal, perinatal and nutrition deficiency diseases in India. J. Public Health 2022, 44, 217–227. [Google Scholar] [CrossRef]
- Haile, L.M.; Kamenov, K.; Briant, P.S.; Orji, A.U.; Steinmetz, J.D.; Abdoli, A.; Abdollahi, M.; Abu-Gharbieh, E.; Afshin, A.; Ahmed, H. Hearing loss prevalence and years lived with disability, 1990–2019: Findings from the Global Burden of Disease Study 2019. Lancet 2021, 397, 996–1009. [Google Scholar] [CrossRef]
- Gao, T.; Wang, X.C.; Chen, R.; Ngo, H.H.; Guo, W. Disability adjusted life year (DALY): A useful tool for quantitative assessment of environmental pollution. Sci. Total Environ. 2015, 511, 268–287. [Google Scholar] [CrossRef]
- Gururaj, G. Road traffic deaths, injuries and disabilities in India: Current scenario. Natl. Med. J. India 2008, 21, 14. [Google Scholar]
- Imrie, R. Rethinking the relationships between disability, rehabilitation, and society. Disabil. Rehabil. 1997, 19, 263–271. [Google Scholar] [CrossRef]
- Sangaramoorthy, T. Liminal living: Everyday injury, disability, and instability among migrant mexican women in Maryland’s seafood industry. Med. Anthropol. Q. 2019, 33, 557–578. [Google Scholar] [CrossRef] [PubMed]
- Qiu, N.; Cheng, J.; Zhang, T. Spatial disparity and structural inequality in disability patterns across Tianjin municipality: A multiple deprivation perspective. Habitat Int. 2022, 130, 102685. [Google Scholar] [CrossRef]
- Songchitruksa, P.; Zeng, X. Getis–Ord spatial statistics to identify hot spots by using incident management data. Transp. Res. Rec. 2010, 2165, 42–51. [Google Scholar] [CrossRef]
- Courtney-Long, E.A.; Carroll, D.D.; Zhang, Q.C.; Stevens, A.C.; Griffin-Blake, S.; Armour, B.S.; Campbell, V.A. Prevalence of Disability and Disability Type Among Adults—United States, 2013. Morb. Mortal. Wkly. Rep. 2015, 64, 777–783. [Google Scholar] [CrossRef] [PubMed]
- De Silva, P.; Simons, S.; Stevens, P. Economic impact analysis of natural gas development and the policy implications. Energ. Policy 2016, 88, 639–651. [Google Scholar] [CrossRef]
- Koenker, R.; Bassett, G., Jr. Regression quantiles. Econom. J. Econom. Soc. 1978, 46, 33–50. [Google Scholar] [CrossRef]
- Bera, A.K.; Galvao, A.F.; Montes-Rojas, G.V.; Park, S.Y. Asymmetric laplace regression: Maximum likelihood, maximum entropy and quantile regression. J. Econom. Methods 2016, 5, 79–101. [Google Scholar] [CrossRef]
- Sherwood, B.; Wang, L. Partially linear additive quantile regression in ultra-high dimension. Ann. Stat. 2016, 44, 288–317. [Google Scholar] [CrossRef]
- Gong, P.; Liang, S.; Carlton, E.J.; Jiang, Q.; Wu, J.; Wang, L.; Remais, J.V. Urbanisation and health in China. Lancet 2012, 379, 843–852. [Google Scholar] [CrossRef]
- Von Reichert, C.; Berry, E.H. Rural–urban patterns of disability: The role of migration. Popul. Space Place 2020, 26, e2271. [Google Scholar] [CrossRef]
- Jiang, Y.; Wang, S.; Ren, L.; Yang, L.; Lu, Y. Effects of built environment factors on obesity risk across three types of residential community in Beijing. J. Transp. Health 2022, 25, 101382. [Google Scholar] [CrossRef]
- Ramachandra, S.S.; Allagh, K.P.; Kumar, H.; Grills, N.; Marella, M.; Pant, H.; Mahesh, D.; Soji, F.; Mani, S.; Murthy, G. Prevalence of disability among adults using rapid assessment of disability tool in a rural district of South India. Disabil. Health J. 2016, 9, 624–631. [Google Scholar] [CrossRef]
- Wafa, H.A.; Wolfe, C.D.; Emmett, E.; Roth, G.A.; Johnson, C.O.; Wang, Y. Burden of stroke in Europe: Thirty-year projections of incidence, prevalence, deaths, and disability-adjusted life years. Stroke 2020, 51, 2418–2427. [Google Scholar] [CrossRef]
- Maulik, P.K.; Mascarenhas, M.N.; Mathers, C.D.; Dua, T.; Saxena, S. Prevalence of intellectual disability: A meta-analysis of population-based studies. Res. Dev. Disabil. 2011, 32, 419–436. [Google Scholar] [CrossRef] [PubMed]
- Finger, C.E.; Moreno-Gonzalez, I.; Gutierrez, A.; Moruno-Manchon, J.F.; McCullough, L.D. Age-related immune alterations and cerebrovascular inflammation. Mol. Psychiatr. 2022, 27, 803–818. [Google Scholar] [CrossRef] [PubMed]
- Lindsay, S.; Lamptey, D. Pedestrian navigation and public transit training interventions for youth with disabilities: A systematic review. Disabil. Rehabil. 2019, 41, 2607–2621. [Google Scholar] [CrossRef] [PubMed]
- Kwon, K.; Akar, G. People with disabilities and use of public transit: The role of neighborhood walkability. J. Transp. Geogr. 2022, 100, 103319. [Google Scholar] [CrossRef]
- Landes, S.D.; Stevens, J.D.; Turk, M.A. Cause of death in adults with Down syndrome in the United States. Disabil. Health J. 2020, 13, 100947. [Google Scholar] [CrossRef]
- Cassarino, M.; O’Sullivan, V.; Kenny, R.A.; Setti, A. Disabilities moderate the association between neighbourhood urbanity and cognitive health: Results from the Irish longitudinal study on ageing. Disabil. Health J. 2018, 11, 359–366. [Google Scholar] [CrossRef]
- Khazaie, H.; Zakiei, A.; Rezaei, M.; Brand, S.; Komasi, S. The role of traffic and road accidents in causing disabilities in Iran. Iran. J. Public Health 2020, 49, 1804. [Google Scholar] [CrossRef]
- Lichtenstein, P.; Tideman, M.; Sullivan, P.F.; Serlachius, E.; Larsson, H.; Kuja Halkola, R.; Butwicka, A. Familial risk and heritability of intellectual disability: A population-based cohort study in Sweden. J. Child Psychol. Psychiatry 2022, 63, 1092–1102. [Google Scholar] [CrossRef]
- Pollard, T.; Howard, N. Mental healthcare for asylum-seekers and refugees residing in the United Kingdom: A scoping review of policies, barriers, and enablers. Int. J. Ment. Health Syst. 2021, 15, 60. [Google Scholar] [CrossRef] [PubMed]
- Luo, L.; Jiang, B. From oppressiveness to stress: A development of Stress Reduction Theory in the context of contemporary high-density city. J. Environ. Psychol. 2022, 84, 101883. [Google Scholar] [CrossRef]
- Steffens, E.B.; Steffens, D.C. Getting on message: Preventing Alzheimer disease through diet and exercise. Am. J. Geriatr. Psychiatry 2016, 24, 738–739. [Google Scholar] [CrossRef]
- Oudin, A.; Forsberg, B.; Adolfsson, A.N.; Lind, N.; Modig, L.; Nordin, M.; Nordin, S.; Adolfsson, R.; Nilsson, L. Traffic-related air pollution and dementia incidence in northern Sweden: A longitudinal study. Environ. Health Perspect. 2016, 124, 306–312. [Google Scholar] [CrossRef]
- Bezyak, J.L.; Sabella, S.; Hammel, J.; McDonald, K.; Jones, R.A.; Barton, D. Community participation and public transportation barriers experienced by people with disabilities. Disabil. Rehabil. 2020, 42, 3275–3283. [Google Scholar] [CrossRef] [PubMed]
- Hsu, Y.; Tsai, W.; Kung, P. Health examination utilization in the visually disabled population in Taiwan: A nationwide population-based study. BMC Health Serv. Res. 2013, 13, 509. [Google Scholar] [CrossRef]
- Anakwenze, U.; Zuberi, D. Mental health and poverty in the inner city. Health Soc. Work. 2013, 38, 147–157. [Google Scholar] [CrossRef]
- Peng, X.; Song, S.; Sullivan, S.; Qiu, J.; Wang, W. Ageing, the urban-rural gap and disability trends: 19 years of experience in China-1987 to 2006. PLoS ONE 2010, 5, e12129. [Google Scholar] [CrossRef]
- Lawton Smith, H. Public spaces, equality, diversity and inclusion: Connecting disabled entrepreneurs to urban spaces. Land 2023, 12, 873. [Google Scholar] [CrossRef]
Disclaimer/Publisher’s Note: The statements, opinions and data contained in all publications are solely those of the individual author(s) and contributor(s) and not of MDPI and/or the editor(s). MDPI and/or the editor(s) disclaim responsibility for any injury to people or property resulting from any ideas, methods, instructions or products referred to in the content. |
© 2023 by the authors. Licensee MDPI, Basel, Switzerland. This article is an open access article distributed under the terms and conditions of the Creative Commons Attribution (CC BY) license (https://creativecommons.org/licenses/by/4.0/).