1. Introduction
Food security is closely related to national and social stability and the development of people’s livelihoods [
1]. In China’s 14th Five-Year Plan, “food security” has been included for the first time and given top priority as one of the three major security strategies [
2]. In recent years, due to the occurrence of the COVID-19 pandemic and the complex international situation, the country itself has been required to take the initiative in ensuring food security. However, for a long time, due to the effects of urbanization and industrial development, coupled with ecological land reclamation and climate change, China’s arable land resources have been decreasing continuously [
3], posing a significant threat to food security and ecological environment safety [
4]. With the increasing importance of the country’s self-sufficiency in food production, how to balance economic development with arable land and ecological protection in major grain-producing areas has become a crucial issue. The approach taken by Sichuan Province has certain research and reference values.
Sichuan Province is the largest grain production area in western China, undertaking the important tasks of grain production and circulation [
5]. In the “Guiding Opinions on Establishing Grain Production Functional Zones and Important Agricultural Product Production Protection Zones” issued by the State Council of China in 2017, Sichuan Province was designated as a grain production functional zone covering 39,466.67 square kilometers (km
2), accounting for 6.58% of the national grain production functional zone. In 2022, Chinese President Xi Jinping further proposed the development goal of creating a higher-level “Tianfu Granary” during his inspection of Sichuan Province in the new era. From the perspective of strategic positioning for land protection and its own development goals, Sichuan Province must further strengthen land protection.
The quantity and quality of cultivated land are closely related to the natural environment and the stage of economic and social development. Exploring the spatiotemporal patterns and influencing factors of cultivated land through remote sensing technology not only provides a more objective approach than statistical data but also enables the analysis of long-term temporal sequences and spatial information of regional cultivated land changes. This approach is an important means to enhance the quality of agricultural development in a region and promote the sustainable utilization of cultivated land [
6,
7,
8]. In recent years, scholars have conducted a large amount of research on the spatiotemporal changes of cultivated land, including changes in the quantity and quality of cultivated land [
9,
10], landscape pattern changes [
11,
12,
13], and so on. Within the domain of Sichuan Province, the largest grain-producing region in western China, related research mainly focuses on the exploration of cultivated land functional changes [
14,
15], as well as the analysis of regional cultivated land change characteristics and driving factors [
16,
17]. In terms of research methods, the geographic detector model, which explores the geographic consistency between the dependent variable and the independent variable, has been widely used in previous studies [
18,
19,
20]. Compared with the geographic detector model, the Patch-based Land Use Simulator (PLUS) model can describe the nonlinear relationship between land use type changes and driving factors based on temporal patch changes [
21]. However, since the PLUS model is based on the expansion and spread trend of patches, existing studies on the driving factors of land temporal changes based on the PLUS model are all focused on the driving forces behind the expansion of land use types [
16,
22]. To investigate the driving factors of cultivated land reduction, it is possible to extract the distribution data of the region where cultivated land has decreased based on land use data. By analyzing the expansion and changes of the phenomenon of “cultivated land reduction” in the PLUS model, the objective of analyzing the driving factors of cultivated land reduction can be achieved.
As the main grain-producing region in Southwest China, what trends have emerged in the changes in cultivated land resources in Sichuan Province during the past 20 years of regional development? Furthermore, as a key pilot province in the early stages of China’s “returning arable land to forests” policy, has Sichuan Province achieved coordinated development between production and ecological spaces in terms of food security and ecological harmony? Has the conflict between urban expansion and cultivated land become prominent during the process of social and economic development in the main grain-producing areas? In order to explore the aforementioned issues, this study will examine the land use changes in Sichuan Province from 2000 to 2020. Based on spatial analysis methods and an enhanced PLUS model, it will analyze the characteristics of cultivated land area changes, cultivated land patch changes, and cultivated land spatial changes within a 21-year period in Sichuan Province. The main objective of this research is to analyze the characteristics of cultivated land changes in the major grain-producing area, summarize the current status of coordinated development between regional cultivated land and other land use types, explore the primary driving factors of cultivated land changes, and provide a theoretical basis and decision-making reference for the rational planning and utilization of cultivated land resources in Sichuan Province, as well as the construction of the “Tianfu Granary”.
2. Research Methodology and Data Sources
2.1. Overview of the Study Area
Sichuan Province, located in the southwestern part of China, has a land area of 486,000 square km2 and a population of 83.6749 million as of 2020. The terrain in Sichuan Province is complex and diverse, with a significant difference in elevation from east to west and various climate types. The overall climate is mild and humid, with an average annual temperature of 16.5 °C and an average annual precipitation of more than 1150 mm. As the largest grain-producing area in Southwest China, Sichuan Province mainly produces rice, wheat, corn, and other crops. The grain production in Sichuan Province was 33.72 million tons in 2000, and the total grain output in 2020 was 35.2743 million tons. With the further implementation of China’s arable land protection strategy and the construction of the future “Tianfu Granary”, Sichuan Province will play a huge role in ensuring China’s food security.
2.2. Data Sources and Processing Methods
The land use data utilized in this study was sourced from the China National Land Use Classification Data Product, with a spatial resolution of 30 m. The first-level land use types in the data include six categories: cultivated land, forest land, grassland, water area, construction land, and unused land. The average classification accuracy of cultivated land and construction land was 95%, while the accuracy of other land use types exceeded 90% [
16], meeting the precision requirements of the research.
The selection of driving factors for cultivated land changes was divided into two categories: natural environmental factors and social and economic factors. Eleven driving factors for cultivated land changes were selected based on existing studies on the driving factors of cultivated land changes [
16,
23,
24,
25,
26,
27,
28,
29], combined with the analysis requirements of the driving mechanism of cultivated land transfer in Sichuan Province (
Table 1).
(1) The “distance to the road network” includes urban roads, highways, national roads, township roads, county roads, and railways. “Land Development Intensity” refers to the ratio of construction land area to the total area of the region and is calculated using the formula shown below.
In the equation,
represents the total area of the region’s land, while
represents the area of land used for construction. A higher value of
indicates a greater intensity of land development [
23].
(2) China’s GDP spatial distribution kilometer grid data is spatial grid data generated by spatial interpolation on the basis of national sub-county GDP statistics, taking into account the spatial interaction pattern between land use types, nighttime light brightness, residential density data, and GDP, which are closely related to human activities. The calculation formula is as follows:
where
represents the rasterized value of the grid unit after spatialization.
is the total weight of land use types, nighttime light intensity, and population density for the grid unit.
is the total weight of land use types, nighttime light intensity, and population density for the county-level administrative unit where the grid unit is located.
(3) The data underwent preprocessing, including: ① Calculating the Euclidean distance for data on highway networks, river surfaces, and rural residential areas; ② Calculating the mean values for population, gross national product (GDP), temperature, and precipitation data; ③ Computing slope data using elevation data; ④ Resampling all data to a uniform resolution of 100 m. The sources of the data used in this paper and their basic characteristics are presented in
Table 2.
2.3. Research Methodology
The study describes the changes in the spatial distribution, rate of change, transfer direction, and landscape characteristics of arable land in Sichuan Province from 2000 to 2020 and analyzes the main driving factors using the PLUS model. In terms of research logic, the methods used in this study have a progressive relationship with each other [
30].
(1) The dynamic degree of arable land change is used to analyze the rate of change in the number of arable lands over a certain period of time and to quantitatively evaluate the degree of arable land change [
23,
31]. The calculation formula is as follows:
where
represents the dynamic degree of arable land change,
represents the arable land area at the start of the study period,
represents the arable land area at the end of the study period, and T represents the study period.
(2) The land use transfer matrix is represented in matrix form to show the relationship between different types of land use over time and can be used to describe the temporal characteristics of land use type changes [
32,
33]. By comparing the land use type changes in Sichuan Province, the transfer directions of arable land to and from other types of land use were obtained.
(3) The analysis of landscape pattern indices can quantitatively reflect the structural composition and spatial distribution characteristics [
34] and was used to analyze the landscape characteristics of arable land in Sichuan Province. Eight landscape pattern indices were selected based on previous research [
12,
35,
36] (
Table 3).
(4) The PLUS model for patch-generated land use change simulation is a land use change simulation model consisting of the land expansion strategy analysis module (LEAS) and a cellular automata model based on multi-type random patch seeds (CARS) [
37]. LEAS extracts the expansion part of land use changes between two adjacent periods and uses the random forest algorithm to analyze the contribution values of different driving factors to the expansion of various land uses. Based on the extracted arable land reduction data, this study improved the LEAS step and imported it into the model to analyze the driving forces behind the reduction of arable land pixels. The specific calculation formula is as follows:
where
takes the value of 0 or 1. When other types of land use are converted to the kth type of land use,
is 1; when land use types are converted to types other than k,
is 0.
is the decision tree set indicator function,
represents the vector composed of driving factors,
is the predicted type of the nth decision tree for vector
, and
represents the total number of decision trees [
21].
3. Results and Analysis
3.1. Analysis of Spatiotemporal Changes in Cultivated Land in Sichuan Province
3.1.1. Overall Characteristics of Cultivated Land Changes in Sichuan Province
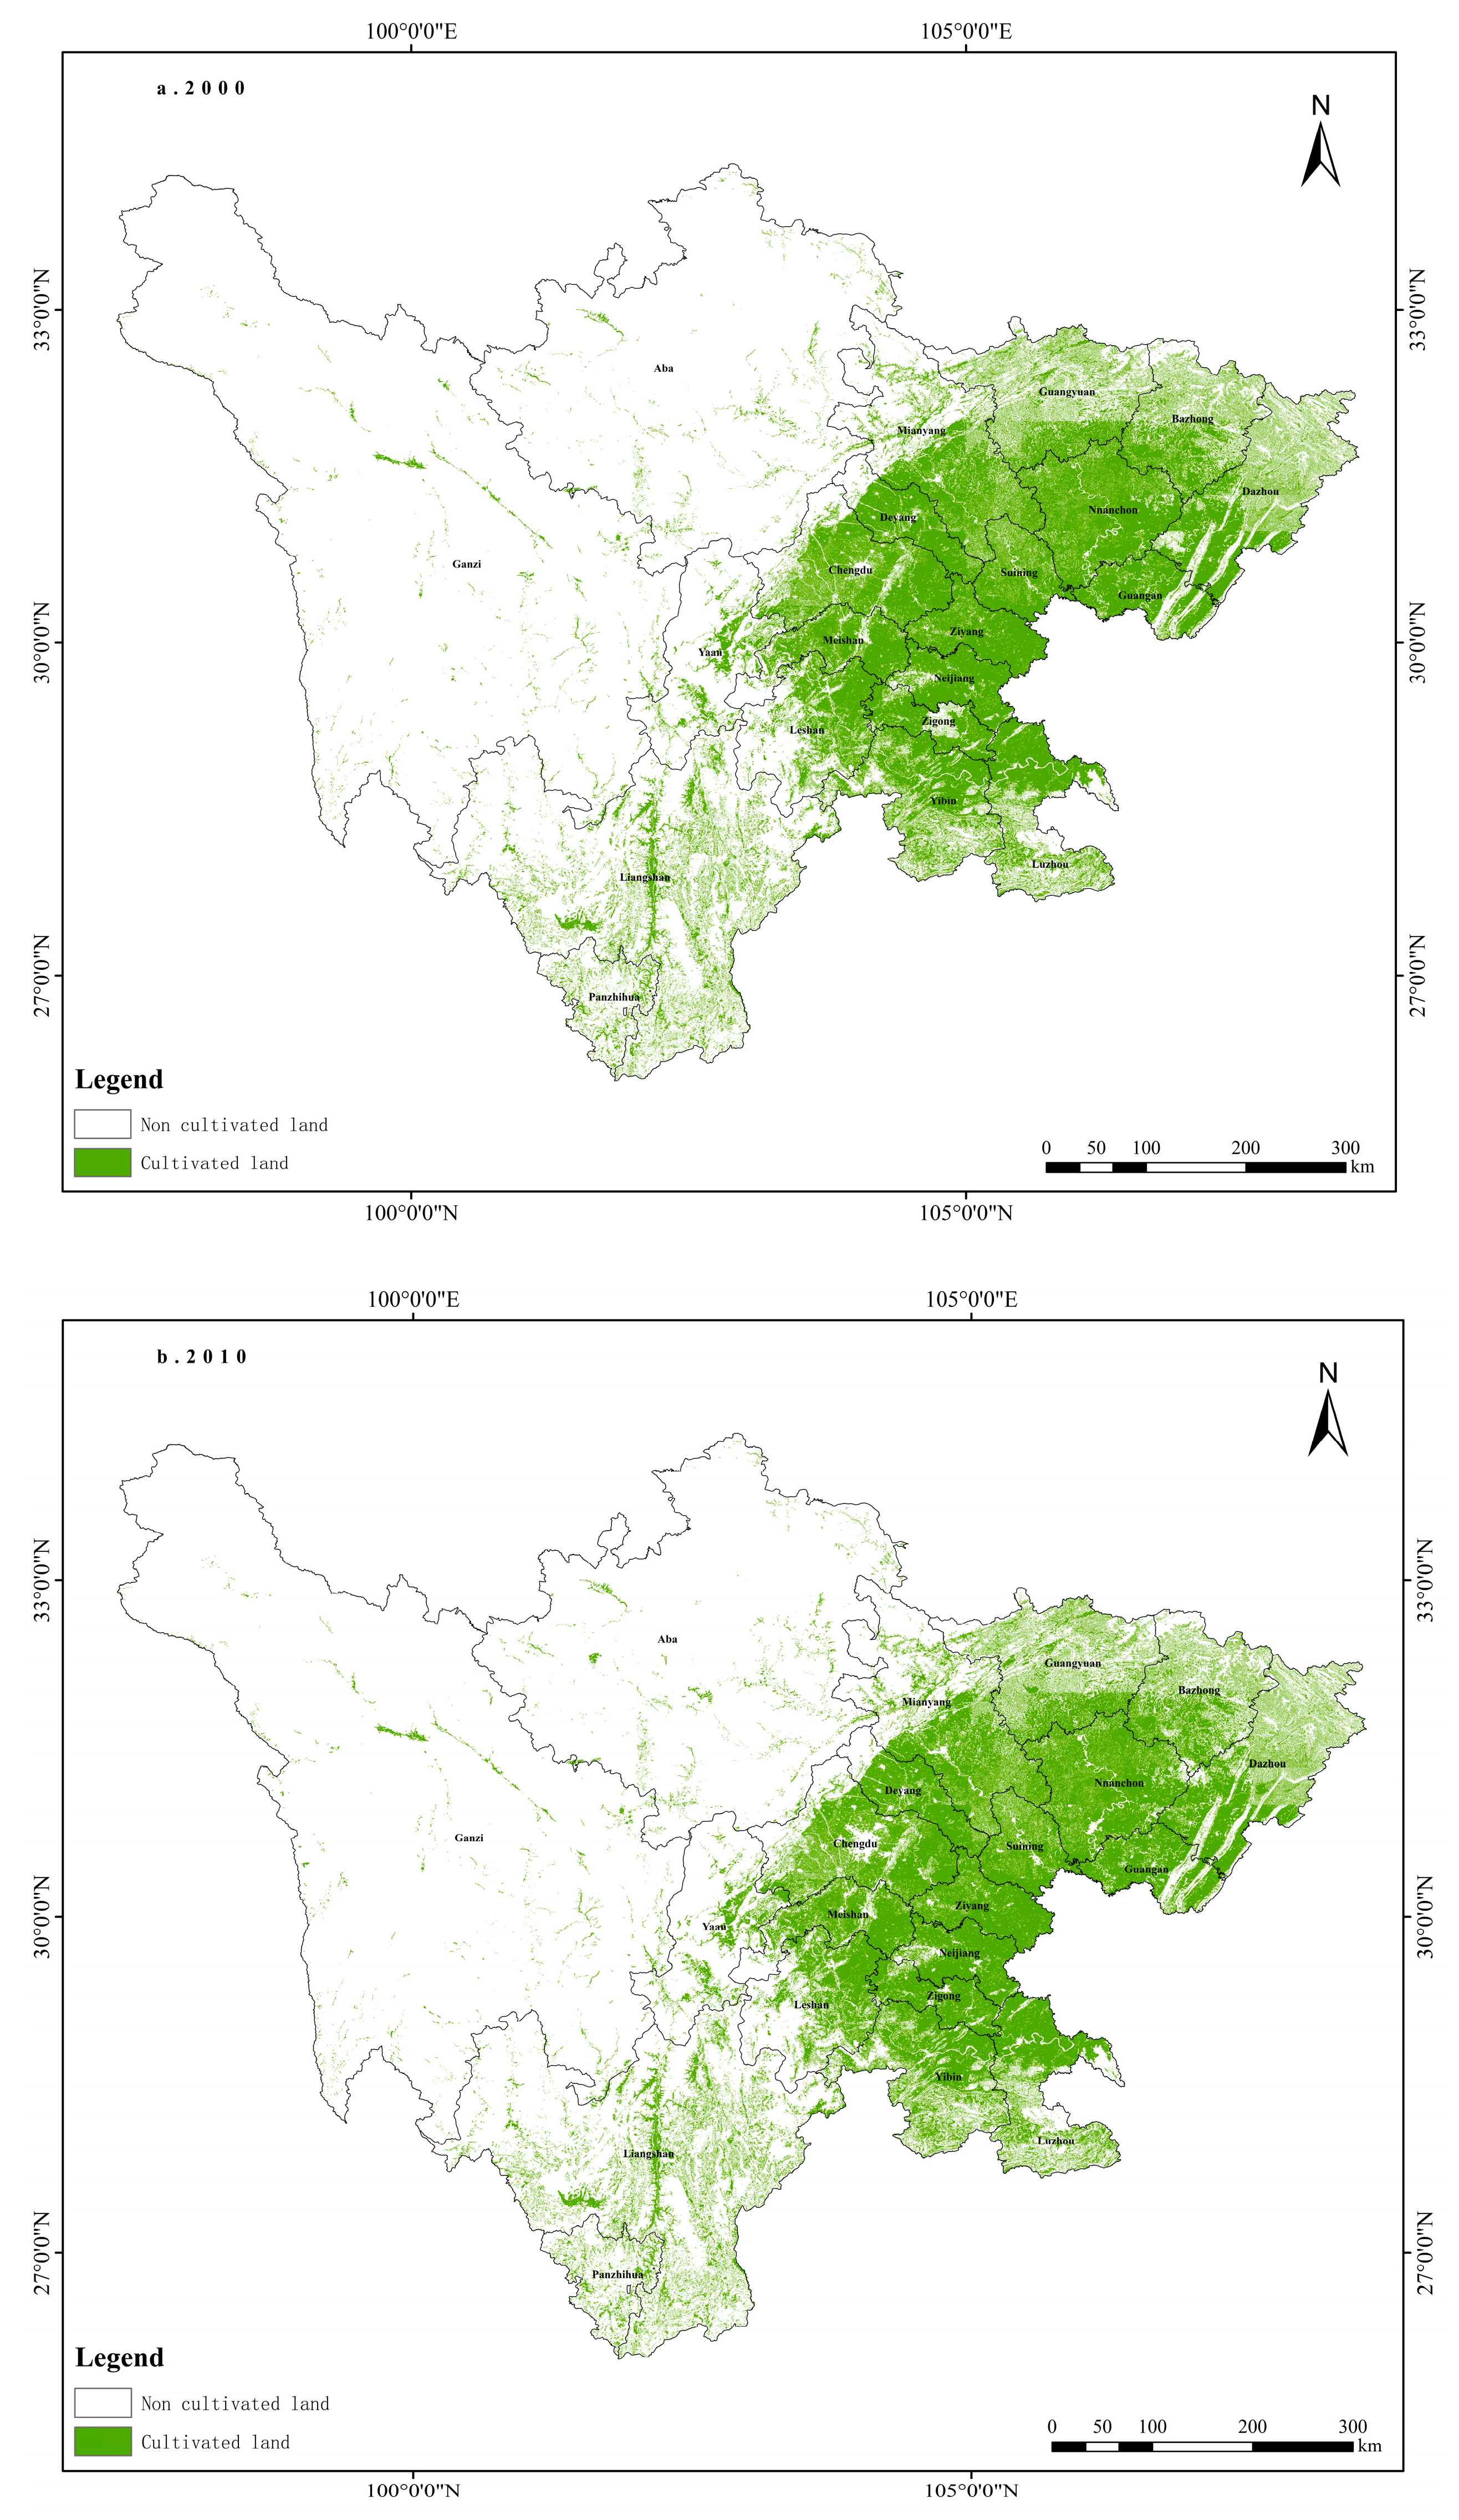
Using ArcGIS, the distribution of cultivated land in Sichuan Province from 2000 to 2020 was extracted (
Figure 1). Simultaneously, based on the land use data, the statistical tools were employed to obtain the number of pixels representing “cultivated land.” The pixel size of the land use data is 30 m × 30 m. By combining this with the total number of cultivated land pixels, the cultivated land area for each year was calculated (
Table 4). The previous section mentioned that the land use data used in the study had a classification accuracy of over 90%. This paper further validates the accuracy of area calculations. According to official statistical data, the area of Sichuan Province is approximately 486,000 km
2. By conducting pixel-based statistical calculations for the years 2000, 2010, and 2020, the calculated areas of Sichuan Province were determined to be 486,118.93 km
2, 486,049.55 km
2, and 486,044.65 km
2, respectively, with differences of less than 0.02%. This demonstrates that the method of calculating area using pixel-based statistics in ArcGIS is relatively accurate. From the perspective of temporal changes, the quantity of cultivated land in Sichuan Province has decreased over the past 20 years. In 2000, the cultivated land area in Sichuan Province was 121,211.45 km
2, accounting for 24.93% of the total land area. By 2020, the cultivated land area had decreased to 117,795.68 km
2, accounting for 24.24%, with a decrease of 3415.79 km
2 and a decrease rate of 2.82%.
In terms of spatial distribution changes, cultivated land in Sichuan Province is mainly distributed in the northeastern plain area. Due to altitude, terrain, and other reasons, the distribution of cultivated land in Aba Prefecture and Ganzi Prefecture in the western region is relatively small and mostly appears in scattered and strip-like patterns. Cultivated land in the northeast is more concentrated, while that in the south is more dispersed. The changes in cultivated land in Chengdu, Zigong, Nanchong, and Bazhong cities are more significant, and as a whole, the development of each city’s central urban area shows a diffusion characteristic in terms of occupying surrounding cultivated land.
3.1.2. Analysis of Dynamic Changes in Cultivated Land in Sichuan Province’s Prefecture-Level Cities
Using each of Sichuan Province’s prefecture-level cities as the unit of analysis for the analysis of the increase or decrease in arable land and the rate of change (dynamic changes), we calculated the dynamic changes in cultivated land from 2000 to 2020 for each city. Based on the values of the dynamic changes in cultivated land for each prefecture-level city, we classified the dynamic degree of arable land change from low to high as levels 1 to 5 (
Table 5).
According to
Table 5, Chengdu was the fastest city in terms of cultivated land reduction from 2000 to 2020, with a dynamic change value of −0.62. The dynamic degree of arable land change indicates the rate of arable land change. In addition to Chengdu, the cities with the most cultivated land reduction were Bazhong and Nanchong. The difference between Chengdu city and Ganzi Prefecture, which had the second-highest dynamic degree of arable land change, was nearly double. This indicates that Chengdu’s dynamic degree of arable land change is significantly higher than that of other prefecture-level cities. This is mainly due to Chengdu’s high demand for urban development land [
38], as well as its high degree of urban development within Sichuan Province and its high population activity intensity.
When comparing different time periods, the following observations can be made: (1) Although Chengdu’s dynamic change value decreased from −0.81 to −0.48 in the two stages, it still maintained a relatively high dynamic degree of arable land change compared to other cities in the latter 10 years, and the gap between Chengdu and the city with the second-highest dynamic change value in the corresponding period is gradually increasing. (2) The average values of the amount of cultivated land reduction in each prefecture-level city from 2000 to 2010 and 2010 to 2020 were −83.3 and −79.35, respectively, and the standard deviation values were 216.06 and 86.58, respectively. Although the difference in the mean amount of cultivated land reduction between the two decades is not significant, the standard deviation shows that the degree of dispersion of the amount of cultivated land reduction between the various prefecture-level cities, except for Chengdu, has decreased and the dynamic degree of arable land change has tended to be balanced among cities. (3) From 2010 to 2020, in the prefecture-level cities with high rates of cultivated land change in levels 4 and 5, the dynamic change and the value of cultivated land change showed a decreasing trend, and there was a decrease in the amount of cultivated land reduction and a slowing down of the rate of change. (4) There were seven prefecture-level cities with positive values for dynamic changes in cultivated land from 2000 to 2010, while all prefecture-level cities had negative values from 2010 to 2020.
3.1.3. Dynamic Characteristics of Arable Land Transfer
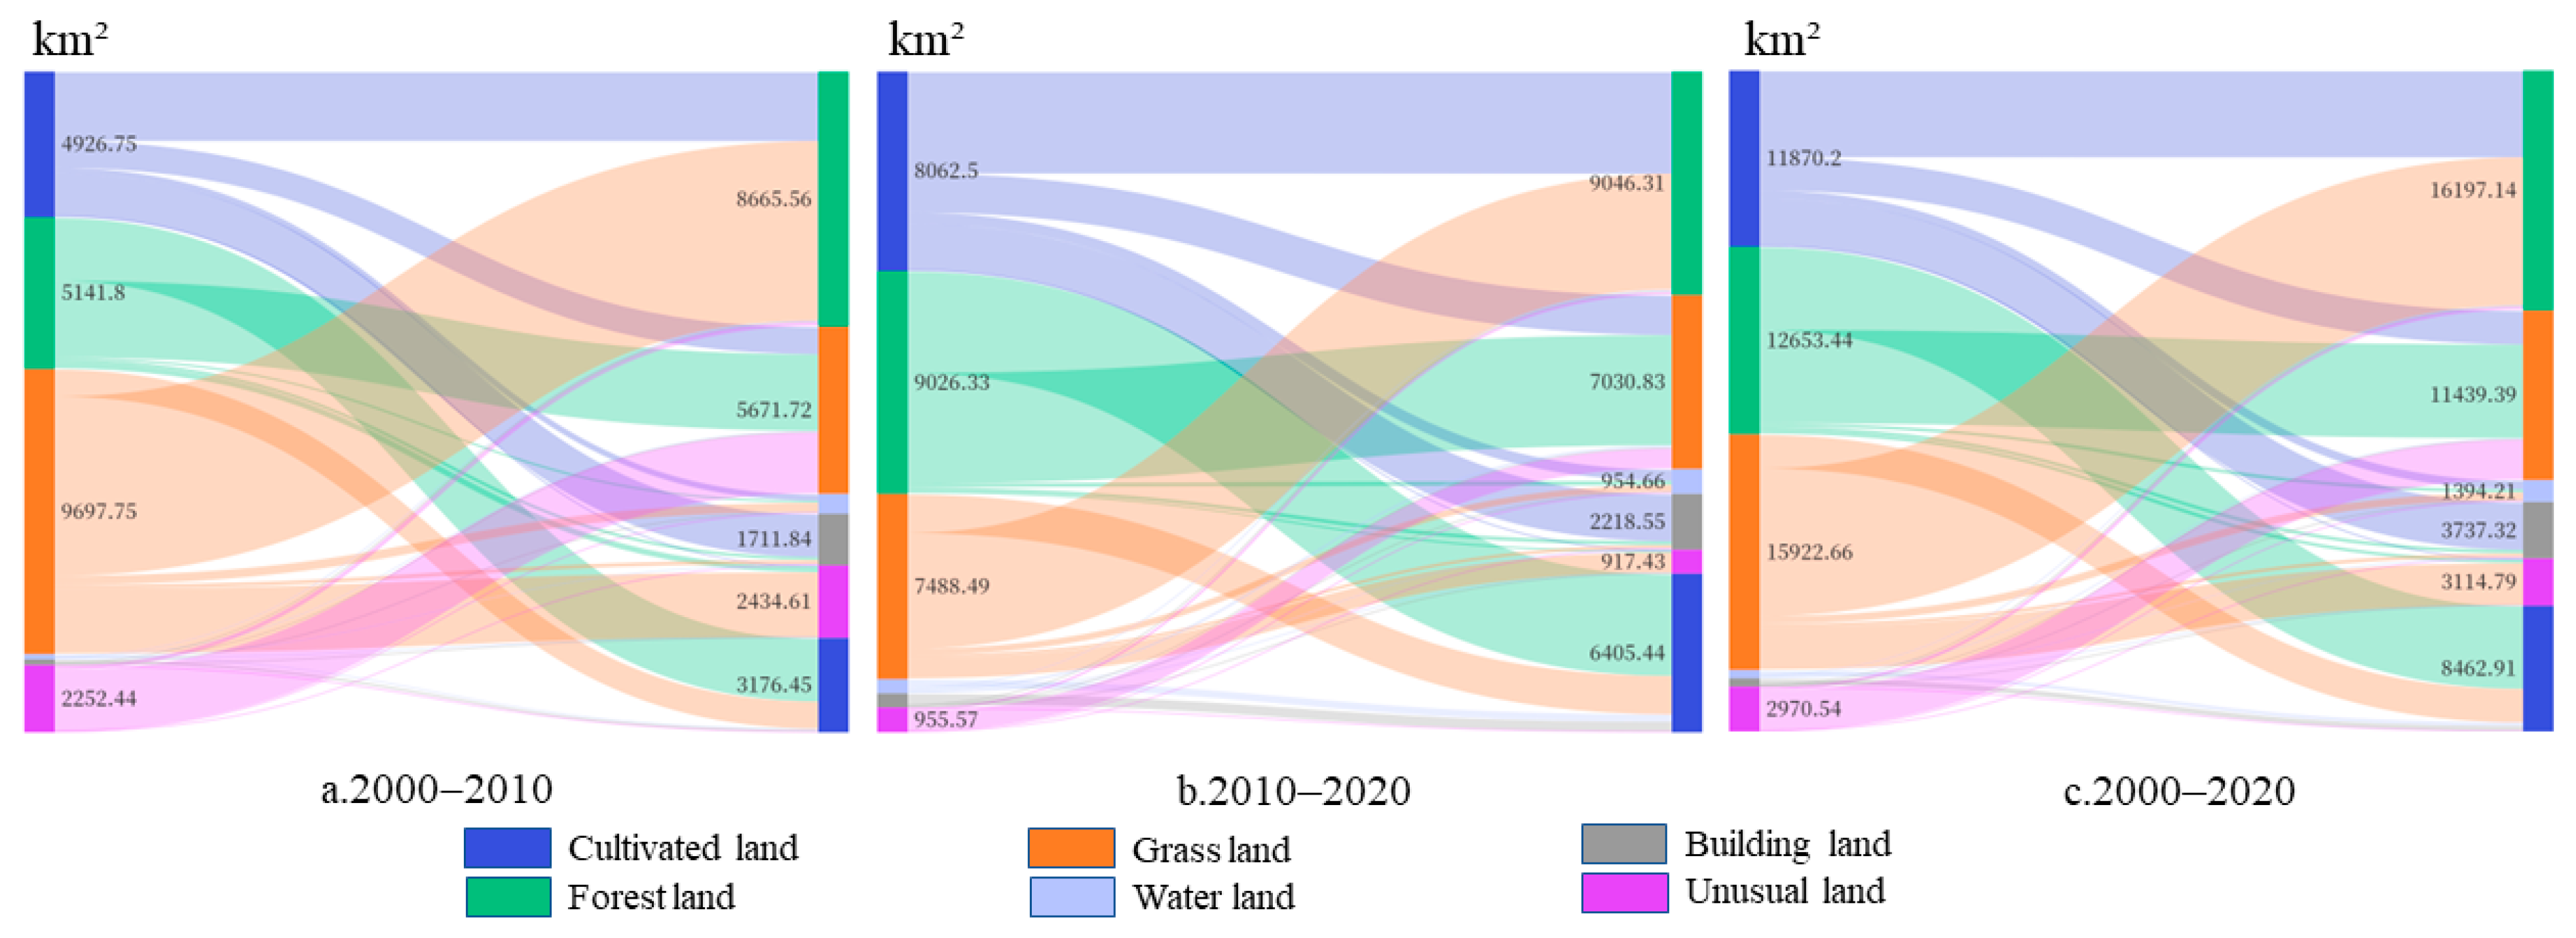
By analyzing the land use grid data of Sichuan Province in stages, the transfer of land use in Sichuan Province was obtained (
Figure 2). Based on the direction and quantity of arable land transfer at different times, the changes in the quantity structure of arable land were analyzed (
Table 6), and the spatial distribution characteristics of arable land transfer in Sichuan Province at different periods were analyzed using ArcGis (
Figure 3).
From 2000 to 2020, the main conversion of arable land in Sichuan Province was to forest land, with a conversion area of 5597.43 km2, accounting for 49.18% of the total. The second was construction land and grassland, accounting for 26.87% and 19.05%, respectively. The main direction of arable land conversion was from forest land, accounting for 66.14%, followed by conversion from grassland, accounting for 26.82%. The amount of arable land converted to construction land, which is the main direction of arable land outflow, accounted for only 4.03% of the total, indicating that the reduction in arable land was mainly due to construction land occupation.
In terms of the spatial distribution of arable land transfer, the phenomenon of construction land occupying arable land was concentrated in the suburbs of Chengdu as well as in cities such as Deyang, Mianyang, and Suining, with some features distributed along rivers. The conversion of arable land to forest land was mainly concentrated at the intersection of Bazhong City, Nanchong City, and Dazhou City, as well as in the western part of Chengdu City, with some areas concentrated in mountainous and hilly areas, such as the northeast region and the surrounding areas of Xiling Mountain and Emei Mountain, mainly presenting a strip-like distribution. The regions where forest land was converted to arable land were mainly located in the hilly areas of the south of Dazhou City, the north of Mianyang City, and Zigong City. The regions where arable land was converted to grassland were mainly scattered in the hilly areas of the north, while the areas where grassland was converted to arable land were relatively concentrated and gathered in areas with relatively gentle terrain. It can be seen that arable land with low continuity and poor utilization conditions in mountainous areas may face abandonment and conversion to grassland, while grassland with a certain scale and relatively flat terrain is the main source of compensation for arable land resources. By analyzing different time periods, it can be seen that the amount of arable land transferred in and out from 2010 to 2020 has nearly doubled compared to that from 2000 to 2010, indicating that the scale of land use structure adjustment from 2010 to 2020 was relatively large.
3.2. Dynamic Changes in the Landscape Pattern of Arable Land in Sichuan Province
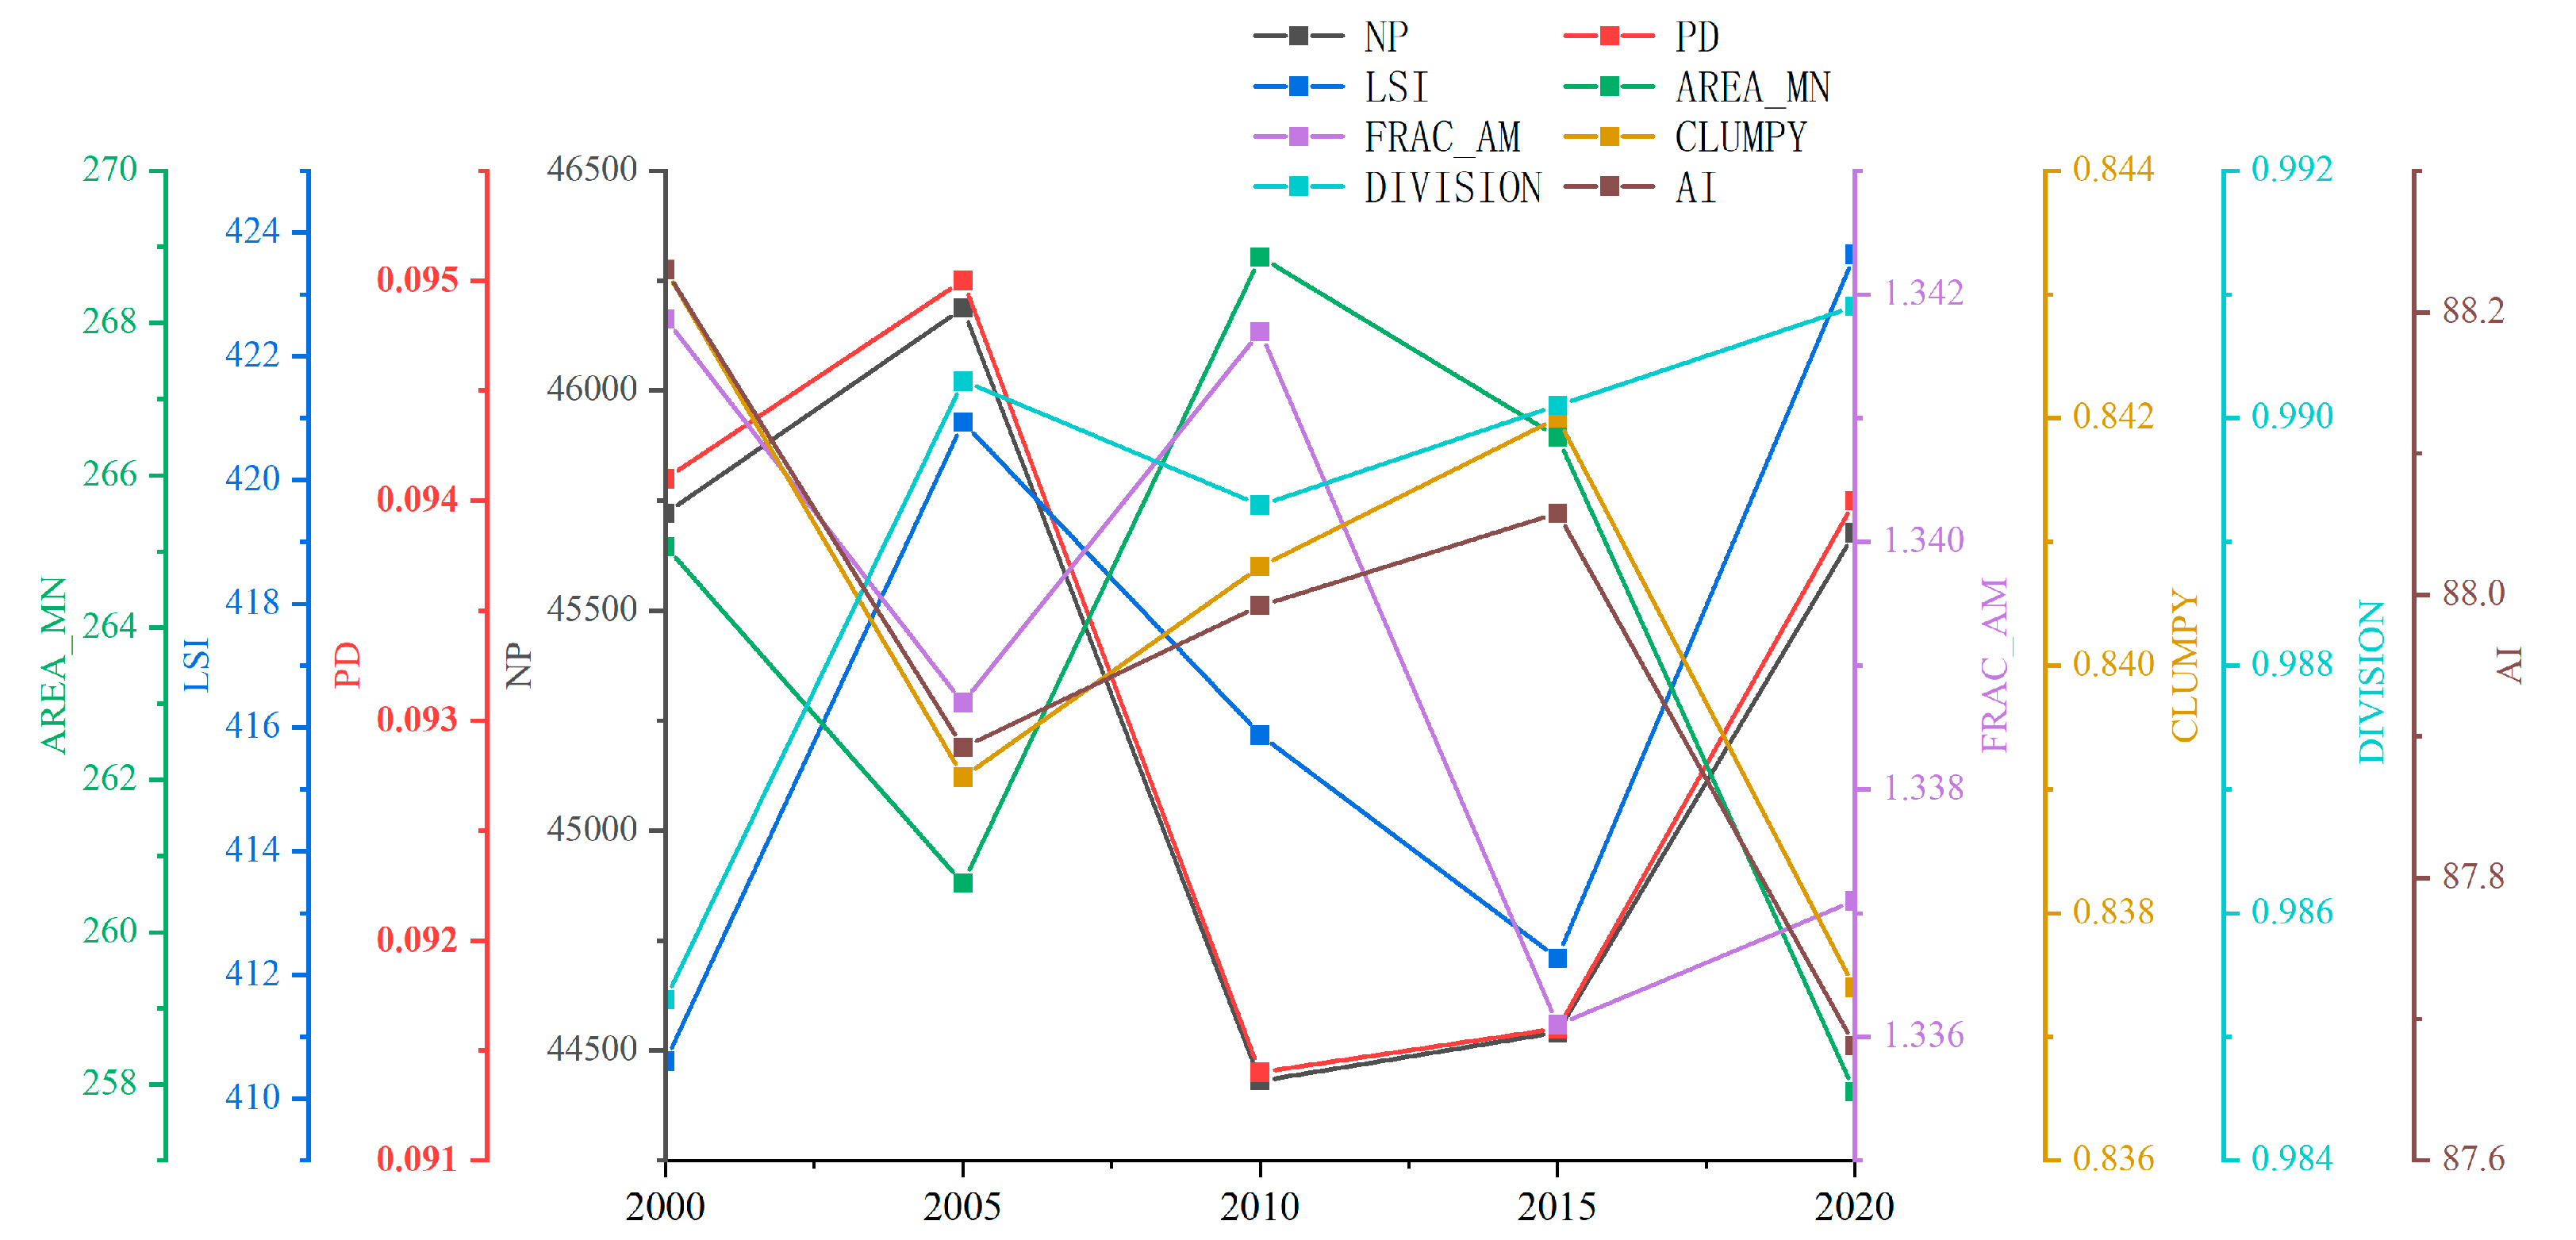
Arable land data from 2000 to 2020 were imported into the Fragstats4.2 software, and arable land patch characteristics were analyzed for different years based on eight aspects, including number of patches (NP), patch aggregation (PD), landscape shape index (LSI), landscape division index (DIVISION), aggregation index (AI), clumpiness (CLUMPY), mean patch area (AREA_MN), and area-weighted average fractal dimension (FRAC_AM). The calculation results are shown in
Figure 4.
(1) From 2000 to 2010, the number of arable land patches decreased significantly, and the degree of fragmentation decreased. At this time, the decrease in arable land was mainly due to the occupation of small and large arable land in surrounding areas. From 2010 to 2020, the number of arable land patches increased and the degree of fragmentation increased, while the area of arable land continued to decrease. During this period, arable land occupation mainly occurred within concentrated contiguous arable land. (2) In terms of the arable land patch shape index, the landscape shape index (LSI) increased, indicating that the shape of arable land patches became more complex and irregular. (3) From the perspective of arable land fragmentation, both the clumpiness index (CLUMPY) and aggregation index (AI) showed a rapid downward trend, while the landscape division index (DIVISION) increased. This indicates that the dispersion between arable land patches in Sichuan Province has increased and the degree of aggregation has decreased, developing from a few large patches to dispersed small patches. (4) In terms of arable land patch area, the mean patch area (AREA_MN) and area-weighted average fractal dimension (FRAC_AM) gradually decreased, indicating that the impact of human activities on arable land has gradually increased and the number of arable land patches per unit area has gradually decreased.
3.3. Analysis of Spatiotemporal Driving Factors of Cultivated Land Reduction in Sichuan Province
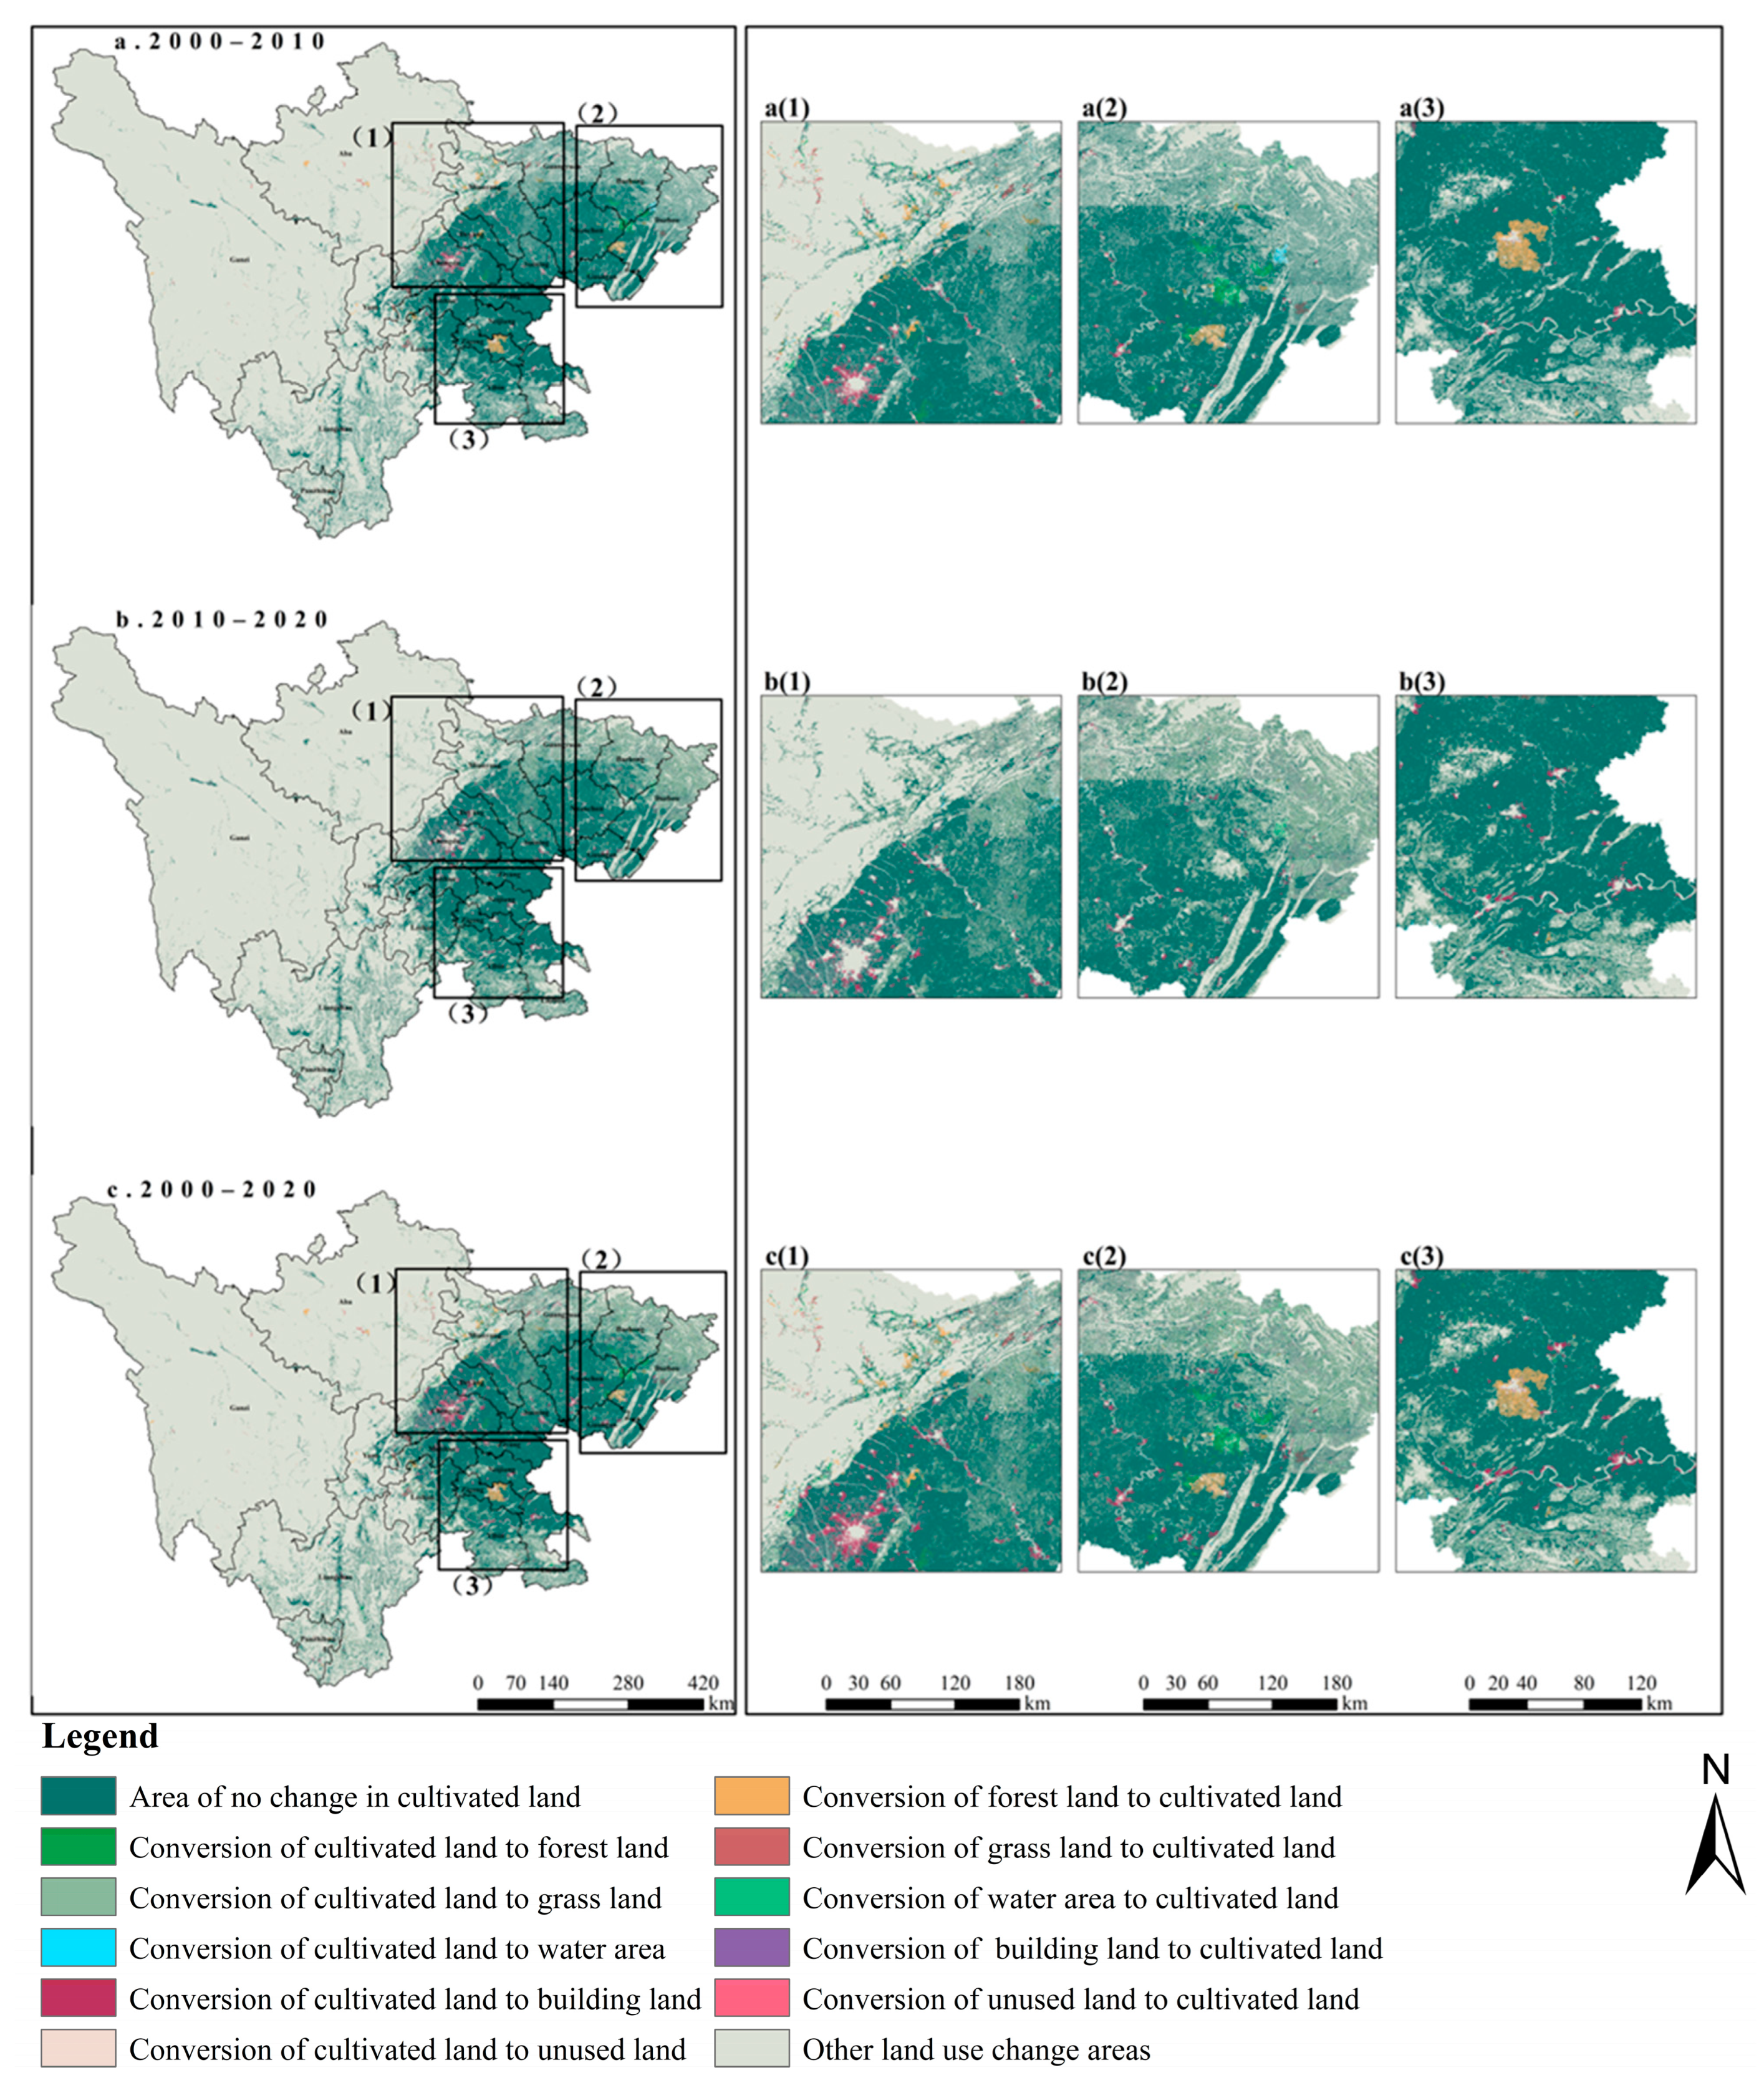
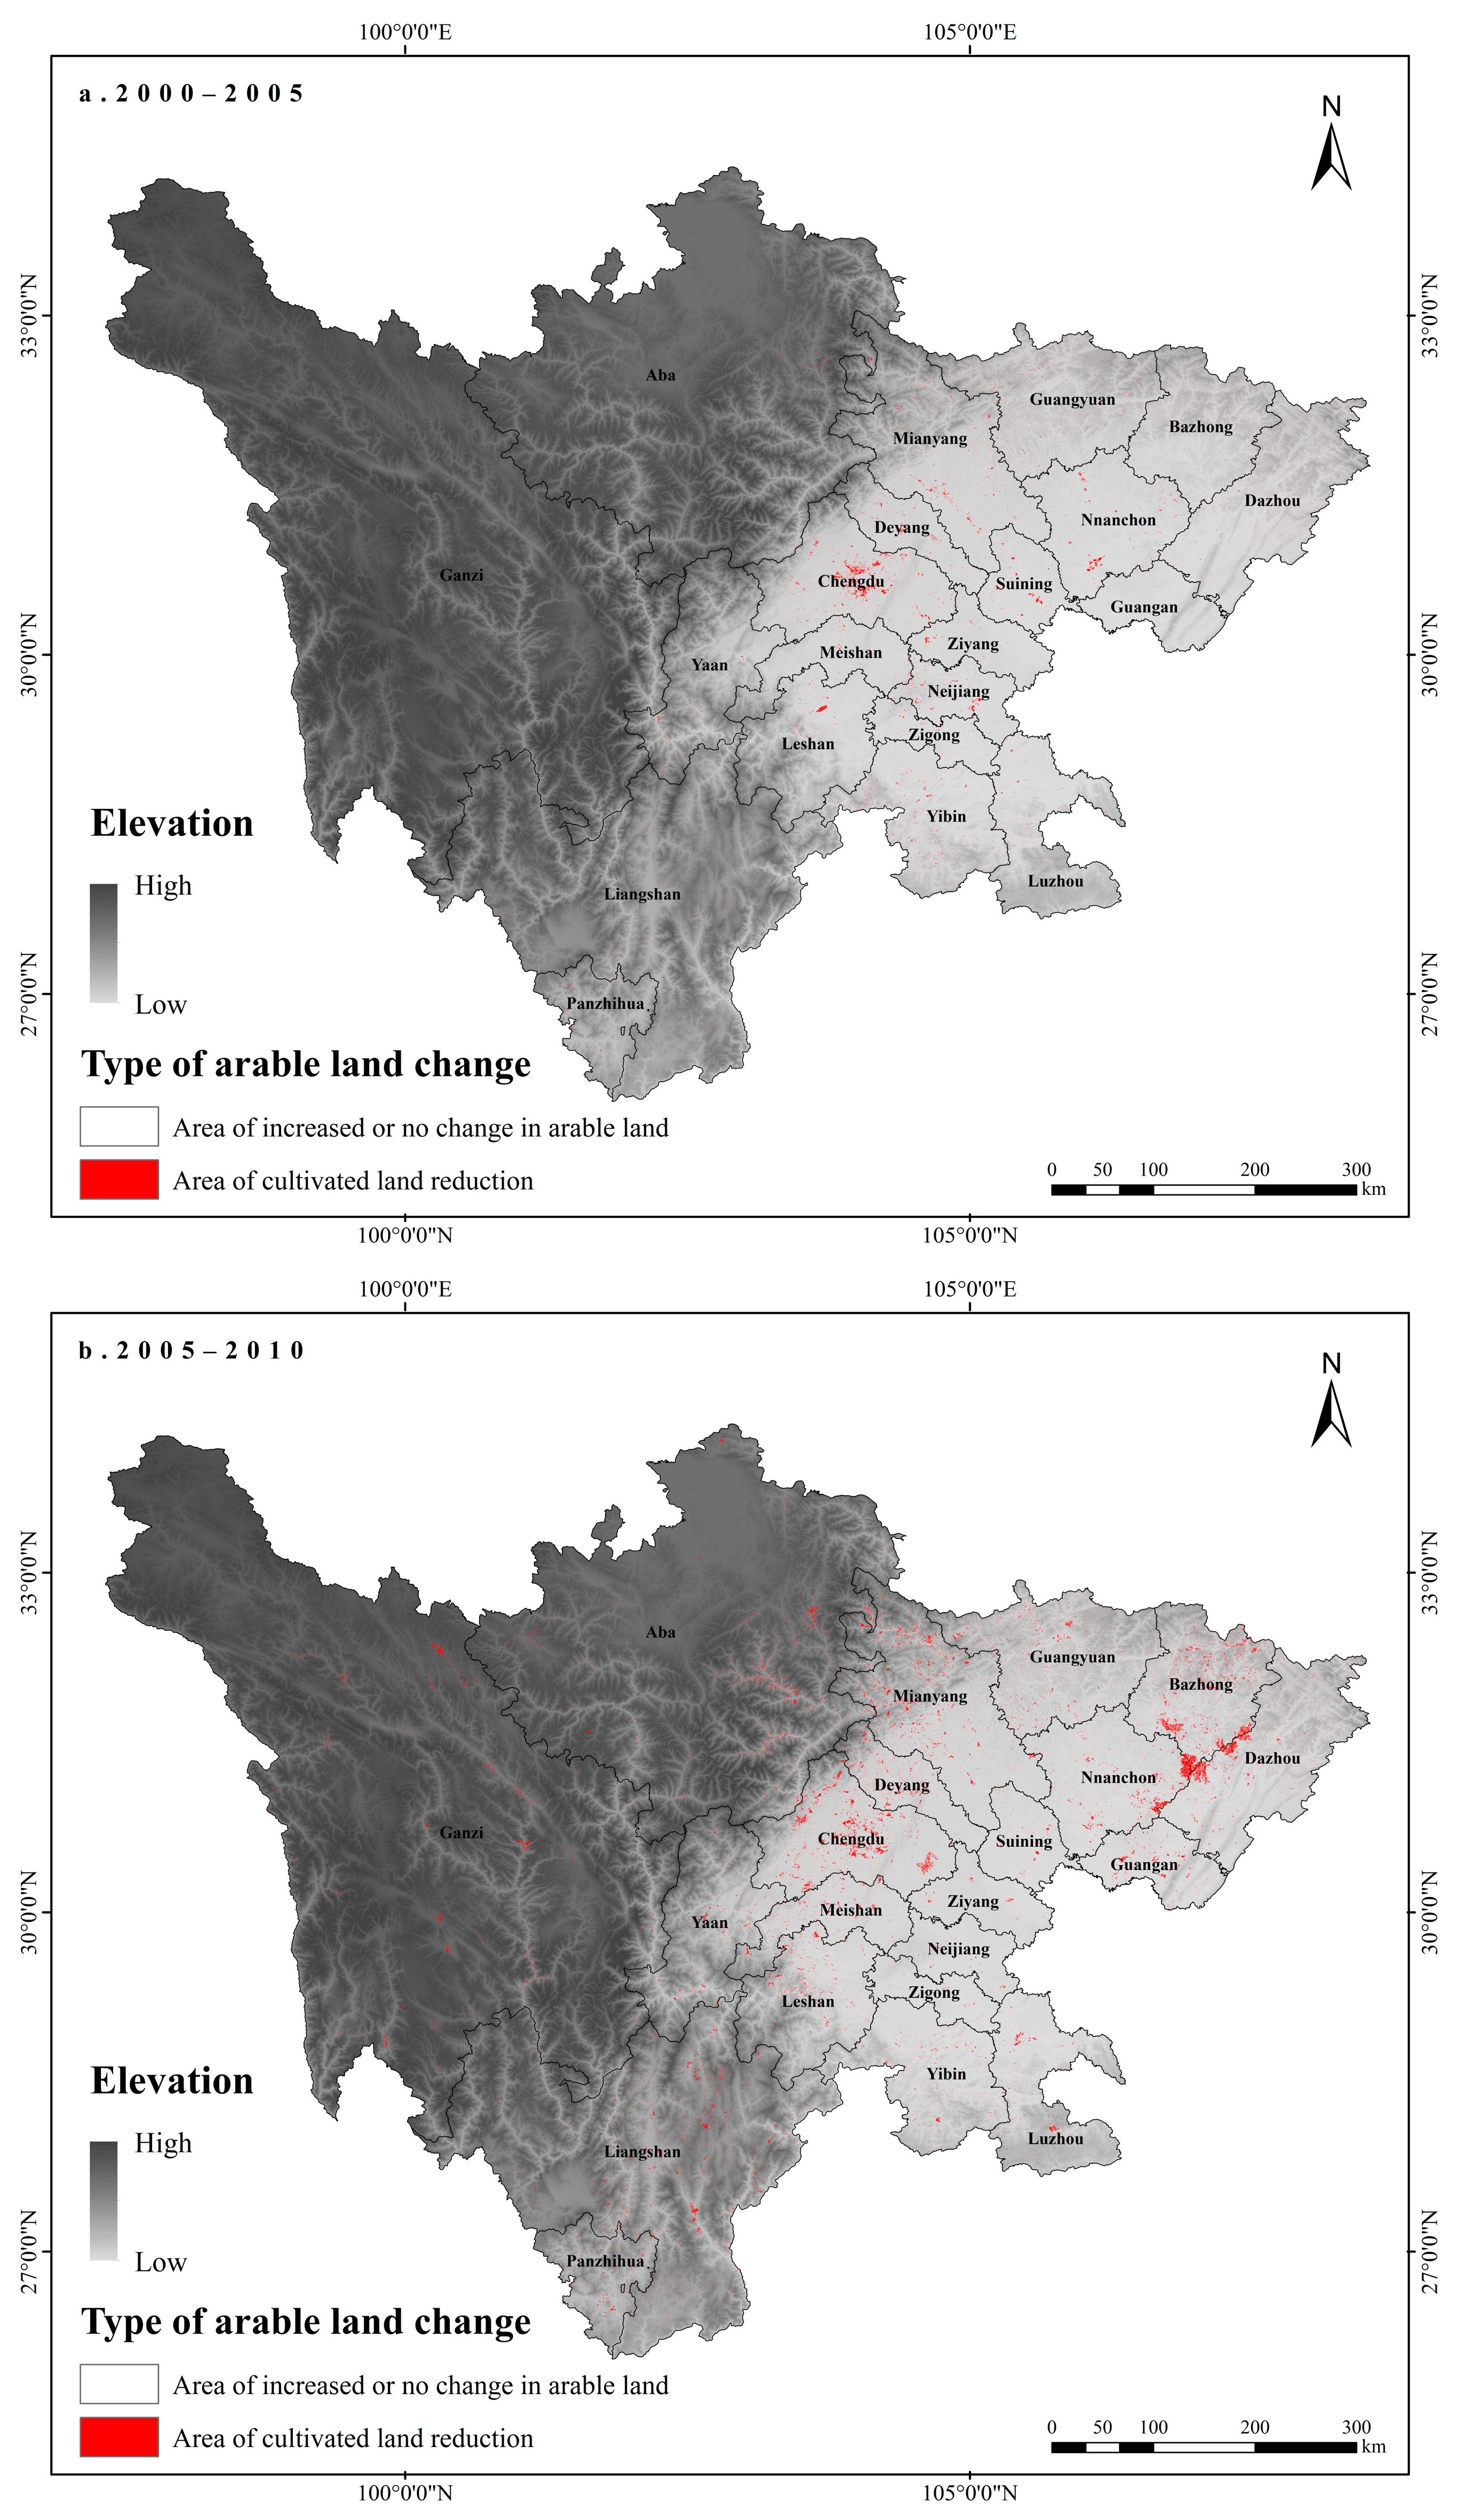
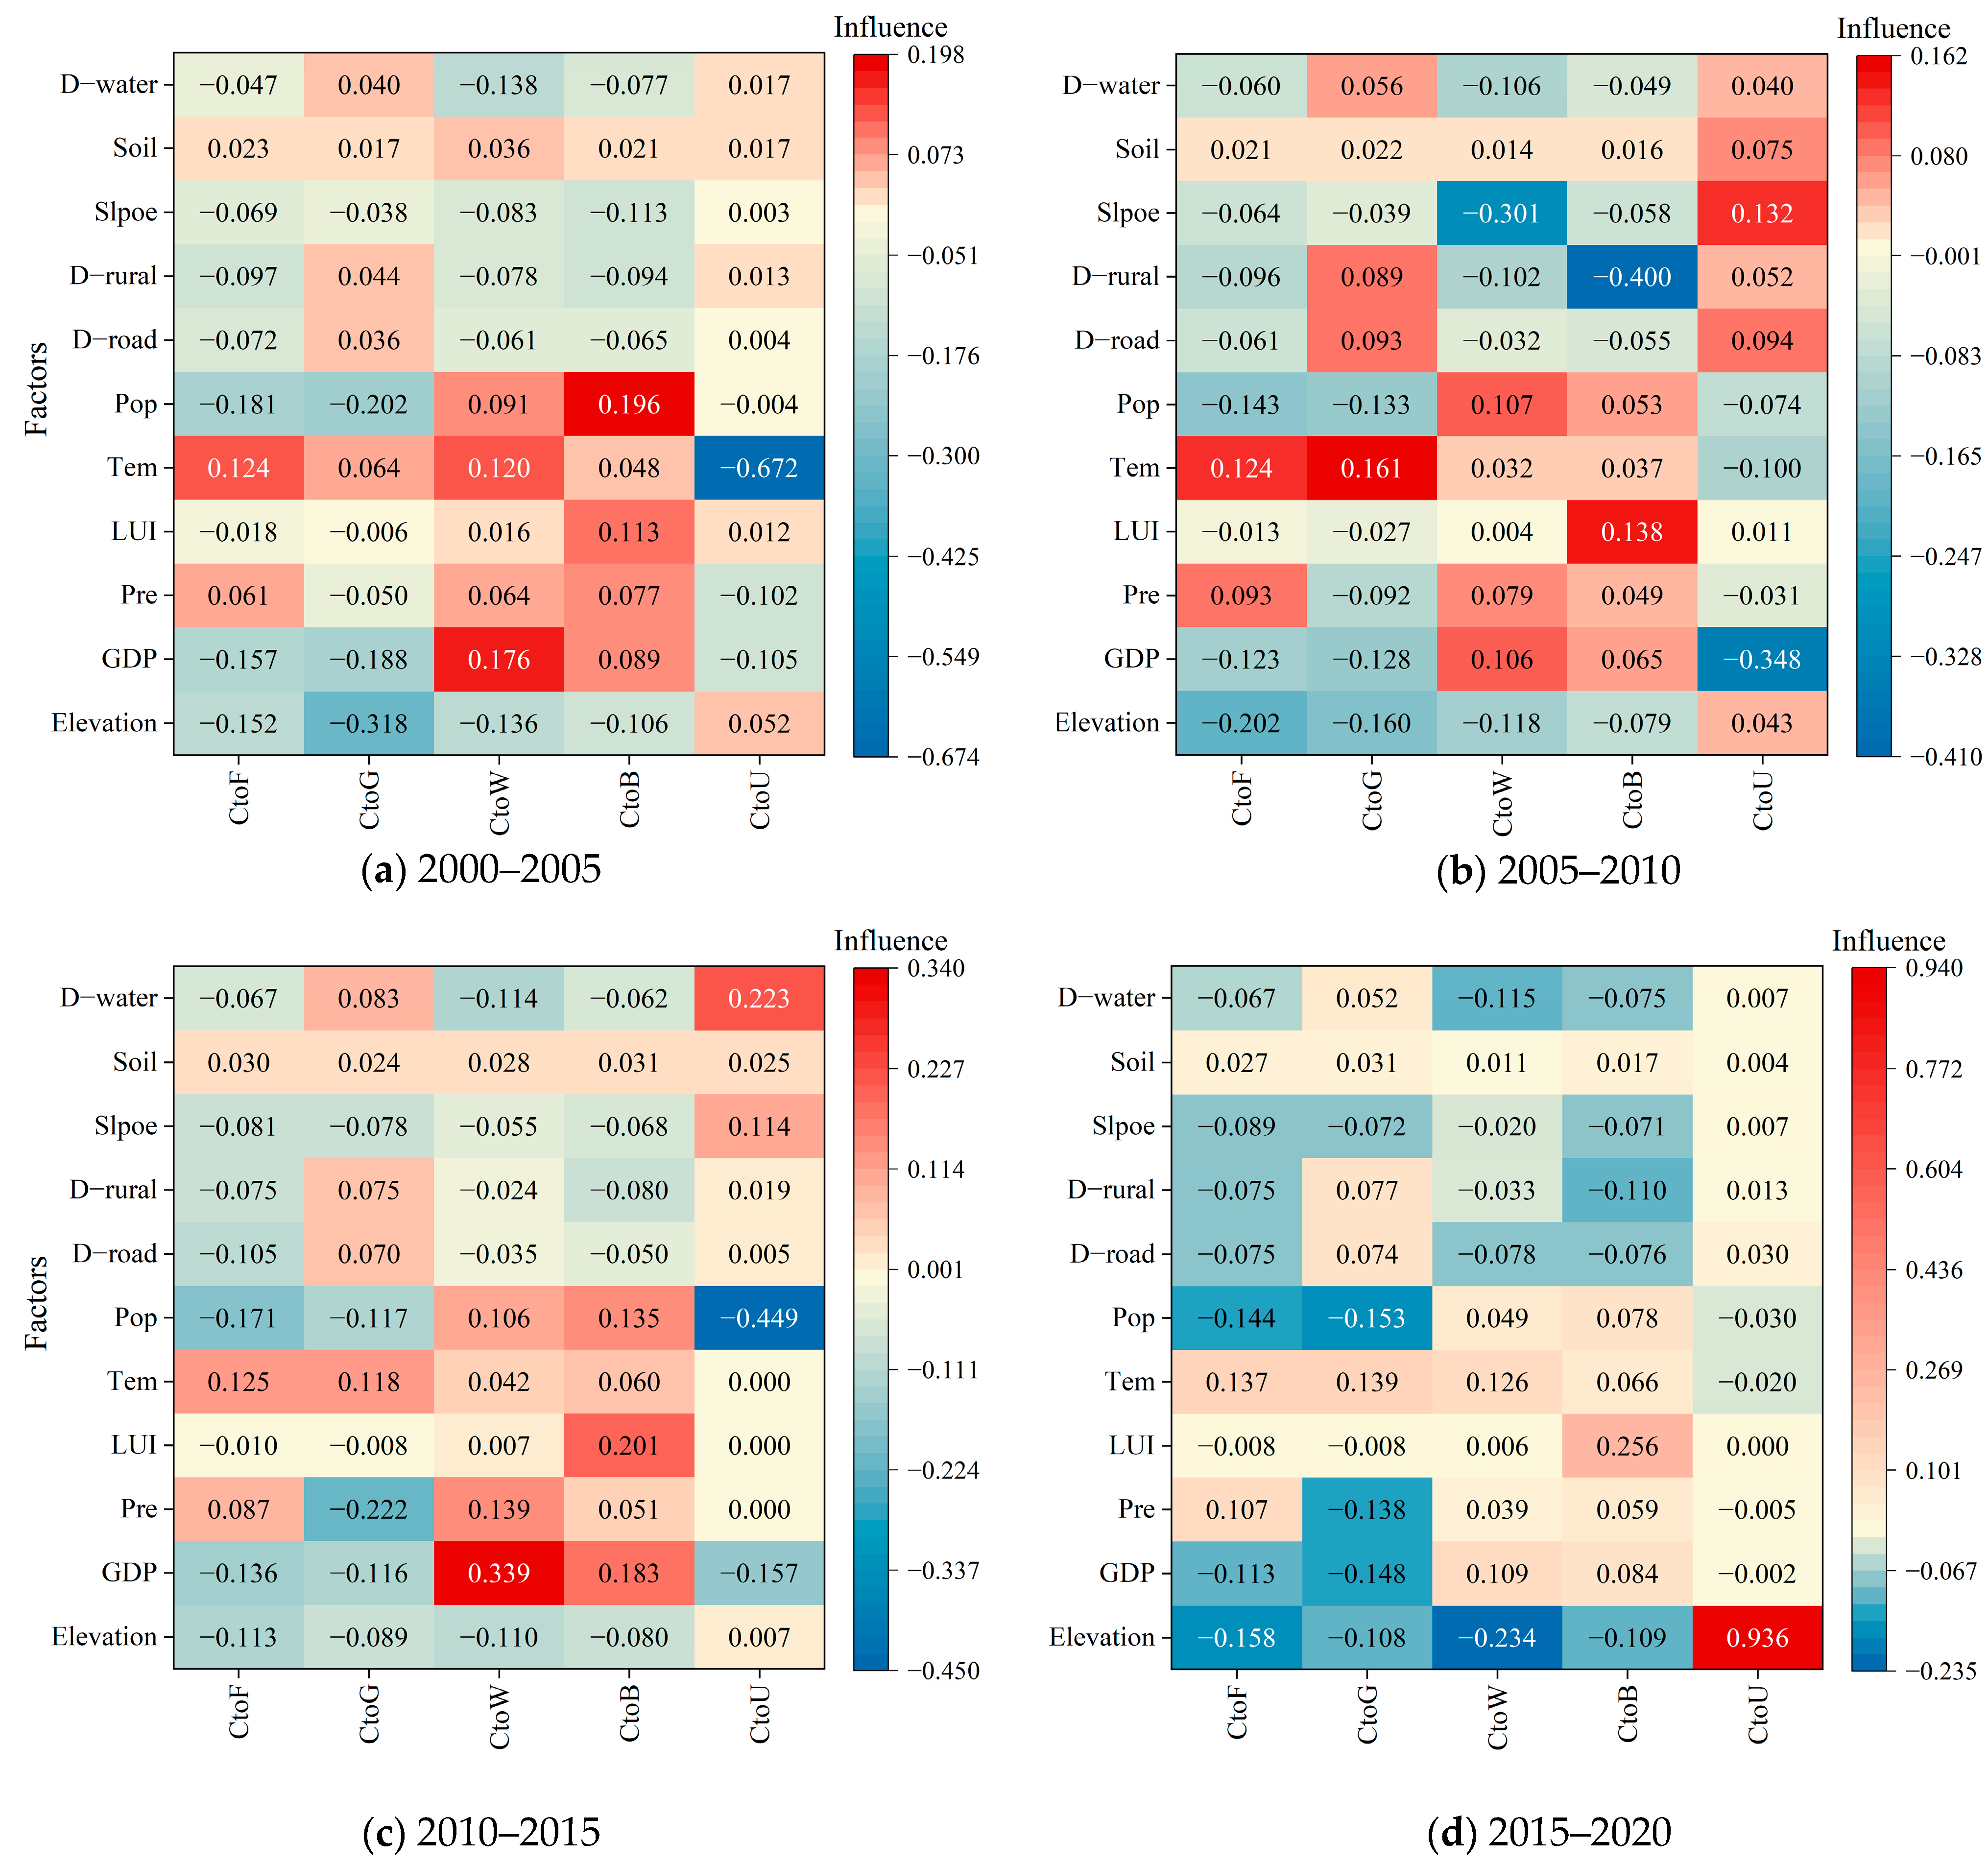
As mentioned earlier, the PLUS model analyzes the changes in patch expansion and spread. To analyze the driving mechanism of cultivated land patch reduction, ArcGis can be used to overlay the five land use data sets from 2000 to 2020 and extract the four images showing cultivated land patch reduction (
Figure 5). Based on the reduction of cultivated land patches in each year, the expansion and spread trend of cultivated land reduction from 2000 to 2020 can be obtained. The four images include information on five types of cultivated land reduction transfer types: conversion from cultivated land to forest (CtoF), conversion from cultivated land to grassland (CtoG), conversion from cultivated land to water (CtoW), conversion from cultivated land to construction land (CtoB), and conversion from cultivated land to unused land (CtoU). Additionally, 11 driving factors, including elevation, GDP, precipitation, land use intensity, temperature, population, distance to the road network, distance to rural residential areas, distance to water sources, slope, and soil, were imported into the PLUS model for analysis. The contribution of driving factors for different types of cultivated land reduction in each stage was obtained. Based on the spatial distribution of driving factors and their relationship on the map, the contribution values were positively or negatively assigned. Positive values indicate that the raster values of driving factors are positively correlated with the distribution of this reduction type. The higher the raster values of driving factors, the more concentrated the distribution of this reduction type in the area. Negative values indicate the opposite. The contribution data with positive and negative values was represented using a heatmap, where red represents a positive impact and blue represents a negative impact (
Figure 6).
Based on the spatial distribution of cultivated land reduction (
Figure 5) and the contribution degree of driving factors for cultivated land reduction (
Figure 6), the following results were obtained: Firstly, the main driving factors that persistently affect cultivated land reduction are elevation, temperature, GDP, and population distribution. General driving factors include precipitation, slope, distance to roads, distance to rural residential areas, and distance to water sources. Soil type and land use intensity are considered unimportant driving factors. Secondly, from the overall correlation of driving factors, elevation and slope are negatively correlated with the distribution of cultivated land reduction. The areas with a lower elevation and gentle slope are the main areas of cultivated land reduction. On the other hand, temperature and precipitation are positively correlated with the distribution of cultivated land.
In terms of the impacts on various types of land use change, (1) the driving factors affecting the conversion of cultivated land to forest land are mainly elevation, temperature, GDP, and population. Under similar conditions, the conversion of cultivated land to forest land is more concentrated in plain and mountainous areas with lower elevation, an underdeveloped economy, a sparser population, and a relatively higher temperature. In particular, precipitation has a positive impact on the conversion of cultivated land to forest land but is affected by terrain. The conversion of cultivated land to forest land is more likely to occur in areas with more precipitation in plain areas, while in mountainous areas, it mainly occurs in areas with less precipitation. (2) The driving factors affecting the conversion of cultivated land to grassland are mainly precipitation, population, and GDP distribution. Under similar conditions, the conversion of cultivated land to grassland is more concentrated in areas with less precipitation, a sparser population, and a lower GDP. (3) The main driving factors affecting the conversion of cultivated land to water areas are population and distance to the water source. In areas around cities with concentrated populations and along water sources, cultivated land is more easily converted to water. In areas around concentrated populations, the conversion is mainly caused by human activities such as occupying cultivated land to build ponds. (4) The driving factors affecting the conversion of cultivated land to construction land are mainly the distance to rural residential areas, population, and land development intensity. The conversion of cultivated land to construction land is more concentrated in areas with higher land development intensity and closer to rural residential areas. Areas with higher land development intensity have more construction land occupying cultivated land. It is worth noting that, unlike other contributing factors whose contribution values have unstable trends at different stages, the contribution of land development intensity to the conversion of cultivated land to construction land is steadily increasing at each stage. That is, the situation of “occupation” promoting “occupation” will become stronger and stronger. (5) In particular, the impact of population size (pop) on the conversion of cultivated land to construction land (CtoB) varies at different stages: from 2000 to 2005, it is characterized by a high value of 0.196; from 2005 to 2010, it is characterized by a low value of 0.053; from 2010 to 2015, it is characterized by a high value of 0.135; and from 2015 to 2020, it is characterized by a low value of 0.078. This pattern demonstrates alternating fluctuations between high and low values. (6) The main driving factors affecting the conversion of cultivated land to wasteland include precipitation, population, slope, elevation, etc. The conversion of cultivated land to wasteland mainly occurs in areas with poor cultivation conditions, such as high elevation, steep slopes, less precipitation, and being far from rural residential areas and roads, while areas with more suitable cultivation conditions have more cultivated land converted into forest land or construction land. Due to unfavorable natural and cultivation conditions, the cost and difficulty of using cultivated land are high, leading to abandonment and fallowing in these areas.
4. Discussion
4.1. Exploring the Temporal Changes in Cultivated Land in Sichuan Province
(1) Regarding the changes in the quantity of cultivated land, the amount of cultivated land in Sichuan Province has continued to decrease over the past 20 years, but the rate of decline has slowed since 2010. The management of cultivated land has shown improvement, and to achieve the development goal of maintaining a relatively stable amount of cultivated land as outlined in the ‘Sichuan Province Land Spatial Planning (2020–2035), it is recommended to maintain the strictest land protection system. Strict control over the approval of land occupation should be implemented, the “balance between occupation and compensation” policy for cultivated land should be implemented, and the “increase-decrease linkage” policy for urban and rural construction land should be carried out to promote the protection and quality construction of cultivated land.
(2) Sichuan Province is a typical city system, with Chengdu as the highest priority for development [
39]. Over the past decade, apart from Chengdu, the occupation of cultivated land in other cities has shown a tendency towards balance. That is, Sichuan Province has coordinated the amount of cultivated land occupied in some regions with medium levels of development. While ensuring the development of the leading city, it has given certain development space to the backward cities. The development mode of “compressing the middle and developing the two ends” has a certain reference significance. This also conforms to the differentiated regional cultivated land protection policies proposed in previous studies [
38].
(3) Over the past 20 years, nearly 50% of cultivated land has been converted to forest land (a conversion of 5838 km2). This can be attributed to the implementation of the ‘Grain for Green’ project, which has been vigorously promoted in Sichuan Province since 1999. However, it is worth noting that forest land is also the main source of increased cultivated land (a conversion of 5597 km2). The changes in the quantity of the two are basically equal, indicating that Sichuan Province has fully considered the coordination between agricultural space and ecological space in the process of implementing the “Grain for Green” project. From the perspective of food security and the coordinated and orderly development of ecology and harmony in the new era, it is necessary to further increase cultivated land in major grain and oil production areas such as Nanchong City, Deyang City, and the Anning River Valley, implement “Grain for Green” in ecologically fragile areas such as Qionglai Mountain, Min Mountain, and Aba Prefecture, restrict the expansion of construction land, and achieve the coordinated and orderly development of agriculture stability and ecological conservation.
(4) Due to the irregular cutting of construction land, the shape of cultivated land landscapes has become more complex and irregular, developing from a small number of large blocks to dispersed small blocks. In the future, it is necessary to coordinate intensive land use to promote efficient use of cultivated land and construction land, carry out land consolidation, promote the consolidation of agricultural land and construction land, merge scattered cultivated land, ensure concentrated and contiguous cultivated land, accelerate the planning and implementation of high-standard arable land construction, and lay out basic supporting facilities to avoid the disorderly and irregular cutting of cultivated land caused by urban expansion.
4.2. Exploration of Driving Factors for Arable Land Reduction in Sichuan Province
(1) Among the natural environmental factors, due to their significance as environmental conditions impacting plant growth, including forests and crops, elevation, average temperature, and precipitation primarily influence land use change in three land types: forests, croplands, and grasslands. Overall, average temperature and precipitation primarily determine the agricultural conditions in a region. Forests and grasslands have higher tolerance thresholds for average temperature and precipitation compared to croplands. Consequently, excessively high or low temperatures and precipitation can lead to the conversion of croplands into other land types. ① The northwestern mountainous regions, with consistently low temperatures, are unsuitable for cultivation, resulting in fewer croplands compared to the eastern regions with milder temperatures, where cropland-to-forest conversion is more common. ② Excessive precipitation in plains regions favors tree growth rather than crop cultivation. In mountainous areas, where precipitation is lower than in plains regions, croplands are mainly distributed in valleys with relatively better planting conditions. Therefore, areas with less precipitation lead to the abandonment of croplands, gradually transforming them into forests similar to the surrounding areas. ③ In areas with lower precipitation, croplands become uncultivable, gradually transforming into grasslands similar to the surrounding areas and eventually even into fallow lands.
In the realm of social and economic factors, GDP and population exhibit a high degree of spatial overlap. Due to the challenges associated with development in the western mountainous regions, urbanization in Sichuan Province is concentrated in the eastern plains. Consequently, the eastern regions have a higher GDP and population, and the agricultural conditions are conducive to cultivation. In contrast, the less economically developed and sparsely populated western mountainous regions face unfavorable cultivation conditions, increasing the likelihood of cropland abandonment and subsequent degradation into forests and grasslands.
(2) Over the past 20 years, nearly 85% of the spatial growth of construction land in Sichuan Province has come from the occupation of arable land. Among the land types that have been converted to arable land, only 4.03% of the construction land has been converted. The occupation of arable land by construction land mainly occurs in the Chengdu Plain area, where the farming conditions are better. It is not difficult to find, based on the current situation and existing research, that urban development will occupy areas with better natural conditions [
16,
18,
19,
22]. Agricultural planting and urban development often have “dual suitability” in land use, which leads to a natural opposition and competitive relationship between the expansion of construction land and the protection of arable land.
Furthermore, this study found that the contribution of land development intensity to the expansion of construction land is steadily increasing. That is, the increase in land development intensity will further promote the occupation of surrounding arable land by construction land. This leads to a Matthew effect in which the ability to erode surrounding arable land increases with the degree of urban development, resulting in arable land being increasingly at a disadvantage in the competition for “dual suitability”. In the future, it is necessary to strictly follow the requirements of national land spatial planning, implement urban development boundaries, strictly observe ecological and arable land protection red lines, and avoid ecological protection areas and arable land falling into the dilemma of being occupied disorderly and without restraint in the competition of “dual suitability” with urban development.
(3) Due to the population influx, the demand for construction land has increased, promoting the expansion of construction land. The population growth in Sichuan Province from 2000 to 2005 facilitated the expansion of urban construction land. However, during 2005–2010, the preceding phase of urban expansion resulted in a surplus of construction land, leading to a diminished influence of population on the conversion of cultivated land to construction land. This recurring pattern is manifested in the alternating fluctuations of high and low values in the impact of population size (pop) on the conversion of cultivated land to construction land (CtoB). The stage with high contribution can be defined as the “stage of tight urban construction land space”, while the stage with low contribution can be defined as the “stage of surplus urban construction land space”. This is a phenomenon of land urbanization and population urbanization lagging behind each other [
40]. After 2020, Sichuan Province will enter the stage of tight urban construction land space, and the construction of new urban areas will be more vigorous. It is necessary to make rational use of the built-up area, avoid excessive occupation, and prevent land waste. At the same time, we should grasp the carrying capacity of regional resources and environments, plan for future population trends, actively explore the construction of Chengdu-Chongqing urban agglomerations, metropolitan areas, and urban sub-centers, and prevent urban disorderly expansion modes in which population pressure forces urban construction, which in turn excessively introduces population.
5. Conclusions
(1) From 2000 to 2020, the reduction in cultivated land in Sichuan Province amounted to 3415.79 square kilometers. Although the decline in cultivated land continues, there has been a positive shift in the situation, with a gradual decrease in the extent of reduction. Since 2013, the implementation of various measures for cultivated land protection by the Chinese government, such as the “18 billion mu cultivated land protection red line,” “permanent basic farmland,” and land use control, has played a significant role in delineating protection goals, land management, legislation, and penalties, thereby effectively promoting cultivated land conservation.
(2) From 2000 to 2020, Chengdu City experienced a significantly higher rate of cultivated land reduction compared to other cities. However, for cities other than Chengdu, the degree of variation in cultivated land reduction has substantially decreased since 2010, indicating a gradual convergence in the amount of cultivated land occupation among these cities. It can be inferred that, in the process of urban development in Sichuan Province, by reducing the cultivated land occupation indicators for moderately developed cities, a greater allocation of cultivated land occupation indicators and development space has been provided to Chengdu City, which exhibits a higher level of development. This prioritized approach to the development of key cities may serve as a reference for grain-producing regions in their urban development strategies.
(3) ”Forest land,” “construction land,” and “grassland” are the primary directions for the conversion of cultivated land, accounting for 49.18%, 26.87%, and 19.05%, respectively. Interestingly, the quantity of forest land converted into cultivated land is roughly equivalent to the quantity of cultivated land converted into forest land, suggesting a mere spatial exchange between the two. As a major grain-producing region, Sichuan Province employs spatial repositioning as a means to balance cultivated land and ecological conservation. This approach involves transferring forest land and cultivated land to suitable development areas while maintaining the overall quantity of both land types. Among the primary directions for land conversion, construction land only accounts for a mere 4.03% of the transferred cultivated land, indicating that the main cause of cultivated land reduction is the occupation of construction land.
(4) In Sichuan Province, cultivated land patches are gradually becoming irregular in shape, with reduced aggregation and increased fragmentation. The influence of human activities on cultivated land is gradually increasing, resulting in a decrease in the number of cultivated land patches per unit area. In the future, it will be crucial to enhance the scale of utilization of cultivated land and prevent unregulated fragmentation caused by the occupation of construction land.
(5) From the perspective of the driving factors behind the reduction in cultivated land, two key points can be highlighted. Firstly, conflicts arise in certain regions where there is a simultaneous demand for urban development and agricultural cultivation. It is worth noting that this land-use conflict involves an unequal competitive relationship. Due to the continuous intensification of land development, which promotes the conversion of cultivated land to construction land, the position of cultivated land in the competition for “dual suitability” with construction land becomes increasingly disadvantaged. To mitigate this issue, grain-producing areas should establish protected boundaries around urban areas to safeguard cultivated land, preventing the relentless encroachment of urban spaces that possess competitive advantages. Secondly, the impact of population size on the “conversion of cultivated land to construction land” exhibits a characteristic pattern of alternating high and low values at different stages. This pattern indicates the alternating occurrence of population excess and excessive construction land in the urban development process of Sichuan Province. In other words, there is an alternating relationship between population urbanization level and land urbanization level. Presently, Sichuan Province is in a stage of surplus spatial construction land, emphasizing the need to reduce the developmental encroachment of construction land on cultivated land.
Author Contributions
Conceptualization, D.Z. and H.D.; methodology, D.Z.; software, D.Z.; validation, D.Z.; formal analysis, D.Z. and H.D.; resources, D.Z.; data curation, D.Z.; writing—original draft preparation, D.Z.; writing—review and editing, H.D.; visualization, D.Z.; supervision, H.D.; project administration, H.D. All authors have read and agreed to the published version of the manuscript.
Funding
This research received no external funding.
Data Availability Statement
Conflicts of Interest
The authors declare no conflict of interest.
References
- Chen, Y.F.; Wang, J.Y.; Zhang, F.R.; Liu, Y.S.; Cheng, S.K.; Zhu, J.; Si, W.; Fan, S.; Gu, S.; Hu, B.; et al. New patterns of globalization and food security. J. Nat. Resour. 2021, 36, 1362–1380. [Google Scholar] [CrossRef]
- Zhu, J.; Zang, X.Y.; Li, T.X. China’s Food Security Risks and Prevention Strategy Under the New Development Pattern. Chin. Rural. Econ. 2021, 9, 2–21. [Google Scholar]
- Wang, J.; Li, X. Research on the Change Trend of Farmland Quantity in China for Recent 20 Years and Its Driving Factors. Chin. J. Agric. Resour. Reg. Plan. 2019, 40, 171–176. [Google Scholar]
- Qi, X.; Zhang, Z.; Huang, X. The Contradiction of Cultivated Land Protection in the New Era and Its Innovative Countermeasures. China Land Sci. 2018, 32, 9–15. [Google Scholar]
- Tang, H.; Li, Q.; Li, Y. On the characteristics and influencing factors of non-grain growing use of arable land in Sichuan Province. J. Neijiang Norm. Univ. 2022, 37, 77–84. [Google Scholar]
- Chen, Z.; Shi, D.; He, W.; Xia, J.; Jin, H. Quality evaluation of slope farmland in Yunnan Province based on “element-demand-regulation” framework. Trans. Chin. Soc. Agric. Eng. 2020, 36, 236–246. [Google Scholar]
- Zhang, Y.; Zhou, Z.F.; Huang, D.H.; Zhu, M.; Wu, Y.; Sun, J.W. Spatio-temporal evolution of cultivated land and analysis of influence factors in karst mountainous areas. Trans. Chin. Soc. Agric. Eng. 2020, 36, 266–275. [Google Scholar]
- Zhao, X.; Zhang, Z.; Wang, X.; Zuo, L.; Liu, B.; Yi, L.; Xu, J.; Wen, Q. Analysis of Chinese cultivated land′s spatial-temporal changes and causes in recent 30 years. Trans. Chin. Soc. Agric. Eng. 2014, 30, 1–11. [Google Scholar]
- Amannisa, K.; Mansuer, S.; Aikedan, Y.; Asiya, A.; Kunbike, B. Spatiotemporal evolution of arable land use in Aksu River Basin, Xinjiang in recent 19 years. Sci. Soil Water Conserv. 2022, 20, 72–80. [Google Scholar]
- Wang, M.; Pan, K.; Wu, X.; Sun, X.; Zhang, L.; Pan, Z.; Chen, L. Temporal and spatial patterns and driving factors of cultivated land change in the Qinghai-Tibet Plateau. Chin. J. Appl. Environ. Biol. 2022, 28, 859–868. [Google Scholar]
- Zhu, J.; Xu, B. Evaluation of cultivated land quality under changed cultivated land use pattern based on change vector analysis. Trans. Chin. Soc. Agric. Eng. 2020, 36, 292–300. [Google Scholar]
- Sun, X.; Zheng, Y.; Zhao, R.; Shen, J.; Tian, S.; Fei, L. Temporal and spatial changes of land use pattern in Yangzonghai basin. Southwest China J. Agric. Sci. 2022, 35, 2387–2394. [Google Scholar]
- Wei, J.; Liu, L.; Wang, H.; Zhang, Y.; Wang, C.; Liu, J.; Fu, T.; Gao, H.; Liang, H.; Liu, Y. Spatiotemporal pat-terns of land-use change in the Taihang Mountain (1990−2020). Chin. J. Eco-Agric. 2022, 30, 1123–1133. [Google Scholar]
- Chen, L. Spatial Scale Characteristics and Driving Mechanism of Functional Transformation of Cultivated land Use—A Survey of Jialing River Basin, Sichuan Province. Res. Soil Water Conserv. 2022, 29, 327–335+342. [Google Scholar]
- Zhang, C.; He, H. The evolution of spatiotemporal patterns and the influencing factors of the multiple cropping index of cultivated land in Southwest China. Agric. Res. Arid. Areas 2020, 38, 222–230. [Google Scholar]
- Luo, F.; Pan, A.; Chen, Z.; Wang, Y. Spatiotemporal Pattern Change of Cultivated Land and Its Driving Forces in Yibin City, Sichuan Province During 1980–2018. Bull. Soil Water Conserv. 2021, 41, 336–344. [Google Scholar]
- Song, X.; Liang, Z.; Zhou, H.; Xiong, D. An Updated Method to Monitor the Changes in Spatial Distribution of Abandoned Land Based on Decision Tree and Time Series NDVI Change Detection:A Case Study of Puge County, Liangshan Prefecture, Sichuan Province, China. Mt. Res. 2021, 39, 912–921. [Google Scholar]
- Ding, S.; Li, M.; Wang, X.; Li, L.; Wu, R.; Huang, H. The Use of Time Series Remote Sensing Data to Analyze the Characteristics of Non-agriculture Farmland and Their Driving Factors in Fuzhou. Remote Sens. Technol. Appl. 2022, 37, 550–563. [Google Scholar]
- Li, H.; Shi, D.; Xia, R.; Ni, S.; Zhang, J.; Wang, R. Evolution characteristics and driving mechanism for the spatiotemporal pattern of sloping farmland in Chongqing based on geodetector. Trans. Chin. Soc. Agric. Eng. 2022, 38, 280–290. [Google Scholar]
- Wang, J.; Xu, C. Geodetector: Principle and prospective. Acta Geogr. Sin. 2017, 72, 116–134. [Google Scholar]
- Liang, X.; Guan, Q.; Clarke, K.C.; Liu, S.; Wang, B.; Yao, Y. Understanding the Drivers of Sustainable Land Expansion Using a Patch-Generating Land Use Simulation (PLUS) Model: A Case Study in Wuhan, China. Comput. Environ. Urban Syst. 2021, 85, 101569. [Google Scholar] [CrossRef]
- Zhou, L.; Pan, A.; Luo, F. Spatial-temporal Evolution and Driving Forces of Construction Land Expansion in Chengdu from 1980 to 2018. J. Southwest For. Univ. 2023, 43, 186–194. [Google Scholar]
- Hou, Q.; Chen, Y.; Fei, T.; Ji, Z.; Xie, B. Analysis of cultivated land’s spatio-temporal changes and influencing factors in Gansu Province in recent 25 years. Arid. Zone Res. 2022, 39, 955–967. [Google Scholar]
- Li, D.; Zhou, J.; Zhan, D. Spatial and Temporal Changes and Driving Factors of Cultivated Land in Heilongjiang Province. Sci. Geogr. Sin. 2021, 41, 1266–1275. [Google Scholar]
- Li, Y.; Xiao, L.; Hu, W.; Yi, M.; Xie, Y. Spatio-temporal Pattern of Land Use Change in Changsha-Zhuzhou-Xiangtan Core Areas and Its Driving Forces. Econ. Geogr. 2021, 41, 173–182. [Google Scholar]
- Ma, R.; Fan, Y.; Wu, H.; Zhu, L.; Ma, X.; Fan, X.; Zhang, H. Simulation of land-use patterns in arid areas coupled with GMOP and PLUS models. J. Agric. Resour. Environ. 2023, 40, 143–153. [Google Scholar]
- Shu, R.; Sun, H.; Zou, Y.; Hou, Q. Driving Forces of Spatio-Temporal Changes in Cultivated Land in Ningxia Eco-economic Belt Along Yellow River. Bull. Soil Water Conserv. 2021, 41, 267–274+365. [Google Scholar]
- Wang, Q.; Song, G. Changes of cultivated land pattern and its spatial driving factors in the typical regions of Lower Liaohe Plain. Trans. Chin. Soc. Agric. Eng. 2021, 37, 275–283. [Google Scholar]
- Wang, X.; Yang, Q.; Zeng, Q.; Zhang, J.; Li, J.; Li, Y.; Zhu, Y. Spatial-temporal Pattern Evolution of Cultivated Land in Sichuan Province from 1999 to 2018. Chin. Agric. Sci. Bull. 2021, 37, 110–116. [Google Scholar]
- Fan, S.; Liu, Z.; Zhu, M.; Zhang, M. Time series change and influencing factors of land use in Guangzhou city based on geodetector. Southwest China J. Agric. Sci. 2022, 35, 2276–2289. [Google Scholar]
- Wen, G.; Zhao, M.; Xie, H.; Zhang, Y.; Zhang, J. Analysis of land vegetation cover evolution and driving forces in the western part of the Ili River Valley. Arid. Zone Res. 2021, 38, 843–854. [Google Scholar]
- Liu, J.; Deng, X. Progress of the research methodologies on the temporal and spatial process of LUCC. Chin. Sci. Bull. 2009, 54, 3251–3258. [Google Scholar] [CrossRef]
- Luo, H.; Yang, C. Analysis of land-use change and its driving forces in Sichuan province from 2005 to 2015. Ecol. Sci. 2021, 40, 86–94. [Google Scholar]
- Tang, X.; Chen, B.; Lu, Q.; Fang, L. Analysis on the Landscape Patterns Change of Land Use in Urban Fringe Area: A Case Study in Daxing District of Beijing. China Popul. Resour. Environ. 2010, 20, 159–163. [Google Scholar]
- Tang, W.; Wang, Y.; Li, Q. Fragmentation of Cultivated Land Based on Landscape Index—A Case Study of Five Typical Villages in Sichuan Basin. J. China West Norm. Univ. (Nat. Sci.) 2019, 40, 413–419. [Google Scholar]
- Zhao, Q.; Wang, P.; Chen, H.; Yang, Z.; Zhang, Y.; Sun, S. Spatial-temporal Change of Land-use Pattern in Upper Region of Yangtze River—A Case Study in Yibin City of Sichuan Province. Bull. Soil Water Conserv. 2018, 38, 210–216+2. [Google Scholar]
- Yang, S.; Su, H.; Zhao, G. Multi—scenario simulation of urban ecosystem service value based on PLUS model: A case study of Hanzhong city. J. Arid. Land Resour. Environ. 2022, 36, 86–95. [Google Scholar]
- Ma, A.; Tang, P. Externality Spatial Spillover and Regional Fiscal Transfer of Cultivated Land Protection under Planning Control: An Empirical Study Based on Sichuan Province. Resour. Environ. Yangtze Basin 2020, 29, 776–784. [Google Scholar]
- Jing, Z.; Yang, Y.; Xia, J.; Zhang, P. Characteristics of Scale Structure and Spatial Structure of City System in Sichuan Province. Areal Res. Dev. 2021, 40, 57–62. [Google Scholar]
- Wang, X. Relative Efficiency Evaluation of Land Urbanization and Population Urbanization in China. Ecol. Econ. 2016, 32, 14–17, 23. [Google Scholar]
| Disclaimer/Publisher’s Note: The statements, opinions and data contained in all publications are solely those of the individual author(s) and contributor(s) and not of MDPI and/or the editor(s). MDPI and/or the editor(s) disclaim responsibility for any injury to people or property resulting from any ideas, methods, instructions or products referred to in the content. |
© 2023 by the authors. Licensee MDPI, Basel, Switzerland. This article is an open access article distributed under the terms and conditions of the Creative Commons Attribution (CC BY) license (https://creativecommons.org/licenses/by/4.0/).


