Article

Temporal and Spatial Variations in Landscape Habitat Quality under Multiple Land-Use/Land-Cover Scenarios Based on the PLUS-InVEST Model in the Yangtze River Basin, China

College of Water Resources, North China University of Water Resources and Electric Power, Zhengzhou 450045, China
*
Authors to whom correspondence should be addressed.
Land 2023, 12(7), 1338; https://doi.org/10.3390/land12071338
Submission received: 6 May 2023 / Revised: 13 June 2023 / Accepted: 28 June 2023 / Published: 4 July 2023

Abstract

:
Despite the Yangtze River Basin (YRB)’s abundant land and forestry resources, there is still a dearth of research on forecasting habitat quality changes resulting from various geographic and environmental factors that drive landscape transformations. Hence, this study concentrates on the YRB as the focal area, with the aim of utilizing the Patch Landscape Upscaling Simulation model (PLUS) and the habitat quality model to scrutinize the spatial distribution of landscape patterns and the evolution of HQ under four scenarios: the natural development scenario (NDS), farmland protection scenario (CPS), urban development scenario (UDS), and ecological protection scenario (EPS), spanning from the past to 2030. Our results show that (1) from 2000 to 2020, the construction land in the YRB expanded at a high dynamic rate of 47.86% per year, leading to a decrease of 32,776 km2 in the cultivated land area; (2) the UDS had the most significant expansion of construction land, followed by the NDS, CPS, and EPS, which had higher proportions of ecologically used land such as forests and grasslands; (3) from 2000 to 2020, the HQ index ranged from 0.211 to 0.215 (low level), showing a slight upward trend, with the most drastic changes occurring in the low-level areas (−0.49%); (4) the EPS had the highest HQ (0.231), followed by the CPS (0.215), with the CPS increasing the HQ proportion of the lower-level areas by 2.64%; (5) and in addition to government policies, NDVI, DEM, GDP, and population were also significant factors affecting landscape pattern and changes in habitat quality.

1. Introduction

Human activities and climate change are transforming Earth’s ecosystems in ways that threaten their well-being and sustainability [1]. These changes have far-reaching consequences for the ecological environment on a local, regional, and global scale [2], particularly affecting the habitat quality (HQ) for biological organisms [3]. HQ, which reflects to some extent regional biodiversity landscape pattern dynamics, has become one of the significant risk factors affecting HQ [4], which changes the composition and structure of habitats and ultimately affects the material circulation and energy flow between habitat patches [5]. Currently, more than two-thirds of the world’s ice-free land surface has undergone some form of human activity [6]. The scope, magnitude, and implications of global land use are unprecedented in Earth’s history [7], making it the primary driver of biodiversity decline worldwide [8]. Hence, investigating the correlation between landscape patterns and HQ and effectively forecasting and assessing the dynamics of LUCC pattern evolution under varying scenarios are crucial ecological issues for the future and hold significant importance in safeguarding regional biodiversity and promoting sustainable LUCC practices [9].
HQ is a pivotal parameter of ecosystem service functionality and ecosystem health [10], and assessing HQ and developing models for predicting its future evolution based on landscape patterns are crucial for comprehending the ecological stability of watersheds [11]. Many HQ models have been developed internationally according to research needs, the most common of which is the habitat suitability model HIS [12], C-Plan [13], and Maxent [14]. However, these models are challenging to apply because they require species biodiversity data and information on the number of species present in the environment. The Integrated Valuation of Ecosystem Services and Tradeoffs (In-VEST) model system provides a quick evaluation of the functional volume of ecosystem services [15]. Its HQ module enables a rapid assessment of the impacts of different threat sources and LUCC [16]. The In-VEST model has the advantages of easy data access, minimal requirements, accurate analytics, and simple operation and data processing [17,18]. The model has been successfully used to assess HQ [19], the impact of urban expansion on the HQ [20], and predicted future HQ through simulations [21,22]. It has also explored the relationship between landscape pattern intensity, population density, and HQ [23]. Notwithstanding, the existing research has predominantly centered on protected areas and habitats of individual species, with inadequate emphasis given to transformations occurring at the core of major watersheds. Hence, there is a pressing need to direct more attention towards this issue.
As previously discussed, the PLUS and In-VEST models are widely used. Still, there needs to be more studies involving the coupled PLUS-In-VEST models to evaluate and simulate the future evolution of land use and habitat quality characteristics in various scenarios. The YRB holds immense importance as a zone for economic development in China and is also acknowledged as a Global 200 freshwater ecosystem by the World Wildlife Fund (WWF) [24]. Due to the significant transformation of patterns and the fragile ecosystems present in the YRB [25], there are minimal modeling changes in LUCC, HQ, and coupling the driving mechanisms for the YRB and even the entire Asian basin.
Thus, the objectives of this study were as follows: (a) to establish the CA-Markov-PLUS model and the In-VEST-HQ model based on the history of LUCC patterns; (b) to simulate the changes in landscape pattern and HQ under multiple scenarios for 2030 (natural development scenario (NDS), cropland protection scenario (CPS), urban development scenario (UDS), and ecological protection scenario (EPS)); and (c) to conduct a comprehensive analysis of the temporal and spatial fluctuations in HQ levels across various scenarios and to explore the underlying mechanisms that drive the changes in landscape patterns and HQ. This research is anticipated to provide scientific backing for the conservation of watersheds and the promotion of sustainable development practices by building upon previous studies on land-use modeling and pattern analysis.

2. Materials and Methods

2.1. Study Area and Data Processing

The YRB, located between 90°33′~122°25′ east, and 24°30′~35°45′ north (Figure 1), is the third most extended river basin in the world (about 6397 km) and the third most significant basin in the world (1.8 million km2). Originating on the southwest side of Mount Tangulah in the Qinghai–Tibet Plateau, it spans three major economic zones in southwest, central, and eastern China. It flows west to east into the East China Sea [26]. The Yangtze River Basin boasts a temperate climate, ample precipitation, intricate topography, diverse land-use patterns, and extensive biological resources. Notably, the region harbors a significant proportion of China’s rare and endangered flora, accounting for 39.7% of the national total, and serves as a focal point for the conservation of endangered wildlife.
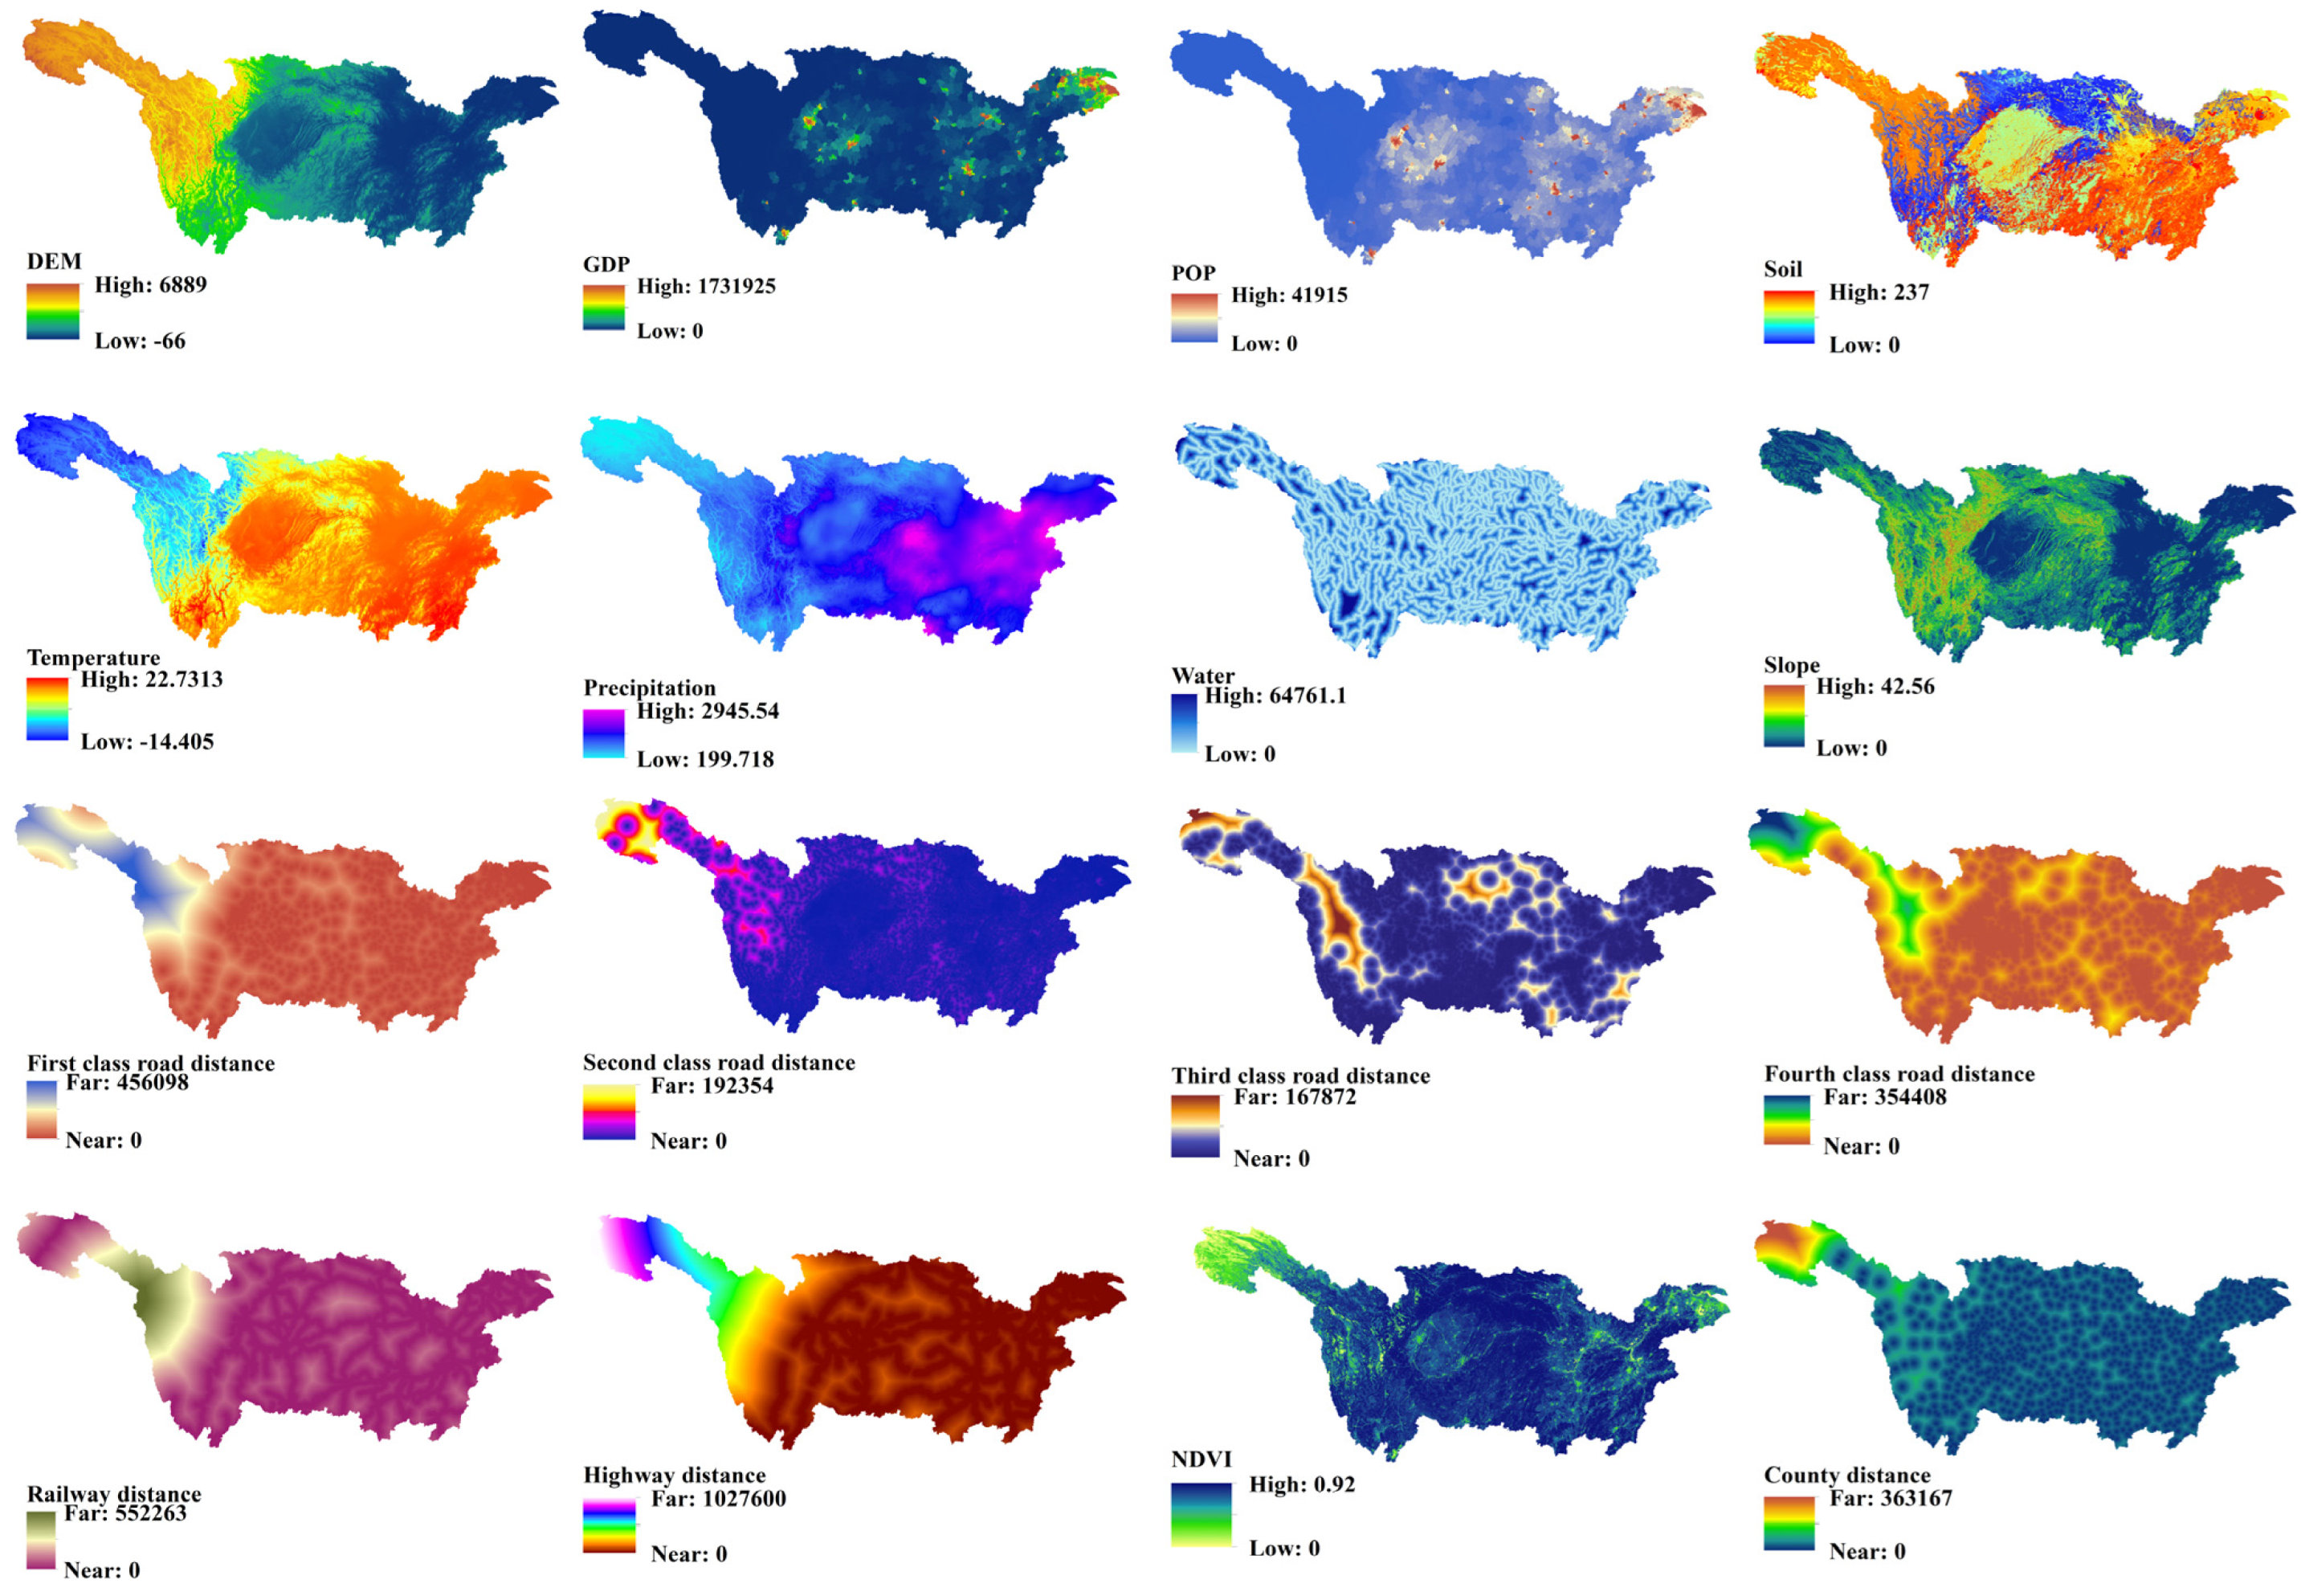
To ensure the precision and dependability of future HQ model simulations, we have identified crucial indicators from three perspectives: geographic environment, socioeconomic factors, and climate conditions. Concerning the geographic environment, the DEM is a digital elevation model utilized to depict terrain height and topography. A higher DEM value corresponds to better HQ, as high-altitude areas tend to harbor richer ecosystems and more biodiversity. Additionally, steeper slopes are associated with lower LUCC and ecosystem stability. Variations in soil types can also affect the stability of ecosystems and the survival and reproduction of organisms. For instance, black and red loam soils promote plant growth and development, while sandy soils have limited effects. Meanwhile, a higher NDVI coverage corresponds to better HQ, primarily because vegetation plays a crucial role in fulfilling the ecological functions required by the ecosystem. The water system is also a vital component of the ecosystem. Regarding socioeconomic factors, a higher density of GDP and population (POP) increases the likelihood of HQ destruction, since human production and living activities have a significant ecological impact. High temperatures and excessive rainfall can also have adverse effects on ecosystems. The distance from roads, counties, highways, and railways is mainly due to regional urbanization, industrialization, agricultural production, and the disruption and destruction of the ecological environment caused by transportation. In terms of climate, high temperatures can accelerate moisture evaporation and reduce soil moisture, leading to nutrient loss in the soil, reduced soil quality, and affected plant growth. Warmer temperatures can also alter the growing season and range of plants, as well as change key ecological processes, such as carbon and nitrogen cycles. Precipitation has a more significant impact on the hydrological cycle and water quality, and excessive precipitation can cause flooding and erosion, affecting soil moisture, plant growth, species diversity, and the productivity of ecosystems. Therefore, this study selected 16 driving factors, including the Yangtze River Basin DEM, GDP, population density, soil type, temperature, precipitation, water, slope, distance from level I–IV roads, distance from county premises, distance from highways, distance from townships, NDVI, and more (Figure 2).
The data used in this study include land-use data, socioeconomic data, digital elevation model (DEM) data, and natural environment data. Sixteen sets of driving data were selected by selecting principles such as consistency, quantifiability, completeness, and significance of filtering and driving factors. The LUCC data used in this study were obtained from the Chinese Academy of Sciences Resources and Environmental Sciences in Data center (https://www.resdc.cn, accessed on 12 May 2022). The classification of land use was based on the land resource remote sensing survey classification standards designated by the Ministry of Land and Resources. The LUCC in the basin was reclassified from 67 categories to 6 primary land-use types: cropland, forest, grassland, water, construction land, and unused land. Construction land refers to land used for urban and rural residential areas, as well as industrial, mining, oil, salt, quarry, transportation, and other purposes outside residential areas. The normalized difference vegetation index (NDVI) data are all from the Resource Environmental Science Data Center of the Chinese Academy of Sciences (https://www.resdc.cn, accessed on 12 May 2022) with a resolution of 1 km ×1 km: distance from water, distance from road, distance from rail, distance from high speed, according to the county station distance and other data from Open Street Map (https://www.openstreetmap.org, 9 May 2022), calculated using Euclidean space with a resolution of 1 km × 1 km. The Digital Elevation Model (DEM) data were obtained from the Geospatial Data Cloud Platform (http://www.gscloud.cn, accessed on 12 May 2022). To ensure that all collected data were better suited for the PLUS model, we processed the selected data using ArcGIS 10.4 software. We standardized all data to the geographic coordinate system GCS_WG_1984 and the projected coordinate system wgs_1984_um_zone_48n, with a column count of 3264 and a row count of 1432.

2.2. LUCC Simulation Based on PLUS Model

The PLUS model, which was utilized in this study, was developed by the HPSCIL@CUG Laboratory Development Team at China University of Geosciences [27]. It is a model combining a new LEAS based on the forecast of LUCC requirements for the Markov module, a common mining framework for models [28], and a CARS model based on stochastic plaque seeds [29]. The LEAS module can extract and sample land expansion between two phases of land-use change. To obtain the contribution rates of development probabilities and drivers for all types of land, stochastic forest algorithms were used in this study. The CARS module combines random seed generation and threshold reduction mechanisms to effectively mine and analyze the data. The automatic generation of plaque is simulated under the constraint of development probability. The advantage of the model over the traditional model is that it can better affect multiple types of land-use pattern changes and tap the drivers of land-use change [30]. Meanwhile, using the historical transfer probability matrix for the YRB’s 2010–2020 data, the corresponding transfer probability matrices are built using the Markov model for quantity prediction as per the requirements of the natural development, urban development, cropland protection, and ecological protection scenarios’ forecast of the size of the research area in 2030 under the four simulated scenarios of environmental protection, cropland conservation, nature development, and town growth. This paper uses the kappa coefficient to evaluate model accuracy.
P i j = P 11   P 12     P 1 n P 21   P 22     P 2 n           P n 1   P n 2     P nn   , a n d   j = 1 n P i j = 1 ( i , j = 1 ,   2 , , n )
where the transfer matrix of P i j is the unused type; S t , S t + 1 denote the t and t + 1 periods of the LUCC; n is the type of LUCC.

2.2.1. The Cellular Automata–Markov Model

The CA-Markov model (cellular automata–Markov model) is a land-use change prediction model based on cellular automata (CA) and Markov models [31]. Initially, the CA model is utilized to simulate the spatial distribution of land-use changes, followed by the Markov model to forecast future land-use changes. Specifically, the CA-Markov model establishes a cellular automaton model based on the study area’s characteristics and the type of land use, dividing the area into cells that represent various land-use types, such as unused land, forest, construction land, etc. Transfer probability between different land-use types is calculated based on historical land use and other relevant data. The transition matrix is built, and the results of the CA model prediction are used to calculate and weigh the probability of each cell using different functions in the future using Markov’s model [32]. Finally, future land-use patterns are projected by modeling future land-use changes through CA. The CA-Markov model has the advantage of considering spatial autocorrelation and the history of LUCC, simulating the spatial distribution and evolution of land-use changes.

2.2.2. The Land Expansion Analysis Strategy Module

In the land expansion analysis strategy (LEAS) module, the LUCC of the second phase was analyzed by extracting the regions where class changes occurred and randomly selecting sampling points [28]. The random forest classification algorithm was utilized to investigate the relationship between class expansion and multiple drivers in different regions, derive the development probability of classes in various areas, and determine the contribution of drivers to class expansion during different periods [33]. For this study, the decision tree value was set to 20, the default sampling rate was 0.01, the mTry did not exceed the number of driver factors, which was set to 16, and the number of parallel threads was set to 1. The calculation formula is as follows:
P i , k ( X ) d = n = 1 M I h n ( X ) = d M
where d can be 0 or 1. When d is 1, it means that other LUCC types change to the LUCC type k , and when it is 0, there is no change. X is the vector of driving factors, and h ( X ) is the land-use prediction type calculated when the decision tree is n . This is the indicator function of the decision tree. P is the probability of k LUCC-type growth at the spatial unit.

2.2.3. The Change Analysis, Resilience, and Sustainability Model

The change analysis, resilience, and sustainability (CARS) model for the evolution of multiple terrestrial patches adopts a multiple-type random patch seed mechanism based on the threshold decline [34]. Under the constraints of the LEAS module generation development probability, domain weight, and transition matrix, the total land use can meet future demands on a macro level [35]. For this study, the CARS parameters were set as follows: the neighborhood range was assigned to the default value of 3, thread was specified as 1, the decline threshold coefficient was set to 0.5, the diffusion coefficient was set to 0.1, and the random patch seed probability was set to 0.0001. Historical LUCC data and experience mainly set the transfer cost matrix. The neighborhood weight parameter represents the expansion intensity of different land-use types and reflects the expansion ability of local classes under the influence of spatial driving factors.
X i = T A i T A min T A max T A min
where X i is the neighborhood weighting parameter of a certain land type T A i is the amount of change of the land type T A during the study period. T A max , and T A min are the maximum and minimum changes of T A during the study period, respectively.
In this study, values were assigned based on the normalized value of land-use expansion in the previous stage. The neighborhood weight of each land-use type is as follows: cropland is 1, forest is 0.6, grassland is 0.8, water is 0.3, construction land is 1, and unused land is 0.5.

2.3. Accuracy Verification of the PLUS Model

The kappa coefficient is one of the commonly used indicators for evaluating the accuracy and consistency of classification, and can measure the consistency between the classification results and the actual situation. The definition of the kappa coefficient is the ratio of the classification accuracy to the random classification accuracy.
K a p p a = P 0 P c P p P c
where P 0 is the correct grid proportion to simulate, P P is the correct proportion to simulate under ideal conditions, and P C is the correct proportion to affect under random conditions. The value range of the kappa coefficient is between −1 and 1. When the kappa coefficient is 1, it indicates that the classification results are completely consistent with the actual situation. When the kappa coefficient is 0, it means that the classification results are consistent with the random classification results. When the kappa coefficient is negative, it indicates that the classification results are worse than the random classification results.

2.4. Setting of Future Scenarios

To explore land-use changes in the YRB under different development goals based on Chinese watershed policy and previous experience [36,37], this paper sets up four different LUCC transformation matrices to predict and simulate land use in the Yangtze River Basin in 2030. Natural development scenario (NDS): the parameters are not adjusted based on the extrapolation of existing trends. Cropland protection scenario (CPS): increased area conversion of forest, grassland, and unused land to cropland, reduced area conversion of cropped land to these land types, and increased pre-measurement of cropland as a result of simulations. Urban development scenario (UDS): the area of cropland, forest, and grassland converted to construction land increased, the area of construction land converted to the rest of the category decreased, and the simulation results increased the pre-measurement of construction land. Ecological protection scenario (EPS): to increase the transfer of unused land and cropland to forest, grassland, and water, reduce the transfer of forest, grassland, and water to other species, and improve the prediction of forest, grassland, and water in simulated years. The conversion cost matrix for the four scenarios is shown in Table 1, with a–f representing six LUCC types in turn; 0 means that it cannot be converted; 1 means that conversion is allowed.

2.5. Habitat Quality Assessment Based on In-VEST Model

The In-VEST model is designed to evaluate ecosystem service functions and simulate changes in ecosystem services under different landscape pattern scenarios. It presents results in raster charts and includes three significant modules for terrestrial, marine, and freshwater ecosystem assessments [38]. The HQ module of the In-VEST model is based on land-use data. The relationship between landscape pattern dynamics and HQ in the study area is characterized by calculating the HQ index based on the data of various coercion factors, habitat suitability of habitat types, and sensitivity to coercion factors.
Q x j = H j [ 1 ( D x j z D x j z + k x j z ) ]
where Q x j is the land-use/cover (LULC) type j , the habitat quality of grid x is 0–1, the larger the value indicates the better the HQ, the more suitable the species to survive, H j is habitat suitability, Z is the scale constant (typically 2.5), and k is the semi-saturated constant (the software default value is 0.5).
D x j = r = 1 R y = 1 Y r ω r r = 1 R ω r r y i r x y β x S j r
i r x y = 1 ( d x y d r max )
where D x j is the total threat level of the grid x in landscape pattern type J or habitat type j , r is a source of habitat threats, Y r is the number of sets of grids occupied by r , W r is the weight of each threat factor r , r y is the threat factor value for grid y, i r x y is the threat factor of grid Y r to habitat grid x , β is the accessibility level of the grid x , S j r is habitat type j sensitivity to coercion factor r , d x y is the linear distance between the grid and the grid, and d r max is the maximum influence distance of the coercion factor.
The types of land use in cropland, construction land and unused land are selected as habitat threat factors, with set weights of 0.7, 10.5 and a maximum distance of 4, 8, 6. The sensitivity and habitat suitability of each threat source is shown in Table 2.
R i j = ( H j H i ) S i S i
where the rate of habitat contribution of R i j to the transformation of i into j l a n d , H i and H j are the habitat quality indices for the initial and final stages of the change in a particular area during the study period, respectively, S i is the area of land used for the land change, and S t is the total area.

3. Results

3.1. Spatiotemporal Analysis of Landscape Pattern

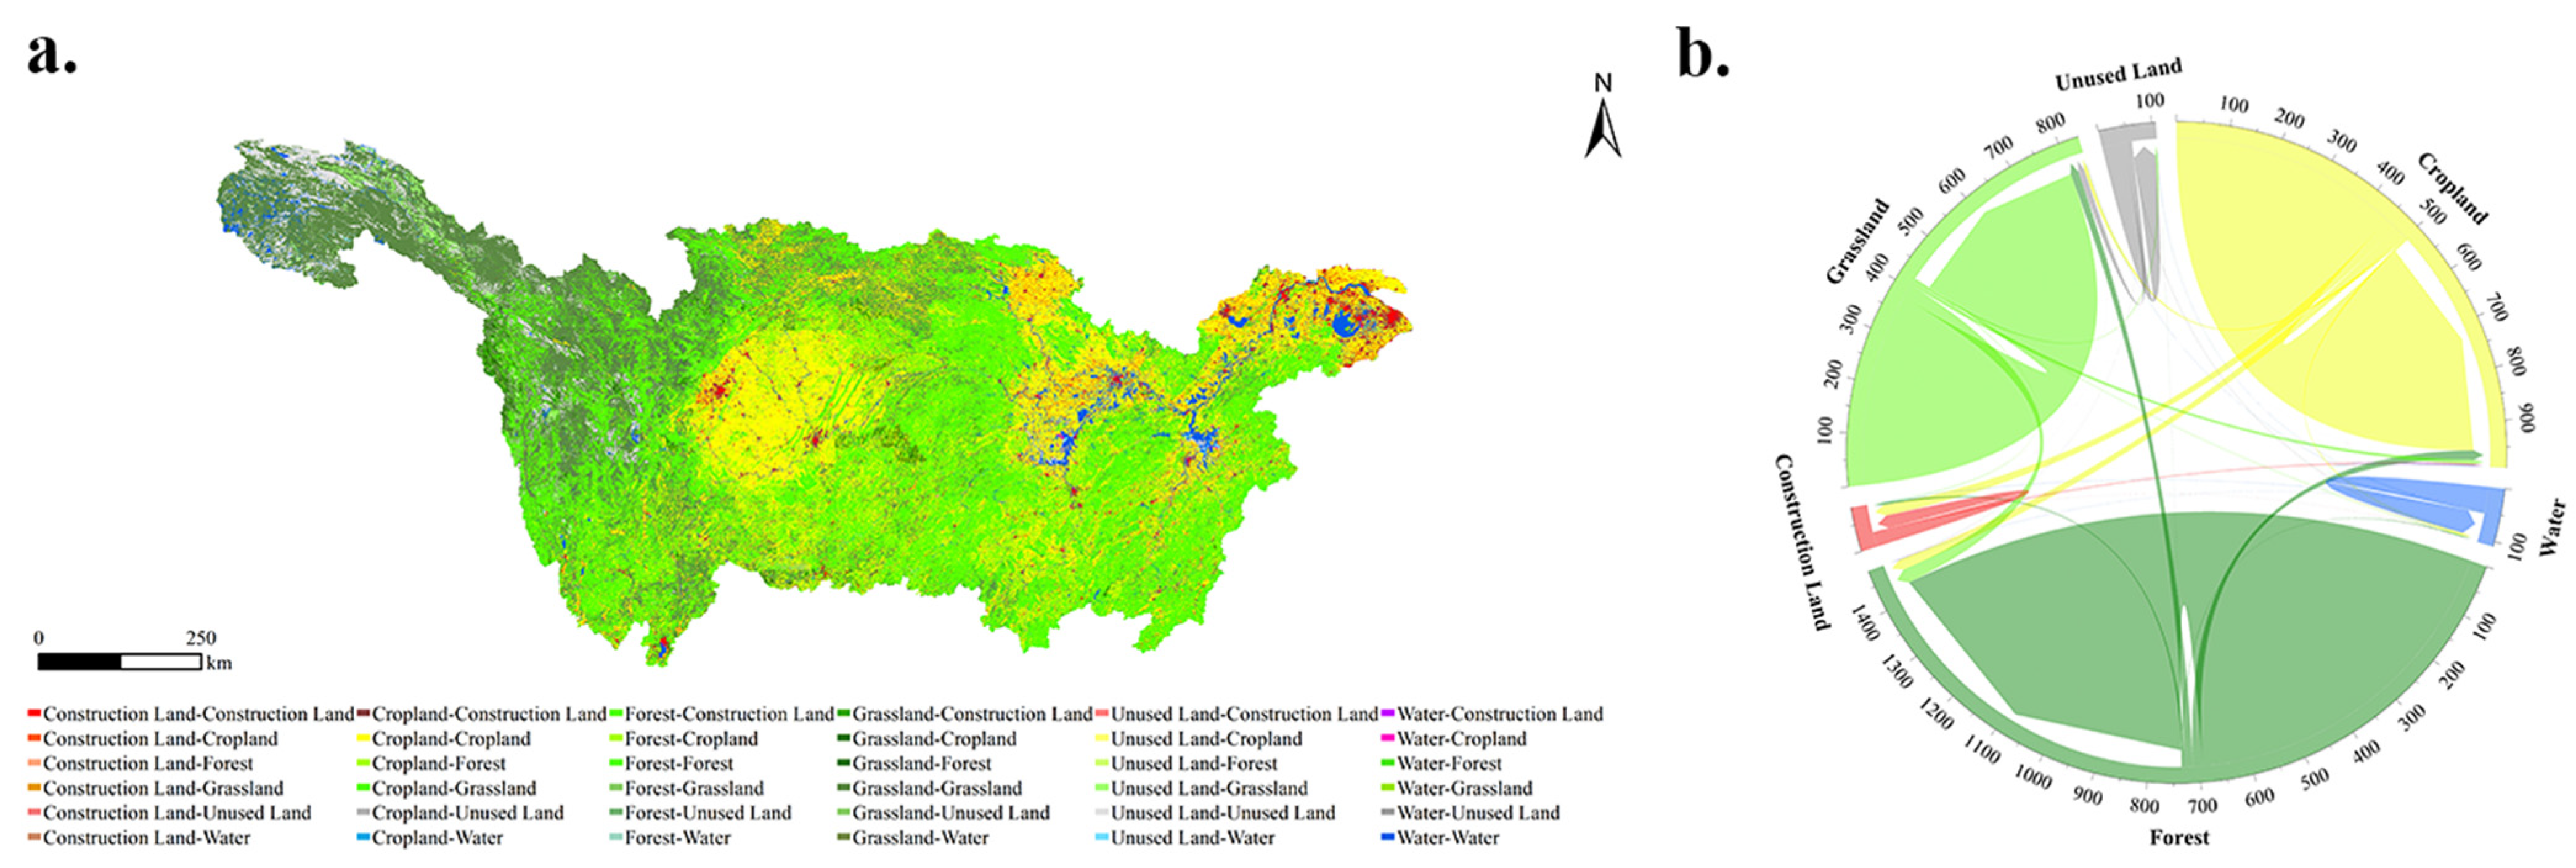
The landscape pattern of the YRB is dominated by forest, grassland, and cropland. Through statistical analysis of LUCC types in 2000 and 2020 in the YRB (Figure 3 and Table 3), it is found that the area of forest, water, and construction land has shown an expanding trend in the past 20 years, and the area of construction land has had the largest increase, increasing by 27,976 km2, an increase of 95.72%. On the contrary, the area of cultivated land, grassland, and unused land continued to decrease by 23,391 km2, 6130 km2, and 10,463 km2, respectively, to 2020. The unused land area decreased the most (17.65%), followed by cropland (4.6%) and grassland (1.45%). The transfer matrix of different types of land use from 2000 to 2020 was obtained by using the ArcMap grid calculator (see Table 3 and Figure 4). The total area of transferred land use in the Yangtze River Basin is 164,847 km2, accounting for 9.14% of the land-use area in the study area, and the land-use pattern has shown little change. Among these, the largest area of cultivated land was transferred, reaching 32,776 km2, of which 58.96% was converted to forest land and 26.92% to grassland. The reason for this was the growth in the urban population, the continuous expansion of urban construction land, and the encroachment of cultivated land. The largest area of forest land was transferred to 51,703 km2, of which 55.71% was converted to grassland and 41.52% to cultivated land. Large-scale return of grassland to forests resulted in a net reduction in grassland area of 43,843 km2. The water area increased significantly, with a cumulative net increase of 9307 km2, of which 51.81% was converted from arable land. The unutilized area decreased by 10,463 km2, with a major transfer of 87.14% to grassland. This was mainly due to China’s response to carry out the environmental protection policy of the river basin and implement the action of returning farmland to the forest to protect the ecological environment. In general, the land-use types in the YRB mainly show the characteristics of a rapid increase in construction land, a substantial reduction in cropland, and large regional differences in development intensity. This is due to the increasing demand for social and economic development in the YRB, the fact that the country views land as an important means to attract investment, and construction land and unused land have experienced rapid and unequal expansion, occupying a large amount of cropland.

3.2. Accuracy Verification of the PLUS Model

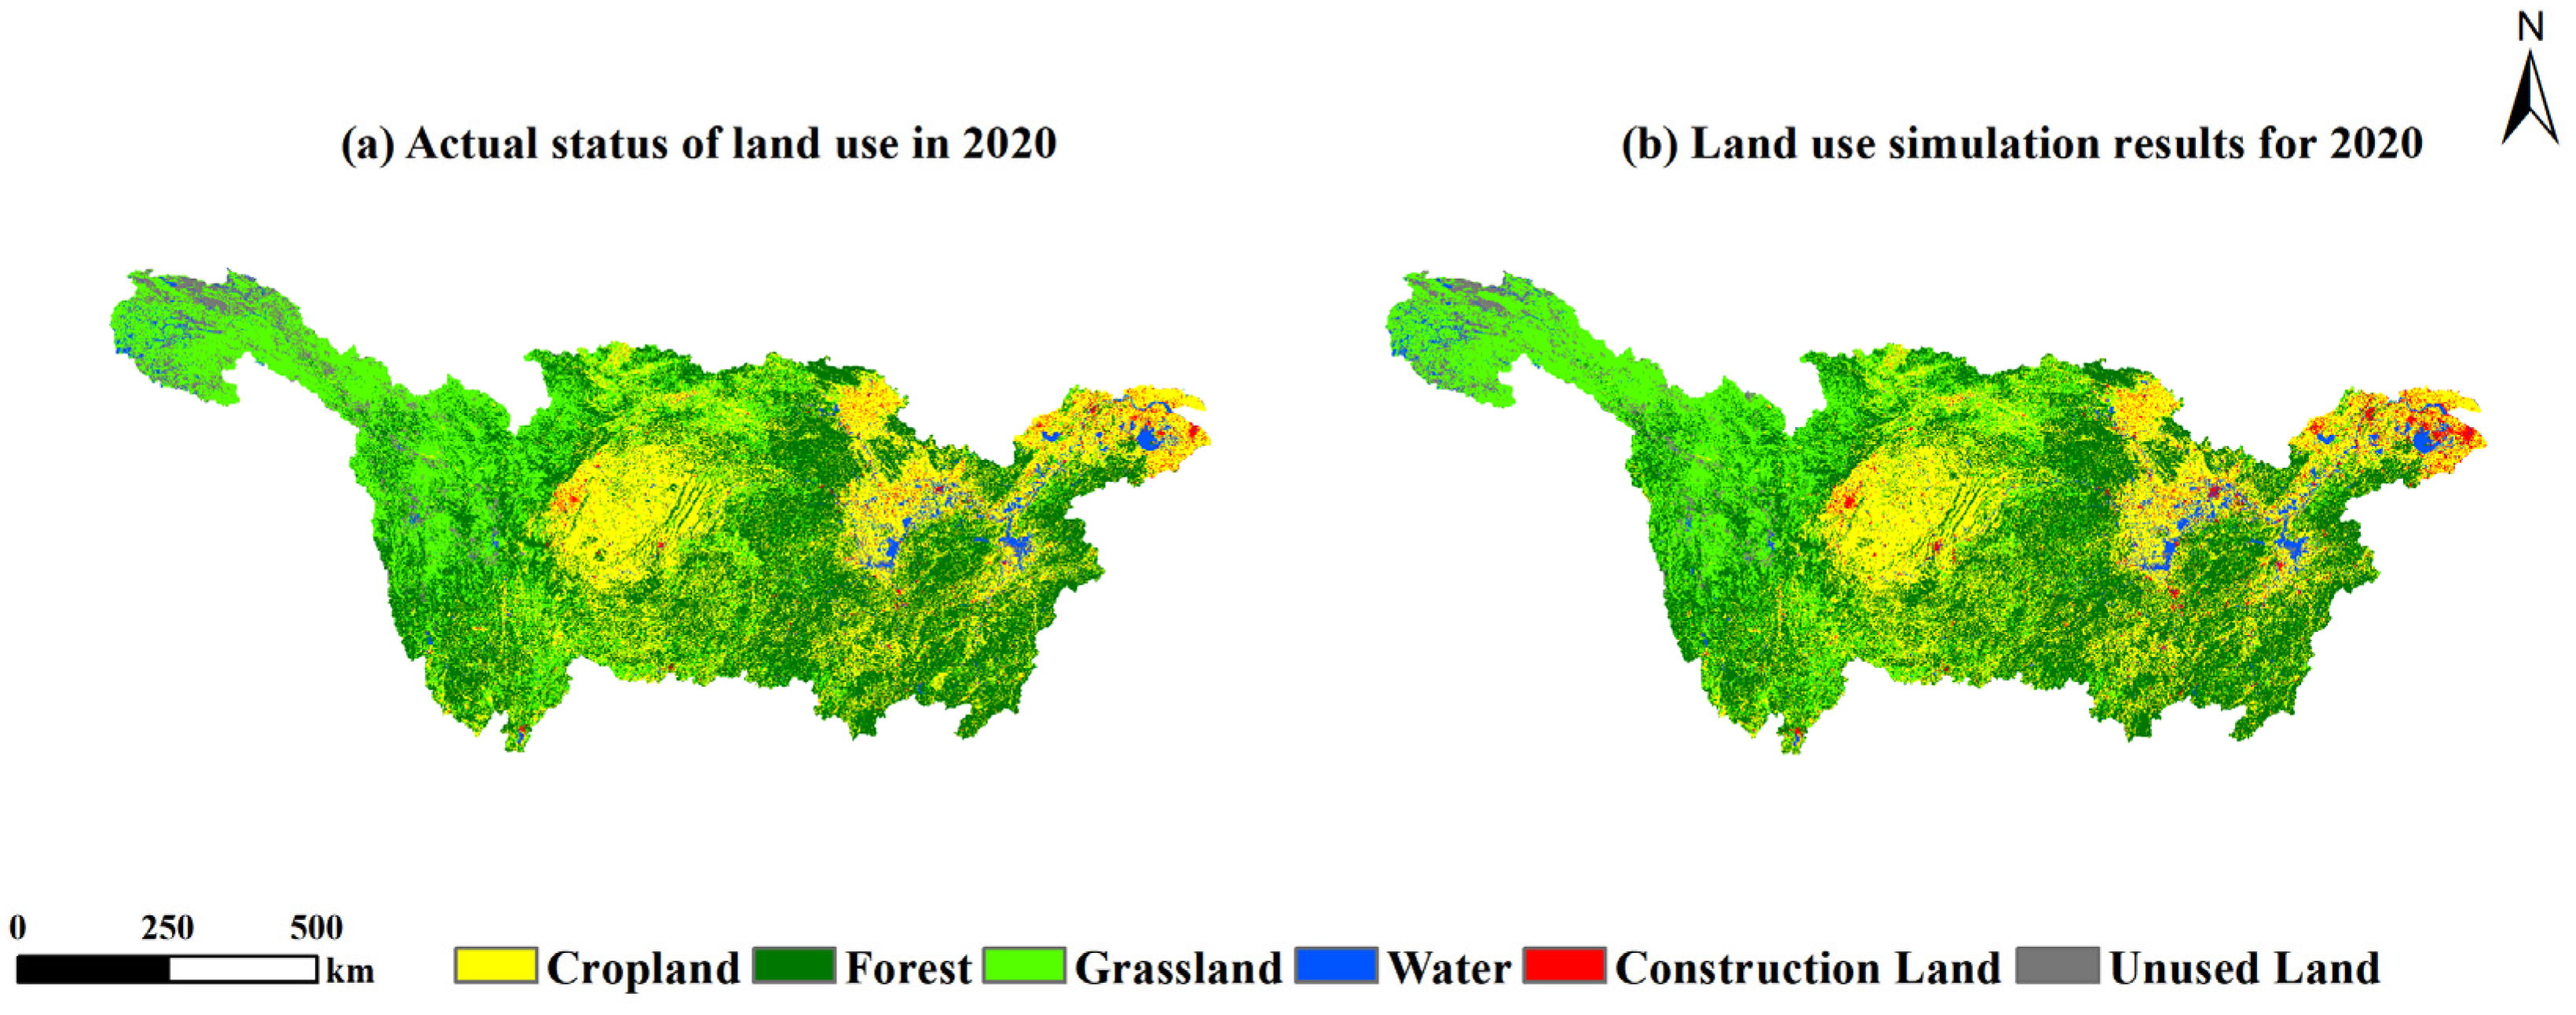
This study takes the land-use data of 2000 and 2010 as the initial data, uses the Markov chain prediction result of 2020 to simulate the land use situation of the YRB in 2020, and selects the above 16 driving factors combined with the actual situation of the Yangtze River Basin. LUCC development potential was represented in the suitability atlas generated by the LEAS module. Land-use demand, transfer matrix, and domain weight parameters were input into the CARS module. Simulation results were verified by the confusion matrix (Figure 4), which showed that the kappa coefficient was 0.901 and the overall accuracy was 93.7%; however, the simulation accuracy of unused land was relatively low, at 83.61%. The accuracy of the other five LUCC types was above 90% (Table 4). Meanwhile, the FoM (Figure of Merit) was 0.41. Therefore, the PLUS model achieved ideal simulation accuracy, accurately reflecting the needs of land-use change in the YRB. It can be used for subsequent simulation predictions.

3.3. Multi-Scenario Simulation of LUCC

The four future landscape pattern scenarios simulated by the Plus model show lower rates of change in cropland, forest, and grassland. However, there were significant changes observed in construction and unused land (Figure 5). The NDS scenario exhibited the most substantial reduction in cropland, with a decrease of 3.95% or 19,032 km2 compared to the year 2020. On the other hand, there was a clear expansion of construction land, which increased by 51.76%. This expansion was mainly due to the conversion of large areas of forest, grassland, and unused land. In the absence of policy restrictions, construction land is likely to proliferate rapidly as human activity increases, encroaching on other types of land and posing a significant threat to ecological and food security. The area of CPS cropland was 498,787 km2, an increase of 3.4%. This is mainly due to the diversion of forest, grassland, and water, indicating the implementation of the protection of cropland and strict control over the occupation of arable land by other species, adequate protection of cropland, and food security. The transfer of large areas of unused land and water under the UDS led to an increase of 56.69% in construction land. This is mainly due to the unconstrained development of towns and cities, which can rapidly expand the number of construction sites. There was extensive encroachment on other species, such as in arable land and water, in which the ecological environment is destroyed. The EPS forest area increased by 41,362 km2, or 5.55%, but the most significant expansion was construction land (25.51%). Despite the expansion of construction land, the implementation of ecological protection policies has helped to reduce the expansion rate from 51.76% to 25.3% for natural development scenarios. This achievement has successfully protected forests and water resources, in line with the ecological protection goals.

3.4. Spatiotemporal Analysis of HQ Based on LUCC Change

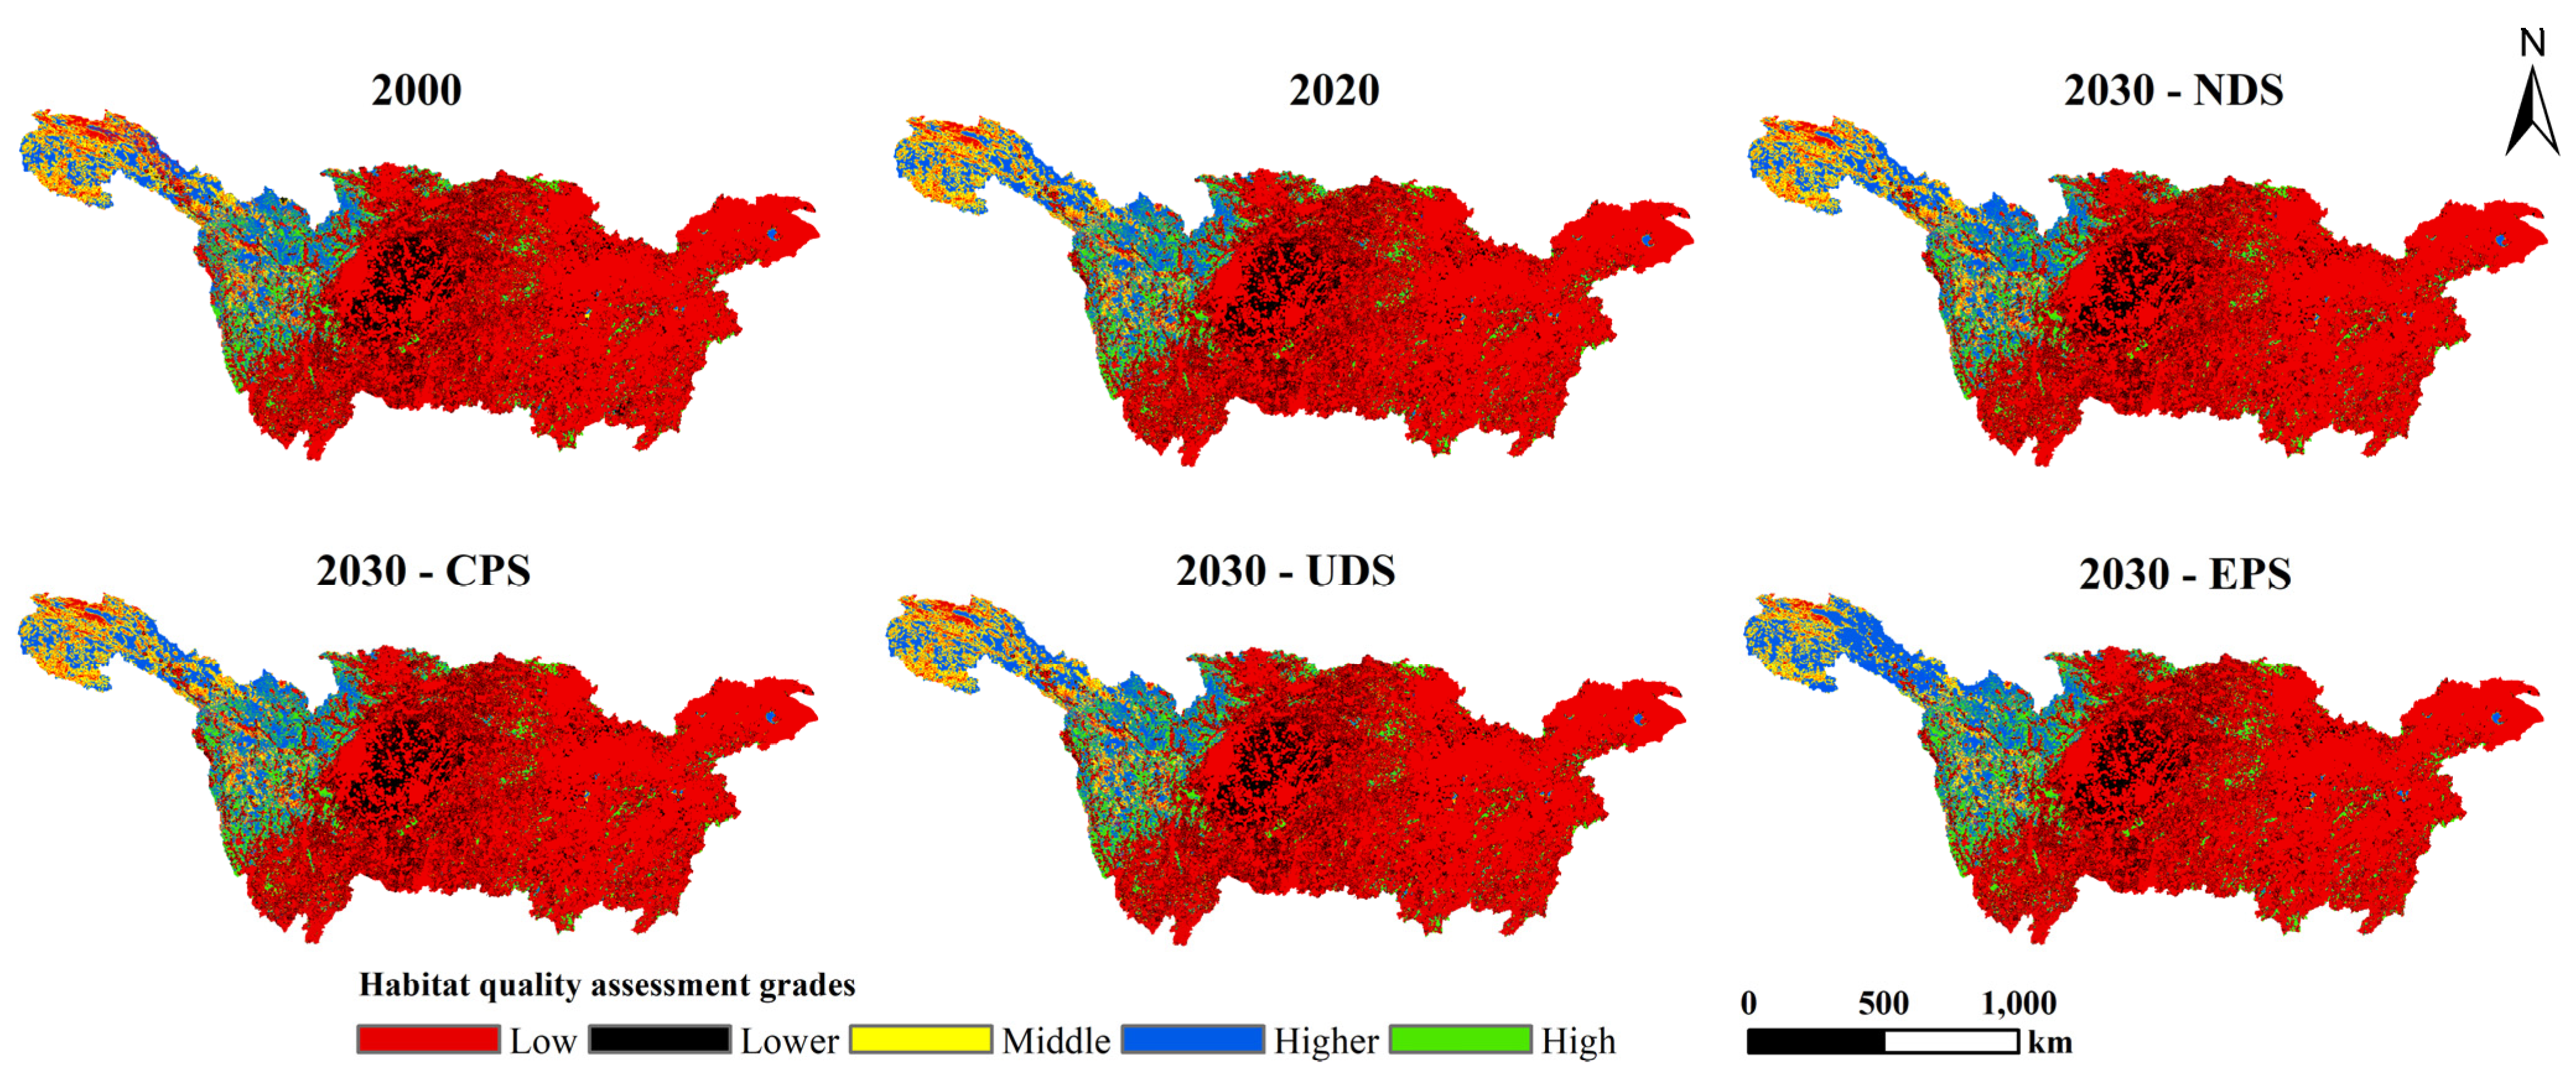
Based on historical land-use analysis of the overall HQ of the YRB, the natural breakpoint method was used to divide the habitat quality into five levels: low (0–0.2), lower (0.2–0.4), medium (0.4–0.6), higher (0.6–0.8), and high (0.8–1) (Figure 6). As evident from the data, the spatial distribution of the YRB’s HQ exhibits a decreasing trend from west to east, with the most severely affected areas concentrated in downstream regions. This trend is primarily attributable to the excessive amount of construction land in those areas. The medium-HQ area is primarily distributed in cropland in the central part of the study area and a few meadows in the eastern part region; the upper reaches are primarily distributed in high-HQ areas, whose HQ area is larger than the medium and low areas. Over the period of 2000–2020, the medium-, higher-, and high-HQ regions witnessed increases of 3.26%, 3.52%, and 3.45%, respectively. On the other hand, low- and lower-HQ areas showed a decrease of 0.83% and 1.59%, respectively. Among these regions, the low-HQ area accounted for the highest percentage and exhibited a declining trend. Specifically, the area of the 20a region decreased by a total of 8782 km2, which accounts for a decrease of 0.49%; the lower-HQ area changed dramatically, with a total reduction of 2953 km2, and the proportion of the decrease was 0.16%; the medium-HQ area accounted for less than 10%, with a slight increase of 0.15; the higher-HQ area witnessed an increase of 2682 km2, accounting for 0.35%, while the high-HQ area experienced an increase of 2749 km2, accounting for 0.15%. The average HQ of YRB during the period of 2000–2020 was 0.211, 0.214, and 0.215, indicating a slight improvement trend at a lower level. However, it is still imperative to strengthen ecological environment governance in the basin to ensure sustainable development.

3.5. Multi-Scenario Simulation of HQ

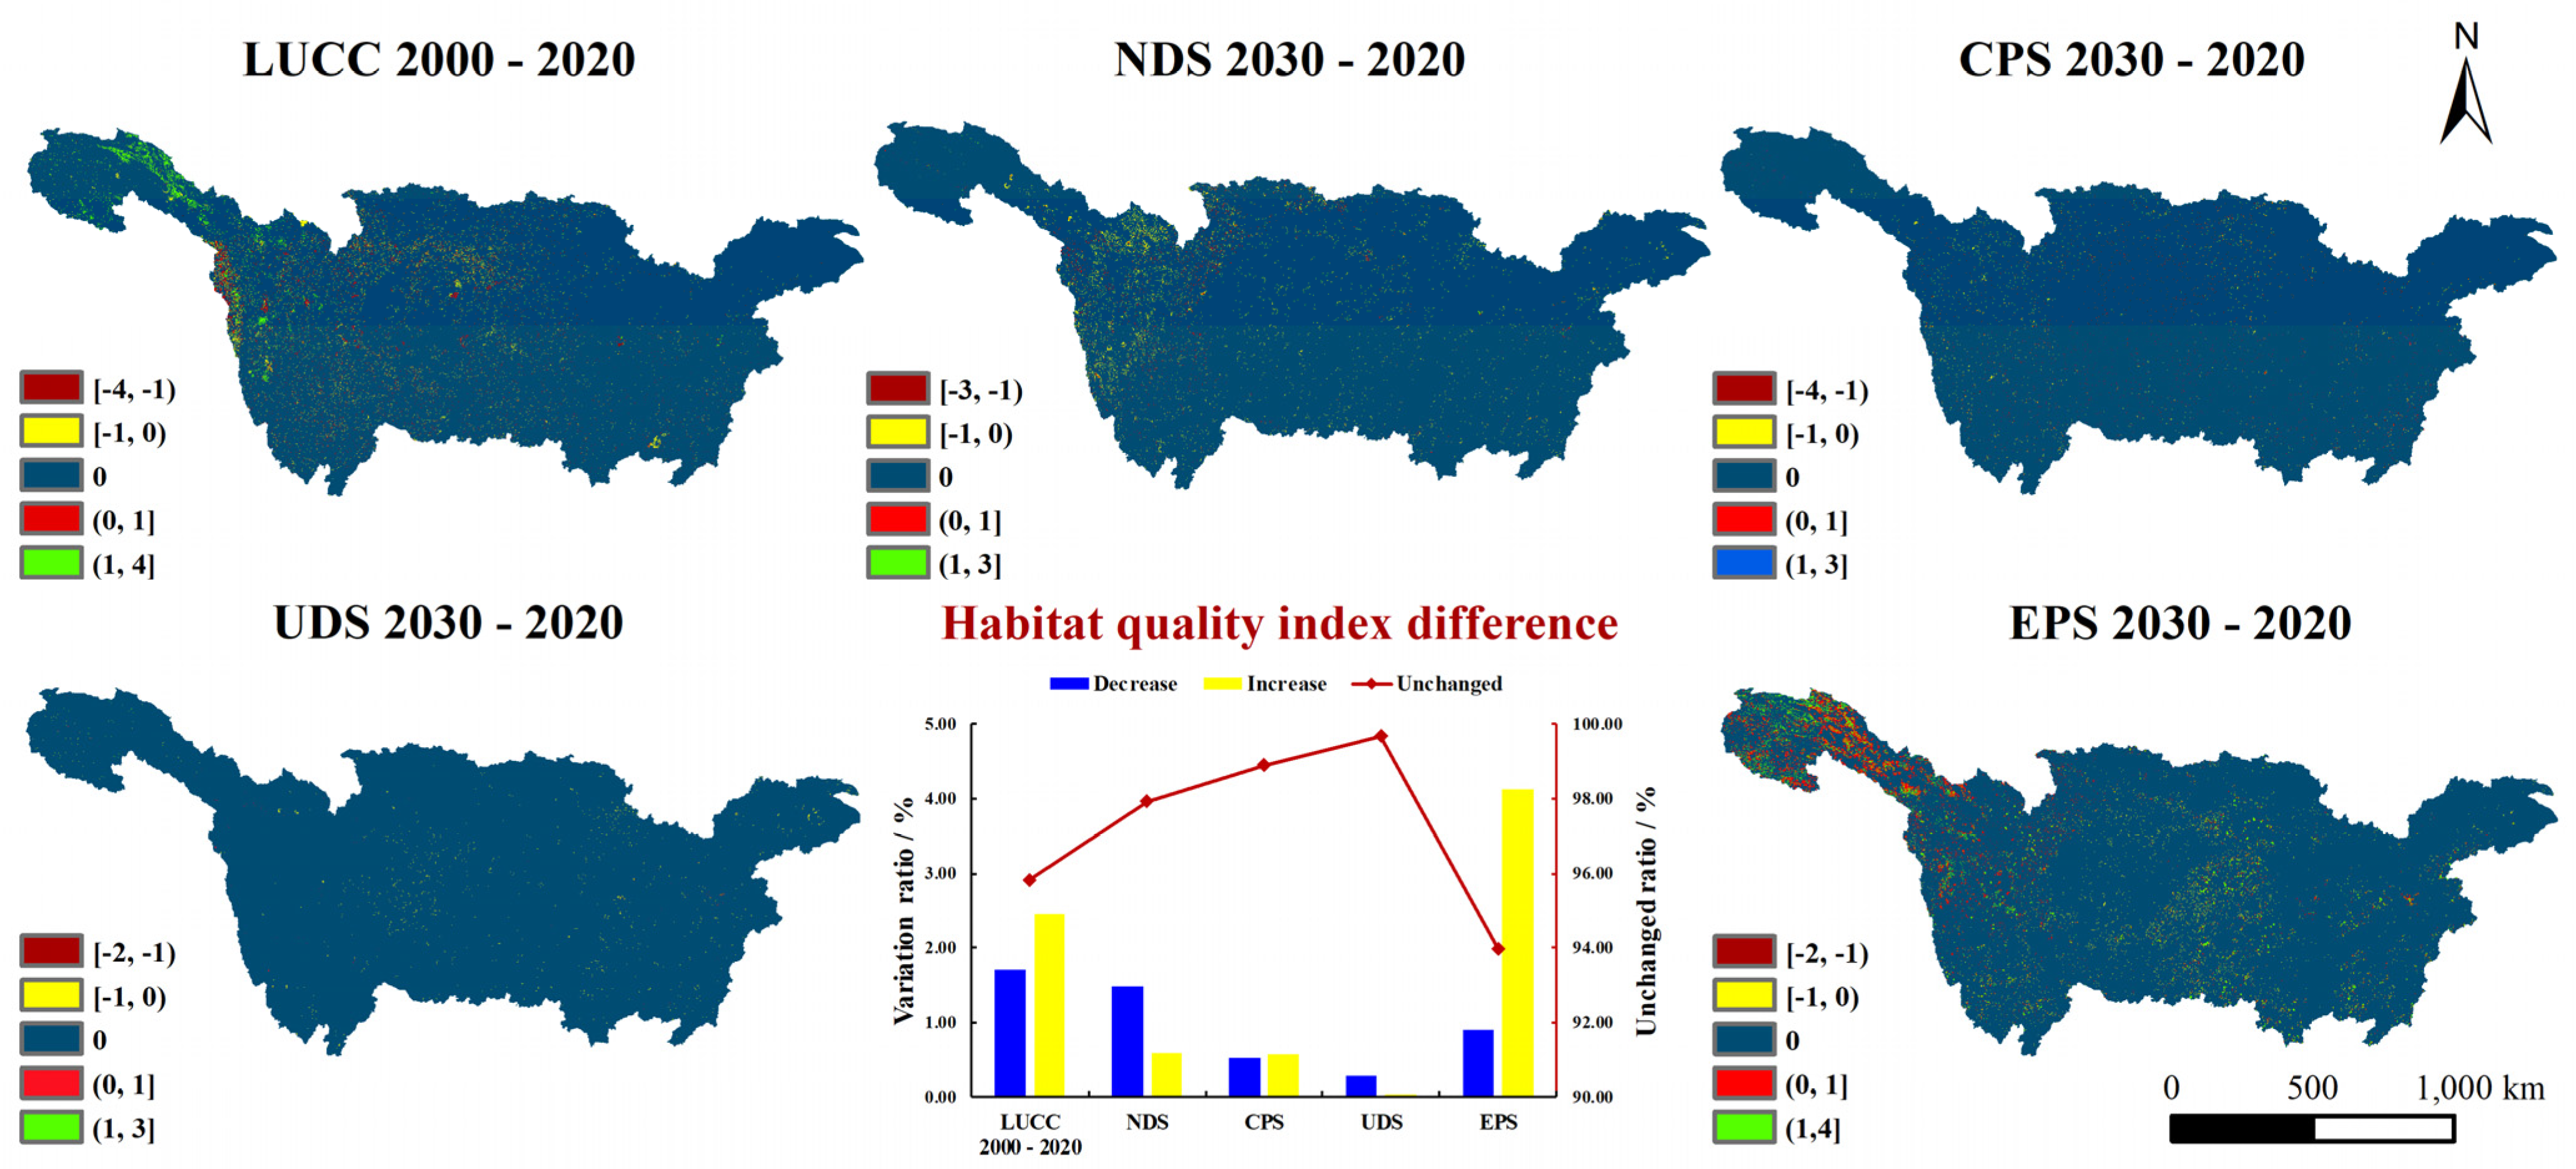
Coupling the In-VEST model with the future LUCC scenario results from PLUS simulations can facilitate the analysis of spatiotemporal changes in HQ of YRB. The changes in HQ of YRB are obtained by superimposing analyses (Figure 7). The spatial pattern of HQ in different LUCC scenarios is relatively stable in 2030. The average HQ of NPS, CPS, UDS, and EPS is 0.212, 0.215, 0.214 and 0.231, respectively, slightly higher than in 2020, but generally lower. Among them, EPS has the most significant improvement in HQ, with an 18.36% increase in the high-HQ area compared to 2020 and a 20.16% increase in the higher-HQ area. NPS, CPS, and UDS, however, led to a 5.41%, 1.23%, and 0.03% decline in the quality of high-HQ areas, respectively. CPS increased the mass lower-HQ area by 2.64%, resulting in a reduction in the area of the other grades. By calculating the difference in HQ change for 2020–2030 (Figure 6), we discovered that regions with unaltered habitat quality index values had a clear advantage, averaging 97.27%. There was some variability between (0.1) and (1.98%). EPS has the smallest percentage of unchanged HQ (93.98%) compared to 2020, and the UDS was the most significant (99.69%). Of the variability (0.1), the EPS area experienced the most significant change, increasing from 1.67% in the preceding period to 3.16%. Meanwhile, the USD decreased significantly, from 1.67% in the preceding period to 0.28%. Based on the overall change trend, EPS had the maximum increase in HQ area (5.13%), while UDS had the minimum (0.04%). NDS had the most extensive decrease in HQ area (1.48%), while UDS had the smallest decrease (0.28%).

4. Discussion

4.1. Potential Limitations of This Study

Although the coupling model used in this study is well applied (the kappa coefficient of the CA-Markov-PLUS model reached 0.91), there are still uncertainties. For example, the land-use system is influenced by many factors, such as nature, society, the economy, the humanities, and so on. In the course of actual development, there are many factors influencing land-use change. It is not easy to quantify, so it cannot be considered in the model at this stage. Meanwhile, there is no uniform criterion for how the various drivers are selected scientifically. The types of land use simulated by scholars using different driving factors are also different. We built a PLUS model for the Yangtze River Basin. Up to 16 meteorological items for the Yangtze River Basin were selected. Social and economic factors are driving mechanisms for model construction; at the same time, to ensure the high quality and reliability of the data, we selected the full version of data published by government departments or professional bodies. We also collected the latest data for 2020 as much as possible. The integrity and timeliness of the data are guaranteed. We standardised the data to compare and analyze the model to minimize uncertainty in the simulation. The data standards we selected are also intended to provide reference for future land-use simulations. When the In-VEST model evaluates HQ, setting parameters such as the range and intensity of the threat source and habitat sensitivity, modifications are typically made based on previous study and the In-VEST model user guide. There is no unified parametric setting system, and changes in HQ are influenced by many factors. There are some errors in the analysis results. In this study, when constructing the YRB’s HQ assessment model, the parameters we selected were also based on the average values set by multiple former scholars. The parameters set in this study are limited to the analysis of analyzing the changes in the HQ of YRB. Therefore, in the future, how to scientifically synthesize various ecological services in the basin through an in-depth analysis of the complex relationship between different ecosystem services will be necessary in order to better reveal the development and evolution of HQ of YRB.

4.2. Driving Mechanism of LUCC Pattern Variation

The landscape pattern change in the YRB results from many factors [39]. According to the characteristics of land-use evolution, the expansion of construction land is obviously due to China’s implementation of the “Great Western Development” in the Yangtze River Basin (1998), “The Rise of Central China” (2004), the Chengdu Economic Zone Development Strategy (2007), the Hubei Two-Circle Belt Strategy (2009), and the Yangtze River Delta Development Strategy (2018) [40,41], which makes the social and economic development of the YRB rapid and the level of urbanization rapid. Li et al. in 2020 showed that the total area of cultivated land in Dongting Lake decreased by 716.13 km2 in 1980–2011 [42]. In the late 1990s, China focused on projects such as “Pingtu Flood,” “Return to the Lake,” and “Migration to the Town,” which contributed to the restoration of water areas, and the policy of returning the lake to the Three Gorges, which began in 2011 [43]. Since the implementation of the national policy of returning to the lake, the waters of Dongting Lake increased at a rate of 20.05 km2/a between 2003 and 2017 [44]. Tong et al. in 2014 indicated that the area of the headwaters of the YRB showed an increasing trend [45]. China’s ecological civilization construction in the 12th Five-Year Plan period and the implementation of the Yangtze River Protection Strategy in the 13th Five-Year Plan period have successively reduced the change rate of ecological land in the YRB and the development interference index, thus protecting high-quality environmental land [46]. Yang et al. in 2022 noted that forests in the Yangtze River Basin increased by a maximum of 62,635 km2 between 2001 and 2019 km2 [47]. Chen et al. in 2021 also pointed out that the implementation of ecological restoration projects resulted in the restoration of 34.57% of the area of downstream forests. The continued reduction of cropland is closely related to the policy of returning cropland to forest and grassland [48]. Kong et al. in 2018 noted that, driven by policies, the YRB experienced a 7.5% reduction in cropland, a 67.5% increase in construction land area, and a 2.1% increase in forest area [49]. The transformation of land use in the YRB is significantly impacted by macro-land development and conservation policies. Policy factors and the execution of national ecological projects are the leading factors driving changes in land-use structure and space [50].
Apart from the macroscopic effects on national policies, micro-natural factors and human activities have also contributed to alterations in landscape patterns [51]. In this study, the PLUS-Land Expansion Analysis Strategy (LEAS) module was utilized to rank the driving factors of various types of land-use changes over the past 20 years based on the selected 16 factors. A contribution analysis of land-expansion factors was also conducted. This approach can provide a better understanding of the selection of and changes in land-use types, and provide a scientific basis for land management and planning. A thorough examination of the 16 selected driving forces reveals that NDVI, temperature, population density, GDP, DEM, and road distance are the primary factors that influence the six types of LUCC in the landscape pattern (Figure 8). NDVI and temperature are the most affected by changes in cropland. This is attributed to the rise in temperatures, which leads to an increase in the demand for moisture and transpiration in the atmosphere. The main driving factors for forest area are NDVI and population density. The influence of temperature on the growth of forest land is reflected in the enhancement of vegetation photosynthesis and the promotion of organic matter decomposition. Grassland is most affected by DEM, the YRB flows from west to east through mountains, plateaus, basins (tributaries), hills, and plains, the Qinghai–Tibet Plateau averages an elevation above 4000 m, grassland covers lower areas, the middle and lower Yangtze River plains are low, most of the elevation is less than 50 m, and the grassland is widely distributed. The water area was the most affected by slope and DEM, and the other influencing factors were more balanced, consistent with the actual situation in the study area. The impact of the growth in construction land is mainly determined by the distance from county residences and the distance from the first road, which indicates that the urbanization process continues to advance and ultimately the residential land area continues to expand. Unused land is strongly affected by population density. The change in population quantity and structure promotes the exploitation of unused land. There is rapid growth in construction land, and human beings obviously improve the development and utilization degree of land development, and the utilization degree of land is obviously improved enhanced by human beings. The expansion of construction land poses a significant threat to the ecological environment of the YRB.
Due to the difficulty in obtaining data, there are many factors that can cause changes in land use, such as soil pollution caused by human activities such as mining and industrialization. In the future, we can use tools such as remote sensing technology and geographic information systems to obtain information on changes in land-use types and related driving factors. We can also obtain relevant information on the selection and changes of land-use types through methods such as surveys and field inspections. By combining these methods, we can more comprehensively and accurately evaluate the changes and driving factors of land-use types and provide a scientific basis for land management and planning.

4.3. Impacts of Landscape Pattern Variation on HQ

By utilizing the PLUS and In-VEST models to evaluate the present and future HQ of the YRB, this study discovered that the spatial distribution of the HQ index is closely aligned with the spatial distribution of LUCC types. In the future, the HQ will change significantly under four different land-use scenarios in the YRB. Therefore, the accuracy of future HQ assessments is closely related to the accuracy of land-use simulation. The HQ index gradually increases in the 2000–2020 and 2030 scenarios. HQ is significantly better in ecological protection scenarios than in 2020, indicating that HQ is constantly being optimized with the support of environmental protection. However, NPS, CPS, and UDS have led to a decline in the quality of high-HQ areas. The areas with higher HQ are mainly concentrated in the upper reaches of the Jinsha and Yalong rivers, which are influenced by topographic features. The mountainous areas in the upper reaches are sparsely populated, and human activity is minimal. The continuous improvement in HQ is due to crucial ecological restoration and management measures, such as environmental fallow cropland, closing mountains and cultivating forests, planting grass, and fixing sand in recent years [38]. The areas with poor habitat quality are mainly concentrated in the middle and lower reaches. The leading causes are the rapid economic development and population growth over the past 20 years, the scale of industrialization and urbanization, and changes in land use, such as increased use of urban construction land, which affects the HQ [52]. This is also the main reason that the spatial pattern of habitat quality in the basin is high, middle, and low on both sides and high in the east and low in the west.
Over the past 20 years, various types of transformation have played a role in altering HQ. However, the positive impacts of geo-transformation are significantly greater than the negative effects (Table 5). Among the positive impacts, the conversion of unused land to grassland, forest land, and water area contributed the most, above 10%, and the contribution degree of grassland conversion was the largest, reaching 31.03%. The reason was that the proportion of unused land converted to grassland accounted for 87.14% of the transferred area. In comparison, the proportion of unused land converted to woodland accounted for only 3.87% of the transferred area. Therefore, converting unused land to grassland was the main reason for the improvement in HQ. Among the negative impacts, grassland conversion to unused land contributed the most (12.61%). The conversion of forest land to unused land and water land to unused land contributed 11.46% and 10.7%, respectively. Therefore, the conversion of grassland to unused land was the primary cause of the decline in HQ.

4.4. Future Expectations

Examining how humans can alleviate the adverse impacts on habitat quality under future LUCC scenarios is crucial for safeguarding the ecological environment and biodiversity. From the previous discussion, it is evident that the YRB has undergone increased urbanization over the past two decades. The impact of contradictions, such as changes in agricultural production patterns and increased use of water resources on HQ, is becoming more apparent. The overall HQ of the YRB remains at a lower level, with HQ and impact factors varying in different scenarios. Therefore, specific actions are necessary for different situations to minimize damage to HQ. We recommend the following measures to promote environmental protection and sustainable development, which are expected to inform governments, businesses, and the public.
For the NDS scenario, we recommend that governments and all sectors of society increase the protection and restoration of the ecological environment of the Yangtze River Basin, strengthen ecosystem management and security, and promote the rational utilization of water resources to reduce water pollution and waste. Additionally, we need to develop and implement sustainable urbanization plans that advance the rational layout of urbanization and industrial land to reduce habitat fragmentation and loss. Finally, we should strengthen environmental monitoring and management, promptly detect and deal with environmental pollution and habitat damage, and protect the ecological environment of the YRB.
Under the CPS scenario, we suggest that the government develop and implement land-use plans for the Yangtze River Basin and strengthen land-use management to prevent the illegal occupation of cultivated land and misuse of land resources. At the same time, promoting cultivated land conservation and ecological restoration is necessary to restore and improve land ecosystems. Additionally, promoting environmental agriculture is vital. Using ecological cultivation, ecological aquaculture, and other techniques can reduce agricultural damage to habitats and improve agricultural and environmental benefits.
For the UDS scenario, the government should promote the construction of ecological cities and strengthen the planning and design of urban landscapes and environmental environments to reduce urbanization’s adverse impact on HQ. Enhanced management of construction land is essential to control urban land expansion and reduce habitat fragmentation and loss. Additionally, promoting green transportation construction and encouraging green travel can reduce transportation’s adverse impact on HQ.
Under the EPS scenario, we suggest that governments and communities increase the structure of ecological reserves to protect ecosystems and species diversity. Environmental engineering techniques such as environmental restoration, ecological restoration, and ecological construction can enhance ecosystem stability and anti-disturbance capacity. Increasing green cover, such as forests, grasslands, wetlands, etc., can increase ecosystem productivity and strength and reduce HQ damage. We should also strengthen environmental monitoring and management to promptly detect and address environmental pollution and habitat destruction to protect ecosystems and biodiversity. Additionally, promoting environmental education and information is essential to raise public environmental awareness, promote environmental action and green lifestyles, and reduce HQ damage.

5. Conclusions

This study is based on historical data on land-use/land-cover changes in the YRB. NDS, CPS, UDS and EPS scenarios for landscape pattern change in 2030 were constructed using PLUS models combined with the In-VEST model to explore the changing characteristics of HQ in different scenario designs and analyze the main influencing factors according to national policies and related drivers. We have reached the following conclusions.
  • The area of forest, water, and construction land has increased significantly over the past 20 years in the YRB, that of cropland and unused land has decreased significantly, that of grassland has remained relatively stable, and there have not been significant changes. Construction land is growing at a highly dynamic rate of 47.86% per year, the most significant increase.
  • HQ levels have risen, but at a lower level. There has been a gradual decline in the area of HQ at the low and lower levels, with increases in the medium-, high-, and higher-HQ areas. NDS continues the characteristics of historical land-type development. CPS restricts the expansion of construction land and increases the area of arable land by 3.4%. UDS increases the growth of construction land. The implementation of EPS led to a slowdown in the development of construction land, a decrease in the reduction of arable land, and continued growth in grassland. The EPS improved the HQ significantly, while other scenarios increased compared to 2020, but the proportion of high-HQ areas decreased, especially in the CPS and UDS.
  • The difference in HQ in different scenarios has an absolute advantage in areas that remain unchanged, with a significant upward trend in EPS and a significant downward trend in UDS.
  • Besides national policies, NDVI, temperature, population density, GDP, DEM, and road distance are essential factors influencing landscape patterns. The improvement in HQ is mainly due to the conversion of unused land to grasslands, cropland and waters, and the decline in HQ is due to grassland being turned into unused land.

Author Contributions

Conceptualization, N.H.; data curation, H.Z.; formal analysis, S.C. and W.C.; funding acquisition, N.H. and W.G.; methodology, W.G., H.W., L.Y., S.C. and L.H.; project administration, H.W.; resources, H.W.; software, N.H. and L.Y.; supervision, X.J.; validation, X.J.; visualization, L.H.; writing—original draft, N.H.; writing—review and editing, W.G. All authors have read and agreed to the published version of the manuscript.

Funding

This research was supported by the Innovative Research Group Project of the National Natural Science Foundation of China (grant 51779094); Major Scientific and Technological Special Project of Guizhou Province (KT202008), Science and Technology Innovation Talents in Universities of Henan Province (GH2019032), 2023 Key Research and Development Program of Hunan Province of China (23ZX012), and North China University of Water Resources and Electric Power (NCWUBC202206).

Data Availability Statement

Please contact the authors via email for the data.

Acknowledgments

Thanks to the data from the Resources and Environment Center of the National Forestry and Land Administration and the data platform of the China Meteorological Network and other related open platforms for your support.

Conflicts of Interest

The authors declare no conflict of interest.

References

  1. Steffen, W.; Persson, Å.; Deutsch, L.; Zalasiewicz, J.; Williams, M.; Richardson, K.; Crumley, C.; Crutzen, P.; Folke, C.; Gordon, L.; et al. The Anthropocene: From Global Change to Planetary Stewardship. AMBIO 2011, 40, 739–761. [Google Scholar] [CrossRef] [PubMed] [Green Version]
  2. Deng, Z.; Quan, B. Intensity Characteristics and Multi-Scenario Projection of Land Use and Land Cover Change in Hengyang, China. Int. J. Environ. Res. Public Health 2022, 19, 8491. [Google Scholar] [CrossRef] [PubMed]
  3. Wang, B.; Cheng, W. Effects of Land Use/Cover on Regional Habitat Quality under Different Geomorphic Types Based on InVEST Model. Remote Sens. 2022, 14, 1279. [Google Scholar] [CrossRef]
  4. Zhao, G.; Liu, J.; Kuang, W.; Ouyang, Z.; Xie, Z. Disturbance Impacts of Land Use Change on Biodiversity Conservation Priority Areas across China: 1990–2010. J. Geogr. Sci. 2015, 25, 515–529. [Google Scholar] [CrossRef] [Green Version]
  5. Liu, Y.; Huang, X.; Yang, H.; Zhong, T. Environmental Effects of Land-Use/Cover Change Caused by Urbanization and Policies in Southwest China Karst Area—A Case Study of Guiyang. Habitat Int. 2014, 44, 339–348. [Google Scholar] [CrossRef]
  6. Krause, A.; Haverd, V.; Poulter, B.; Anthoni, P.; Quesada, B.; Rammig, A.; Arneth, A. Multimodel Analysis of Future Land Use and Climate Change Impacts on Ecosystem Functioning. Earths Future 2019, 7, 833–851. [Google Scholar] [CrossRef] [Green Version]
  7. Hurtt, G.C.; Chini, L.; Sahajpal, R.; Frolking, S.; Bodirsky, B.L.; Calvin, K.; Doelman, J.C.; Fisk, J.; Fujimori, S.; Klein Goldewijk, K.; et al. Harmonization of Global Land Use Change and Management for the Period 850–2100 (LUH2) for CMIP6. Geosci. Model Dev. 2020, 13, 5425–5464. [Google Scholar] [CrossRef]
  8. Díaz, S.; Settele, J.; Brondízio, E.S.; Ngo, H.T.; Agard, J.; Arneth, A.; Balvanera, P.; Brauman, K.A.; Butchart, S.H.M.; Chan, K.M.A.; et al. Pervasive Human-Driven Decline of Life on Earth Points to the Need for Transformative Change. Science 2019, 366, eaax3100. [Google Scholar] [CrossRef] [Green Version]
  9. Wang, Q.; Guan, Q.; Lin, J.; Luo, H.; Tan, Z.; Ma, Y. Simulating Land Use/Land Cover Change in an Arid Region with the Coupling Models. Ecol. Indic. 2021, 122, 107231. [Google Scholar] [CrossRef]
  10. Peng, J.; Pan, Y.; Liu, Y.; Zhao, H.; Wang, Y. Linking Ecological Degradation Risk to Identify Ecological Security Patterns in a Rapidly Urbanizing Landscape. Habitat Int. 2018, 71, 110–124. [Google Scholar] [CrossRef]
  11. Wang, Q.; Wang, H. Evaluation for the Spatiotemporal Patterns of Ecological Vulnerability and Habitat Quality: Implications for Supporting Habitat Conservation and Healthy Sustainable Development. Environ. Geochem. Health 2022, 45, 2117–2147. [Google Scholar] [CrossRef] [PubMed]
  12. Shan, C.; Guo, H.; Dong, Z.; Liu, L.; Lu, D.; Hu, J.; Feng, Y. Study on the River Habitat Quality in Luanhe Based on the Eco-Hydrodynamic Model. Ecol. Indic. 2022, 142, 109262. [Google Scholar] [CrossRef]
  13. Winchester, N.; White, D. The Climate PoLicy ANalysis (C-PLAN) Model, Version 1.0. Energy Econ. 2022, 108, 105896. [Google Scholar] [CrossRef]
  14. Hernández-Baz, F.; Romo, H.; González, J.M.; Hernández MD, J.M.; Pastrana, R.G. Maximum Entropy Niche-Based Modeling (Maxent) of Potential Geographical Distribution of Coreura Albicosta (Lepidoptera: Erebidae: Ctenuchina) in Mexico. Fla. Entomol. 2016, 99, 376–380. [Google Scholar] [CrossRef] [Green Version]
  15. Newbold, T.; Hudson, L.N.; Hill, S.L.L.; Contu, S.; Lysenko, I.; Senior, R.A.; Börger, L.; Bennett, D.J.; Choimes, A.; Collen, B.; et al. Global Effects of Land Use on Local Terrestrial Biodiversity. Nature 2015, 520, 45–50. [Google Scholar] [CrossRef] [Green Version]
  16. Rahimi, L.; Malekmohammadi, B.; Yavari, A.R. Assessing and Modeling the Impacts of Wetland Land Cover Changes on Water Provision and Habitat Quality Ecosystem Services. Nat. Resour. Res. 2020, 29, 3701–3718. [Google Scholar] [CrossRef]
  17. Dong, J.; Zhang, Z.; Liu, B.; Zhang, X.; Zhang, W.; Chen, L. Spatiotemporal Variations and Driving Factors of Habitat Quality in the Loess Hilly Area of the Yellow River Basin: A Case Study of Lanzhou City, China. J. Arid. Land 2022, 14, 637–652. [Google Scholar] [CrossRef]
  18. Xu, L.; Chen, S.S.; Xu, Y.; Li, G.; Su, W. Impacts of Land-Use Change on Habitat Quality during 1985–2015 in the Taihu Lake Basin. Sustainability 2019, 11, 3513. [Google Scholar] [CrossRef] [Green Version]
  19. Sun, X.; Yu, Y.; Wang, J.; Liu, W. Analysis of the Spatiotemporal Variation in Habitat Quality Based on the InVEST Model- A Case Study of Shangri-La City, Northwest Yunnan, China. J. Phys. Conf. Ser. 2021, 1961, 012016. [Google Scholar] [CrossRef]
  20. Wei, L.; Zhou, L.; Sun, D.; Yuan, B.; Hu, F. Evaluating the Impact of Urban Expansion on the Habitat Quality and Constructing Ecological Security Patterns: A Case Study of Jiziwan in the Yellow River Basin, China. Ecol. Indic. 2022, 145, 109544. [Google Scholar] [CrossRef]
  21. Meng, R.; Cai, J.; Xin, H.; Meng, Z.; Dang, X.; Han, Y. Spatio-Temporal Changes in Land Use and Habitat Quality of Hobq Desert along the Yellow River Section. Int. J. Environ. Res. Public Health 2023, 20, 3599. [Google Scholar] [CrossRef]
  22. Lei, J.; Chen, Y.; Li, L.; Chen, Z.; Chen, X.; Wu, T.; Li, Y. Spatiotemporal Change of Habitat Quality in Hainan Island of China Based on Changes in Land Use. Ecol. Indic. 2022, 145, 109707. [Google Scholar] [CrossRef]
  23. Sun, X.; Jiang, Z.; Liu, F.; Zhang, D. Monitoring Spatio-Temporal Dynamics of Habitat Quality in Nansihu Lake Basin, Eastern China, from 1980 to 2015. Ecol. Indic. 2019, 102, 716–723. [Google Scholar] [CrossRef]
  24. Barclay-Smith, P. The World Wildlife Fund. Nature 1962, 193, 12–13. [Google Scholar] [CrossRef]
  25. Azari, M.; Billa, L.; Chan, A. Multi-Temporal Analysis of Past and Future Land Cover Change in the Highly Urbanized State of Selangor, Malaysia. Ecol. Process. 2022, 11, 2. [Google Scholar] [CrossRef]
  26. Guo, W.; He, N.; Ban, X.; Wang, H. Multi-Scale Variability of Hydrothermal Regime Based on Wavelet Analysis—The Middle Reaches of the Yangtze River, China. Sci. Total Environ. 2022, 841, 156598. [Google Scholar] [CrossRef]
  27. Liang, X.; Guan, Q.; Clarke, K.C.; Liu, S.; Wang, B.; Yao, Y. Understanding the Drivers of Sustainable Land Expansion Using a Patch-Generating Land Use Simulation (PLUS) Model: A Case Study in Wuhan, China. Comput. Environ. Urban Syst. 2021, 85, 101569. [Google Scholar] [CrossRef]
  28. Xu, L.; Liu, X.; Tong, D.; Liu, Z.; Yin, L.; Zheng, W. Forecasting Urban Land Use Change Based on Cellular Automata and the PLUS Model. Land 2022, 11, 652. [Google Scholar] [CrossRef]
  29. da Cunha, E.R.; Santos, C.A.G.; da Silva, R.M.; Bacani, V.M.; Pott, A. Future Scenarios Based on a CA-Markov Land Use and Land Cover Simulation Model for a Tropical Humid Basin in the Cerrado/Atlantic Forest Ecotone of Brazil. Land Use Policy 2021, 101, 105141. [Google Scholar] [CrossRef]
  30. Zhang, S.; Yang, P.; Xia, J.; Wang, W.; Cai, W.; Chen, N.; Hu, S.; Luo, X.; Li, J.; Zhan, C. Land Use/Land Cover Prediction and Analysis of the Middle Reaches of the Yangtze River under Different Scenarios. Sci. Total Environ. 2022, 833, 155238. [Google Scholar] [CrossRef] [PubMed]
  31. Gharaibeh, A.; Shaamala, A.; Obeidat, R.; Al-Kofahi, S. Improving Land-Use Change Modeling by Integrating ANN with Cellular Automata-Markov Chain Model. Heliyon 2020, 6, e05092. [Google Scholar] [CrossRef]
  32. Xu, C.; Fu, H.; Yang, J.; Wang, L.; Wang, Y. Land-Use-Based Runoff Yield Method to Modify Hydrological Model for Flood Management: A Case in the Basin of Simple Underlying Surface. Sustainability 2022, 14, 10895. [Google Scholar] [CrossRef]
  33. Shoyama, K.; Braimoh, A.K.; Avtar, R.; Saito, O. Land Transition and Intensity Analysis of Cropland Expansion in Northern Ghana. Environ. Manag. 2018, 62, 892–905. [Google Scholar] [CrossRef]
  34. Liao, Z.; Zhang, L. Spatio-Temporal Analysis and Simulation of Urban Ecological Resilience in Guangzhou City Based on the FLUS Model. Sci. Rep. 2023, 13, 7400. [Google Scholar] [CrossRef]
  35. Zhu, K.; Cheng, Y.; Zang, W.; Zhou, Q.; El Archi, Y.; Mousazadeh, H.; Kabil, M.; Csobán, K.; Dávid, L.D. Multiscenario Simulation of Land-Use Change in Hubei Province, China Based on the Markov-FLUS Model. Land 2023, 12, 744. [Google Scholar] [CrossRef]
  36. Wang, J.; Wu, Y.; Gou, A. Habitat Quality Evolution Characteristics and Multi-Scenario Prediction in Shenzhen Based on PLUS and InVEST Models. Front. Environ. Sci. 2023, 11, 1146347. [Google Scholar] [CrossRef]
  37. Han, P.; Xiang, J.; Zhao, Q. Spatial Differentiation and Scenario Simulation of Cultivated Land in Mountainous Areas of Western Hubei, China: A PLUS Model. Environ. Sci. Pollut. Res. 2023, 30, 52804–52817. [Google Scholar] [CrossRef]
  38. Xiao, P.; Zhou, Y.; Li, M.; Xu, J. Spatiotemporal Patterns of Habitat Quality and Its Topographic Gradient Effects of Hubei Province Based on the InVEST Model. Environ. Dev. Sustain. 2023, 25, 6419–6448. [Google Scholar] [CrossRef]
  39. Jiang, L.; Deng, X.; Seto, K.C. The Impact of Urban Expansion on Agricultural Land Use Intensity in China. Land Use Policy 2013, 35, 33–39. [Google Scholar] [CrossRef]
  40. Luo, X.; Qin, J.; Cheng, C.; Pan, Y.; Yang, T. Spatial Effects and Influencing Factors of Urban Land Intensive Use in the Yangtze River Delta under High-Quality Development. Front. Environ. Sci. 2022, 10, 1270. [Google Scholar] [CrossRef]
  41. Yan, T.; Yi Qian, W. Environmental Migration and Sustainable Development in the Upper Reaches of the Yangtze River. Popul. Environ. 2004, 25, 613–636. [Google Scholar] [CrossRef]
  42. Li, J.; Zhou, K.; Dong, H.; Xie, B. Cultivated Land Change, Driving Forces and Its Impact on Landscape Pattern Changes in the Dongting Lake Basin. Int. J. Environ. Res. Public Health 2020, 17, 7988. [Google Scholar] [CrossRef]
  43. Xiong, Y.; Zhou, J.; Chen, L.; Jia, B.; Sun, N.; Tian, M.; Hu, G. Land Use Pattern and Vegetation Cover Dynamics in the Three Gorges Reservoir (TGR) Intervening Basin. Water 2020, 12, 2036. [Google Scholar] [CrossRef]
  44. Yang, L.; Wang, L.; Yu, D.; Yao, R.; Li, C.; He, Q.; Wang, S.; Wang, L. Four Decades of Wetland Changes in Dongting Lake Using Landsat Observations during 1978–2018. J. Hydrol. 2020, 587, 124954. [Google Scholar] [CrossRef]
  45. Tong, L.; Xu, X.; Fu, Y.; Li, S. Wetland Changes and Their Responses to Climate Change in the “Three-River Headwaters” Region of China since the 1990s. Energies 2014, 7, 2515–2534. [Google Scholar] [CrossRef] [Green Version]
  46. Yang, H.; Zhong, X.; Deng, S.; Nie, S. Impact of LUCC on Landscape Pattern in the Yangtze River Basin during 2001–2019. Ecol. Inform. 2022, 69, 101631. [Google Scholar] [CrossRef]
  47. Chen, S.; Wen, Z.; Zhang, S.; Huang, P.; Ma, M.; Zhou, X.; Liao, T.; Wu, S. Effects of Long-Term and Large-Scale Ecology Projects on Forest Dynamics in Yangtze River Basin, China. For. Ecol. Manag. 2021, 496, 119463. [Google Scholar] [CrossRef]
  48. Cao, Y.; Bai, Z.; Zhou, W.; Wang, J. Forces Driving Changes in Cultivated Land and Management Countermeasures in the Three Gorges Reservoir Area, China. J. Mt. Sci. 2013, 10, 149–162. [Google Scholar] [CrossRef]
  49. Kong, L.; Zheng, H.; Rao, E.; Xiao, Y.; Ouyang, Z.; Li, C. Evaluating Indirect and Direct Effects of Eco-Restoration Policy on Soil Conservation Service in Yangtze River Basin. Sci. Total Environ. 2018, 631–632, 887–894. [Google Scholar] [CrossRef]
  50. Zhou, Y.; Li, X.; Liu, Y. Cultivated Land Protection and Rational Use in China. Land Use Policy 2021, 106, 105454. [Google Scholar] [CrossRef]
  51. Yang, H.; Zhong, X.; Deng, S.; Xu, H. Assessment of the Impact of LUCC on NPP and Its Influencing Factors in the Yangtze River Basin, China. CATENA 2021, 206, 105542. [Google Scholar] [CrossRef]
  52. Zhang, S.; Jin, C.; Pan, X.; Wei, L.; Shao, H. Coastal Land Use Change and Evaluation of Ecosystem Services Value Enhancement under the Background of Yangtze River Protection: Taking Jiangyin Coastal Areas as an Example. Front. Environ. Sci. 2023, 11, 1088816. [Google Scholar] [CrossRef]
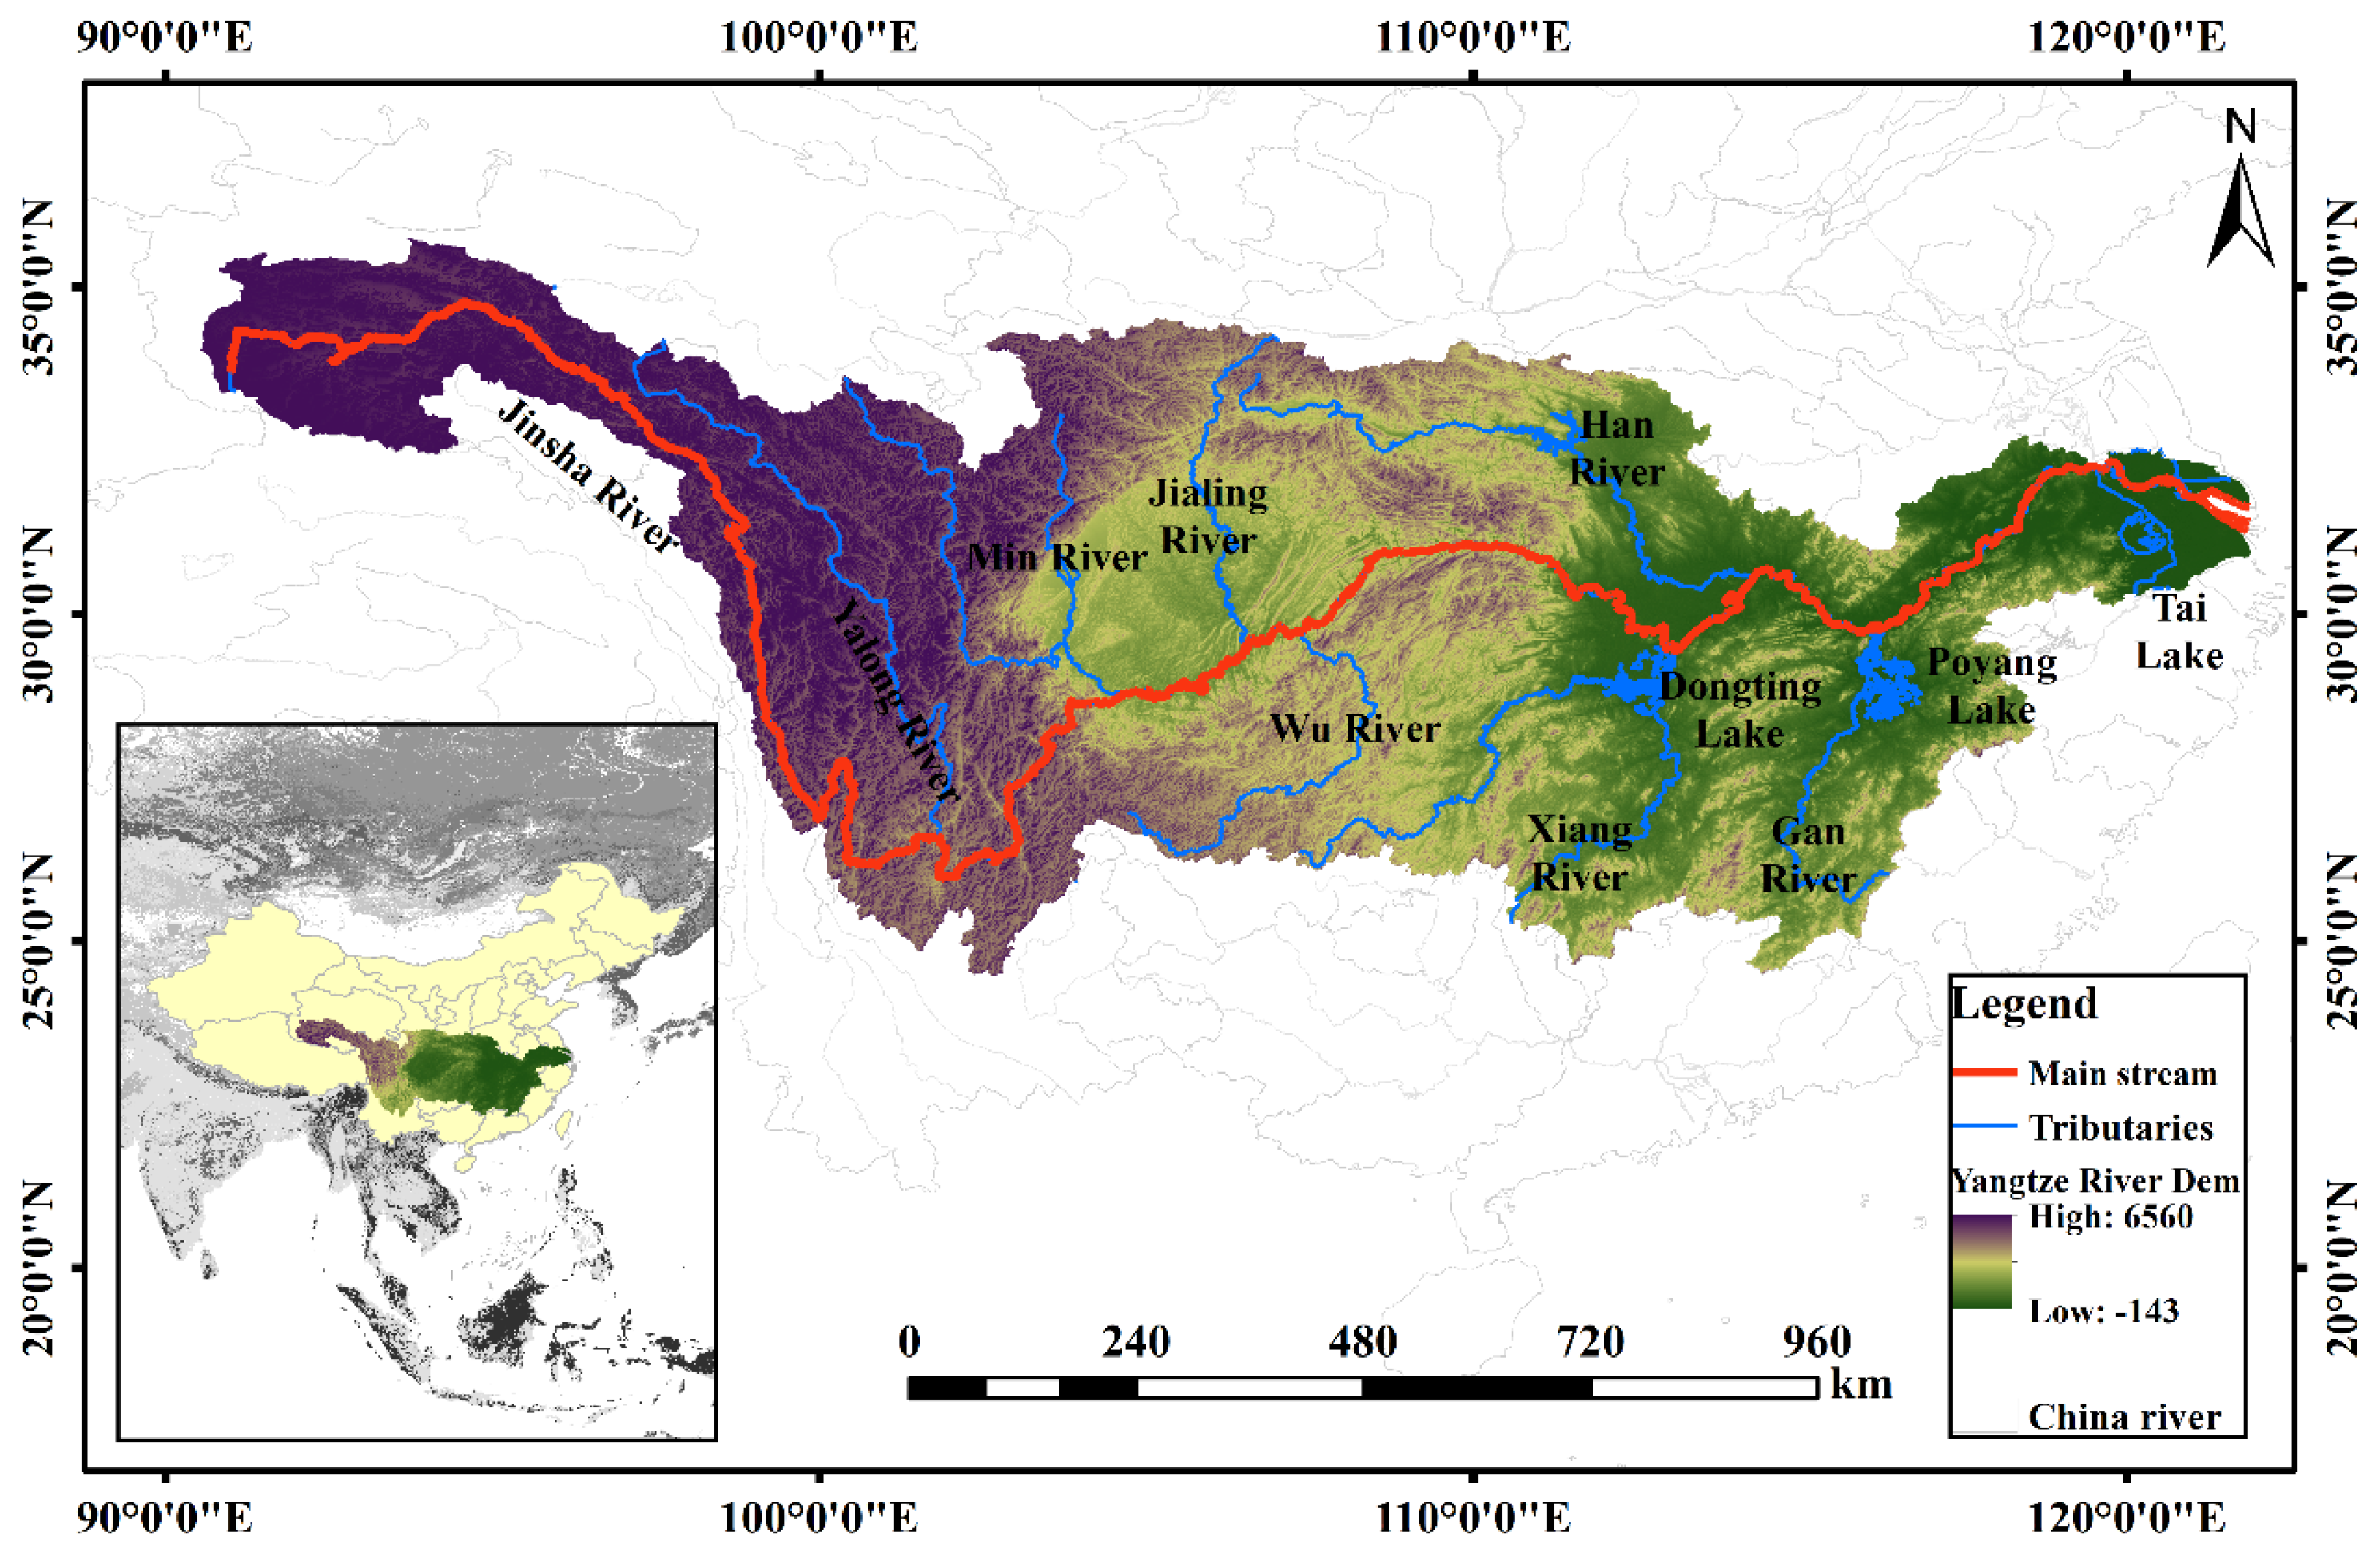
Figure 1. The study area, located in YRB.
Land 12 01338 g001
Figure 2. Spatial distribution of various influencing factors of PLUS in the study area.
Land 12 01338 g002
Figure 3. Spatial distribution map of landscape patterns from 2000 to 2020: (a) LUCC transfer chart; (b) LUCC transfer chord diagram.
Land 12 01338 g003
Figure 4. Comparison of actual land use in 2020 with simulated LUCC.
Land 12 01338 g004
Figure 5. LUCC predictions in each scenario of the YRB in 2030.
Land 12 01338 g005
Figure 6. Spatial distribution map of HQ under different YRB scenarios.
Land 12 01338 g006
Figure 7. Spatial distribution of HQ difference under different YRB scenarios.
Land 12 01338 g007
Figure 8. The weights of different drivers influencing the change in landscape pattern.
Land 12 01338 g008
Table 1. LUCC conversion cost matrix for each scenario.
NDSCPSUDSEPS
abcdefabcdefabcdefabcdef
a101011100000100011111111
b011001111001110011010000
c111111111111101010011100
d101101101101011110000100
e000010000010000010000010
f111111111111111111111111
Table 2. Sensitivity and habitat suitability of each threat source.
HabitatCroplandConstruction LandUnused Land
Cropland0.300.60.1
Forest0.90.80.60.2
Grassland0.70.40.50.2
Water0.750.70.80.2
Table 3. Transition matrix of landscape pattern from 2000 to 2020 in YRB/km2.
Project2020
CroplandForestGrasslandWaterConstruction LandUnused LandTotalRollout Totals
2020Cropland449,61621,4657428482222,323129505,78356,167
Forest19,324693,60416,37015684244434735,54441,940
Grassland882328,804378,425139613233497422,26843,843
Water206951961947,89575559452,4514556
Construction
land
249832210726126,0201829,2263206
Unused land6259313,18912603144,13559,27015,135
Total482,392745,307416,13857,20254,69648,8071,804,542/
Turn in totals32,77651,70337,713930728,6764672/164,847
Table 4. Comparison between actual and simulated LUCC grids in the YRB in 2020, by number.
ActualSimulationSimulated Correct NumberAccuracy Rating/%RMSE
Cropland505,375490,847467,44295.230.1662
Forest733,940750,593736,84398.170.1745
Grassland420,480411,067398,32096.900.1468
Water52,34050,50049,12597.280.0682
Construction Land29,07245,92041,95691.370.0632
Unused land59,14559,22249,51383.610.0539
Table 5. Contribution index of land-use conversion to HQ change from 2000 to 2020.
CroplandForestGrasslandWaterConstruction LandUnused LandTotal
Cropland−0.0016−2.1432−1.1548−1.1263−0.1682−0.0353−4.6293
Forest2.09190.10890.1261−0.2148−0.0904−11.4579−9.4361
Grassland3.65911.04340.65761.4815−0.2393−12.6144−6.0121
Water1.0007−0.01491.69750.1418−0.1716−10.7005−8.0469
Construction Land0.6257−0.49907.6254−0.3885−0.0284−0.25177.0836
Unused Land3.087326.350931.034112.6929−0.07920.802873.8887
Total10.463324.846139.985912.5866−0.7770−34.257052.8479
Disclaimer/Publisher’s Note: The statements, opinions and data contained in all publications are solely those of the individual author(s) and contributor(s) and not of MDPI and/or the editor(s). MDPI and/or the editor(s) disclaim responsibility for any injury to people or property resulting from any ideas, methods, instructions or products referred to in the content.