Article

Identification and Optimization Strategy for the Ecological Security Pattern in Henan Province Based on Matching the Supply and Demand of Ecosystem Services

1
College of Resources and Environment, Henan Agricultural University, Zhengzhou 450046, China
2
Henan Engineering Research Center of Land Consolidation and Ecological Restoration, Zhengzhou 450046, China
3
College of Land Science and Technology, China Agricultural University, Beijing 100193, China
*
Author to whom correspondence should be addressed.
Land 2023, 12(7), 1307; https://doi.org/10.3390/land12071307
Submission received: 2 June 2023 / Revised: 26 June 2023 / Accepted: 27 June 2023 / Published: 28 June 2023

Abstract

:
Ecological security pattern construction is a fundamental approach to ensuring regional ecological security and enhancing human welfare. Taking Henan Province, a typical region of China’s main agricultural production area, as the study area, we use multi-source spatial data to calculate the high-value areas of ecosystem services and identify ecological source sites. On the basis of calculating the degree of land use development and GDP per land and population density to determine high-demand areas of the ecosystem, the ecological resistance surface coefficient is modified with nighttime lighting data, and the ecological corridor between the source site and the high-demand area is extracted using the minimum cumulative resistance model, so as to construct and optimize the regional ecological security pattern. The following results are presented. (1) The total area of ecological source sites in Henan Province is 3.02 × 10⁴ km2, accounting for 18.12% of the total study area, which is concentrated in the mountainous areas of East Henan and South Henan. (2) The high-demand area of ecosystem services has a total area of 4.1 × 10⁴ km2, accounting for 24.73% of the total study area, mainly concentrated in the central and eastern regions of Henan, with poor spatial matching of ecosystem service supply and demand. (3) The total length of ecological corridors is 1062.3 km, and the overall pattern forms the main corridor axes. The identification of ecological corridors focuses on the ecological demand space and puts forward suggestions for the optimization of the regional ecological security pattern based on it.

1. Introduction

Since 2020, the successive arrival of the COVID-19 pandemic and natural disasters have had a huge impact on food production and trade. In particular, the economic slowdown caused by the COVID-19 pandemic and the interruption of the food value chain have intensified hunger and food insecurity [1,2]. In 2020, the United Nations proposed sustainable development goals of “No Poverty” and “Zero Hunger” [3,4]. As a developing country with a large population and a strong consumption capacity, China has put forward higher requirements for food security in the process of high-quality development of new urbanization centered on people [5]. Therefore, ensuring national food security has become a key issue, and the Central Key Agricultural Area is an important representative in promoting new urbanization and ensuring food security, as it is an area of high population density and large-scale agriculture [6].
Henan Province is an important agricultural and grain production province in China, occupying only 1/16 of the cultivated land area but producing 1/10 of the country’s food with a steady output of over 60 billion kg for years. As the core production area of the national food strategic project and an agricultural province in the Central Plains Economic Zone, Henan bears an important responsibility for food production [7]. However, increasing agricultural environmental pollution, rural living pollution, agricultural non-point source pollution, a shortage of agricultural resources, and a reduction in agricultural biological diversity have become significant ecological problems in recent years, posing a threat to the stability of the ecosystem and affecting regional ecological security and the sustainable development of the socio-ecological system [8].
The ecological security pattern is considered one of the three major strategic patterns for territorial space development and protection [9]. Studying the demand mechanisms and contents of ecosystem services is an important step toward achieving ecological security as ecosystem service demand is the end of the “social-economic-environmental” system [10]. Ecological corridors are not only channels for the flow of matter and energy but also play a crucial role in connecting ecological space and human society [11]. Ecosystems can provide humans with material products and ecological services [12]. The dynamic balance between the supply and demand of ecosystem services is formed by the consumption demand of humans for ecological products and services, which is also a fundamental issue for promoting the sustainable and healthy development of the economy, society, and natural environment [13].
The concept of ecological safety patterns relates to the overall health and sustainability of an ecosystem, as well as the extent to which it can provide its essential functions [14,15]. Both domestic and foreign studies on the construction of ecological system security patterns have formed a relatively complete pattern construction model based on the basic framework of “source identification, resistance surface construction, corridor extraction, and security pattern determination” [16]. However, there has been insufficient consideration of the dynamic factors affecting the ecological security pattern, and relatively little attention has been given to the dynamic balance between the supply of ecological system services and the development needs of human society [17]. Early research on the supply and demand of ecological system services mainly focused on defining the concept of ecological system supply and demand and improving the research framework, placing more emphasis on the supply of ecological system services [18]. In recent years, the focus has mainly been on the quantification and spatialization of the supply and demand of ecological system services, the balance between supply and demand, and the spatial distribution of supply and demand [19,20,21]. Among them, the quantification of ecological system service supply and demand mainly uses methods such as ecological process simulation, ecological value equivalent, land use estimation, expert assessment matrix, and ecological model [22,23]. Research on supply–demand balance often uses methods such as the ecological supply–demand ratio, demand rate, and supply–demand coordination degree. The research scale has also expanded from small and medium scales such as watersheds, mountains, and basins to national and global scales [24]. However, research on ecological management zoning based on the supply–demand relationship of ecosystem services is still limited, and the research scale often focuses on the county and city level, with few on the provincial level. The smaller scale often makes it difficult to propose constructive layout optimization suggestions and measures based on differences in geology, climate, and economy within larger regions. Especially in agricultural provinces such as Henan Province, research on the ecological security pattern from the supply–demand perspective at the provincial level is almost blank. In addition, given the current research status, it is necessary to comprehensively consider the coupled coordination and matching relationship between the supply and demand of ecosystem services when carrying out ecological management zoning, which is conducive to reflecting the real status of ecosystem services and providing effective information for the management of ecosystem services. Taking into account the supply of the ecosystem and the needs of stakeholders for the management of ecosystem services, it is of great significance to promote the sustainable development of both the ecosystem and the socio-economy. Therefore, conducting research on the supply–demand balance and spatial correlation pattern of ecosystem services in economically backward and ecologically vulnerable areas can provide decision-making assistance for ecological system management and rational and effective resource allocation, which is highly significant for the harmonious development of humans and nature.
Overall, although current research has gradually focused on the matching relationship between the supply and demand of ecosystem services, previous studies have tended to focus more on the static characteristics of this relationship rather than the spatiotemporal pattern and spatial matching relationship evolution of ecosystem service supply and demand [25]. There has been more emphasis on comprehensive research on ecological system services, with less attention paid to different types of ecological system services. Research has also tended to focus on the development of eastern coastal areas and central urban areas. Less attention has been given to the main grain-producing areas, which are vulnerable ecological environments and have extremely important strategic positions in terms of food security [26].
Therefore, this study selected three indicators: water supply capacity, carbon sequestration and oxygen release capacity, and habitat quality, which can represent the main ecological conflicts in Henan Province. The ecological source sites were extracted using the indicator importance method, and the spatial pattern of ecosystem service demand was identified through considering the level of land development, population density, and GDP per land a. Finally, the MCR model (Minimum Cumulative Resistance model) was used to extract ecological corridors between the source sites and between the source sites and high-demand areas. As a result, the regional ecological security pattern was identified and constructed. The aim of this study is to provide a scientific reference for establishing a comprehensive ecological governance mechanism promoting regional protection, governance, and high-quality development in Henan Province.

2. Materials and Methods
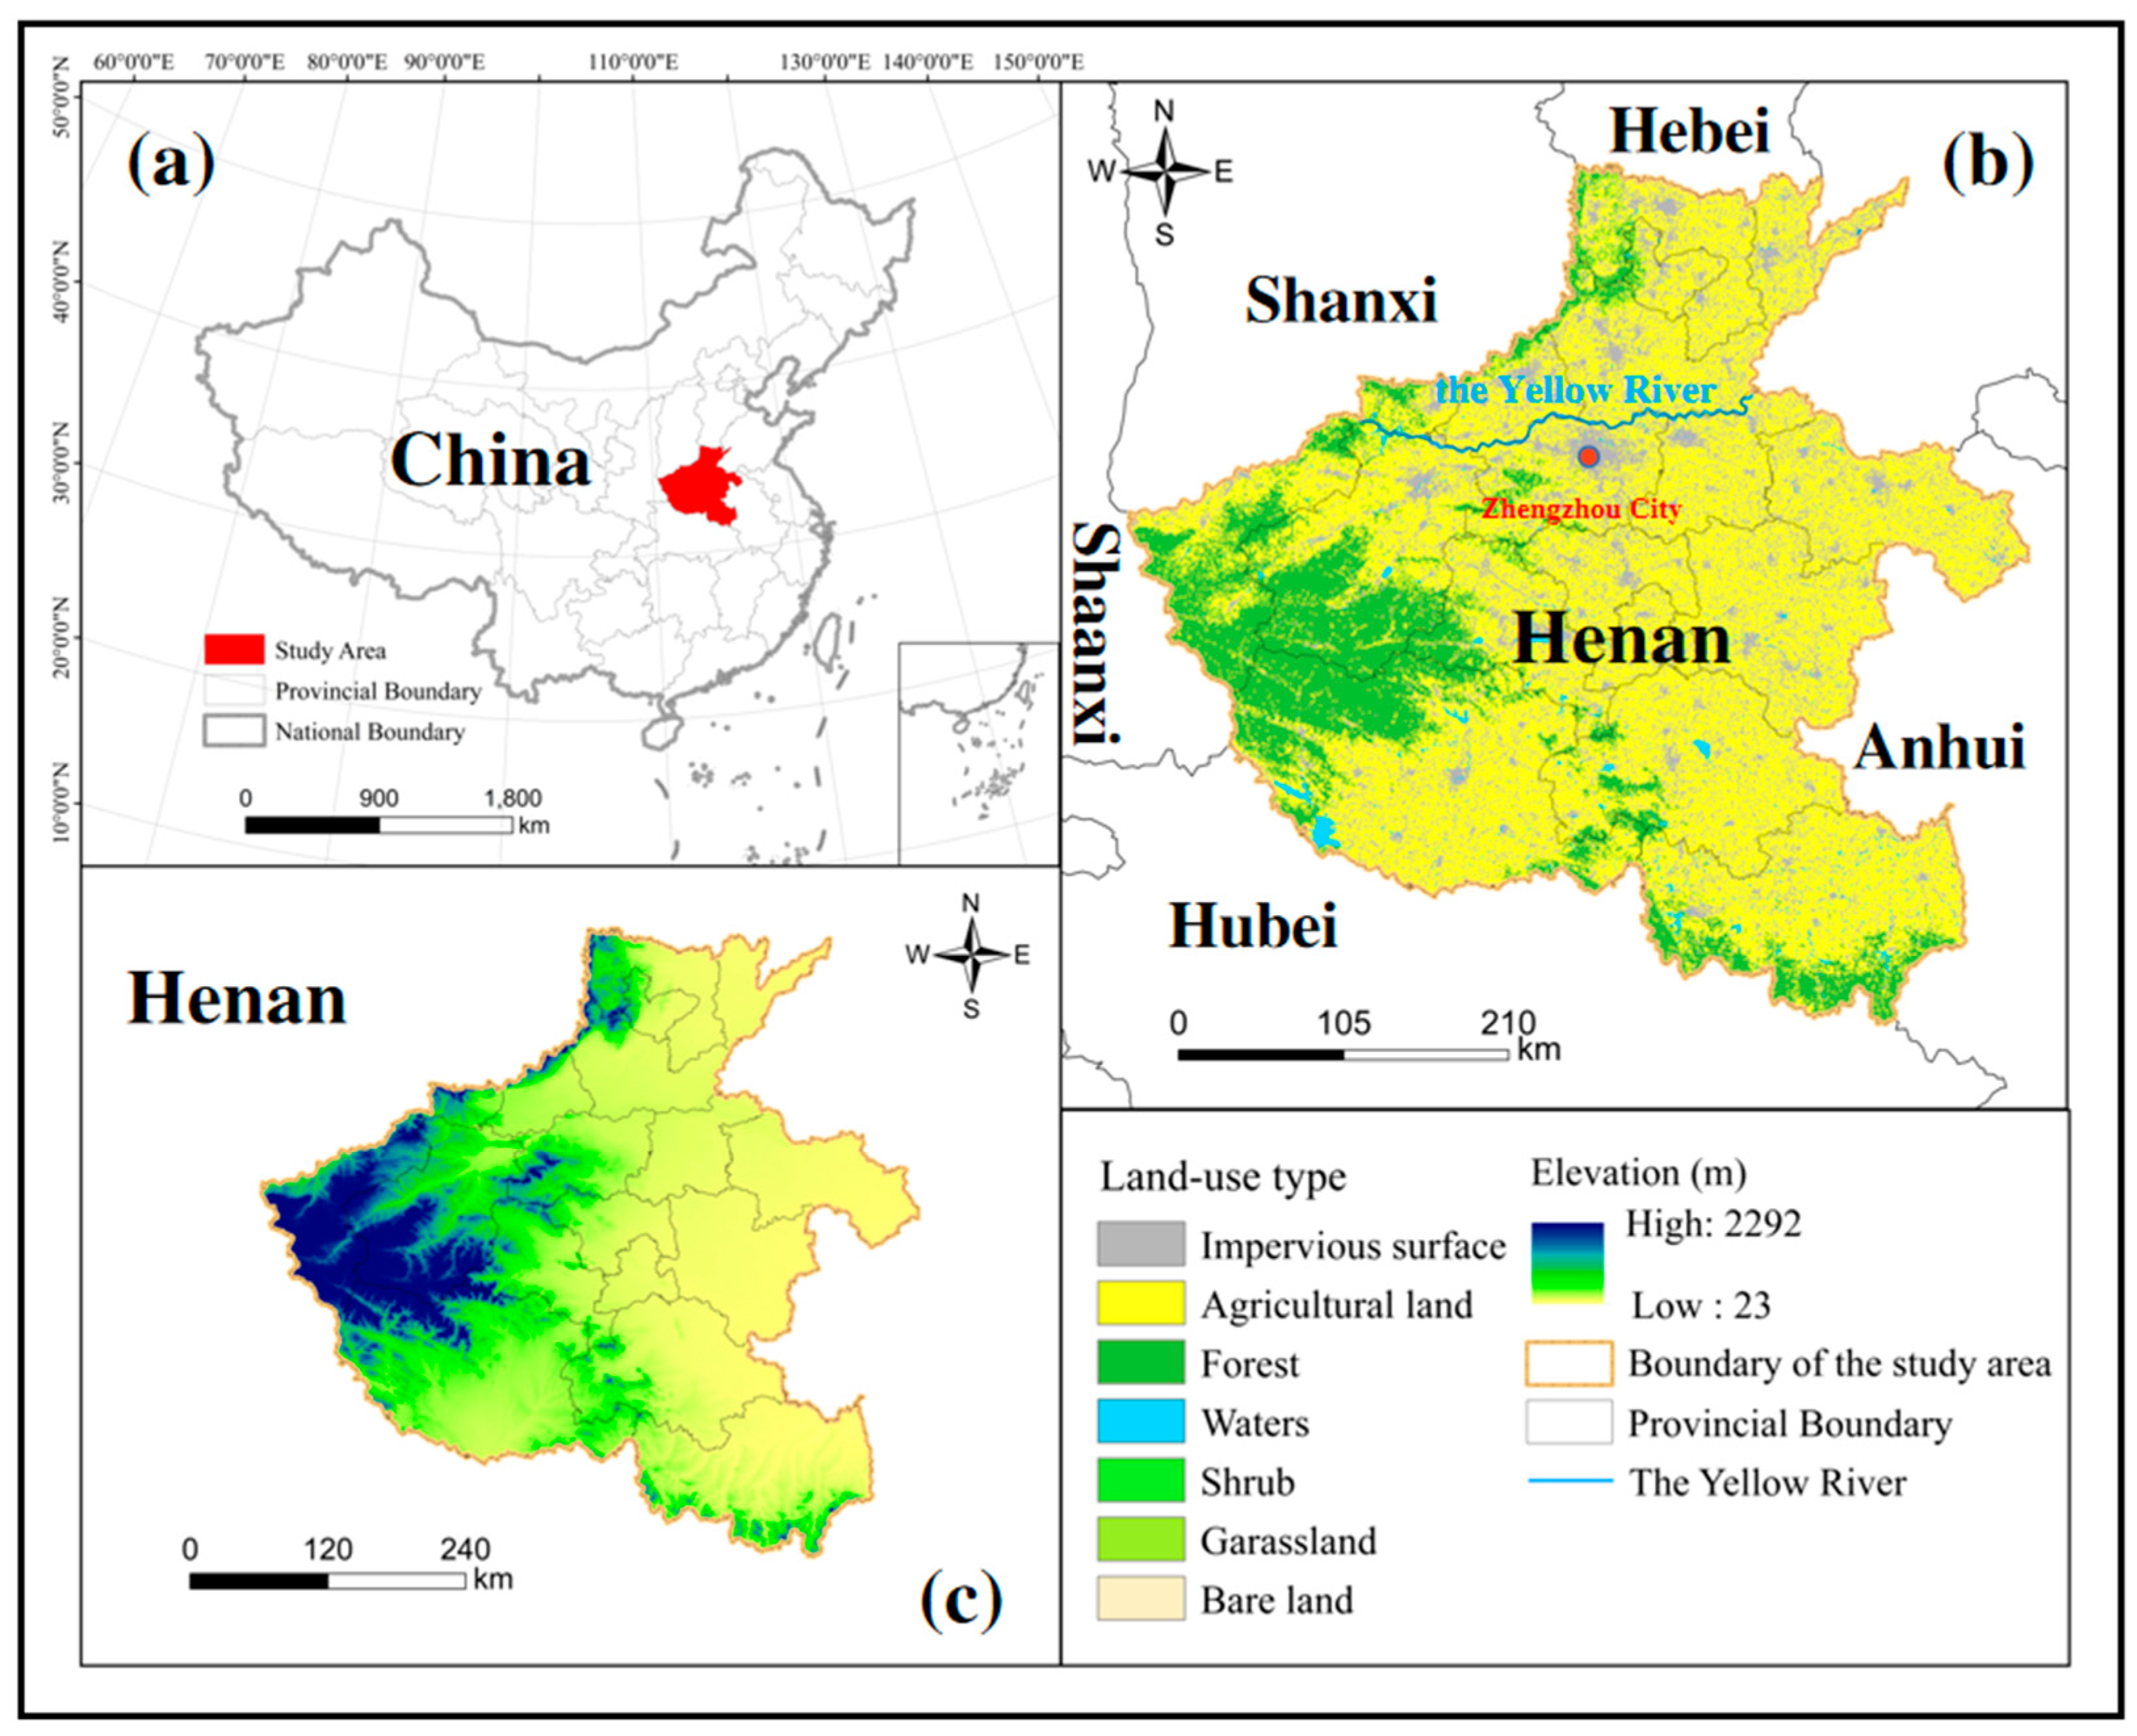
2.1. Study Area

Henan Province (31°23′ N–36°22′ N, 110°21′ E–116°39′ E) is located in central China with a terrain that slopes from west to east, mostly situated within the warm temperate zone (Figure 1a,c). Its total area is 16.7 × 10⁴ km2, ranking 17th in the country. Henan Province is a major producer of agricultural products and an important mineral resource hub in China. With its advantageous geographical location and convenient transportation, it has become a crucial transportation hub, as well as a hub for people, goods, and information flow. As of 2022, the province’s GDP reached CNY 6.13 trillion, ranking fifth in main-land China and first among the central and western provinces. In 2018, the total grain output in Henan Province was 66.4891 million tons, utilizing a cultivated land area of 8.11 × 10⁶ hm2, accounting for approximately 1/16 of the country’s cultivated land and producing about 1/10 of the national grain output. Henan Province has been designated as a key area for the new type of urbanization and a national modern agricultural demonstration zone in the “Thirteenth Five-Year Plan” for the development of modern agriculture. The coordinated development of new-type urbanization and grain security in Henan Province is of great significance for the urbanization of central agricultural areas and national food security. Land use in the province is dominated by farmland, accounting for over 60% of the total area, followed by forests and construction land. High land-use intensity, mineral resource exploitation intensity, low vegetation cover, uneven distribution of water resources, severe ecological environment damage, weak ecological carrying capacity, unbalanced urban ecology, and serious ecological function degradation are the prominent features of land use in Henan Province (Figure 1b).

2.2. Data Sources

This study incorporates vector data, raster data, and statistical data, whose sources and resolutions are listed in Table 1. We ensure data continuity and accuracy through unifying the data coordinate system as WGS_1984_Albers and resampling all spatial data into raster layers with a resolution of 1 km × 1 km.

2.3. Ecosystem Services Supply Measurement

In light of prior research and the current situation in Henan Province [27,28], we followed the ecosystem service type framework suggested by The Economics of Ecosystems and Biodiversity (TEEB)—a common approach in ecosystem services studies [29]. Given Henan Province’s current reality, characterized by limited water resources, severe soil erosion, high population pressure, and a fragile ecological environment, we selected three indicators—water supply capacity, carbon sequestration and oxygen release, and habitat quality—to gauge the ecosystem services available to human populations in the region.

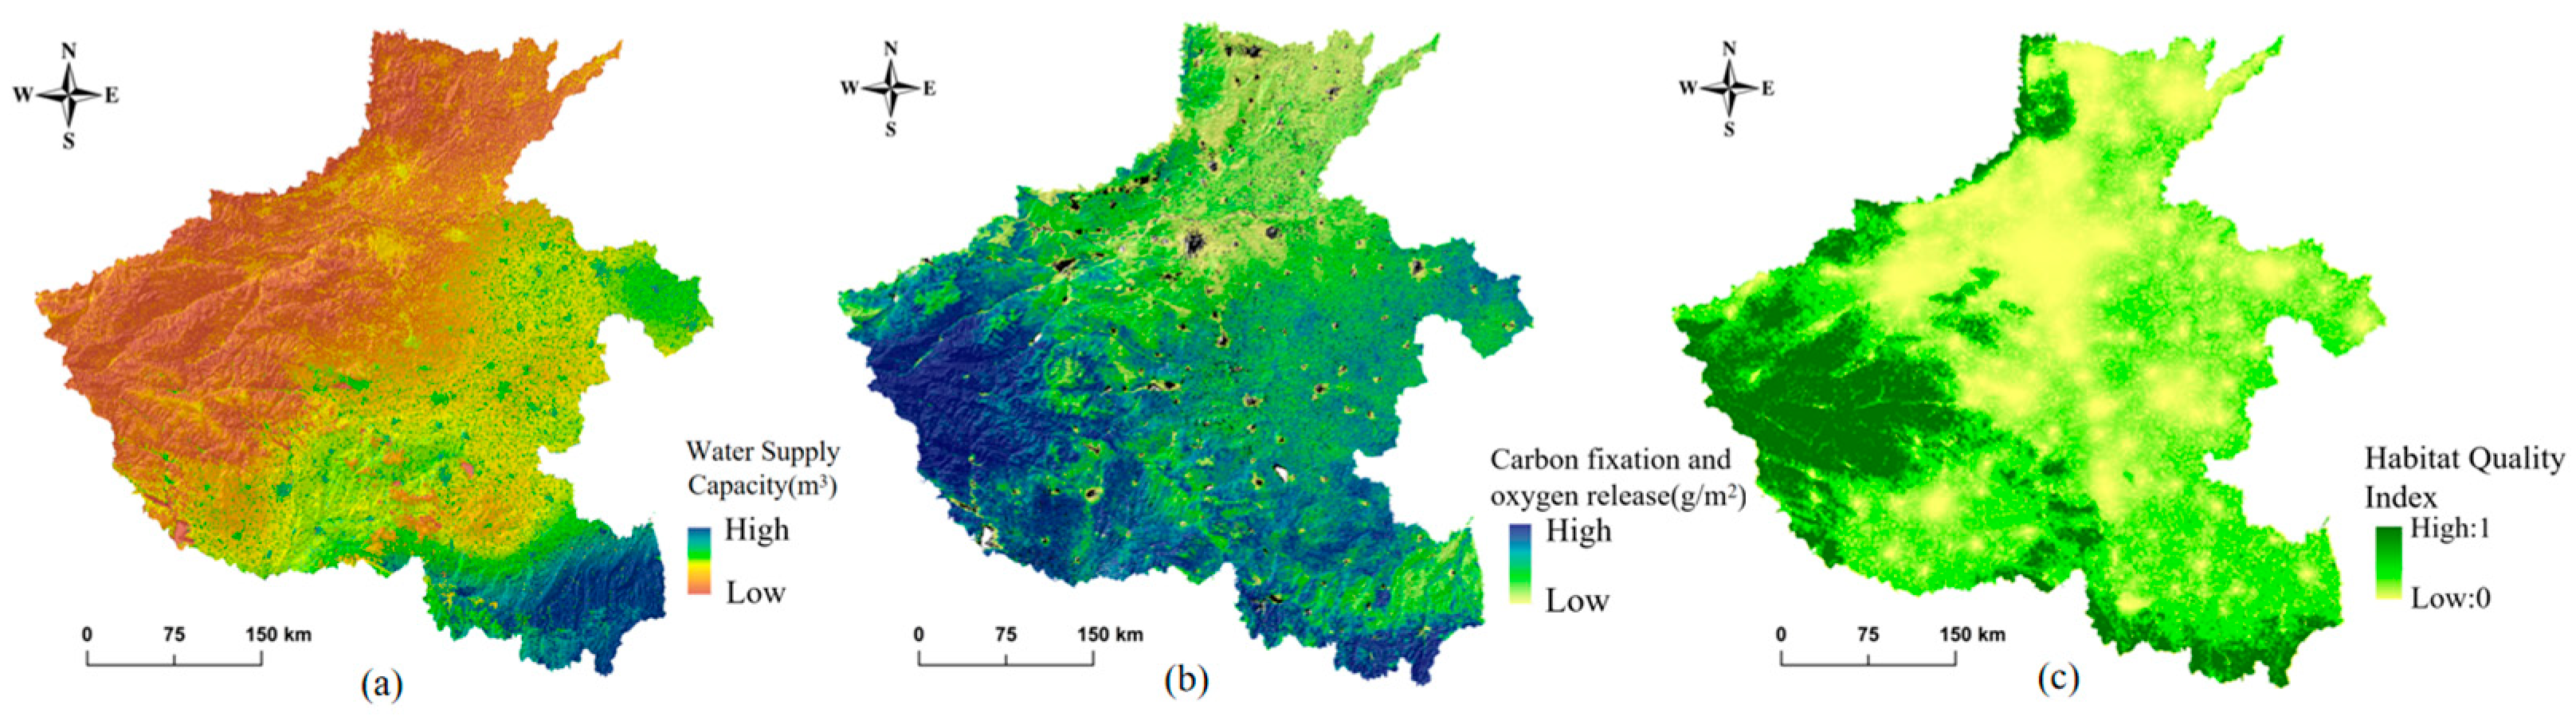
2.3.1. Water Supply Capacity

To calculate the water supply capacity TQ (m3) per unit area of the study area for different ecosystem types, we employed the water balance equation. This equation captures the difference between the annual precipitation and the water consumed by plants through transpiration and other sources in the study area [28]. The equation can be expressed as follows:
T Q = i = 1 j ( P i R i E T i ) × A i × 1 0 3
In the formula, i represents the ith ecosystem type in the study area, while j is the total number of ecosystem types. Pi corresponds to the total amount of precipitation (mm) in the study area, Ri accounts for the amount of surface runoff (mm) calculated through the hydrological analysis module of ArcGIS software using DEM data, ETi denotes the amount of surface evapotranspiration (mm), and Ai represents the area (km2) of the ith ecosystem type.

2.3.2. Carbon Fixation and Oxygen Release

Based on prior research [30], we know that green plants have the capacity to absorb and fix 1.63 g of CO2 from the atmosphere for every 1 g of dry matter produced through photosynthesis. Moreover, green plants release 1.2 g of O2 into the air. Using this information, we calculated the amount of carbon sequestered and oxygen released by green plants in the study area, Ca, using the following equation:
C a = NPP 45 % × ( 1.2 + 1.63 )
In the equation, Ca represents the amount of carbon sequestered and oxygen released by vegetation (g/m2), while NPP denotes the net primary productivity of vegetation.

2.3.3. Habitat Quality

The Habitat Quality module of the InVEST (Integrated Valuation of Ecosystem Services and Tradeoffs Tool) model is commonly used to evaluate regional habitat quality. This research applied this approach to assess the habitat quality in the study area, with the exception of cropland, grassland, woodland, and water bodies, which were treated as systematic habitats, while all other types were non-habitats. To account for the impact of human activity intensity on habitats, four factors (roads, railroads, construction land, and human activity intensity) were selected as habitat threat sources in this study. The intensity of nighttime lights was used as an indicator of human social activity intensity. Our model followed previous studies [31,32,33], and the specific assessment parameters are presented in Table 2.

2.4. Ecosystem Service Demand Estimation

This research used the desired quantity of products or services that human society aims to acquire from the natural environment during economic development as a reference for calculation. We selected three indicators—land use development degree, population density, and GDP per land area—to reflect demand for ecosystem services, based on the availability of socio-economic data and the actual situation in the study area.

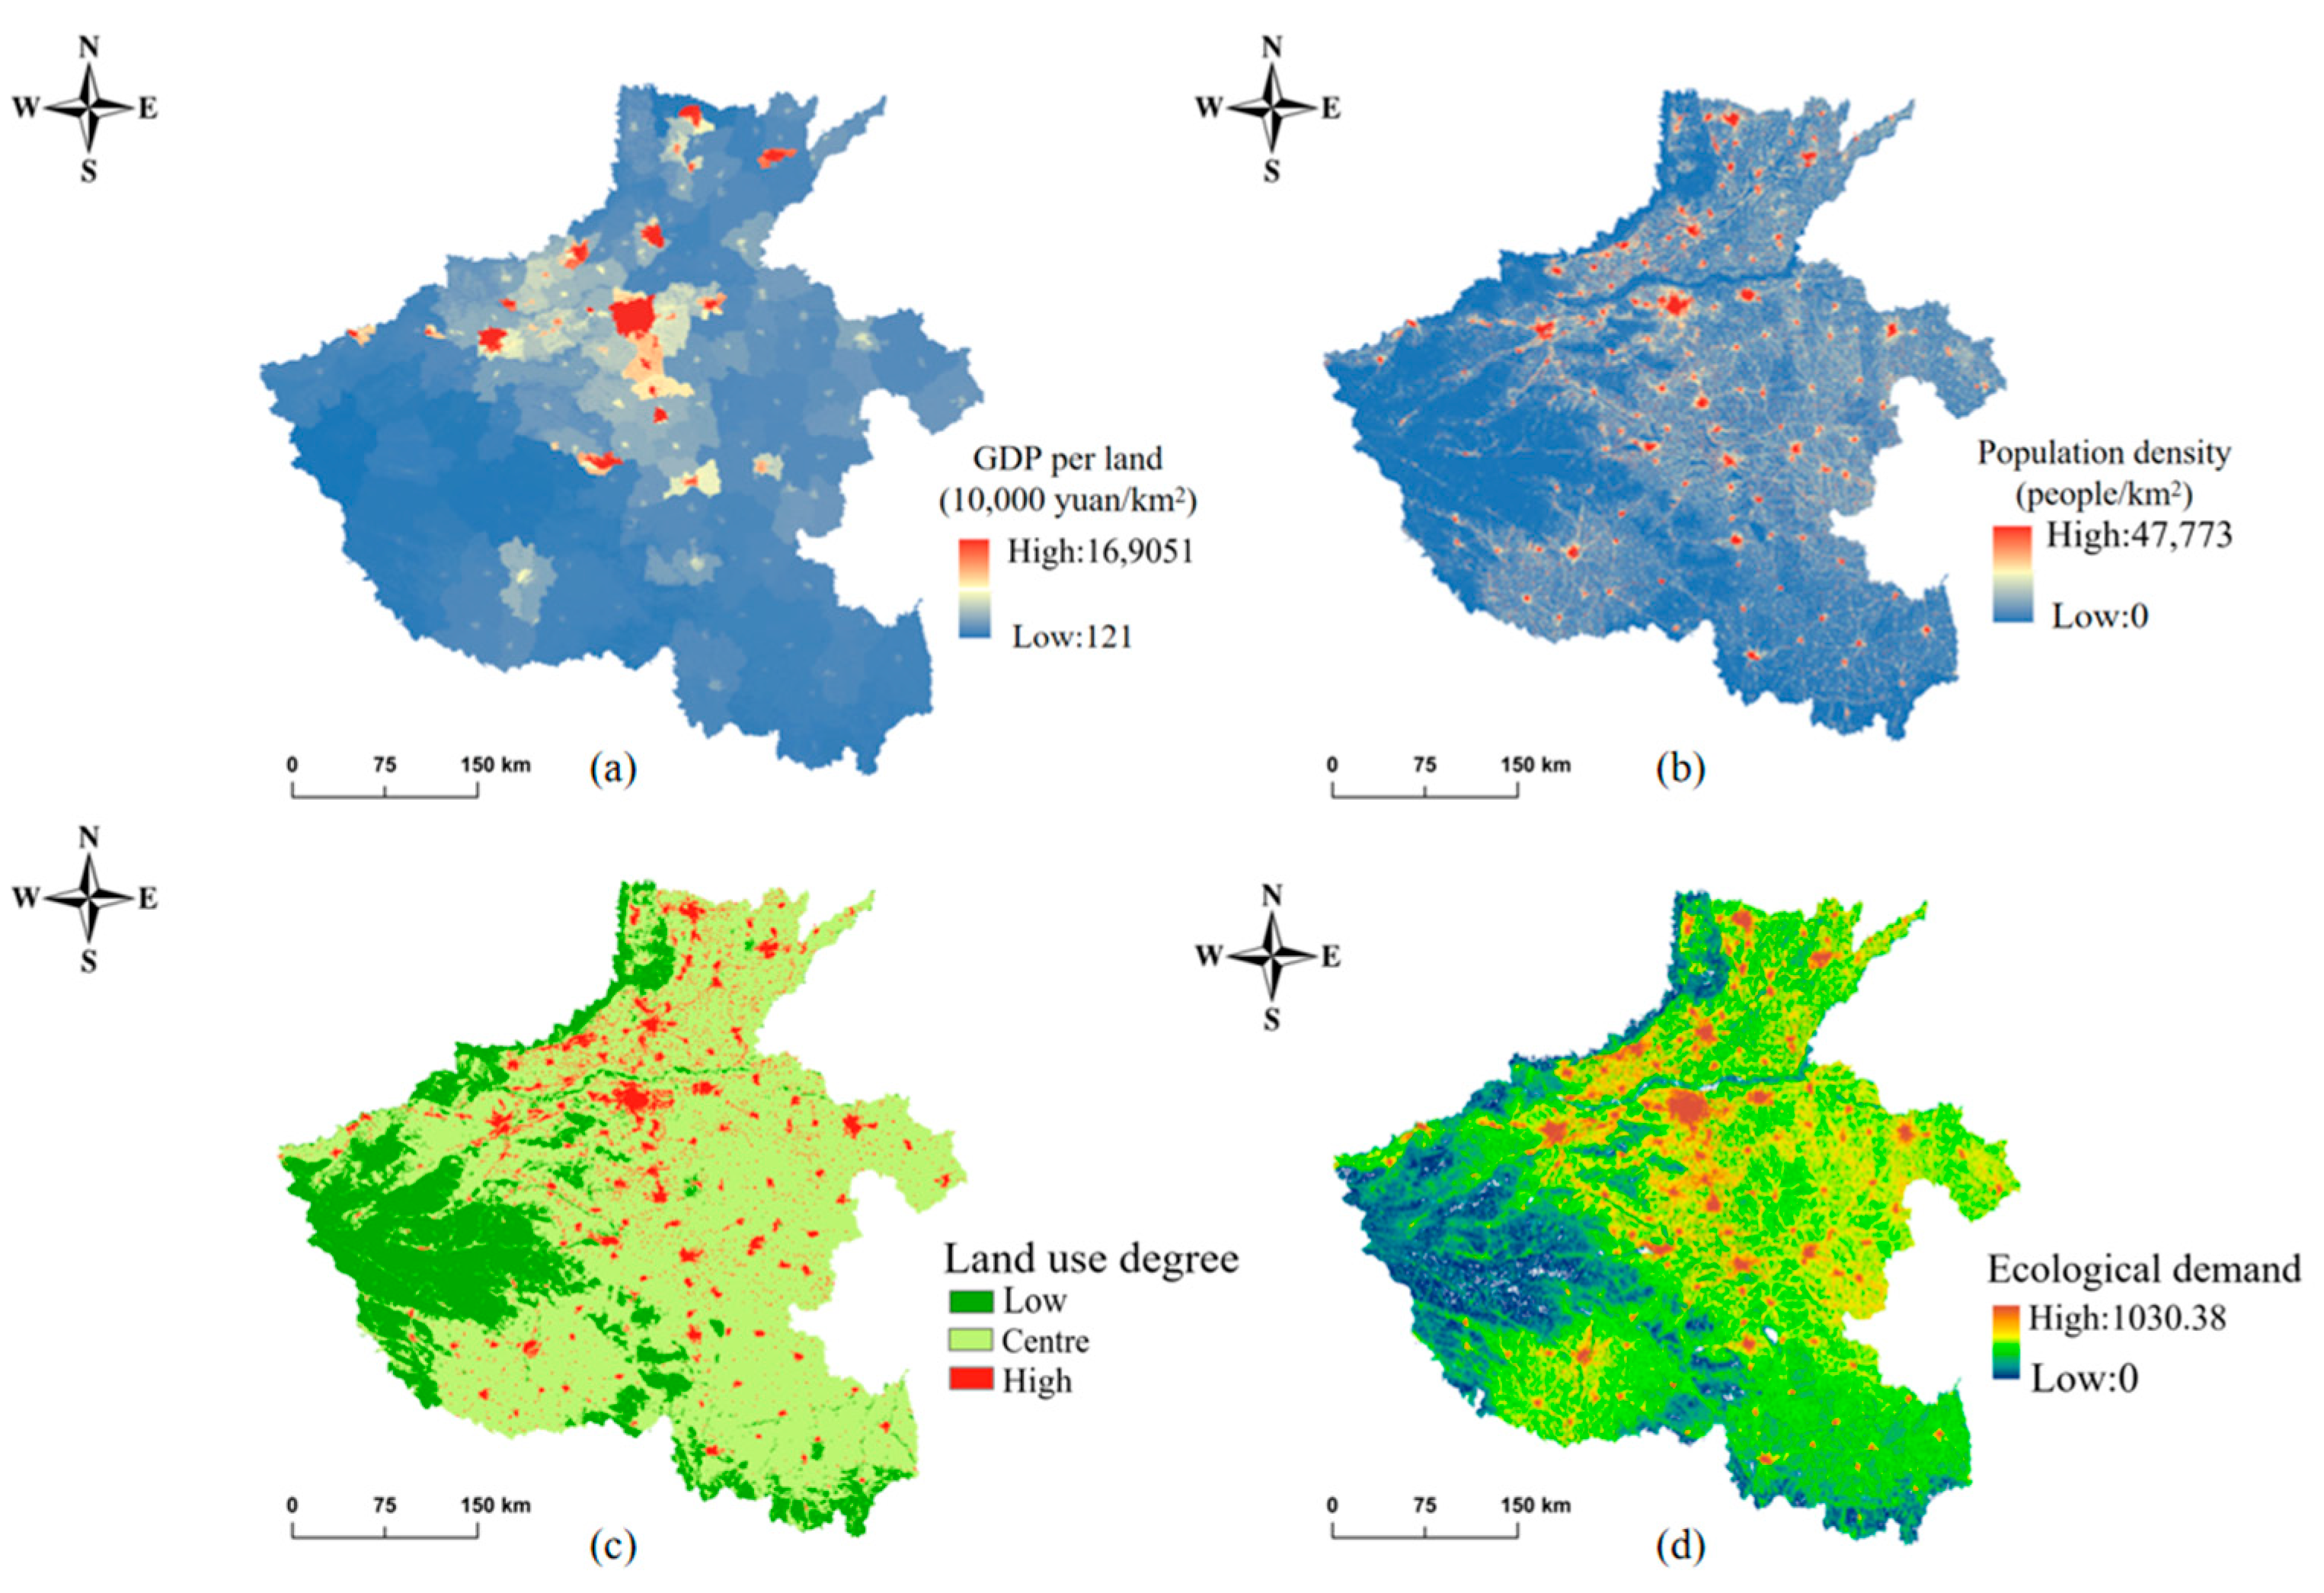
2.4.1. Degree of Land Use Development

The degree of land use development and utilization is represented by the comprehensive land use index, which evaluates and grades the degree of land use in the study area, allowing for the analysis of ecological health related to land use changes and the assessment of land use strength. This index is computed using a grading system, as previously described [34]. The formula is presented as follows:
L i = 100 × n = 1 n A i × C i
The equation for the comprehensive land use index is defined as follows: Li represents the overall index of land use development and utilization, Ai is the graded index for land use intensity at level i within the study area, Ci represents the proportion of graded area to the total utilized area, and n is the number of gradations employed.

2.4.2. Population Density

Population density can serve as an indicator of demand for ecosystem services to a certain degree. An increasing population density indicates a greater demand for accessing ecosystem services in the region.

2.4.3. GDP Per Land

The per capita GDP reflects the efficiency of human society in utilizing ecosystem services. The higher the per capita GDP, the higher the economic production value generated per unit area of land, indicating a stronger economic strength and a corresponding greater demand for ecosystem services.
To address the issue of significant disparities between densely populated areas with high economic development and other areas with lower population density and GDP per unit of land, we conducted separate logarithmic transformations on the population density and GDP per land area. This approach was taken to minimize variations in land usage and to reduce fluctuations in the data itself. The formula used for the transformation is provided below:
Y = y1 × lg y2 × lg y3
In the equation, Y represents the demand for ecosystem services in the study area, and y1, y2, and y3 denote the degree of land use development, population density, and GDP per land area, respectively.

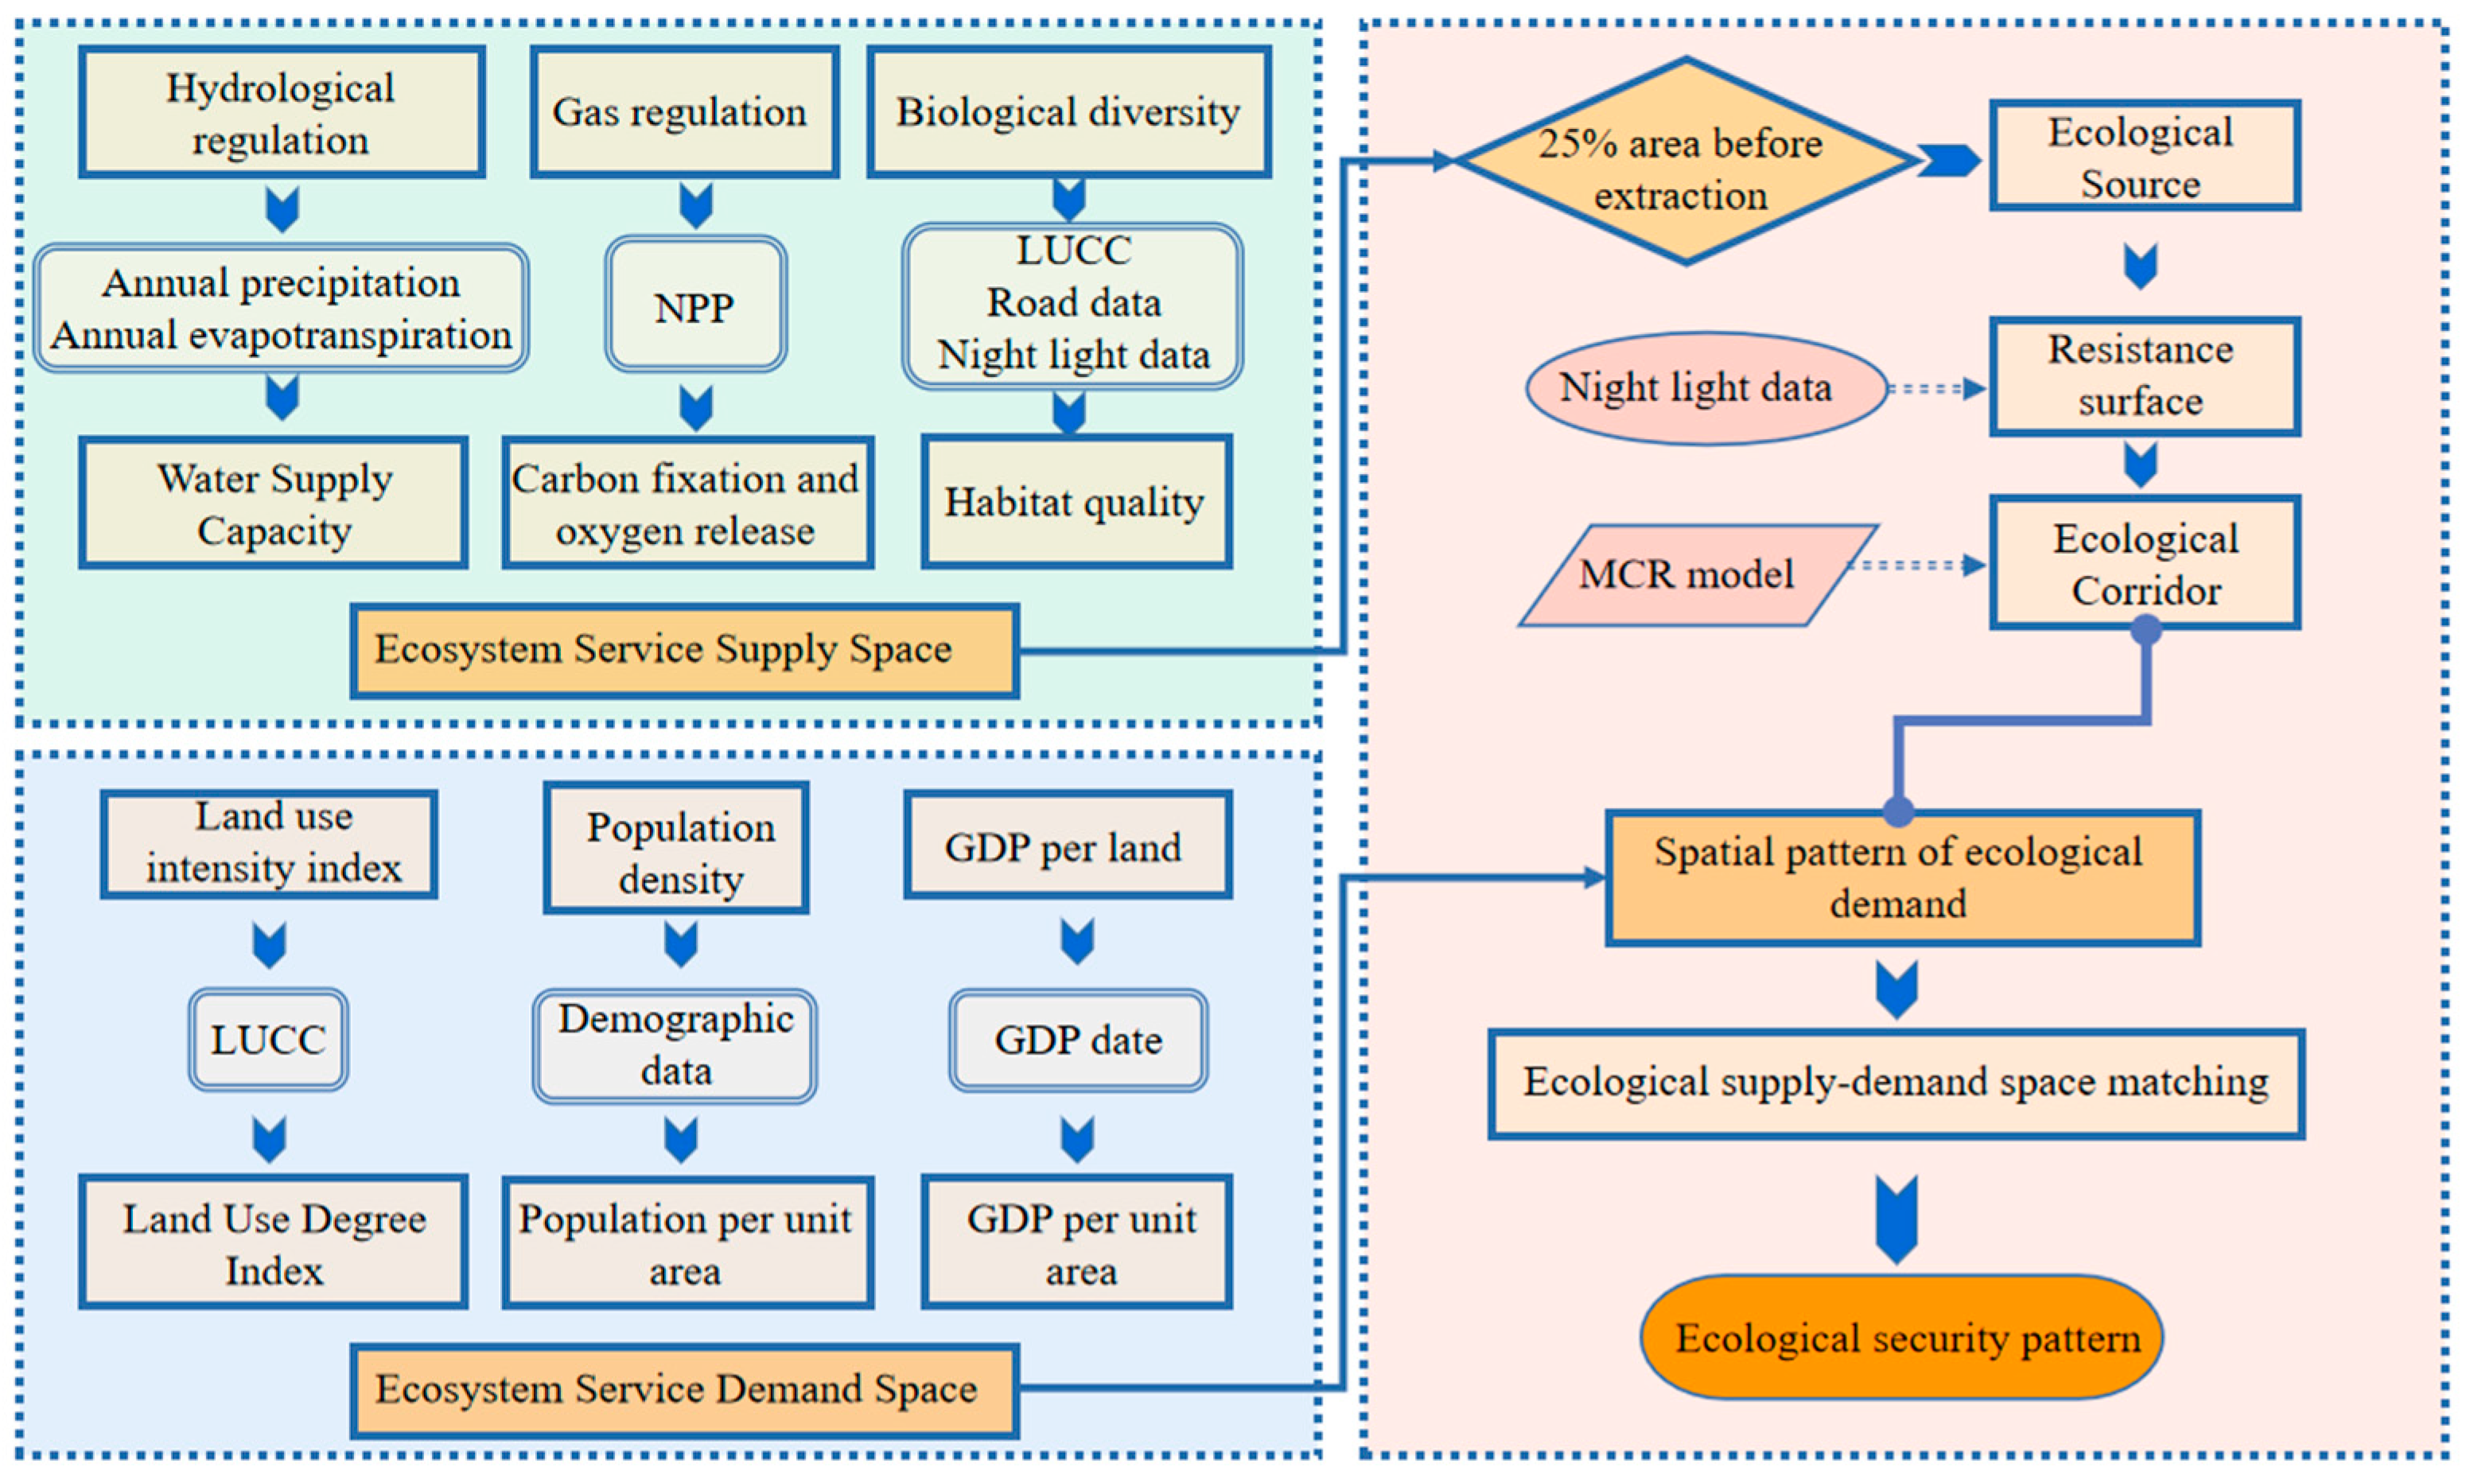
2.5. Construction of Ecological Security Pattern Based on Supply and Demand Perspective

2.5.1. Ecological Source Site Identification

Ecological source sites must provide significant ecological service functions and have high-quality habitat. This paper proposes an effective method for identifying source sites based on a quantitative assessment of the supply capacity of ecosystem services within the study area. The important areas of ecosystem service supply were identified through selecting the top 25% areas of each ecosystem service’s spatial distribution and collating them to derive the intersection. Subsequently, non-ecological functional land was excluded from the top 25% areas of the selected index [35], resulting in the identification of important ecological source sites in the study area. The remaining patches were classified as general ecological land.

2.5.2. Resistance Surface Construction

Referring to previous studies on ecological resistance surface construction and ecological resistance coefficients [36], this study used the basic ecological resistance coefficient values shown in Table 3. After setting the resistance coefficient values for different land use types, the established ecological resistance surface values in the study area were adjusted using NPP-VIIRS nighttime lighting raster data to obtain the modified ecological resistance coefficient Ri in raster i. The calculation formula is as follows:
R i = NL i NL a × R
In the formula, NLi is the original nighttime light index data value of raster i, NLa is the average nighttime light index data value in land use type a where raster i is located in, and R is the initial resistance value of the landscape type of raster i.

2.5.3. Ecological Corridor Extraction

The identification and extraction of ecological corridors in the study area were conducted using the MCR model. This model calculates the cumulative resistance that must be overcome by energy, material, information, and other services in the ecosystem from the ecological source area to the ecological demand area. The resulting minimum resistance value is obtained through finding a suitable minimum resistance path for the flow within a certain spatial range. The equation for this method is as follows [37]:
MCR = f min j = n i = m D i , j × R i
In the formula, i and j represent two different ecological source areas, Dij denotes the spatial distance that species travel from source j to source i, Ri represents the ecological resistance coefficient of landscape type i under different land use types that affects species migration and dispersal, and fmin represents the functional relationship between minimum cumulative resistance and material migration.
Through analyzing the spatial distribution pattern of ecosystem service supply and demand in the study area and considering their interconnection with ecological space as well as their crucial role in regional ecological security, we coupled regional economic and social systems with natural environmental ecosystems. Our research primarily focused on identifying source sites and extracting corridors from the perspective of ecological supply and demand, with the aim of connecting natural ecological sources with human social demands based on high-demand areas. This approach aimed to promote the establishment of a positive feedback mechanism for the coupled ecological-economic-social coordination in the region, ultimately promoting the balance of ecological supply and demand and ensuring regional ecological security. The research framework of our article is illustrated in Figure 2.

3. Results

3.1. Ecosystem Service Supply

The spatial distribution of ecosystem services in Henan Province in 2021 is presented in Figure 3. The mean value of habitat quality service was 0.38, with the lowest value being 0 and the highest value being 1. Woodland and grassland accounted for 93% of the areas with high habitat quality values. In terms of land use types, the order of habitat quality values was forest land > grassland > cropland > water bodies > unused land > construction land. Through our calculations, we found that the water connotation service exhibited a spatial distribution characterized by “high in the southwest and low in the northeast”. Its total value was 5.916 billion m3, with the high-value areas of water connotation mainly distributed in the Dabie Mountains in the southeast of the study area, followed by the Nanyang Basin and the eastern part of Henan. These value areas were primarily influenced by precipitation and surface evapotranspiration, with an average value of 3.61 × 10⁵ m3. Furthermore, it showed a marked pattern of uneven spatial distribution. The overall carbon sequestration and oxygen release services were consistent with the spatial distribution of forest and river areas in the study area. The average value of carbon sequestration and oxygen release was 1963 g/m2, with the most significant carbon sequestration and oxygen release occurring in forest land at 4619.3 g/m2. These low-value areas were mainly distributed in construction and unused land.

3.2. Ecosystem Service Needs

Overall, a comprehensive analysis of various ecosystem service demand indicators in the study area revealed that the ecological demand of unused land, which had the lowest degree of land use, was the lowest. Its area was 3039 km2, accounting for 1.9% of the total study area. Cropland covered an area of 1.08 × 10⁵ km2, accounting for 67.8% of the total study area, and it was relatively concentrated in the region. Due to the significant impact of human activities, the ecological demand for ecosystem services in cropland was high. The demand for construction land services was the highest, with an area of 23,718 km2, accounting for 14.8% of the study area. It was primarily distributed in the built-up areas of various cities. Population density and GDP per land exhibited similar spatial distribution characteristics. The highest population density was 47,773 people/km2, while the highest per capita GDP was 169,051 CNY/km2. Both values were located in the main urban area of Zhengzhou. However, there were also regions in the study area with a population density of 0 people/km2, covering an area of 2950 km2. Combined with the spatial pattern of ecological demand, the ecological demand value in this area was the lowest at 0, while the highest demand value was 1030.38, which was generally consistent with the spatial distribution of population and built-up areas in the study area (Figure 4).
On the whole, the spatial distribution pattern of demand for ecosystem services in Henan Province is characterized by “high and low value aggregation”, with the high value gathering area mainly located in the “1 + 8” metropolitan area of Zhengzhou City (“1” refers to Zhengzhou, the provincial capital, and “8” refers to Kaifeng, Luoyang, Pingdingshan, Xinxiang, Jiaozuo, Xuchang, Luohe, and Jiyuan, respectively), forming a spatial pattern of “one core, one vice, one belt and multiple points” of high-demand areas (The “one core” refers to Zhengzhou, the “one vice” is the deputy center city of Luoyang, the “one belt” is the national strategy of Zheng-Luo-West high quality development cooperation belt, with Zheng-Kai science and innovation corridor as the main axis, Zheng-Xin and Zheng-Jiao directions as important branches of the town and industry intensive development belt). This area has a total of 58,800 km2 and a radiated population of 46.7 million. The above-mentioned areas exhibit high demands for ecosystem services due to their elevated population density, intensive land use, and robust economic development. In contrast, some regions in west and southeast Henan are located in mountainous areas with large forest land coverage, complex topography, relatively sparse population distribution, and low land use, coupled with the strong siphoning effect of the provincial capital and economic development dominated by secondary and tertiary industries, so the demand for ecosystem services shows a pattern of low-value aggregation distribution.

3.3. Important Ecological Source Sites

From the overall spatial distribution of ecological source areas in Henan Province (Figure 5), it was found that these areas were concentrated in the western and southeastern regions of the study area, primarily including the territories of six nature reserves, namely, the Taihang Mountains, the Funiu Mountains, the Xiaoxishan Mountains, the Jigong Mountains, the Baotianman Mountains, and the Gaoleshui Mountains, as well as some areas of the Liankangshan Nature Reserve in the southeast. The total area of ecologically sensitive source areas in the study area was approximately 3.03 × 10⁴ km2, accounting for 18.16% of the total study area. In terms of land use types, ecologically sensitive source areas were mainly composed of forest and grassland. Although forest land accounted for only 13.8% of the total study area, the area of forest land within ecologically sensitive source areas accounted for 76.2% of the total. This indicates that forest land has made a significant contribution to the support and regulation of the regional ecosystem.

3.4. Ecological Resistance Surface Construction and Ecological Corridor Extraction

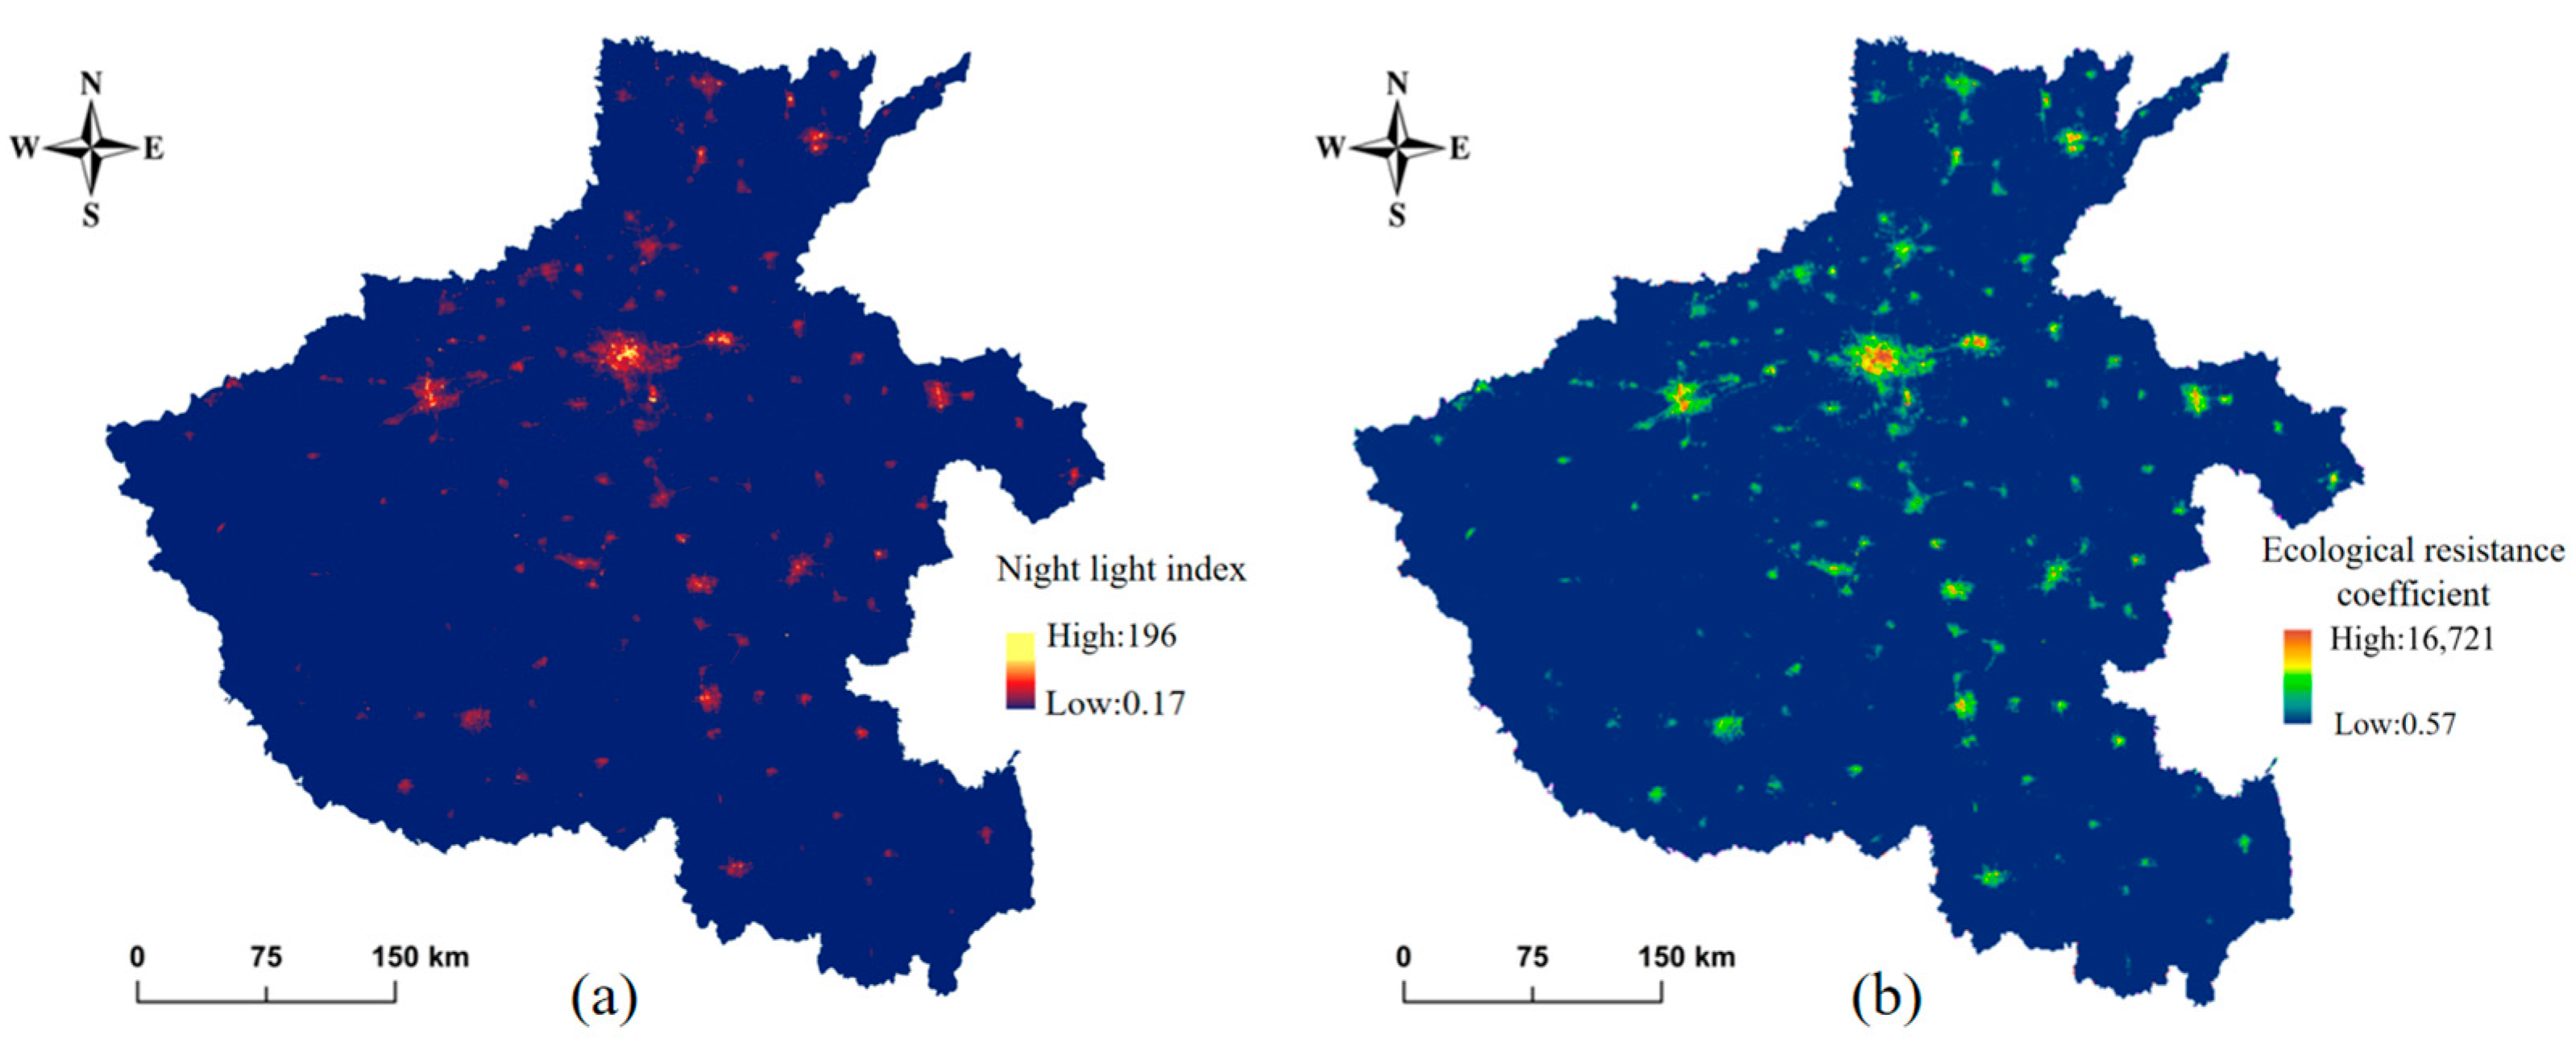
3.4.1. Ecological Resistance Surface

Nighttime light intensity values can reflect to some extent the economic development, population, and industries of a region. As shown in Figure 6, the maximum nighttime light intensity in the study area is located in the main urban area of Zhengzhou City, which is also consistent with its high level of economic development and urbanization. The central urban areas of other counties and districts also have a high level of urbanization, resulting in higher brightness than surrounding areas, gradually spreading outward. Based on the nighttime light intensity values in the study area, the basic ecological resistance coefficient was modified, as shown in Figure 6. It can be seen that the spatial distribution of the ecological resistance coefficient in the study area also exhibits certain regularity, with the highest resistance value after modification being 16,721.1 and the average value being 145.09. High values are distributed in the central areas of each urban area, and areas with high ecological resistance coefficient values show morphology distributed along the main transportation routes and population gathering areas in the study area. Most areas with low resistance values are consistent with the lighting data and are mainly located in rural areas and sparsely populated areas.

3.4.2. Ecological Corridors

In this study, the spatial analysis tool of ArcGIS software was used to analyze each of the 13 geometric center points of the ecological source sites as the starting points, and the remaining 12 points as the target point cluster. The minimum cost path was calculated using the MCR model, and the ecological corridor of Henan Province was extracted based on the results of the minimum resistance calculation. Based on the spatial pattern of ecosystem service demand, the extraction analysis tool of ArcGIS was used to extract the spatial pattern of ecological demand in the study area through multiple threshold extractions, resulting in a smooth curve linking the major ecological demand areas, which is the ecological demand corridor shown in Figure 7.
There are a total of 13 ecological corridors between sources in Henan Province, with a total length of 1062.3 km. The overall pattern forms two main corridor axes, northeast–southwest and northwest–southeast. In addition, there are east–west and north–south extensions between the central area to Mopan Mountain and the Dongzhai source area in the south. The demand corridor consists of 15 corridors with a total length of 1159 km. The main demand centers are located in the major urban built-up areas of Jinshui, Hualong, Wenfeng, Xigong, Wolong, Gulou, and Jian’an districts. The corridor effectively connects the high-demand points. Through analyzing the spatial distribution of ecological corridors and demand corridors, i.e., the spatial connection between the material flow path of the internal ecosystem and the social development energy demand in the study area, the construction of ecological source sites can be reasonably carried out, and the service space of the source site can be expanded.

3.5. Construction of Ecological Security Pattern

Based on the reality of the spatial distribution pattern of supply and demand for ecosystem services in Henan Province as discussed earlier, as well as the actual problem of the mismatch between supply and demand space, in combination with the division of the “Three Screens and Four Zones” ecological functional zones in the Master Plan of Henan Province’s main functional areas, and the topographical and geomorphological features, this article divides Henan Province into three ecological supply and demand zones: the carbon sequestration and oxygen release ecological supply zone in western Henan, the population and industry ecological demand zone in eastern Henan, and the water source replenishment ecological zone in southern Henan. The ecological corridors serve as pathways for the migration and diffusion of ecological sources, including biological species, material, energy, and information, between two adjacent ecological source areas. Taking the aggregation center of the high-demand ecological service areas as the starting point, and the remaining 13 points as the target point cluster, the ecological demand corridor is obtained with the framework of roads and residential areas. The Yellow River beach area and the South-to-North Water Diversion Project serve as the core “arteries” between the ecological supply and demand zones, and thus strengthen ecological construction. Therefore, this article proposes a block-based optimization model for the ecological security pattern of the research area, called the “Two Belts-Three Zones-One Barrier” mode, as shown in Figure 8.
“Two belts” refers to the ecological conservation belt of the Yellow River Basin and the ecological protection belt of the Central Route of the South–North Water Diversion Project.
(1)
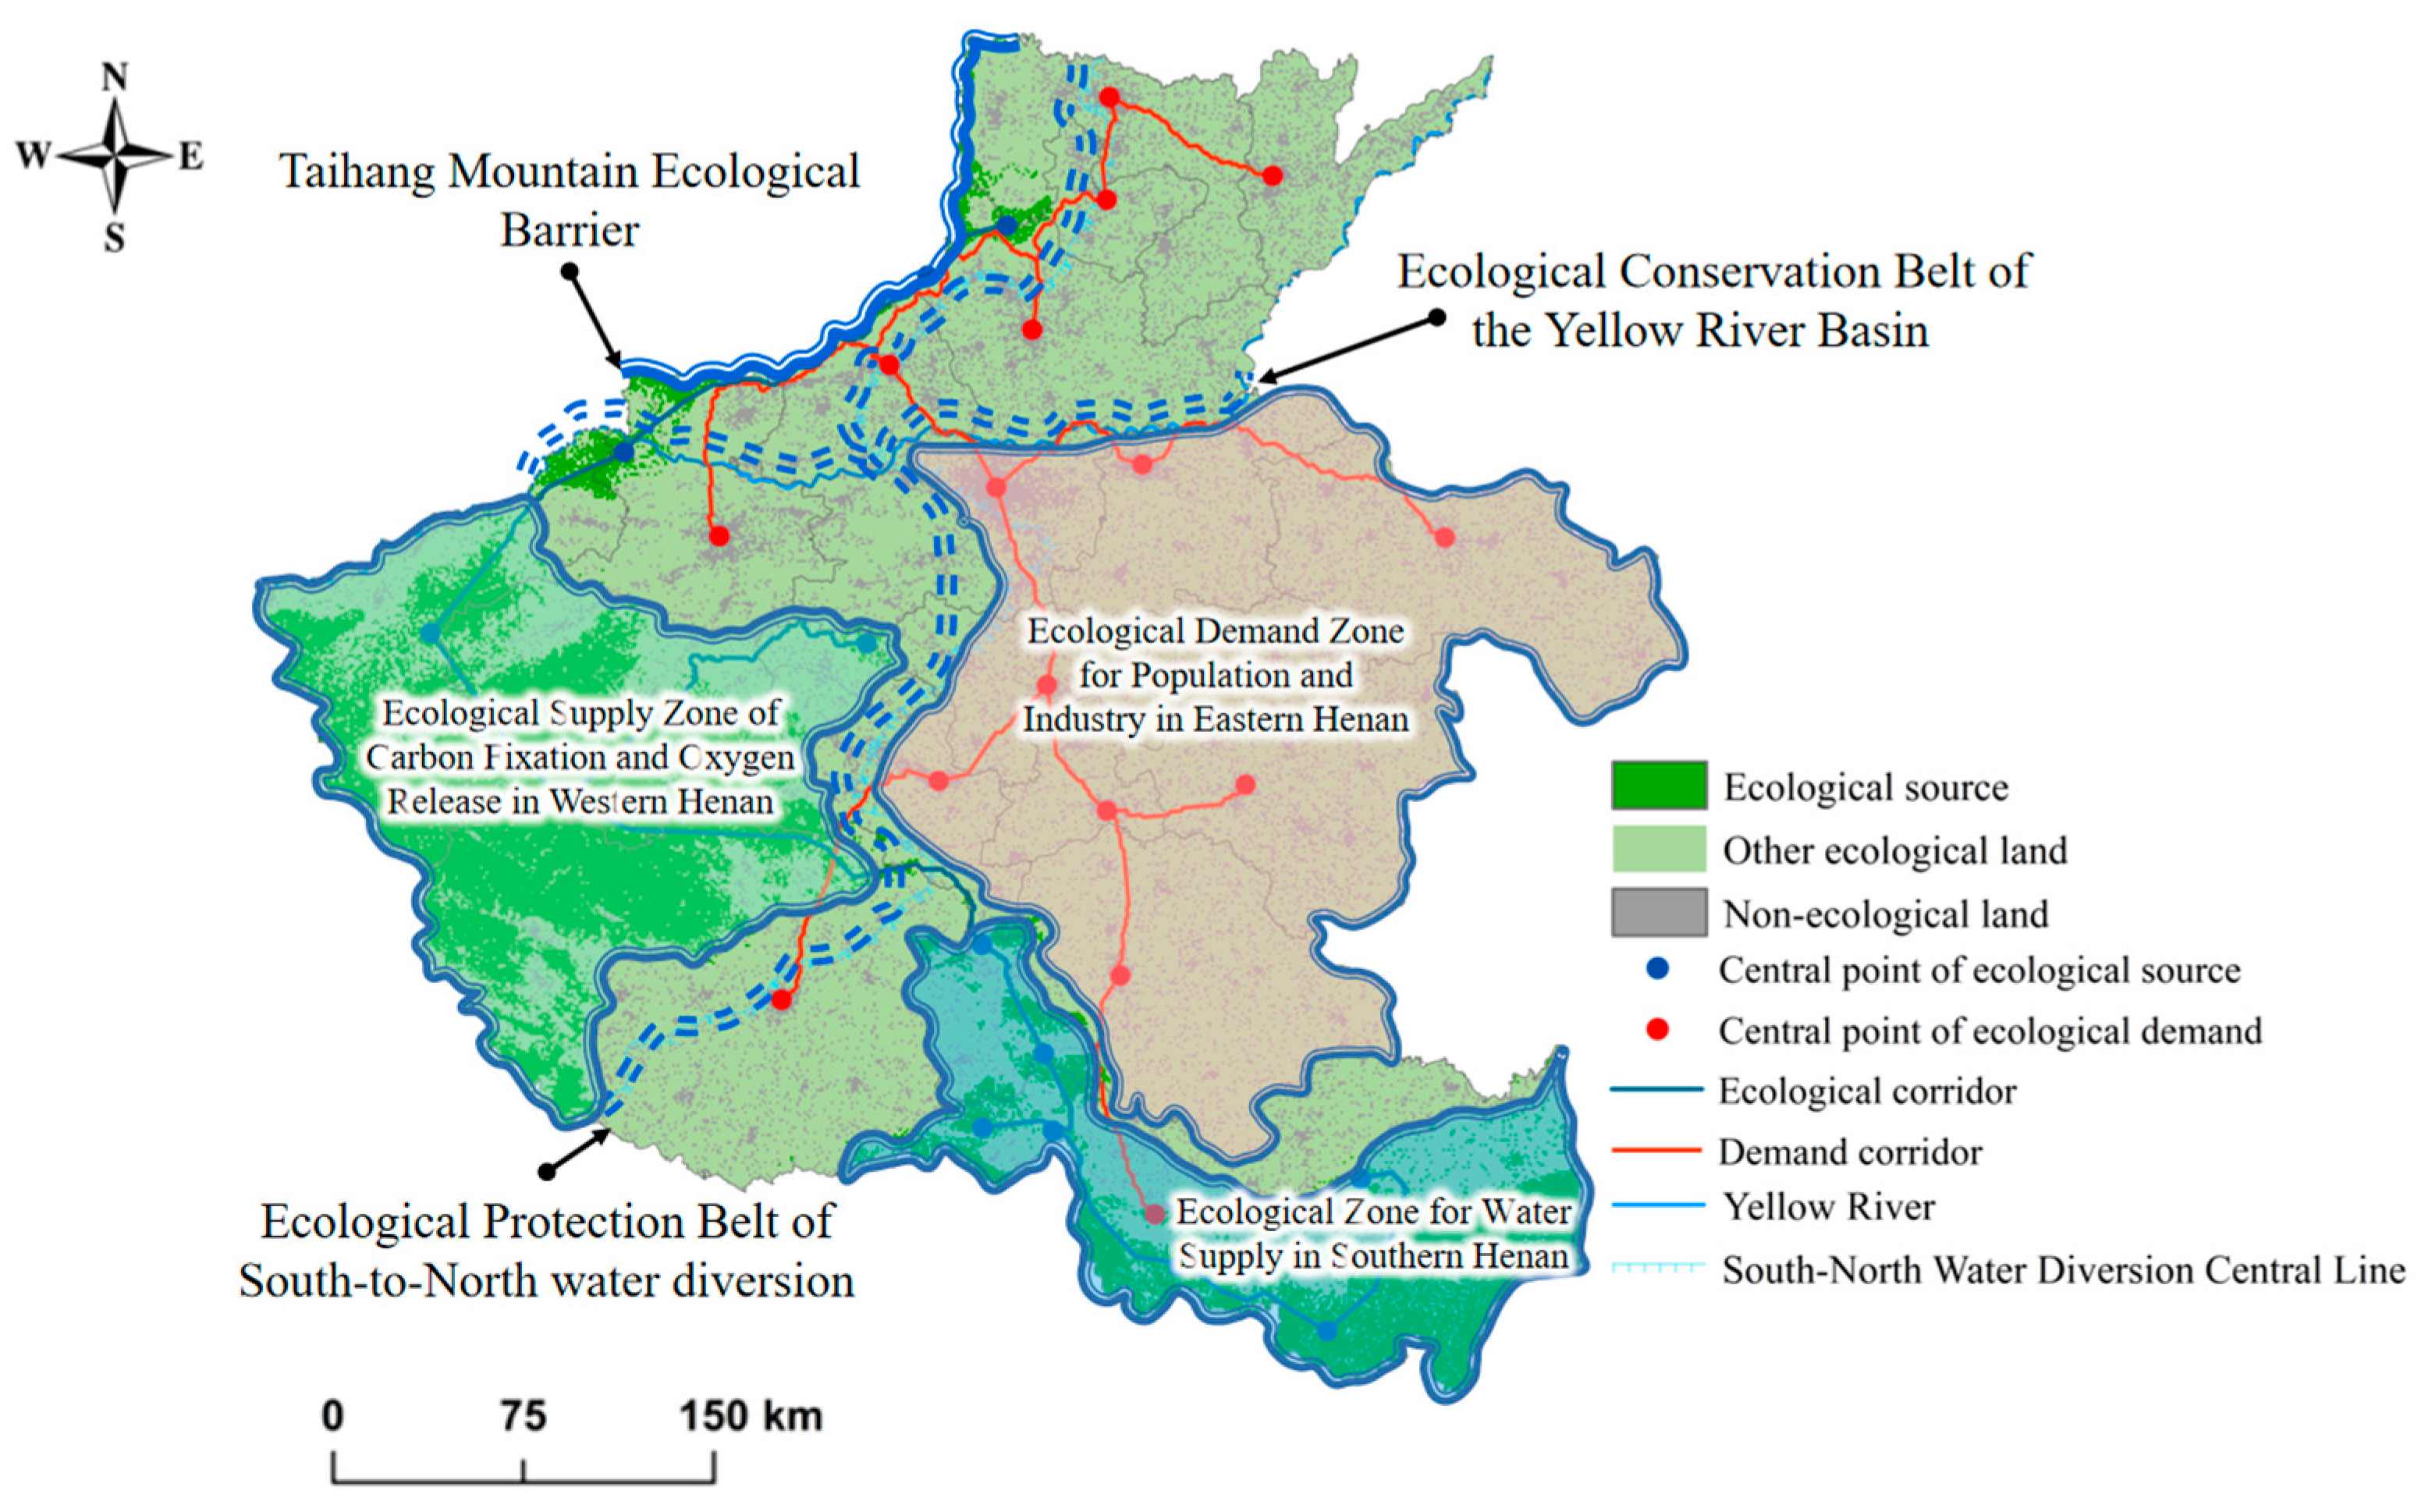
The ecological conservation belt of the Yellow River Basin: The Yellow River enters Henan Province in Lingbao City and flows through eight provincial cities including Sanmenxia, Jiyuan, Luoyang, Zhengzhou, Jiaozuo, Xinxiang, Kaifeng, and Puyang, primarily along the northern regions of Sanmenxia City and the northern regions of Kaifeng City, and flows into Shandong Province in the east of Taifeng County in Puyang City, as well as the northern regions of the Yiluo River Basin that flow into the Yellow River through Luoyang City and Gongyi City on the south side of the Yellow River. The region is an important ecological barrier in the North China Plain and a high-density development zone for the economy of Henan Province.
(2)
The ecological protection belt of the Central Route of the South–North Water Diversion Project has a large population and frequent human activities. This region has a high demand for ecosystem services and also functions as a boundary between Henan Province’s important ecological source areas and major demand areas. Measures to preserve the ecosystem should include reducing unreasonable economic activities, improving the existing “Regulations for the Protection of Drinking Water Sources in the South-to-North Water Transfer Project in Henan Province,” strengthening water conservation forest construction in drinking water source protection areas of the South-to-North Water Transfer Project, and coordinating soil and water loss control efforts.
The “three zones” are, respectively, the Ecological Supply Zone for Carbon Sequestration and Oxygen Release in Western Henan, the Ecological Demand Zone for Population and Industry in Eastern Henan, and the Ecological Zone for Water Supply and Recharge in Southern Henan.
(1)
Ecological Supply Zone for Carbon Sequestration and Oxygen Release in Western Henan: This region is a clearly defined biodiversity and gene pool for various rare animals, with a total area of 25,838.5 km2 and a population of 14.6595 million. The area is mainly covered by large areas of forest, with a high forest coverage rate and abundant rare fauna and flora resources. It plays a very important role in maintaining biodiversity and is a typical high-supply, low-demand area in terms of ecosystem services. The region must prioritize the ecological environment and strengthen the protection of natural and public forests through prohibiting non-conservationist logging. The region should promote afforestation, focusing particularly on creating forests that conserve soil and water. It should also promote vegetation recovery and reconstruction while enhancing the protection of wild animals and plants through outlawing overhunting and overharvesting. Efforts should be made to maintain and restore a balance in wild animal and plant species and populations and to create a benign cycle and sustainable utilization of wild animal and plant resources.
(2)
Ecological Demand Zone for Population and Industry in Eastern Henan: This region covers a total area of approximately 40,981 km2 and is characterized by a high population density, accounting for about 40.44% of the total population in the study area. The proportion of cultivated land is the largest, followed by construction land, and the demand for ecosystem services is mainly high. In terms of the supply of ecosystem services, only a small amount is provided in the Laoshan District of Zhumadian. The region should strengthen farmland protection through strict control of development intensity, enhanced treatment of nonpoint source pollution, the establishment of a national core area for grain production, improved agricultural production capacity, and the vigorous development of modern agriculture. The region should also develop characteristic industries that are based on local conditions to increase farmer income, ensure a reasonable layout, optimize development, promote intensification and agglomeration, and encourage industry to support agriculture and cities to lead the rural areas. Accelerate new countryside construction through guiding the gradual and orderly transfer of rural populations. On the basis of existing urban layouts, further intensify and concentrate development, with a particular focus on planning and building central towns with strong carrying capacities for resource and environmental sustainability and improving their comprehensive service capabilities.
(3)
Ecological Zone for Water Supply and Recharge in Southern Henan: This region covers an area of approximately 18,910 km2 and is mainly located in the Dabie Mountain ecological functional area and the important water supply recharge area of the middle and lower reaches of the Huai River. The region is characterized by a high degree of soil erosion and sensitivity and is currently facing degradation of mountain ecosystems and accelerated soil erosion, increasing the probability of floods in the middle and lower reaches of the river. Soil and water conservation efforts need to be strengthened, and forest water conservation capacity needs to be improved while protecting biodiversity. Measures should be taken to implement ecological migration, reduce population density, and restore vegetation. The soil and water conservation policy should adhere to the principle of “combining prevention and control with prioritizing protection”.
The “one barrier” refers to the Taihang Mountain Ecological Barrier.
(1)
Taihang Mountain Ecological Barrier: This area covers an area of approximately 766 km2. The Taihang Mountain Nature Reserve is mainly located in four counties and cities in the north of Henan Province, including Jiyuan, Qinyang, Xiuwu, and Huixian. The Taihang Mountain region is an important ecological security barrier for the North China Plain and even the central regions of China. The central route of the South-to-North Water Transfer Project runs through the region, which has 19 national-level protected areas. Through the restoration projects of mountains, rivers, forests, fields, lakes, and grasses, the damaged ecosystem has been greatly restored, and ecosystem service functions have been effectively improved. This has protected the living environment of rare animals and plants, significantly increased the value of regional ecological products, and continuously consolidated the Taihang Mountain Ecological Barrier. This has effectively ensured the ecological security, water security, and food security of the North China Plain.
During the construction of various functional zones, it is necessary to emphasize the main functions of each zone. We should also avoid the further expansion of the space mismatch between the supply and demand of ecosystem services during the process of economic and social development. At the same time, during the process of urbanization, attention should be paid to the “red line prohibition” zone to avoid the encroachment of ecological source areas and nature reserves. We need to increase the rational protection and development of supply and demand corridors to improve the mismatch between ecosystem service supply and demand in the research area and enhance the functional capacity of the watershed’s ecosystem services.

4. Discussion

4.1. Ecosystem Service Selection

In previous studies that constructed ecological security patterns or networks based on the perspective of ecosystem service supply and demand, ecological source identification has focused on services such as water supply, carbon sequestration, habitat quality, recreational services, and food supply [28,38,39]. In this study, we chose water conservation, carbon sequestration and oxygen release, and habitat quality based on the following considerations. First, the importance of these three services to human survival and development, climate change mitigation, and biodiversity maintenance has been demonstrated in many studies [40]. Second, cultivated land accounts for 45.35% of the total area in Henan Province, and the self-sufficiency rate of food production exceeds 150%. Therefore, analyzing the matching of supply and demand for food supply has little significance. In addition, there is currently no recognized evaluation index for soil and water conservation services [41]. Therefore, this service has not been included in source identification. In summary, different regions have different natural endowments, and using the same set of ecosystem services for source identification may weaken or even invalidate the ability of ecological security patterns to ensure ecological security. Therefore, it is necessary to choose ecosystem service types for source identification according to the local attributes of each region.

4.2. Scale of Ecological Security Pattern Construction

The construction of ecological security patterns has been carried out at various scales, such as the nation, geographical regions, urban agglomerations, provinces, cities, districts, and counties. However, the optimal construction scale has always been a hot topic. Some studies suggest that the ecological security pattern at the provincial level is the foundation and a component of the large-scale ecological environment governance and ecological security pattern construction [42]. Constructing ecological security patterns at this scale can improve the integrated management of the national classification, zonation, and grading joint governance system; the overall ecological environment governance of the regional ecosystem; and the protection and restoration of ecological environments in production and living spaces [43]. However, regardless of the scale used to construct security patterns, there is still the problem that small-scale regional managers cannot use the large-scale ecological security pattern. For example, the ecological environment endowment of some regions with poor or single-function ecosystems may not have ecological source areas or corridors across the entire region, and the large-scale ecological security patterns mentioned above cannot serve urban management in these areas. Therefore, the construction of ecological security patterns may not have an optimal scale, and they need to be constructed based on the regions managed by policymakers. Therefore, the construction of an ecological security pattern that matches supply and demand in Henan Province in this study is a supplement and improvement to the above research and can provide a theoretical basis for ecological policy formulation in Henan Province and other regions.

4.3. Policy Recommendations for Ecological Security Construction in Henan Province

(1)
Improving the ecological monitoring and evaluation system.
The relevant government departments need to preliminarily construct an integrated ecological monitoring network that encompasses the air, land, and water elements and operates in a coordinated manner across all levels. This network should generally cover typical ecosystems, natural reserves, key ecological functional zones, ecological protection redlines, and important water bodies throughout the province. Government departments need to conduct monitoring and evaluation work on the ecological status of priority areas, such as regional watersheds, ecological protection redlines, natural reserves, and county-level key ecological functional zones, to capture changes and trends in the province’s ecological status. Government departments need to explore using evaluation results as an important basis for the comprehensive assessment and evaluation of leadership cadres, financial transfer payments, and the provision of relevant policy incentives.
(2)
Advancing the regulation of ecological protection redlines.
Government departments need to promote the establishment of a regulatory system for the ecological protection redlines, accelerate the construction of a provincial-level ecological protection redline supervision platform, and achieve interconnection with the national supervision platform. They should conduct basic surveys of ecological protection redlines and remote sensing monitoring of human activities; promptly identify, transfer, and investigate all kinds of ecological damage; and supervise the protection and restoration of the ecological environment. Government departments should enhance the monitoring and early warning system of the area, as well as the functions, management, and implementation of ecological protection redlines.
(3)
Enhancing the quality and stability of the ecosystem.
Government departments need to continue to promote the protection and restoration of important ecosystems; the construction of major projects such as mountains, rivers, forests, farmland, lakes, grass, and sand; and the implementation of forest, river, lake, and grassland restoration and improvement to restore and enhance ecosystem service functions. Priority should be given to the right bank of the middle and lower reaches of the Yellow River, important headwaters of rivers, old revolutionary areas, and poverty alleviation areas to scientifically advance the comprehensive treatment of desertification, rock desertification, soil erosion, and the ecological restoration of historical mining areas. Clean small watershed construction should be implemented in areas with severe soil erosion, and comprehensive treatment of steep farmland, erosion gullies, and landslides should be strengthened. Green mining should be promoted, and the compilation and implementation of mining resource development and ecological restoration plans should be regulated. Mining companies should be supervised to fulfill their obligations of geological environmental protection and land reclamation. Strengthening the supervision and evaluation of ecological protection and restoration is also recommended.
(4)
Strengthening the protection of biodiversity.
Government departments need to develop a strategic plan and action plan for biodiversity conservation and improve the policy and institutional framework for biodiversity protection. They should accelerate the construction of a biodiversity protection network system, with the ecological protection redline as the main body, various levels and types of nature reserves as the support, the Yellow River and the South–North Water Diversion ecological protection belts as guidelines, and the Taihang Mountain and Funiu Mountain priority areas for biodiversity conservation as the focus. They should survey, monitor, and evaluate biodiversity. Biodiversity indicators should be included in the ecological quality monitoring, quality assessment, and performance evaluation system.

4.4. Findings and Prospects of the Research

Previous studies on constructing ecological security patterns have often focused on areas with high supply of ecosystem services or emphasized the protection of ecological source areas, but insufficient attention has been given to areas with high demand but poor ecological supply [44,45]. This study found that there is a serious mismatch between population, economic development, and ecological resources in Henan Province. The supply and demand of ecosystem services show a spatial pattern with high supply and low demand in the western cities of Luoyang and Sanmenxia and low supply and high demand in the central and western regions of Henan Province. This indicates that the overall energy and material flow within the research area are hindered to varying degrees, making it difficult to meet the high-efficiency requirements for the flow of ecosystem services within the area. It is necessary to identify natural and human factors as well as spatial flow paths that affect the spatial flow of ecosystem services in order to enhance their spatial transmission. Furthermore, it is important to avoid overutilization of services and actively develop alternative services while gradually adjusting the economic and industrial structure and population distribution to change the demand structure. For regions within the research area that have achieved a balance between supply and demand for ecosystem services, meeting the demand for ecosystem services within the carrying capacity of the ecosystem is the optimal state to achieve sustainable development and utilization of the ecosystem. Although the carrying capacity of the ecosystem has not been exceeded, if there is no surplus potential supply and the demand structure for the ecosystem changes, ecosystem services will be insufficient to support or may even restrict socio-economic development, posing a new threat to the ecological security pattern in Henan Province. In regional ecological planning, in addition to strengthening the protection of important ecological spaces such as the Funiu Mountain area, the Yellow River Basin wetlands, the Dabie Mountains, the South-to North Water Transfer Project, and the Southern Taihang Mountains, it is more important to alleviate the problem of ecological scarcity and gradually improve the current conflict between ecological space, living space, and production space. In the “ecology-economy-society” coupled system of the research area, there are interactive and complex mechanisms, which can ultimately be attributed to supply and demand relationships. Therefore, the essence of sustainable development in the research area is to meet the balance of supply and demand for ecosystem services and to construct ecological security patterns.
In this study, the evaluation of ecological supply space revealed a relatively high water conservation capacity on construction land. This may be due to lower rainfall infiltration of impermeable surfaces and larger peak flow rates. Further in-depth analysis is required for future research. During the identification of ecological sources in the study, the screening threshold was set to the top 25% of areas that met the selection criteria, ensuring an adequate number and size of supply sources. However, further validation is necessary to establish the scientific rigor and applicability of this threshold selection. Therefore, future research should investigate the impact of important threshold settings on the accuracy of ecological security pattern construction through conducting comparative experiments between different threshold settings at the source identification or corridor construction level. With the acquisition of high-precision geographic data, more detailed and in-depth research is expected to be conducted in the future. Additionally, research on ecological supply–demand evaluation based on internal material and energy flow in the study area will also be a focus of future research.

5. Conclusions

This study evaluates the spatial distribution pattern of ecosystem service supply and demand in Henan Province. It identifies important ecological source areas within the study area, extracts ecological corridors based on the MCR model, constructs an ecological security pattern, and proposes optimization measures. The research results show that:
(1)
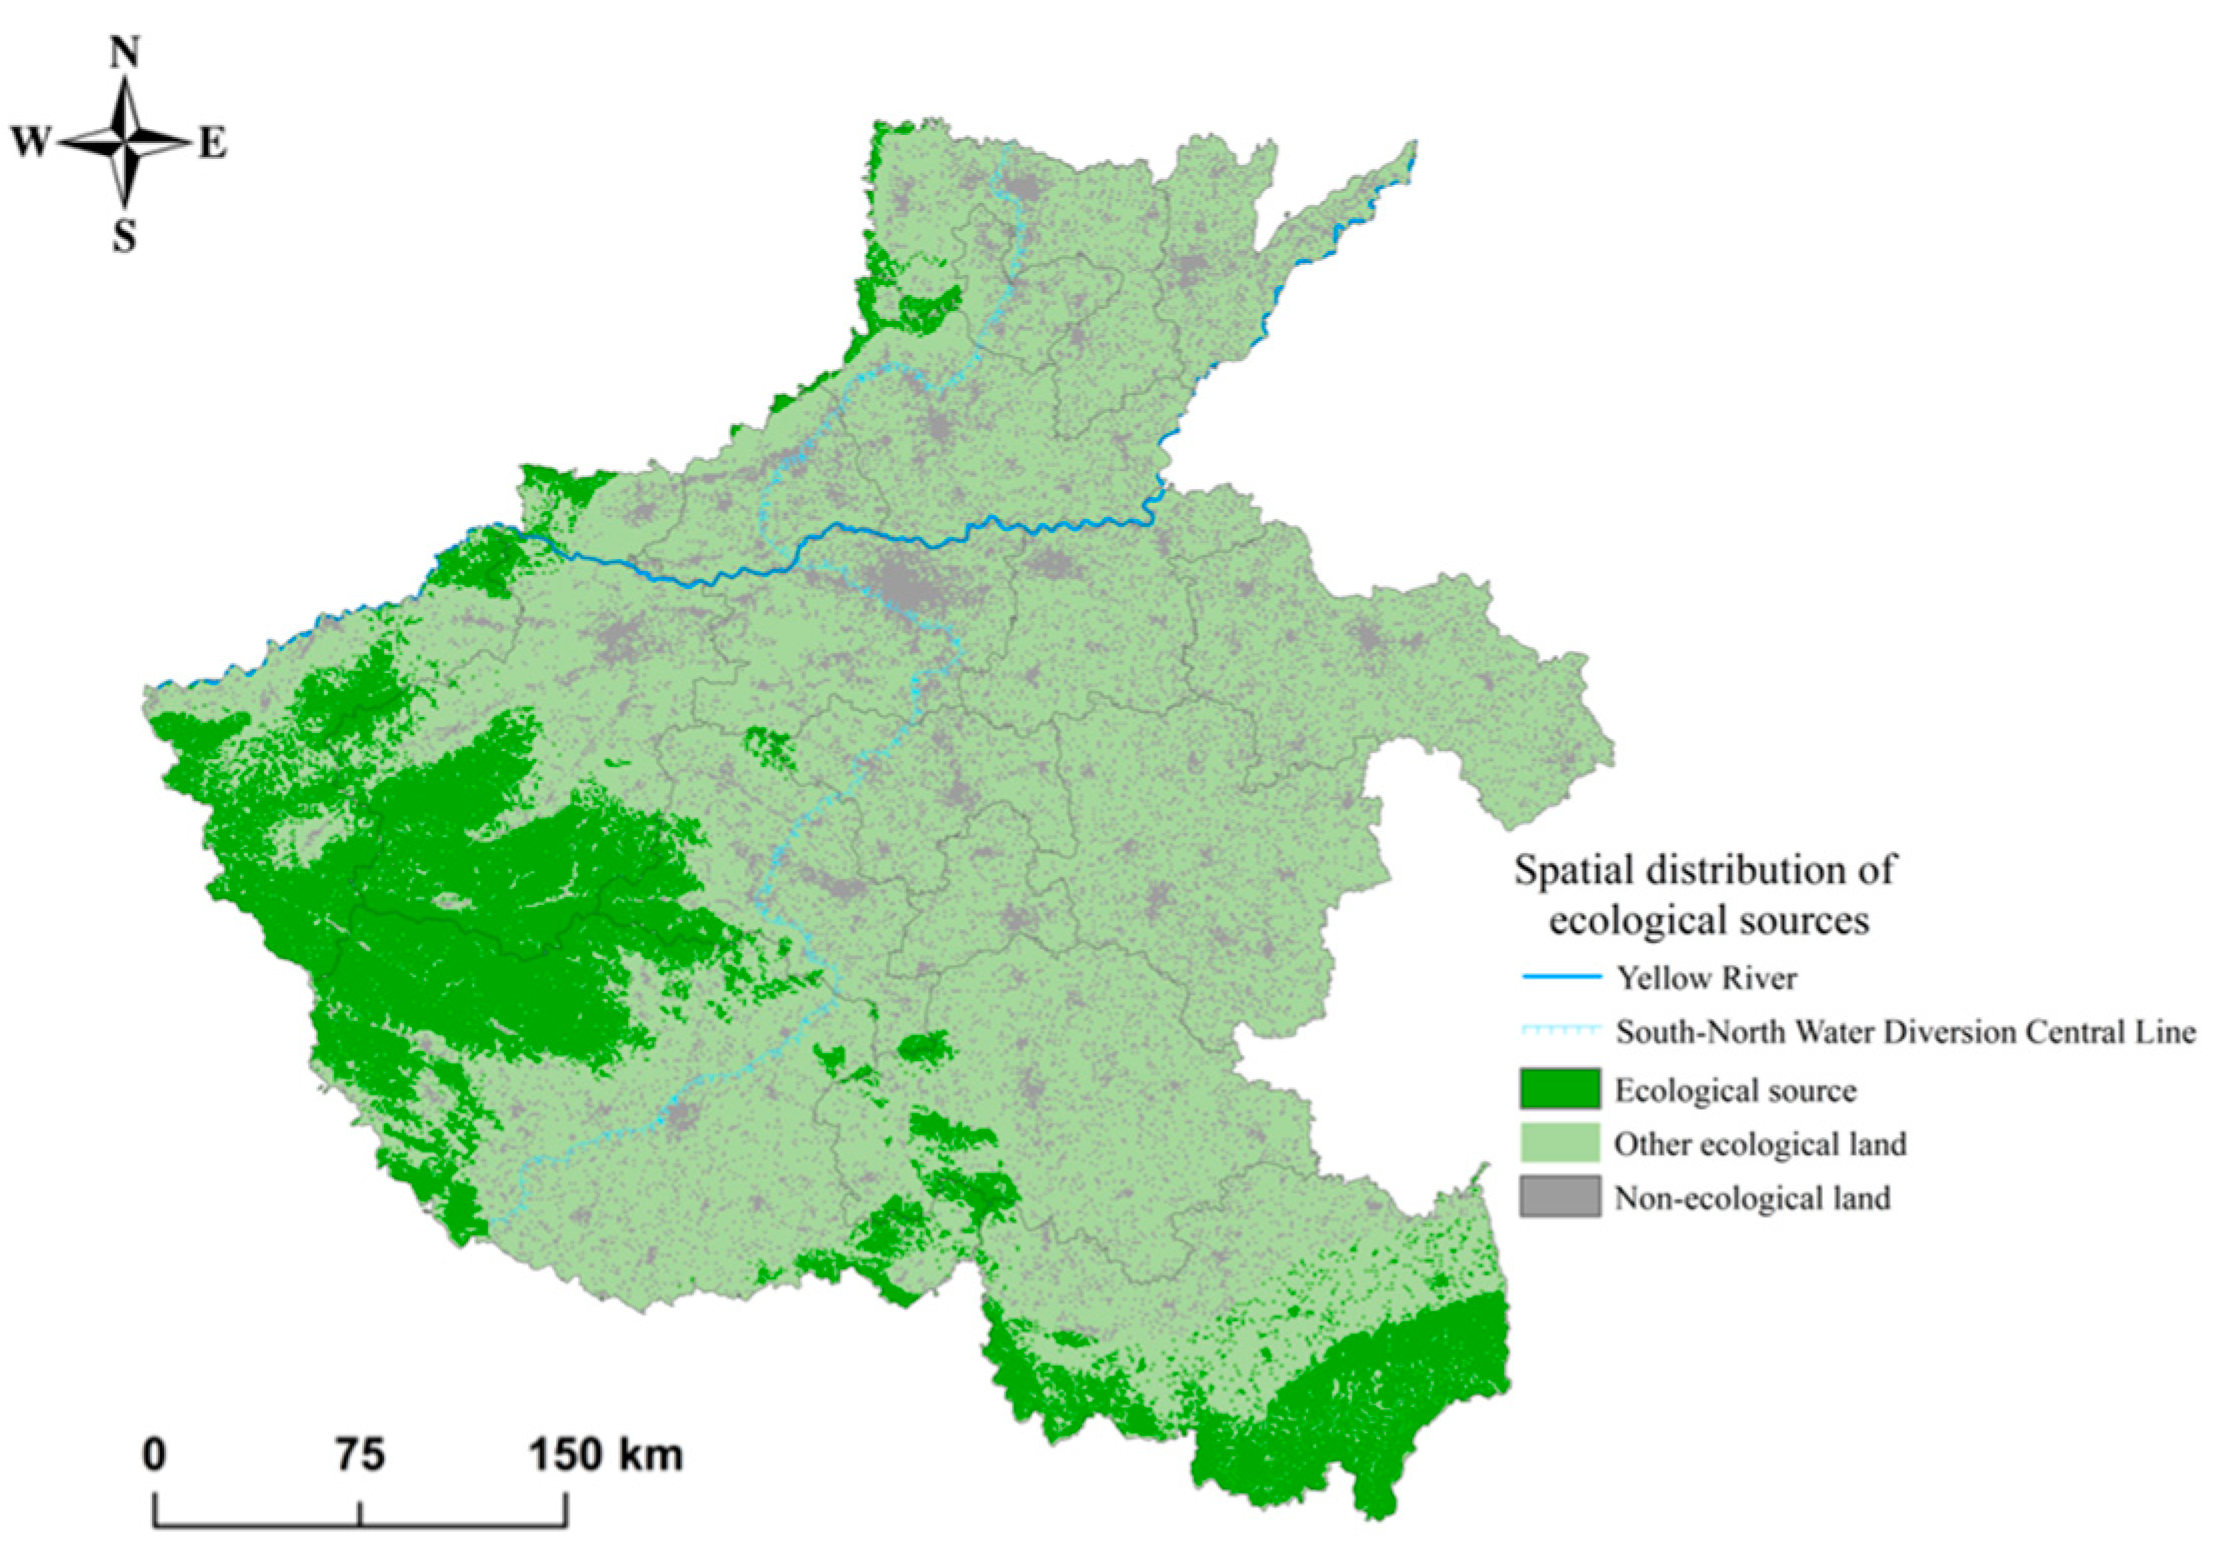
The total area of ecological source areas in Henan Province is 3.02 × 10⁴ km2, accounting for 18.12% of the total study area, and is mainly concentrated in the eastern mountainous areas and southern regions of Henan. Forests account for approximately 76.2% of ecological source areas.
(2)
The total area of high-demand areas for ecosystem services is 4.1 × 10⁴ km2, accounting for 24.73% of the total study area. These high-demand areas are mainly concentrated in the central and eastern regions of Henan where supply and demand for ecosystem services do not match well. The high-service areas and high-demand areas are obviously separated by the middle route of the South-to-North Water Transfer Project.
(3)
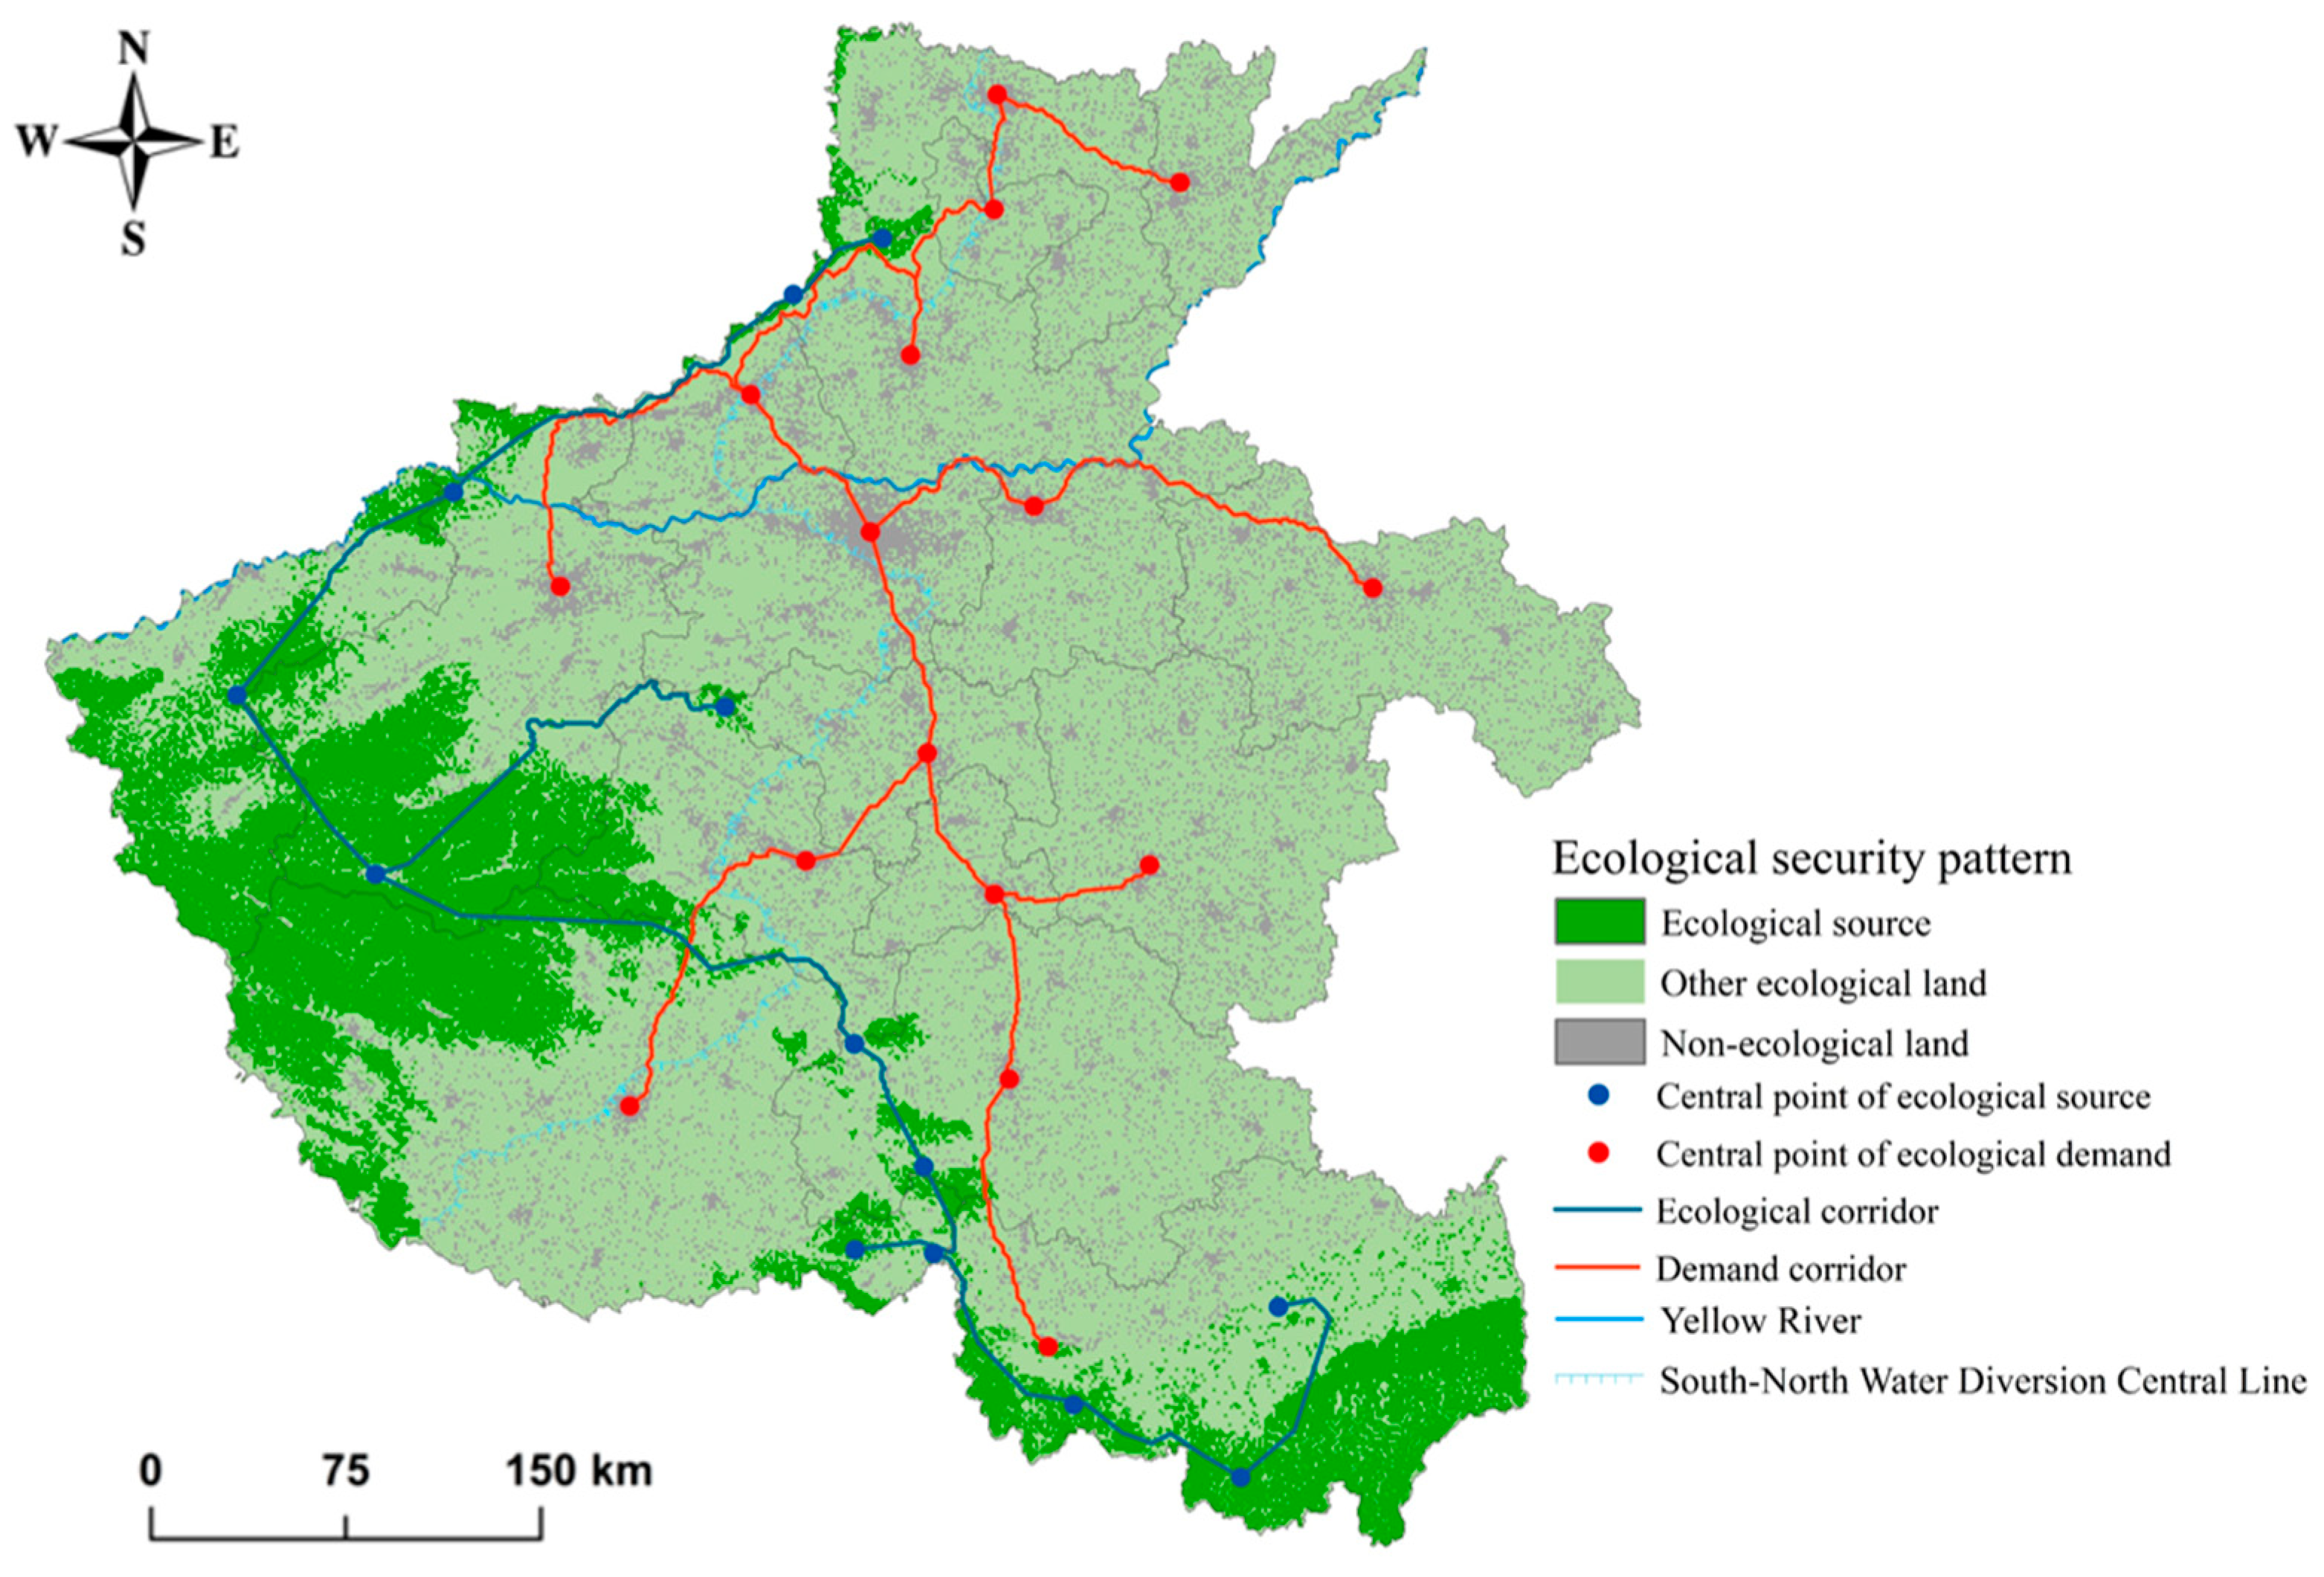
There are a total of 13 inter-source ecological corridors in Henan Province, with a total length of 1062.3 km. They form two main corridor axes, northeast-southwest and northwest-southeast. There are 15 ecological corridors for demand, with a total length of 1159 km. Based on the analysis of the ecosystem security pattern from the perspective of supply–demand matching in the study area, an optimization proposal of “two belts, three zones, and one barrier” is proposed for the ecosystem pattern.

Author Contributions

Conceptualization, L.L. and S.C.; methodology, S.C.; software, S.C.; validation, L.L. and S.C.; formal analysis, Z.J. and S.C.; investigation, S.C. and L.L.; resources, L.L.; data curation, X.L. and S.C.; writing—original draft preparation, S.C.; writing—review and editing, D.L. and Y.W.; visualization, S.C.; supervision, L.L.; project administration, L.L.; funding acquisition, L.L. All authors have read and agreed to the published version of the manuscript.

Funding

This research was funded by the National Natural Science Foundation of China, Systematic classification research on the reclamation of coal mining subsidence land soil. (grant number: 42077004).

Data Availability Statement

Not applicable.

Conflicts of Interest

The authors declare no conflict of interest.

References

  1. Song, L.; Zhang, L.; Yang, J.; Hou, G.; Wang, G. Influence of COVID-19 Epidemic on China’s Grain Industry. J. Agric. Sci. Technol. 2020, 22, 12–16. [Google Scholar] [CrossRef]
  2. Yao, P.; Fan, H.; Wu, Q.; Ouyang, J.; Li, K. Compound impact of COVID-19, economy and climate on the spatial distribution of global agriculture and food security. Sci. Total Environ. 2023, 880, 163105. [Google Scholar] [CrossRef] [PubMed]
  3. Karnik, H.; Peterson, H.H. Food security among low-income immigrant households and the role of social capital: A case study of Somali-American households in the Midwestern United States. Food Policy 2023, 117, 102456. [Google Scholar] [CrossRef]
  4. Su, F.; Liu, Y.; Chen, S.; Fahad, S. Towards the impact of economic policy uncertainty on food security: Introducing a comprehensive heterogeneous framework for assessment. J. Clean. Prod. 2023, 386, 135792. [Google Scholar] [CrossRef]
  5. Fei, L.; Shuang, M.; Xiaolin, L. Changing multi-scale spatiotemporal patterns in food security risk in China. J. Clean. Prod. 2023, 384, 135618. [Google Scholar] [CrossRef]
  6. Zhu, Y.; Wang, Z.; Luo, J.; Cui, J. Coupling and coordinated development of new urbanization and food security in main agricultural production regions in central China: A case study of Henan Province. Sci. Geogr. Sin. 2021, 41, 1947–1958. [Google Scholar] [CrossRef]
  7. Yu, Z.; Deng, X. Assessment of land degradation in the North China Plain driven by food security goals. Ecol. Eng. 2022, 183, 106766. [Google Scholar] [CrossRef]
  8. Liu, F.; Xiao, X.; Qin, Y.; Yan, H.; Huang, J.; Wu, X.; Zhang, Y.; Zou, Z.; Doughty, R.B. Large spatial variation and stagnation of cropland gross primary production increases the challenges of sustainable grain production and food security in China. Sci. Total Environ. 2022, 811, 151408. [Google Scholar] [CrossRef] [PubMed]
  9. Zeng, W.; Tang, H.; Liang, X.; Hu, Z.; Yang, Z.; Guan, Q. Using ecological security pattern to identify priority protected areas: A case study in the Wuhan Metropolitan Area, China. Ecol. Indic. 2023, 148, 110121. [Google Scholar] [CrossRef]
  10. Chen, D.; Guo, K.; Zeng, W.; Wang, F.; Li, L.; Jin, X. Study on the spatial–temporal patterns and evolution characteristics of ecological security based on dynamic evaluation in the Three Gorges Reservoir Area. Ecol. Indic. 2023, 151, 110297. [Google Scholar] [CrossRef]
  11. Nie, W.; Xu, B.; Yang, F.; Shi, Y.; Liu, B.; Wu, R.; Lin, W.; Pei, H.; Bao, Z. Simulating future land use by coupling ecological security patterns and multiple scenarios. Sci. Total Environ. 2023, 859, 160262. [Google Scholar] [CrossRef] [PubMed]
  12. Li, L.; Huang, X.; Wu, D.; Wang, Z.; Yang, H. Optimization of ecological security patterns considering both natural and social disturbances in China’s largest urban agglomeration. Ecol. Eng. 2022, 180, 106647. [Google Scholar] [CrossRef]
  13. Jia, Q.; Jiao, L.; Lian, X.; Wang, W. Linking supply-demand balance of ecosystem services to identify ecological security patterns in urban agglomerations. Sustain. Cities Soc. 2023, 92, 104497. [Google Scholar] [CrossRef]
  14. Wei, L.; Zhou, L.; Sun, D.; Yuan, B.; Hu, F. Evaluating the impact of urban expansion on the habitat quality and constructing ecological security patterns: A case study of Jiziwan in the Yellow River Basin, China. Ecol. Indic. 2022, 145, 109544. [Google Scholar] [CrossRef]
  15. Li, L.; Huang, X.; Wu, D.; Yang, H. Construction of ecological security pattern adapting to future land use change in Pearl River Delta, China. Appl. Geogr. 2023, 154, 102946. [Google Scholar] [CrossRef]
  16. Li, C.; Wu, Y.; Gao, B.; Zheng, K.; Wu, Y.; Wang, M. Construction of ecological security pattern of national ecological barriers for ecosystem health maintenance. Ecol. Indic. 2023, 146, 109801. [Google Scholar] [CrossRef]
  17. Pan, N.; Du, Q.; Guan, Q.; Tan, Z.; Sun, Y.; Wang, Q. Ecological security assessment and pattern construction in arid and semi-arid areas: A case study of the Hexi Region, NW China. Ecol. Indic. 2022, 138, 108797. [Google Scholar] [CrossRef]
  18. Zhai, T.; Wang, J.; Jin, Z.; Qi, Y.; Fang, Y.; Liu, J. Did improvements of ecosystem services supply-demand imbalance change environmental spatial injustices? Ecol. Indic. 2020, 111, 106068. [Google Scholar] [CrossRef]
  19. Wu, X.; Liu, S.; Zhao, S.; Hou, X.; Xu, J.; Dong, S.; Liu, G. Quantification and driving force analysis of ecosystem services supply, demand and balance in China. Sci. Total Environ. 2019, 652, 1375–1386. [Google Scholar] [CrossRef]
  20. Xu, Q.; Yang, R.; Zhuang, D.; Lu, Z. Spatial gradient differences of ecosystem services supply and demand in the Pearl River Delta region. J. Clean. Prod. 2021, 279, 123849. [Google Scholar] [CrossRef]
  21. Wei, W.; Nan, S.; Xie, B.; Liu, C.; Zhou, J.; Liu, C. The spatial-temporal changes of supply-demand of ecosystem services and ecological compensation: A case study of Hexi Corridor, Northwest China. Ecol. Eng. 2023, 187, 106861. [Google Scholar] [CrossRef]
  22. Ala-Hulkko, T.; Kotavaara, O.; Alahuhta, J.; Hjort, J. Mapping supply and demand of a provisioning ecosystem service across Europe. Ecol. Indic. 2019, 103, 520–529. [Google Scholar] [CrossRef]
  23. Liu, L.; Liu, C.; Wang, C.; Li, P. Supply and demand matching of ecosystem services in loess hilly region: A case study of Lanzhou. Acta Geogr. Sin. 2019, 74, 1921–1937. [Google Scholar]
  24. Talukdar, S.; Singha, P.; Shahfahad; Mahato, S.; Praveen, B.; Rahman, A. Dynamics of ecosystem services (ESs) in response to land use land cover (LU/LC) changes in the lower Gangetic plain of India. Ecol. Indic. 2020, 112, 106121. [Google Scholar] [CrossRef]
  25. Meng, S.; Huang, Q.; Zhang, L.; He, C.; Inostroza, L.; Bai, Y.; Yin, D. Matches and mismatches between the supply of and demand for cultural ecosystem services in rapidly urbanizing watersheds: A case study in the Guanting Reservoir basin, China. Ecosyst. Serv. 2020, 45, 101156. [Google Scholar] [CrossRef]
  26. Zhao, X.; Ma, P.; Li, W.; Du, Y. Spatiotemporal changes of supply and demand relationships of ecosystem services in the Loess Plateau. Acta Ecol. Sin. 2021, 76, 2780–2796. [Google Scholar]
  27. Vrebos, D.; Staes, J.; Vandenbroucke, T.; Haeyer, T.D.; Johnston, R.; Muhumuza, M.; Kasabeke, C.; Meire, P. Mapping ecosystem service flows with land cover scoring maps for data-scarce regions. Ecosyst. Serv. 2015, 13, 28–40. [Google Scholar] [CrossRef]
  28. Zhang, D.; Qu, L.; Zhang, J. Ecological security pattern construction method based on the perspective of ecological supply and demand: A case study of Yangtze River Delta. Acta Ecol. Sin. 2019, 39, 7525–7537. [Google Scholar]
  29. Xie, G.; Zhang, C.; Zhang, L.; Chen, W.; Li, S. Improvement of the Evaluation Method for Ecosystem Service Value Based on Per Unit Area. J. Nat. Resour. 2015, 30, 1243–1254. [Google Scholar]
  30. Wu, P.; Lin, H.; Tian, L. Construction of ecological security pattern based on: A case study in Xiongan New Area, Hebei Province, China. J. Saf. Sci. Technol. 2018, 14, 5–11. [Google Scholar]
  31. Dai, Y.; Li, J.; Yang, J. Spatiotemporal responses of habitat quality to urban sprawl in the Changsha metropolitan area. Prog. Geogr. 2018, 37, 1340–1351. [Google Scholar]
  32. Pan, J.; Li, Z. Analysis on trade-offs and synergies of ecosystem services in arid inland river basin. Trans. Chin. Soc. Agric. Eng. 2017, 33, 280–289. [Google Scholar]
  33. Zheng, Y.; Han, J.; Huang, Y.; Fassnacht, S.R.; Shuai, X.; Lv, E.; Min, C. Vegetation response to climate conditions based on NDVI simulations using stepwise cluster analysis for the Three-River Headwaters region of China. Ecol. Indic. 2017, 92, 18–29. [Google Scholar] [CrossRef]
  34. Villamagna, A.M.; Angermeier, P.L.; Bennett, E.M. Capacity, pressure, demand, and flow: A conceptual framework for analyzing ecosystem service provision and delivery. Ecol. Complex. 2013, 15, 114–121. [Google Scholar] [CrossRef]
  35. Peng, J.; Li, H.; LIiu, Y.; Hu, Y.; Yang, Y. Identification and optimization of ecological security pattern in Xiong’an New Area. Acta Geogr. Sin. 2018, 73, 701–710. [Google Scholar]
  36. Peng, J.; Guo, X.; Hu, Y.; Liu, Y. Constructing ecological security patterns in mountain areas based on geological disaster sensitivity: A case study in Yuxi City, Yunnan Province, China. Chin. J. Appl. Ecol. 2017, 28, 627–635. [Google Scholar] [CrossRef]
  37. Knaapen, J.P.; Scheffer, M.; Harms, B. Estimating habitat isolation in landscape planning. Landsc. Urban Plan. 1992, 23, 1–16. [Google Scholar] [CrossRef]
  38. Hu, Q.; Chen, S. Optimizing the ecological networks based on the supply and demand of ecosystem services in Xiamen-Zhangzhou-Quanzhou region. J. Nat. Resour. 2021, 36, 342–355. [Google Scholar] [CrossRef]
  39. Rong, Y.; Yan, Y.; Wang, C.; Zhang, W.; Zhu, J.; Lu, H.; Zheng, T. Construction and optimization of ecological network in Xiong’an New Area based on the supply and demand of ecosystem services. Acta Ecol. Sin. 2020, 40, 7197–7206. [Google Scholar]
  40. Lv, C.M.; Liao, H.L.; Ling, M.H.; Wu, Z.N.; Yan, D.H. Assessment of eco-economic effects of urban water system connectivity project. Environ. Sci. Pollut. R. 2022, 29, 53353–53363. [Google Scholar] [CrossRef]
  41. Zhao, W.; Liu, Y.; Daryanto, S.; Fu, B.; Wang, S.; Liu, Y. Metacoupling supply and demand for soil conservation service. Curr. Opin. Env. Sust. 2018, 33, 136–141. [Google Scholar] [CrossRef]
  42. Yu, G.; Yang, M.; Chen, Z.; Zhang, L. Technical approach and strategic plan for large-scale ecological and environmental governance and national ecological security pattern construction. Chin. J. Appl. Ecol. 2021, 32, 1141–1153. [Google Scholar] [CrossRef]
  43. Peng, J.; Zhao, H.; Liu, Y.; Wu, J. Research progress and prospect on regional ecological security pattern construction. Geogr. Res. 2017, 36, 407–419. [Google Scholar]
  44. Ma, L.; Liu, H.; Peng, J.; Wu, J. A review of ecosystem services supply and demand. Acta Geogr. Sin. 2017, 72, 1277–1289. [Google Scholar]
  45. Jing, Y.; Chen, L.; Sun, R. A theoretical research framework for ecological security pattern construction based on ecosystem services supply and demand. Acta Ecol. Sin. 2018, 38, 4121–4131. [Google Scholar]
Figure 1. The location (a), altitude (c), and land use types (b) of Henan Province.
Land 12 01307 g001
Figure 2. The study framework and technical methodology.
Land 12 01307 g002
Figure 3. Spatial distribution of water supply capacity (a), carbon fixation and oxygen release (b), and habitat quality (c) in Henan Province.
Land 12 01307 g003
Figure 4. Spatial distribution of GDP per land (a), population density (b), land use degree (c), and ecological demand (d) in Henan Province.
Land 12 01307 g004
Figure 5. The spatial distribution of ecological sources in Henan Province.
Land 12 01307 g005
Figure 6. Night light value (a) and corrected ecological resistance coefficient (b) in Henan Province.
Land 12 01307 g006
Figure 7. The distribution of the ecological security pattern in Henan Province.
Land 12 01307 g007
Figure 8. Ecological security pattern zoning in Henan Province.
Land 12 01307 g008
Table 1. Data sources and spatial scales.
Data TypeData SourcesSpatial Scale
Land use dataThe 30 m annual land cover datasets and its dynamics in China from 1990 to 2020 (https://zenodo.org/record/5210928#.YcZ_nWBByUk, accessed on 5 November 2022.)30 m
Digital Elevation Model (DEM)Geospatial Data Cloud (http://www.gscloud.cn/ accessed on 15 January 2023.)30 m
Normalized Vegetation Index (NDVI)MODIS Data Products:MOD13Q1, NASA (https://ladsweb.modaps.eosdis.nasa.gov/ accessed on 5 February 2023.)250 m
Net primary productivity (NPP)MODIS Data Products:MOD17A3HGF Version 6.0 (https://lpdaac.usgs.gov/ accessed on 10 February 2023.)1 km
Evapotranspiration dataMeteorological Data Sharing Network (http://data.cma.cn/ accessed on10 February 2023.)500 m
Night light dataNOAA Nightlight Data Center (https://ngdc.noaa.gov/eog/download.html, accessed on 15 February 2023.)500 m
Population densityResources and Environment Science and Data Center (http://www.resdc.cn/data.aspx, accessed on 17 February 2023.)1 km
GDP per landResources and Environment Science and Data Center (http://www.resdc.cn/data.aspx, accessed on 17 February 2023.)1 km
Table 2. Habitat quality assessment parameters.
Threat SourceWeightsSensitivityMaximum Influence Distance/km
FarmlandWoodlandGrasslandWater
Highway10.50.550.20.556
Railway0.90.80.650.30.653
Construction10.510.750.98
Night lights10.750.750.50.810
Table 3. Ecological resistance coefficients of study area.
Land Use TypeResistance ValueLand Use TypeResistance Value
Cropland100Water body100
Forest land1Barren300
Shrub10Impervious500
Grassland10
Disclaimer/Publisher’s Note: The statements, opinions and data contained in all publications are solely those of the individual author(s) and contributor(s) and not of MDPI and/or the editor(s). MDPI and/or the editor(s) disclaim responsibility for any injury to people or property resulting from any ideas, methods, instructions or products referred to in the content.

