Article

Estimation and Climate Impact Analysis of Terrestrial Vegetation Net Primary Productivity in China from 2001 to 2020

1
School of Remote Sensing and Information Engineering, Wuhan University, Wuhan 430079, China
2
School of Resource and Environmental Sciences, Wuhan University, Wuhan 430079, China
*
Author to whom correspondence should be addressed.
Land 2023, 12(6), 1223; https://doi.org/10.3390/land12061223
Submission received: 15 April 2023 / Revised: 28 May 2023 / Accepted: 10 June 2023 / Published: 12 June 2023
(This article belongs to the Special Issue Celebrating the 130th Anniversary of Wuhan University on Land Science)

Abstract

:
The net primary productivity (NPP) of vegetation is an important indicator reflecting the vegetation dynamics and carbon sequestration capacity in a region. In recent years, China has implemented policies to carry out ecological protection. To understand the changes in the distribution of vegetation NPP in China and the influence of climate factors, the Carnegie–Ames–Stanford approach (CASA) model was used to estimate the NPP from 2001 to 2020. In this paper, several sets of measurement datasets and products were collected to evaluate the effectiveness of the model and suggestions were provided for the modification of the CASA model based on the evaluation results. In addition to the correlation analysis, this paper presents a statistical method for analyzing the quantitative effects in individual climatic factors on NPP changes in large regions. The comparison found that the model has a better estimation effect on grassland and needleleaf forest. The estimation error for the evergreen needleleaf forest (ENF) and deciduous broadleaf forest (DBF) decreases with the warming of the climatic zone, while the evergreen broadleaf forest (EBF) and deciduous needleleaf forest (DNF) do the opposite. The changes in total CASA NPP were consistent with the trends of other products, showing a dynamic increasing trend. In terms of the degree of correlation between the NPP changes and climatic factors, the NPP changes were significantly correlated with temperature in about 10.39% of the vegetation cover area and with precipitation in about 26.92% of the vegetation cover area. It was found that the NPP variation had a negative response to the temperature variation in Inner Mongolia grasslands, while it had a positive but small effect (±10 g C) in the Qinghai–Tibet Plateau grasslands. Precipitation had a facilitative effect on the grassland NPP variation, while an increase in the annual precipitation of more than 200 mm had an inhibitory effect in arid and semi-arid regions. This study can provide data and methodological reference for the ecological assessment of large-scale regional and climate anomalous environments.

1. Introduction

In recent decades, the long-term buildup of carbon dioxide and other greenhouse gases in the atmosphere has caused global warming [1]. To address global warming and maintain the natural environment, scientists and policymakers have become interested in understanding and evaluating the capacity of ecosystems to absorb, sequester, and re-release carbon [2]. In ecosystems, terrestrial vegetation is an important input to the carbon sink and assumes an important role in assessing the ecosystem health. Net primary productivity (NPP), which represents the net accumulation of carbon per unit time and area of the plant after absorption of CO2 from the atmosphere by photosynthesis and release of CO2 by autotrophic respiration [3], is an important evaluation indicator in the carbon cycle of the ecosphere and global environment [4]. Regional estimates of the terrestrial vegetation NPP are not only important parameters for describing the physiological and ecological status of vegetation, but also important indicators for monitoring the dynamics of carbon cycling in the region and its contribution to global carbon sequestration capacity [5,6,7], so the accurate estimation of regional vegetation NPP and effective analysis are greatly significant for regional ecosystem management and policy formulation [8].
Based on the current technical means, NPP can be obtained by measuring vegetation in the field, but this method is difficult to achieve for large-scale estimation, and the estimates and analysis are seriously inhibited by the lack of adequate observational data [9]. In recent decades, remote sensing monitoring technology has developed rapidly, and various models constructed based on satellite data and actual measurement data have been widely used in terrestrial vegetation NPP studies [10]. Monteith [11] considered the effects of environmental stressors such as nutrients, water, and temperature on vegetation photosynthesis and proposed the concept of using photosynthetically active radiation (PAR) absorbed by vegetation and vegetation light-use efficiency (LUE) to evaluate terrestrial NPP for the first time. C. S. Potter [12] proposed the first light-use efficiency model named the Carnegie–Ames–Stanford approach (CASA) for estimating global vegetation productivity. Prince and Goward [13] modeled the processes of autotrophic respiration and photosynthesis in plants and proposed the GLO-PEM model. Yuan [14] proposed the Eddy Covariance–LUE model (EC-LUE) based on the eddy flux observation technique. Since the input data can be obtained by remote sensing, which enables large-scale regional and global estimation, the CASA model has been broadly applied, and has been improved and optimized in the process of application. In recent years, the CASA model has been applied to the estimation of different vegetation, such as grassland [15,16], cropland [17,18], and various types of forests [4,19]. In terms of research regions, in China, for example, experiments on NPP estimation have been conducted in local research units, such as the Qinghai–Tibet plateau [20], central China [21], provincial units [22,23,24], and so on. The effectiveness of the model for the NPP estimation of different vegetation at the national scale, and the effect of NPP estimation of the same vegetation type in different regions, still need to be compared and evaluated, thus providing a reference for model selection by subsequent researchers.
To improve the ecological situation, the Chinese government adopted the ecological protection policy represented by the return of farmland to forests in 2000. In 2020, the “dual carbon target” (carbon peak and carbon neutral target) was proposed, which shows the necessity of the Chinese government’s work on carbon emission research. In the above context, it is necessary to obtain the trend of terrestrial vegetation NPP in China from 2001 to 2020. The study of the total amount and distribution as well as the trend of changes in NPP of terrestrial vegetation in China will be an effective analysis of the effect of policy implementation. On the other hand, changes in vegetation NPP are directly related to climatic factors, and the analysis of climate effects on changes in NPP is important for forestry management and NPP prediction. The current research rarely discusses the effects of regional climate change on NPP, such as how it changes under different degrees of temperature growth. To more clearly clarify the dynamic effects of major climatic factors such as precipitation and temperature on NPP, we should not only analyze the correlation between climate and NPP [25,26] but also quantify the association between vegetation NPP changes and the magnitude of climate change in areas with different climate types. We obtained NPP estimates for a long time series in this study to support the analysis of the NPP response to climate.
Here we estimated the terrestrial regional land NPP of China from 2001 to 2020 by using remote sensing monitoring data from multiple sources and the CASA model. The specific objectives and problems addressed in this study were to (1) analyze the results of the CASA model for estimating NPP in different regions and types of vegetation; (2) to analyze the spatiotemporal distribution and trends of terrestrial NPP in China over 20 years; and (3) qualitatively analyze the response of vegetation NPP to various types of climatic factors and quantitatively analyze the response of grassland NPP to different levels of variation in temperature and precipitation.

2. Materials and Methods

2.1. The CASA Model

The CASA model was used to generate NPP gridded data with a spatial resolution of 500 m × 500 m over China for each month from 2001 to 2020 and synthesized annual data for each year. The inputs to the model included the Normalized Difference Vegetation Index (NDVI) and climate drivers as well as annual vegetation type data.
In this model, the monthly NPP (gram carbon per square meter per month, gC·m−2·month−1) is obtained by calculating the amount of PAR (APAR, megajoule per square meter per month, MJ·m–2·month–1) and LUE (ε, gC·MJ−1) in Equation (1):
NPP ( x , t ) = APAR ( x , t ) × ε ( x , t )
where x represents a given location of one grid and t represents the month. APAR ( x , t ) and ε ( x , t ) can be estimated by Equations (2) and (7), separately.
APAR ( x , t ) = 0.5 × FPAR ( x , t ) × SOL ( x , t )
where 0.5 is the proportion of PAR to total solar radiation (SOL, MJ·m–2·month–1) [27], and FPAR is the proportion of PAR absorbed by the vegetation. According to the existing studies, FPAR has a linear relationship with both the NDVI and simple ratio (SR) within a certain range, so FPAR can be calculated from the NDVI and SR [28], which were defined by Equations (3)–(6):
SR ( x , t ) = 1 + NDVI ( x , t ) 1 NDVI ( x , t )
FPAR NDVI ( x , t ) = ( NDVI ( x , t ) NDVI i , min ) × ( FPAR max FPAR min ) NDVI i , max NDVI i , min + FPAR min
FPAR SR ( x , t ) = ( SR ( x , t ) SR i , min ) × ( FPAR max FPAR min ) SR i , max SR i , min + FPAR min
FPAR ( x , t ) = FPAR NDVI ( x , t ) + FPAR SR ( x , t ) 2
FPARNDVI and FPARSR are estimated from NDVI and SR, respectively. NDVIi,max, NDVIi,min, SRi,max, and SRi,max represent the maximum value and minimum value of the NDVI and SR for vegetation type i, respectively, which can be looked up from Table 1 [29]. The values of FPAR max and FPAR min are independent of the vegetation type and are 0.95 and 0.001, respectively [29]. The actual LUE (ε) is mainly constrained by temperature and soil moisture, so in the model it can be estimated from one soil water stress factor, two temperature stress factors, and the maximum ε of vegetation as Equation (7) [12,28]:
ε ( x , t ) = W ε ( x , t ) × T ε 1 ( x , t ) × T ε 2 ( x , t ) × ε i , max
T ξ l ( x , t ) = 0.8 + 0.02 × T opt ( x ) 0.0005 × [ T opt ( x ) ] 2
T ξ 2 ( x , t ) = 1.184 / { 1 + exp [ 0.2 × ( T opt ( x ) 10 T ( x , t ) ) ] } / { 1 + exp [ 0.3 × { T opt ( x ) 10 + T ( x , t ) ) ] }
W ε ( x , t ) is the soil water stress factor [21,30]. T ε 1 ( x , t ) and T ε 2 ( x , t ) are two temperature stress factors under two different situations. ε i , max was set from 0.389 to 0.985 gC·MJ−1 for different vegetation types [29] and listed in Table 1. All three stress factors combine to constrain the LUE of plants.
T ε 1 ( x , t ) is the stress factor for the maximum LUE by plants at the optimum temperature, T ε 2 ( x , t ) is the stress factor for the maximum LUE by plants at the true ambient temperature, and T opt x is the optimum temperature for plant growth in a year, defined as the monthly average temperature of the grid x in the month with the highest NDVI in a year. T x , t is the monthly average temperature of grid x in month t.
W ε ( x , t ) = 0.5 + 0.5 × E ( x , t ) / E p ( x , t )
E p ( x , t ) = B T ( x ) × exp ( 4.133 + 0.059 ( A l t / 500 ) 1.5 )
B T   ( x ) = t = 1 12 T ( x , t ) / 12
E ( x , t ) = r ( x , t ) × R n ( x , t ) × [ r ( x , t ) 2 + R n ( x , t ) 2 + r ( x , t ) × R n ( x , t ) ] [ r ( x , t ) + R n ( x , t ) ] × [ r ( x , t ) 2 + R n ( x , t ) 2 ]
R n ( x , t ) = E p ( x , t ) × r ( x , t ) 0.5 × ( 0.369 + 0.598 × E p ( x , t ) / r ( x , t ) 0.5 )
W ε ( x , t ) reflects the impact of the effective water conditions available to plants on LUE and is calculated based on the ratio of the actual to potential regional evapotranspiration. E p x , t is the potential evapotranspiration of the region, which has a correlation with the biotemperature (BT) and the elevation of the region (Alt), where BT is expressed by the annual average temperature of the region in a year. E x , t is the actual evapotranspiration of the region, r ( x , t ) is the total precipitation at month t, and R n x , t is the parameter expressing the level of hydrothermal balance in grid x, which is related to the potential evapotranspiration E p x , t and precipitation r ( x , t ) [31].
After calculating the NPP values for 12 months in a year, the NPP values for each month were accumulated to obtain the annual NPP (gram carbon per square meter per year, gC·m−2·a−1) for subsequent analysis.

2.2. Data

The input data for the model are shown in Table 2. The temperature data were based on the ERA5-Land dataset from the European Centre for Medium-Range Weather Forecasts (ECMWF) (https://cds.climate.copernicus.eu, accessed on 31 March 2022) with a resolution of 0.1°. The solar radiation data were based on the Climate Forecast System (CFS) dataset with a resolution of 0.2° provided by the National Centers for Environmental Prediction (NCEP) [32]. The monthly solar radiation was synthesized with the downward short-wave radiation band. The precipitation data were based on the 0.1° × 0.1° Month’s Global Precipitation Measurement (GPM) (https://disc.gsfc.nasa.gov, accessed on 31 March 2022) [33,34]. The NDVI data were obtained from the MOD13A1 product provided by the NASA Earth Observation System. The MOD13A1 dataset has spatial and temporal resolutions of 500 m and 16 days, respectively. We generated the monthly NDVI data using the Maximum Value Composites method. Another NDVI source, namely GIMMS, generated from several of NOAA’s AVHRR sensors [35], was used to estimate the NPP from 1993 to 1996 and validate against a dataset of NPP sites for the corresponding years. Given that the two NDVI data have different sensors and temporal resolutions, we used a general regression method to adjust the GIMMS NDVI data [36]. The vegetation type data were based on the 500 × 500 m MODIS land cover type product (MCD12Q1 V6) (https://lpdaac.usgs.gov/, accessed on 15 April 2022). The land cover type in 2020 can be seen in Figure 1a. The climatic region data were provided by the Data Center for Resources and Environmental Sciences (https://www.resdc.cn, accessed on 22 May 2022). Based on the heat index, the land area of China is divided into seven climate zones and a highland climate zone shown in Figure 1b.
In addition, as a validation of the CASA model, two remote sensing datasets and four observation site datasets were obtained. One remote sensing dataset was the MODIS annual NPP product (https://doi.org/10.5067/MODIS/MOD17A3HGF.006, accessed on 22 May 2022) (MOD17) from 2001 to 2020 with a spatial resolution of 500 m, another was the GLO-PEM model product [13,37] from 2001 to 2010 with a spatial resolution of 1 km provided by the Data Center for Resources and Environmental Sciences.
The four observation site datasets were FLUXNET2015 [38], SRDB [39], EMDI [40], and the Reference dataset for the carbon cycle study of typical forest ecosystems in China (abbreviated in this paper as the carbon cycle dataset) [41]. The observation site NPP datasets were carefully screened by eliminating the missing and duplicate records. The distribution of the observation sites is shown in Figure 1b. The EMDI and SRDB were obtained from the Oak Ridge National Laboratory (ORNL) (https://daac.ornl.gov/, accessed on 23 May 2022). Most of the EMDI dataset’s site data in China were distributed from 1993 to 1996, while FLUXNET2015, SRDB, and the carbon cycle dataset have observation data after 2000.

2.3. Evaluation Methods for Model Estimation Results

2.3.1. Uncertainty Evaluation

Uncertainty analysis of the CASA model prediction results was performed in combination with the measured data of the terrestrial vegetation NPP. The uncertainty validation metrics used in this paper include the mean absolute error (MAE), root mean square error (RMSE), and relative bias (BIAS) [42]:
MAE = i = 1 n x i x i ^ n
RMSE = 1 n i = 1 n ( x i x i ^ ) 2
BIAS = i = 1 n ( x i x i ^ ) i = 1 n x i × 100 %
where n is the number of measured samples, x i is the value of the measured samples, and x i ^ is the value estimated by the model. The error of model estimation was evaluated by the above metrics, and the error of MOD17 NPP with measured data was also calculated to compare the advantages of the two models.

2.3.2. Correlation Analysis

The product data from other models were used for trend consistency analysis and the correlation evaluation of the CASA model prediction results. We used Pearson’s correlation coefficient (r) [42] to evaluate the degree of correlation between the two model products as follows:
r = i = 1 n ( x i x ¯ ) ( y i y ¯ ) i = 1 n ( x i x ¯ ) 2 i = 1 n ( y i y ¯ ) 2
where xi and yi are the CASA NPP value and the MOD17 NPP value raster in the ith grid belonging to the vegetation type, separately, x ¯ and y ¯ are the mean value of CASA NPP andMOD17 NPP, separately.
A linear regression of the interannual changes in the total NPP values of the three model products was performed to evaluate the consistency of the interannual trends in the estimated NPP changes of the three model products.

2.4. Data Analysis

2.4.1. Trend Analysis

Based on the ordinary least squares method, we used linear trend regression analysis to study the time trend of NPP from 2001 to 2020 [43,44]:
θ trend = n i = 1 n i X i i = 1 n i i = 1 n X i n i = 1 n i 2 ( i = 1 n i ) 2
where θ trend is the slope of the trend of NPP, i is the order of years, n is the total number of years, X i is the NPP value of year i. It indicates an increasing trend if the θ trend is greater than zero, conversely, it indicates a decreasing trend. To screen out the regions with reliable trends, the Mann–Kendall test was applied to evaluate the significance of the trend [45].

2.4.2. Correlation between the NPP and Climatic Factors

Climatic factors such as temperature, precipitation, and solar radiation have significant effects on the vegetation NPP [36]. To analyze the correlation between NPP and these three climatic factors, we used Pearson’s correlation coefficient (r) [42] as shown in Equation (18). xi and yi are the NPP value and the value of climatic factors in the ith year, separately, x ¯ and y ¯ are the mean NPP and mean value of climatic factors from 2001 to 2020, separately.

2.4.3. Quantitative Relationship Analysis of Climatic Factors and NPP

In regions with different climatic environments, changes in temperature and precipitation have different perturbations on the NPP, for example, a 1 °C increase in annual mean temperature may have different effects on the NPP in Inner Mongolia grassland and Qinghai–Tibet Plateau grassland regions. The effect on the NPP is also different between a 1 °C and 2 °C change in the annual mean temperature in the same region. The NPP may increase when the precipitation increases in a region, but if the precipitation increases excessively, will it suppress NPP instead? To further analyze the relationship between the climate factors and NPP changes in typical regions, this paper proposes a statistical method to quantitatively analyze the response of NPP to changes in temperature and precipitation.
We selected grassland areas in two regions, Inner Mongolia and the Qinghai–Tibet Plateau, and for each grid in each region the mean values of temperature, precipitation, and NPP were calculated for each year. For a grid, if the temperature is within ±0.5 °C of the 20-year average temperature for at least 10 years, that temperature is defined as the “conventional temperature” for that grid, and the temperature for years above that range is considered “unconventional temperature”. The average of the NPP for all years in the conventional temperature range is defined as the conventional NPP value for this grid. The difference between the conventional and unconventional temperatures and the difference between the conventional NPP values and the NPP corresponding to the unconventional temperatures are calculated. With the above processing, the magnitude of the increase or decrease in the NPP for a grid when the temperature fluctuates in different degrees can be obtained. Similarly, if the precipitation is within ±50 mm of the 20-year average precipitation for at least 10 years, this precipitation value was the “conventional precipitation”, and the precipitation in the remaining years was considered as “unconventional precipitation”. The difference between the conventional NPP and NPP corresponding to unconventional precipitation was calculated.
The conventional temperature of the whole region was graded, for example, by dividing the subregions with conventional temperatures in the range of 1–2 °C and 2–3 °C, and the mean value of the NPP change when the temperature was unconventional was counted for grids in each subregion. By grading the whole region into subregions with different temperature levels, it is possible to analyze how the NPP varies with temperature within the different levels. Similarly, the conventional precipitation was graded and the mean value of changes in NPP when the precipitation changes were counted for each level of the conventional precipitation.

3. Results

3.1. Validation and Consistency Analysis of Estimated NPP

3.1.1. Consistency Analysis with MOD17 and GLO-PEM NPP

Because of the same spatial resolution, MOD17 NPP was selected for correlation analysis with CASA NPP. The correlation values were calculated for each year and the results were approximate. Figure 2a shows the results for 2001, where the black dashed line is the reference line with equal values of the horizontal and vertical coordinates and the red line is the fitted line for the regression analysis, which shows that the average value of CASA NPP is higher than that of MOD17 NPP. In 2001, the correlation coefficient r was 0.83, which reveals the NPP estimated by the CASA model is relatively reliable. As shown in Figure 2b, r was approximate over the 20 years and was above 0.8 in most years.
The total and trend changes of GLO-PEM NPP (from 2001 to 2010), MOD17 NPP (from 2001 to 2020), and CASA NPP (from 2001 to 2020) were calculated and shown in Figure 2c. We calculated the correlation of the CASA model with the GLO-PEM model and the MOD17 product in total annual NPP, where the correlation coefficients were 0.87 (p < 0.001) with GLO-PEM NPP and 0.97 (p < 0.0001) with MOD17 NPP, both of which showed strong positive correlation.
For the three models, we found that in each year, the annual total of the CASA NPP was higher than the MOD17 NPP and lower than the GLO-PEM NPP. Limited by the measured data and statistics data, it is difficult to judge which model is closer to the real situation. The MAE of the CASA NPP and GLO-PEM NPP was 0.083 PgC·a−1, the RMSE was 0.105 PgC·a−1, and the BIAS was −2.282%. The MAE with the MOD17 NPP was 0.201 PgC·a−1, the RMSE was 0.217 PgC·a−1, and the BIAS was 5.538% (minimum BIAS was 2%, maximum BIAS was 11%). From 2001 to 2010, the trends in the estimation results of the three models were almost consistent. From 2001 to 2020, the slope of the fitting results (dashed line) of the trend of the MOD17 NPP and CASA NPP were 0.048 and 0.043, respectively, which represented a very close trend of change. However, the estimated trends were not consistent for several years, such as in 2015, 2016, and 2019.

3.1.2. Validation with Observation Site Dataset

The measured data in the EMDI dataset were obtained before 2000 and were only used as a validation dataset for the CASA NPP. To ensure temporal consistency when validating with this dataset, we estimated the NPP for 1993–1996 using the land cover data in 2001 (the earliest MODIS landcover product) and the climate data for 1993–1996. Due to the inaccuracy of the landcover data, this estimation result was only used for the validation of the CASA NPP corresponding to the location of EMDI data. The MAE varied widely among different vegetation types. As shown in Table 3, the MAE of DNFs was the lowest (~70.1 gC·m−2·a−1), followed by the MAE of ENFs (~92.6 gC·m−2·a−1).
Since the MOD17 NPP is only available after 2001, the MOD17 NPP and CASA NPP were involved in the comparison with SRDB dataset, carbon cycle dataset, and FLUX NET2015 dataset. The comparison results of the two datasets are shown in Table 3. The MAE of the CASA NPP for ENFs was 77.35 and 46.90 gC·m−2·a−1 for the two datasets, respectively, with lower estimation errors than the MOD17 NPP. The MAE of the CASA NPP for EBFs showed greater than 300 gC·m−2·a−1 in all three datasets, and the estimation results were better than the MOD17 in the two datasets except for the carbon cycle dataset. In addition, the CASA NPP has a lower estimation error than the MOD17 NPP for DNFs and a higher estimation error than the MOD17 NPP for DBFs. The FLUXNET2015 dataset had five grassland observation sites and the MAE between the site value and CASA NPP was lower than the MOD17 NPP. The MAE of shrubs and cropland was less convincing due to the few measured data.
Most of the existing LUE models, including the CASA model, use the same parameters in different study areas, which can lead to errors. In this regard, we consider it necessary to evaluate the applicability of the model in different regions. The EMDI observed dataset includes the various types of typical vegetation and relatively uniform distribution, so it was used to evaluate the applicability of the model in different climatic zones.
As shown in Figure 3, the four types of forest were not estimated equally in different climatic zones. The order of the climate zones in the figure was arranged from north to south, from cold to warm. It was found that the MAE of each kind of forest exhibited increasing/decreasing changes with the change of climate zones. The MAE of ENFs and DBFs decreased with the warming of climate zones, while the MAE of EBFs and DNFs increased with the warming of climate zones. Table 4 shows the concrete value of the mean values of station data, the mean values of CASA NPP, and the errors of comparison such as the MAE and RMSE [46,47,48].
The MAE in the estimation results of ENFs was less than 110 gC·m−2·a−1 in all the temperate climate zones, with the smallest error (60 gC·m−2·a−1) in the northern temperate zone. EBFs in tropical and subtropical regions had relatively high NPP values and a wide range of fluctuations due to high temperatures and humid environments.
By comparing the mean values of the CASA NPP and observed NPP, it is found that from south region to north region, the mean value of the CASA NPP changed from higher than the observed NPP to lower than the observed NPP.
The maximum LUE parameter of the DNFs is relatively low, which is more suitable for NPP estimation in cold northern temperate regions. The estimation error of DBFs in the northern temperate zone is significantly higher than that in the southern temperate zone.
The above conclusions were obtained in comparison with the EMDI dataset. The scarcity of measured data in some climatic zones leads to less convincing conclusions in these areas, and a larger number and more evenly distributed measurements are needed to refine the conclusions.

3.2. Distribution of NPP

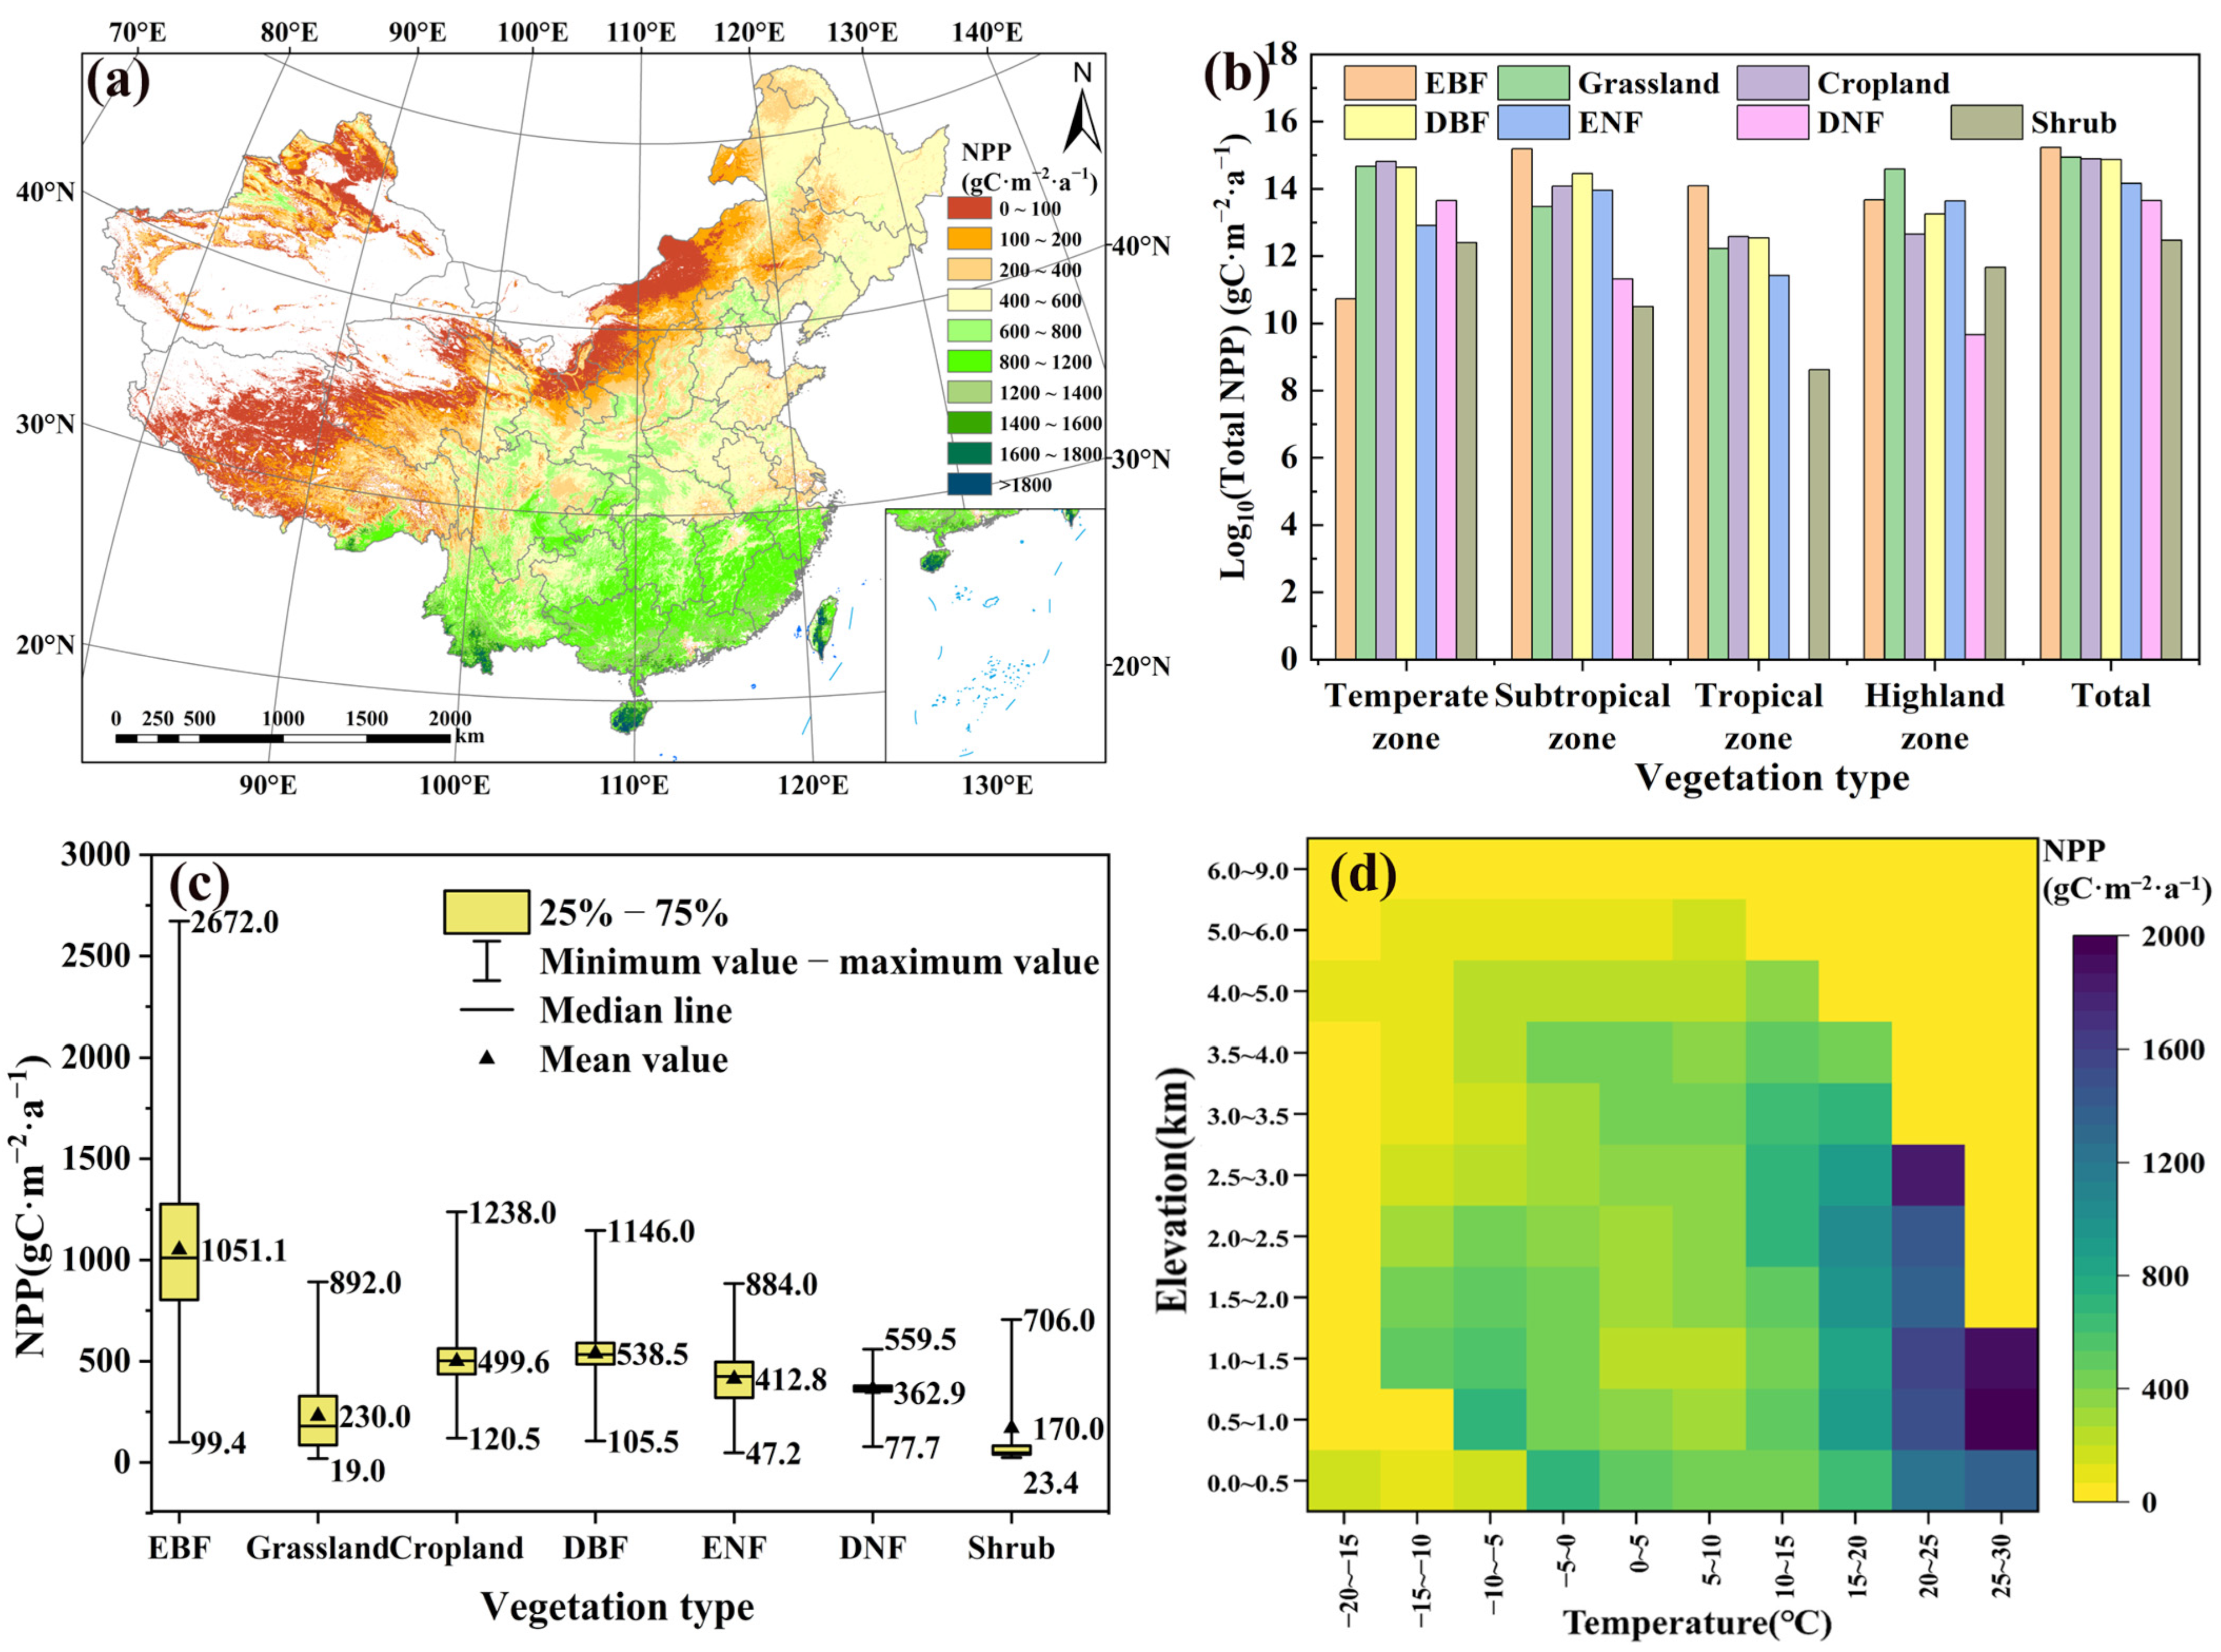
The spatial distribution of the mean NPP from 2001 to 2020 is shown in Figure 4a. The NPP increased roughly from northwest to southeast. The NPP of forests in the southern region was higher than that in the northern region, and the NPP of ENFs in the northeast was higher than that of DNFs. The NPP in Xinjiang and the Qinghai–Tibet Plateau was low due to the dominance of alpine grasslands. It is worth noting that the NPP of cropland in the northeast was lower than that in the southern area.
Different vegetation has different photosynthetic and carbon sequestration capacities as well as different coverage areas, and thus the total amount of NPP produced during the year varied. As shown in Figure 4b, the EBF contributed the highest total NPP (~1708.4 Tg C), followed by grasslands (~879.4 Tg C), croplands (~781.8 Tg C), and DBFs (~736.5 Tg C), where Tg is 1012 g. The NPP in EBFs was mainly from the subtropical zone, while grassland, cropland, and DBFs were mainly from the temperate zone. Shrubs had the lowest total NPP value due to the low coverage area.
The distribution of the NPP values for the same vegetation type varies greatly due to the differences in climate in different regions. As shown in Figure 4c, EBFs had the highest NPP, with a national mean value of 1051.1 gC·m−2·a−1 and a maximum of over 2600 gC·m−2·a−1 in the tropics. DBFs had a mean NPP of 538.5 gC·m−2·a−1. The mean NPP of ENFs was 412.8 gC·m−2·a−1 and that of DNFs was 362.9 gC·m−2·a−1. Cropland also showed a significant difference in NPP distribution due to the differences in crop varieties and manual management. The mean NPP value for grassland was 230 gC·m−2·a−1, with lower NPP values in highland climate zone and higher NPP values in humid environments. The lowest mean NPP value was found for shrubs, which was about 170 gC·m−2·a−1.
The distribution also showed differences in elevation and temperature. As shown in Figure 4d, the distribution in general showed a trend of gradually decreasing with increasing elevation and gradually increasing with increasing temperature. The NPP was significantly higher in areas with temperatures of 20–30 °C and elevations of 0.5–2 km.

3.3. Trends of NPP

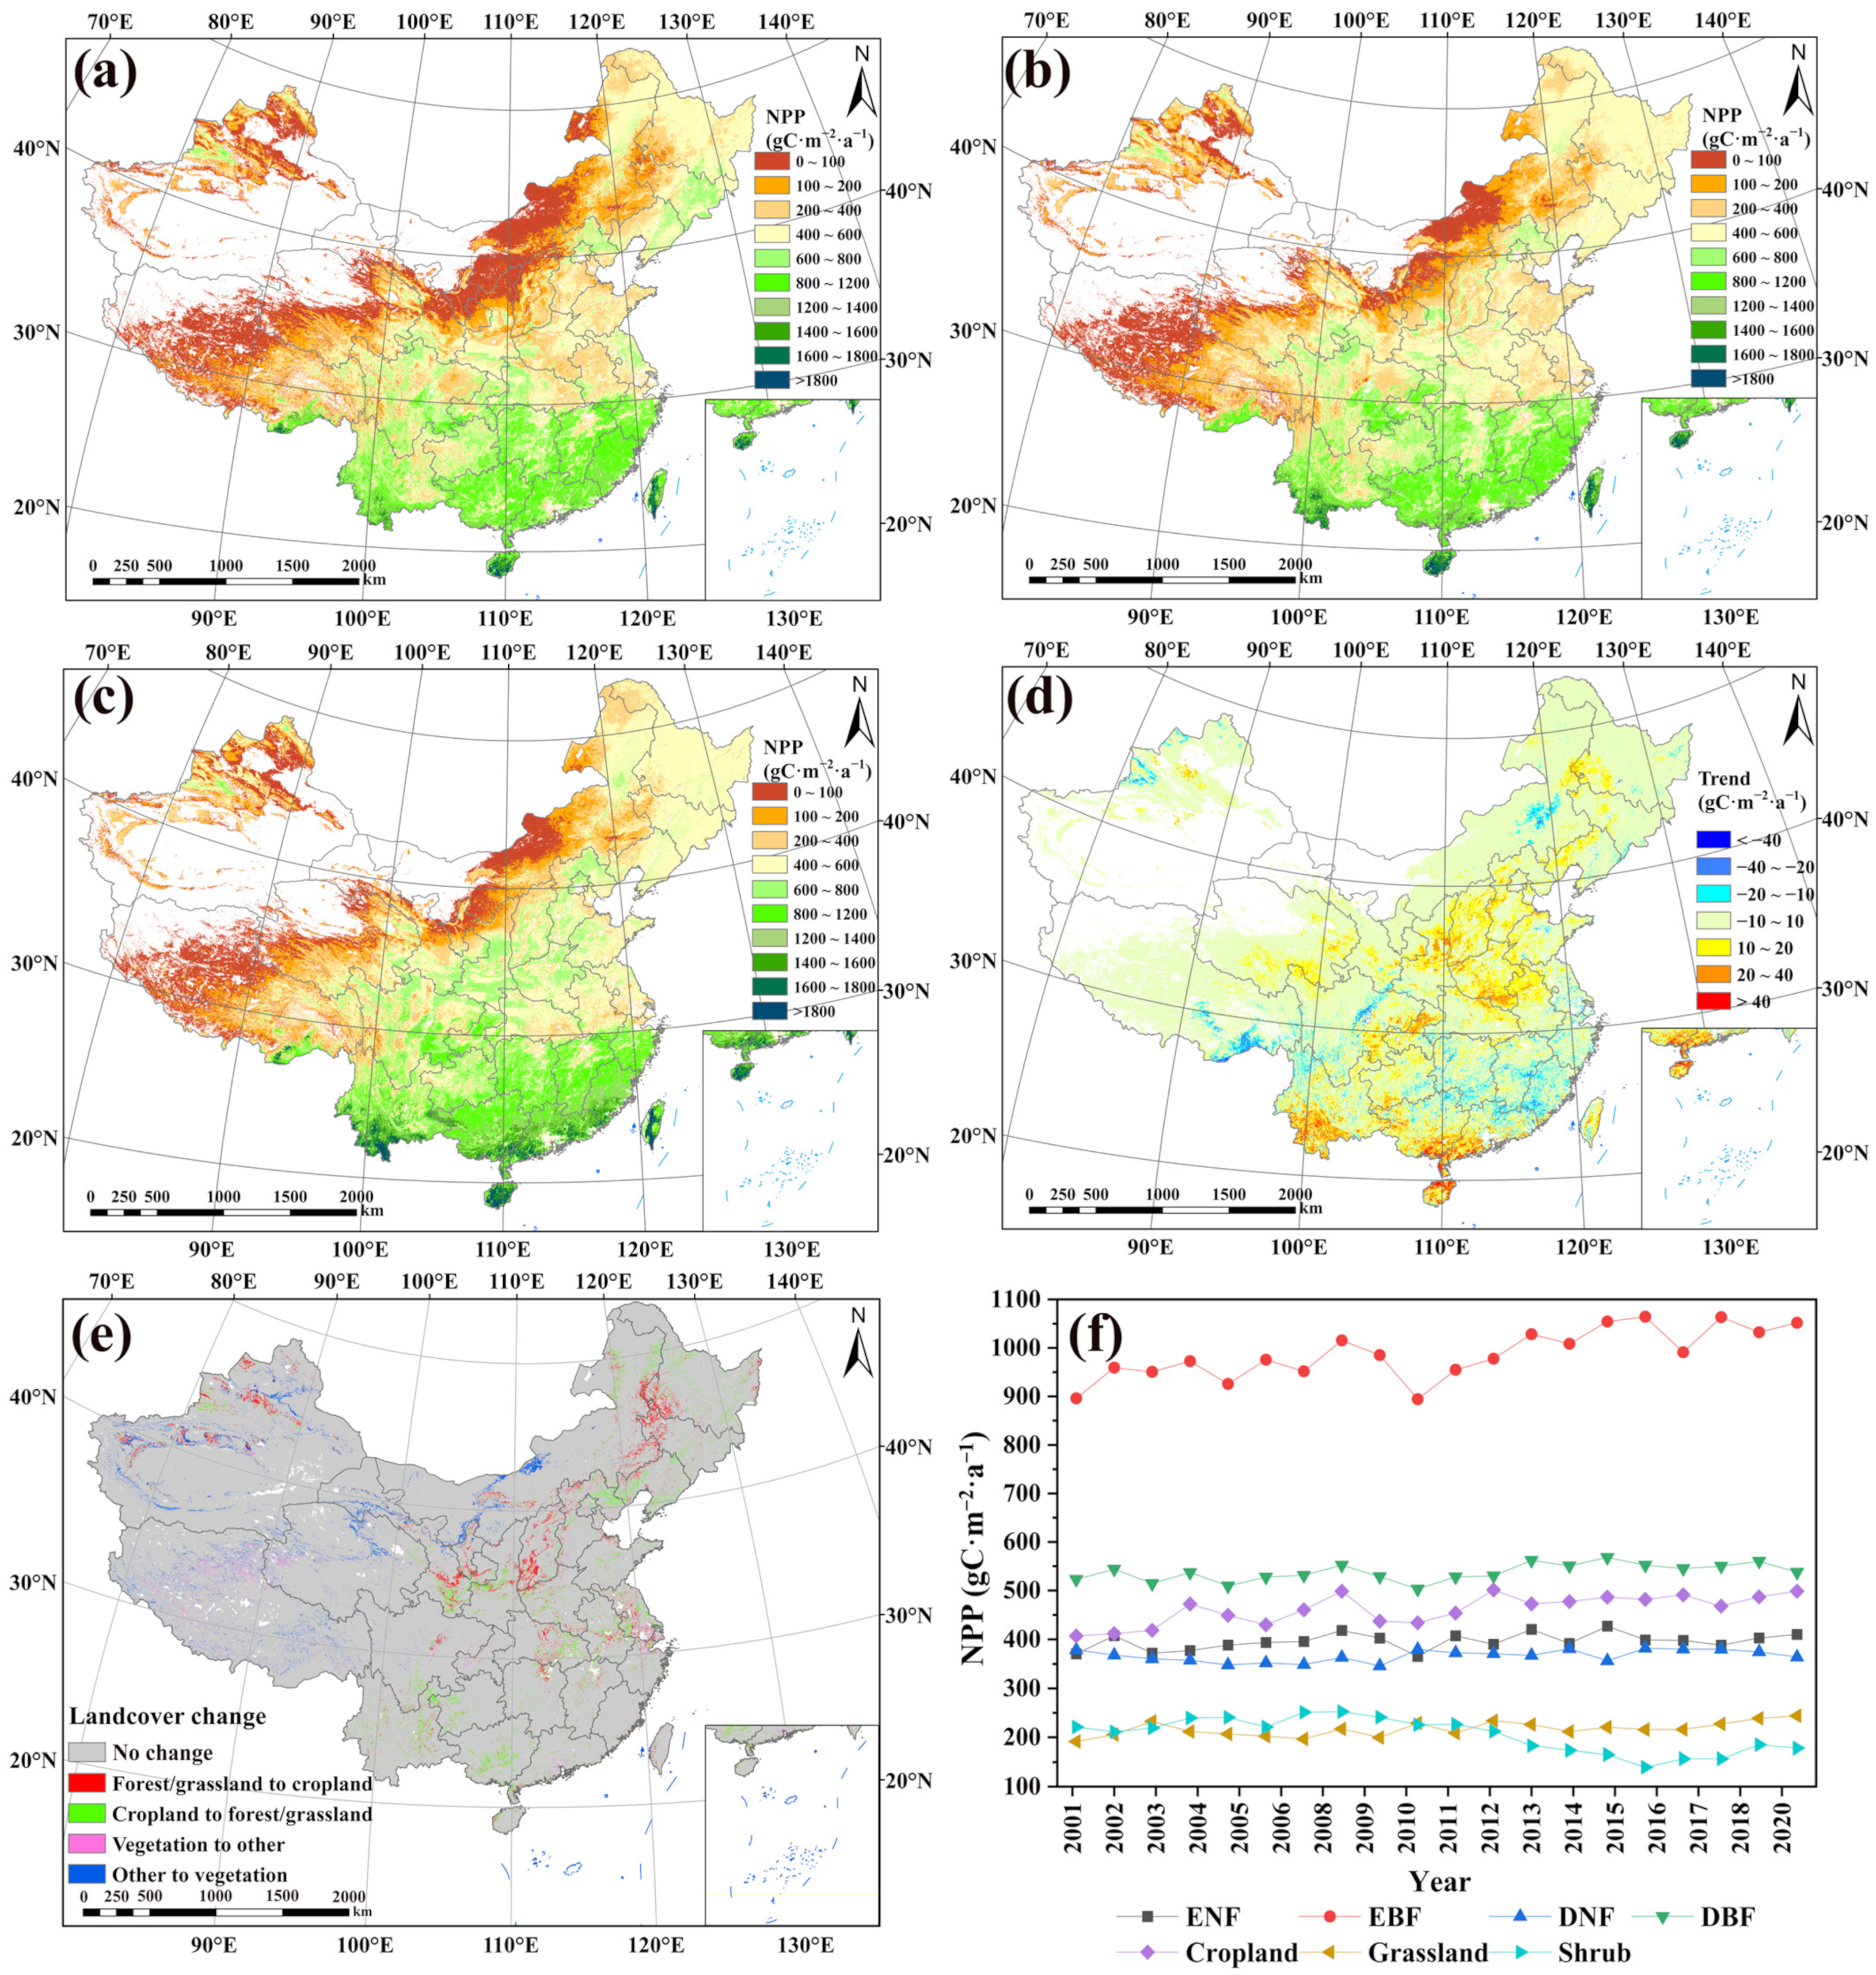
Figure 5a–c shows the NPP distribution in 2001, 2010, and 2020. Observing the changes in NPP distribution over 3 years, it can be found that the NPP in several typical vegetation cover regions changed obviously. The NPP in some regions increased, such as Shaanxi province, Shanxi province, and southeast coastal areas. The NPP in some regions decreased obviously, such as in forest areas in the southeast of the Qinghai–Tibet Plateau, and forest areas in Changbai Mountain in northeast China. By slope calculation and MK test, the 20-year NPP trends of all grids were analyzed, and Figure 5d shows the trends of all grids with a significance level of less than 0.05 after the MK test. The decreasing trend of NPP was the largest in the forest area of the southeastern Qinghai–Tibet Plateau (>20 gC·m−2·a−1). The grassland in Inner Mongolia and the DBF in northeast China also showed a decreasing trend (0–20 gC·m−2·a−1). The increasing trend of NPP was most obvious in EBF in southern Yunnan, Guangdong, and Hainan (>20 gC·m−2·a−1). The increasing trend of NPP was also observed in needleleaf forests in northeastern China, croplands in central China, and most grassland areas in Xinjiang (0–20 gC·m−2·a−1).
Land cover changes significantly affect NPP changes. The area of land cover change was derived by comparing the land cover data for 2020 and 2001. Figure 5e shows the changes between forest/grass and cropland, and the transformation of vegetation and non-vegetation. Some bare land or construction land in Inner Mongolia, Gansu, Xinjiang, and Qinghai had been changed to vegetation [49], which improved the vegetation carbon sequestration capacity. Some areas in the northeast and central plains had been converted from grassland to cropland, which has a higher carbon sequestration capacity.
The mean values of NPP of vegetation in different years also showed dynamic changes. Figure 5f shows the trends of the mean NPP of each vegetation type for 20 years. In 2008 the NPP increased for all vegetation types, and on the contrary, 2010, 2014, and 2017 were the years when NPP decreased for most vegetation types. EBFs had the highest increasing trend (~6.98 gC·m−2·a−1), followed by cropland (~3.83 gC·m−2·a−1) and grassland (~1.61 gC·m−2·a−1), and no significant change in DNF.

3.4. Response of NPP to Climate Factors

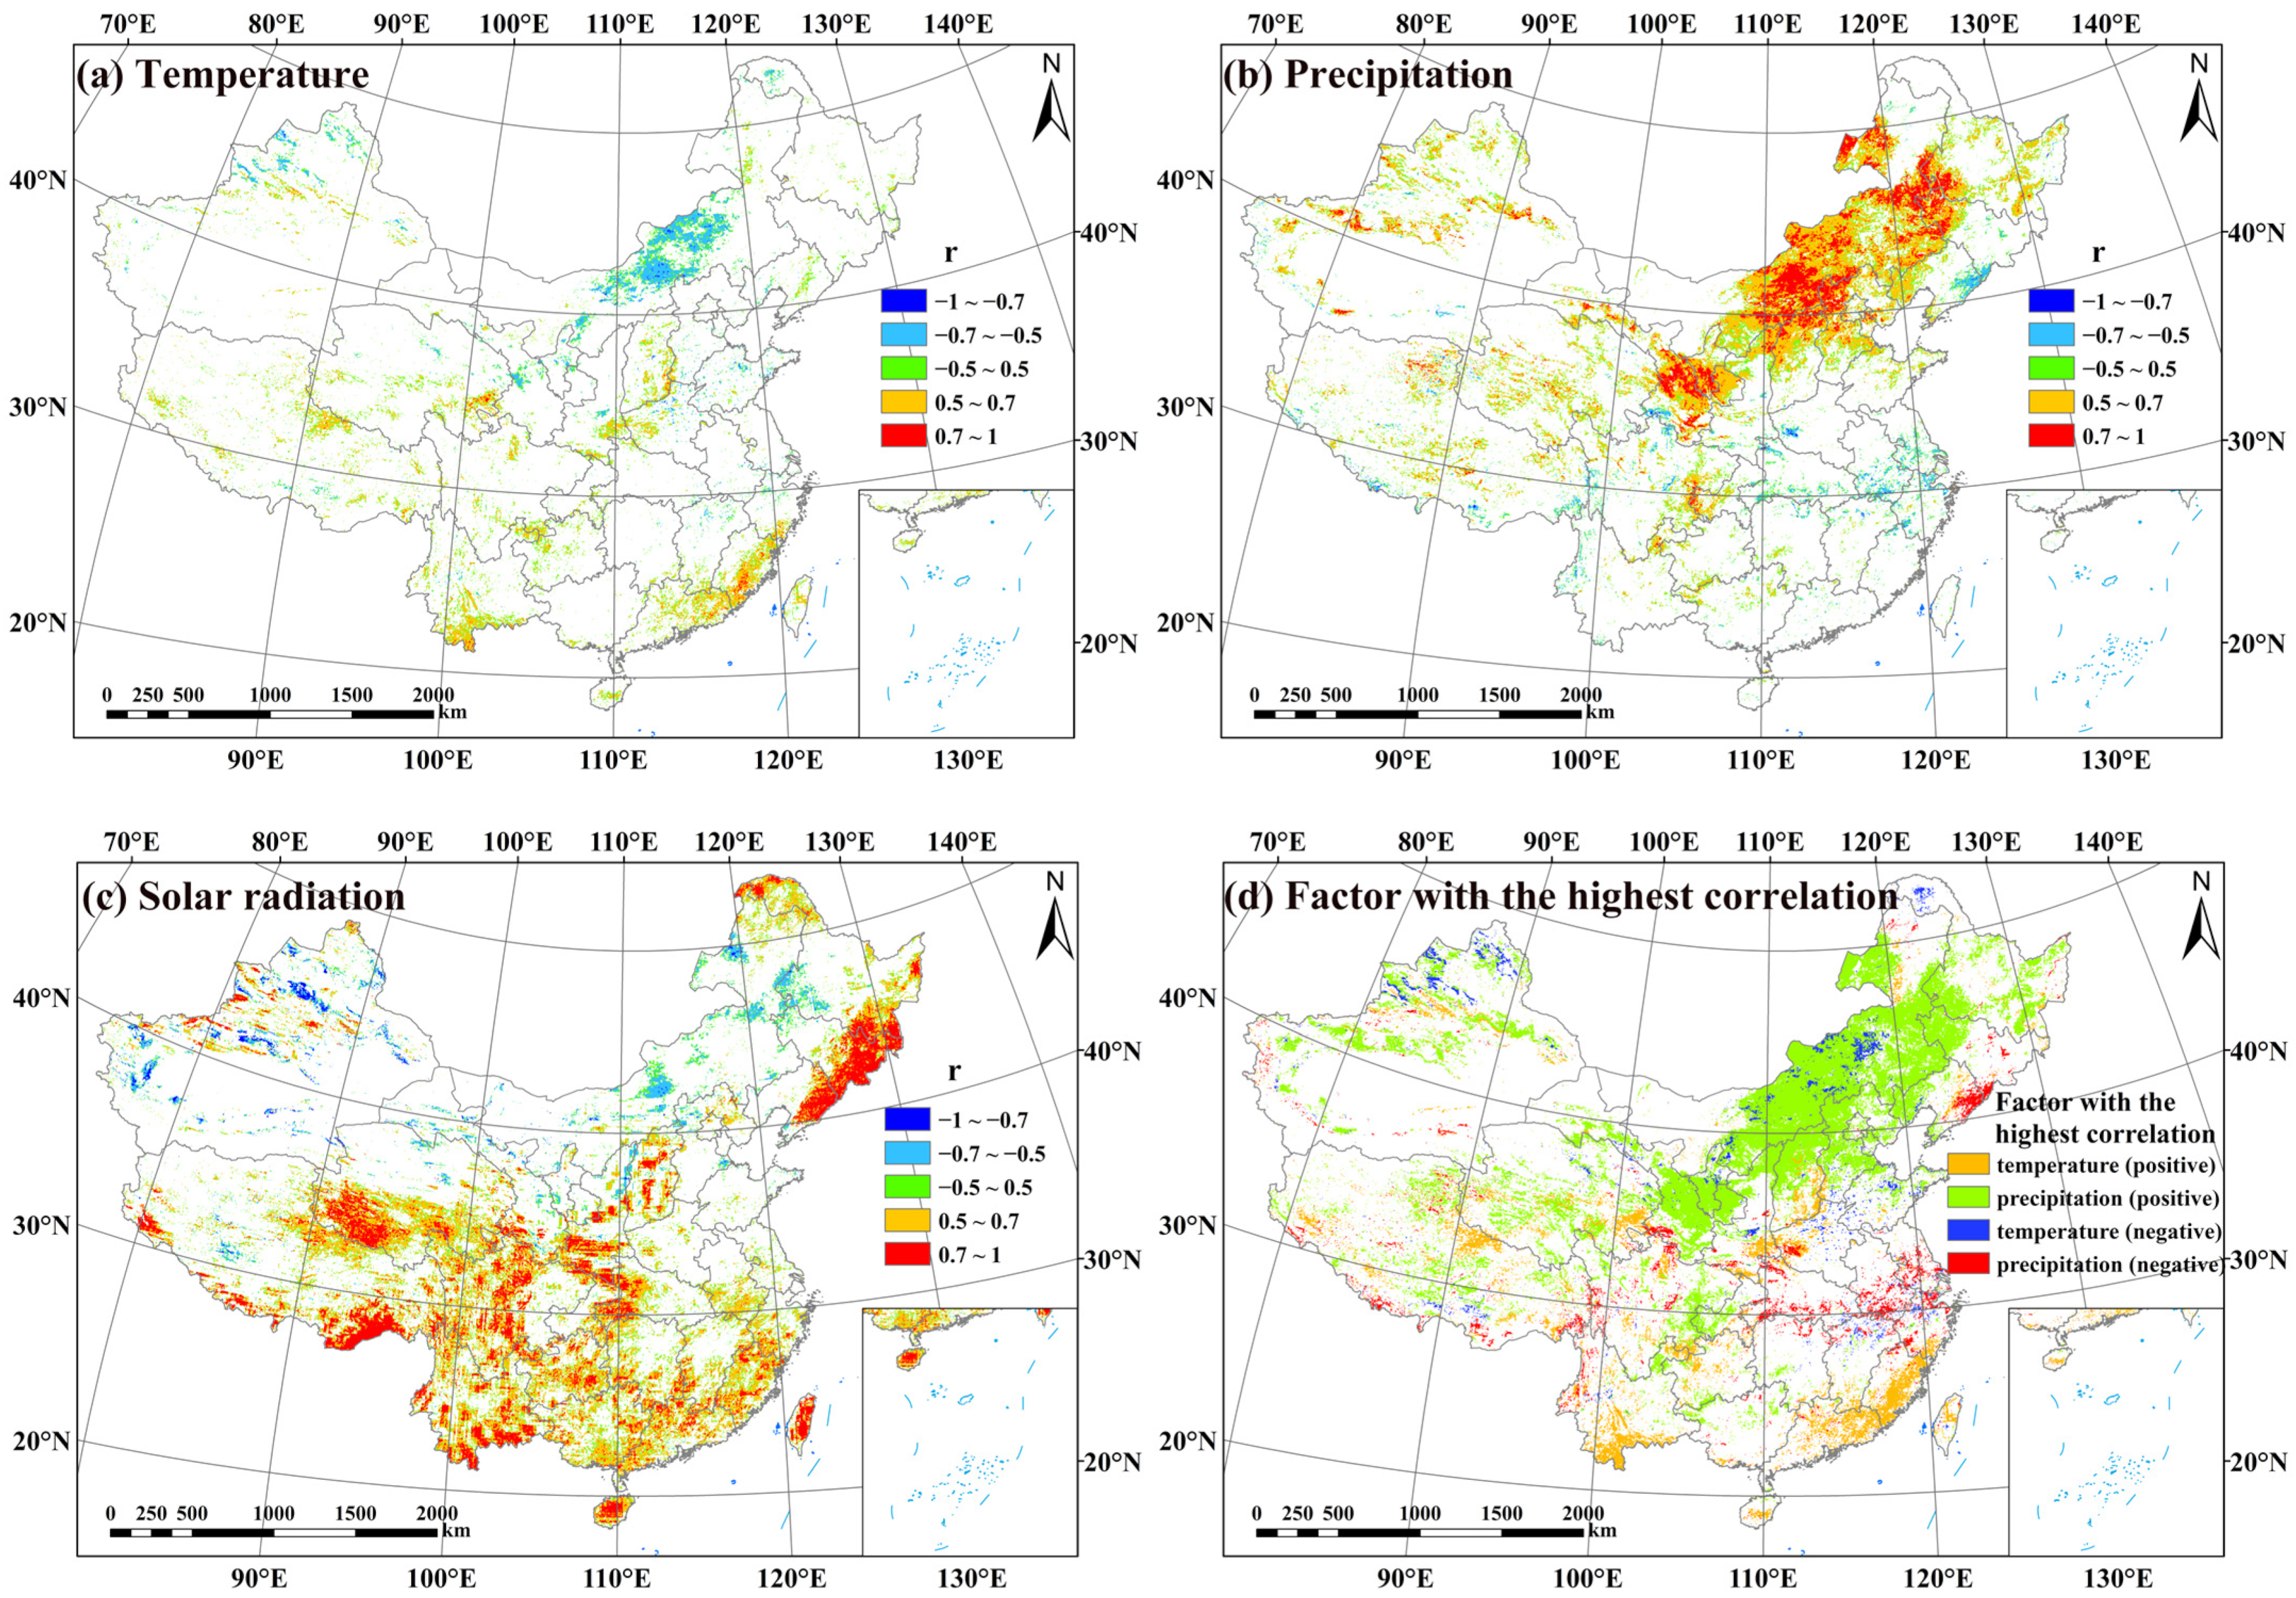
In this paper, the correlation between the 20-year climate parameters and 20-year NPP values of each vegetation grid was analyzed from the grid scale by the correlation coefficient analysis method, and only the regions with a significance level p-value < 0.05 were retained by the significance test. In Figure 6a, the NPP of grassland in central Inner Mongolia had a strong negative correlation with the temperature. Most of the forest areas in the southeastern coastal region showed a positive correlation with the temperature. The relationship between the grassland NPP and temperature in the Qinghai–Tibet Plateau region was more complex without obvious regional aggregation.
As shown in Figure 6b, the grassland NPP in Inner Mongolia and Gansu Province each had a strong positive correlation with precipitation. Grassland NPP in the northern Qinghai–Tibet Plateau was positively correlated with precipitation. The cropland NPP in northern region showed a positive correlation with precipitation, while showing the opposite relationship in southern region. The correlation between the broadleaf forest land NPP and precipitation was not significant.
In Figure 6c, the NPP of most terrestrial areas was positively correlated with solar radiation. Especially, the forest NPP in the northeastern, southwestern, and southeast coasts showed a strong positive correlation with solar radiation. In contrast, the grassland NPP in the north showed a weakly negative correlation with the solar radiation variation. Solar radiation, as a direct source of energy for photosynthesis by vegetation, is obviously an important factor impacting NPP, and from Equation (2), even with constant solar radiation, the magnitude of NPP is influenced by LUE, which is regulated by environmental factors such as temperature and precipitation. Therefore, it is more valuable to mainly analyze the intensity of the correlation between the temperature and precipitation and NPP variation. Figure 6d compares the magnitude of correlation between the temperature and precipitation with NPP variation in different regions. Figure 6d showed that the higher correlation between NPP and temperature was mainly concentrated in the EBFs in the south, and the grassland in the Qinghai–Tibet Plateau, all of which were positively correlated. Most grassland NPP was more correlated with precipitation, including grassland in Inner Mongolia, the Qinghai–Tibet Plateau, and Gansu, all of which were positively correlated. Cropland in the southern region, on the other hand, had a negative correlation with precipitation. In terms of the distribution area, NPP changes were significantly correlated with temperature in about 10.39% of the vegetation cover area and with precipitation in about 26.92% of the vegetation cover area. The correlation between precipitation and NPP was higher in most regions, accounting for about 26.23% of the total vegetation coverage area, and the correlation with temperature was higher in 8% of the total vegetation coverage area.

3.5. Perturbations of Temperature and Precipitation Changes on Grassland NPP

We focused on the grasslands of Inner Mongolia and the Qinghai–Tibet Plateau and quantitatively analyzed the impact of different degrees of temperature and precipitation changes on the NPP changes of grasslands.
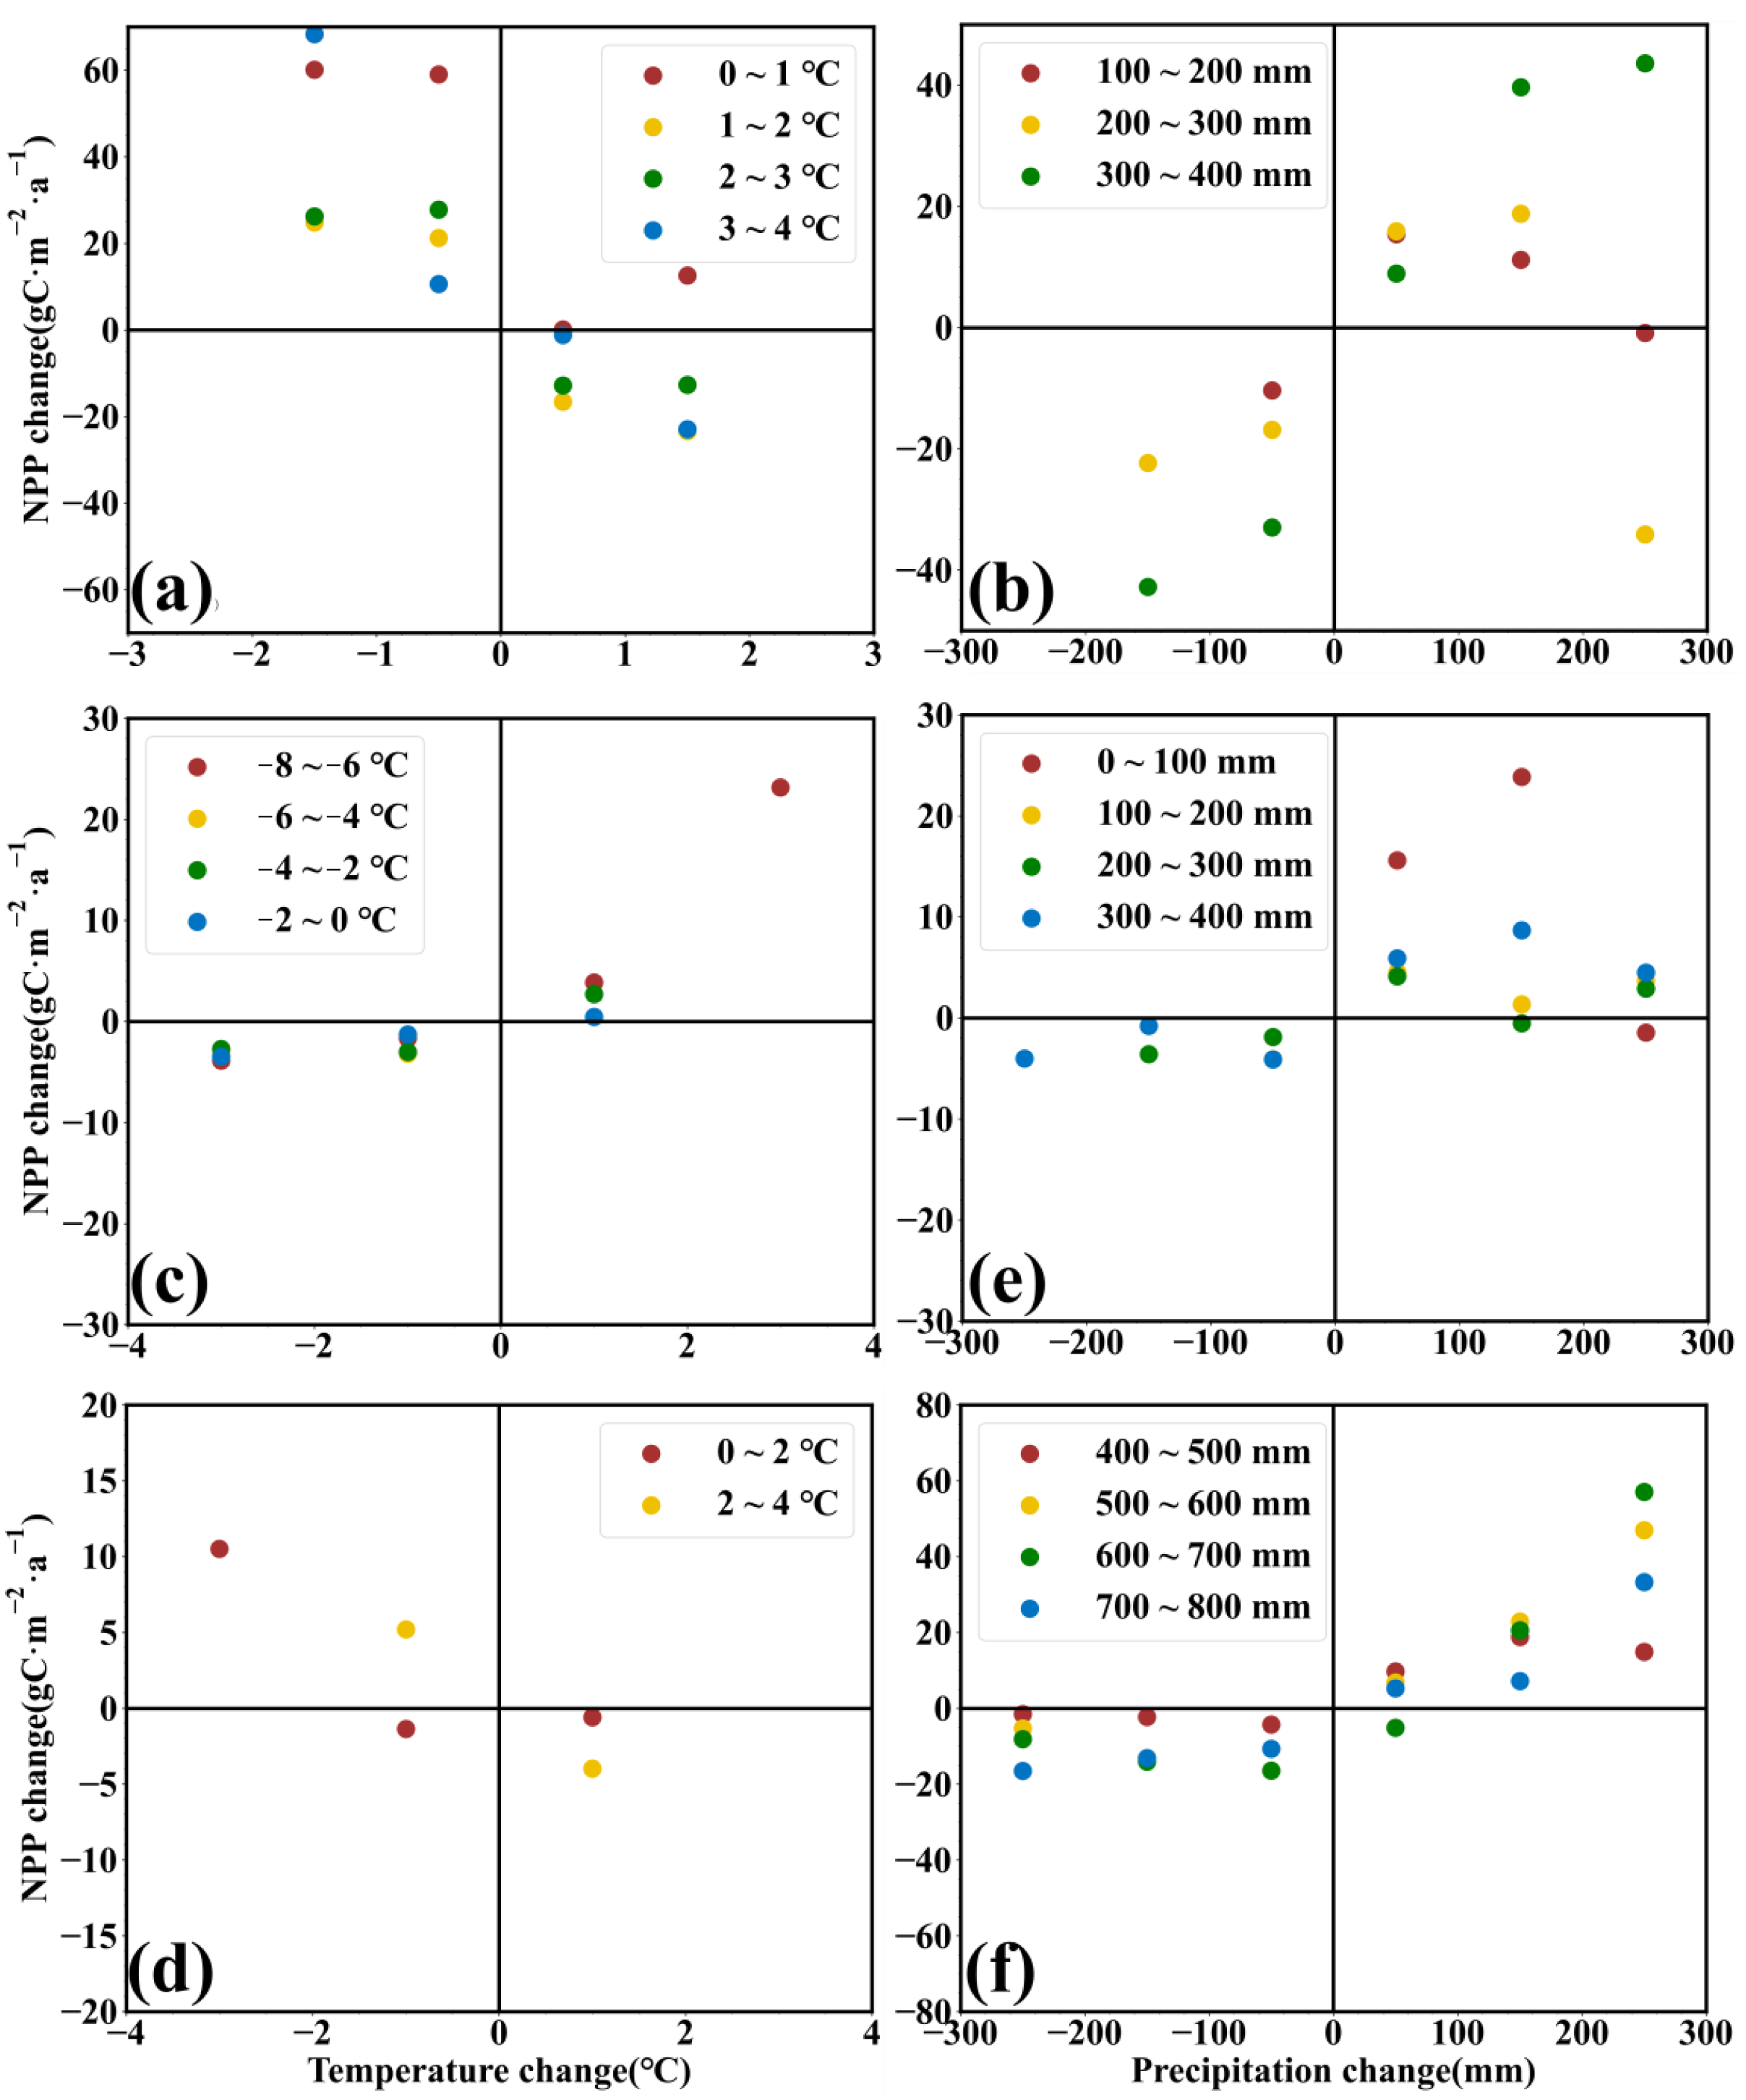
The annual average temperature in the Inner Mongolia grassland region is between about 0 °C and 4 °C, and we divided Inner Mongolia grassland into four temperature zones: 0~1 °C, 1~2 °C, 2~3 °C, and 3~4 °C. The range of temperature change of each zone was set to −3~3 °C and divided into 1 °C intervals. After statistics, the effect of different temperature changes on the NPP changes in each temperature zone is shown in Figure 7a. We found that the temperature changes in Inner Mongolia grassland showed a negative effect on NPP changes. In each temperature zone, when the temperature in a particular year decreased, the mean NPP value instead increased, for example, in the regions with mean annual temperatures of 2~3 °C and 3~4 °C, when the temperature in a particular year increased by 1~2 °C, the NPP decreased by about 20 gC·m−2·a−1 compared with the conventional years. When the temperature in a particular year decreased by 1~2 °C degrees, the NPP increased by more than 20 gC·m−2·a−1 on average.
The precipitation distribution data showed that the annual average precipitation in the Inner Mongolia grassland region was about 100 mm–400 mm, and we divided the Inner Mongolia grassland area into three precipitation zones according to 100 mm intervals. We set the range of precipitation variation from −300 mm to 300 mm and divided the precipitation variation into 100 mm intervals. The effect of different precipitation changes on the NPP changes in each precipitation zone is shown in Figure 7b. The NPP changes in Inner Mongolia grassland showed a significant positive correlation with precipitation changes. In all precipitation zones, when the precipitation in a particular year decreased, the mean NPP value also decreased. The NPP is more sensitive to changes in precipitation in regions with higher conventional precipitation. In the region with 300~400 mm annual precipitation, when precipitation decreased by more than 100 mm in a year, NPP decreased by more than 40 gC·m−2·a−1 on average, while the NPP increased by 40 gC·m−2·a−1 on average when the precipitation increased by 200~300 mm. It was noteworthy that when precipitation increased by more than 200 mm, the effect of precipitation on NPP was no longer positive but played an inhibitory role.
In the Qinghai–Tibet Plateau, the effects of temperature and precipitation on grassland NPP were analyzed using the same method. We divided the temperature analysis results of the Tibetan Plateau into two parts: subzero temperature (Figure 7c) and above-zero temperature (Figure 7d), and precipitation into two parts: below 400 mm (Figure 7e) and above 400 mm (Figure 7f), according to the difference between dry and wet.
In the region of the subzero temperature zone, NPP was positively correlated with temperature, which was in contrast to the response in the Inner Mongolia region. When the temperature fluctuated within 2 °C, the average change in NPP was not significant, within 10 gC·m−2·a−1. In regions where the temperature was below −6 °C, the mean NPP increased significantly when the temperature increased greater than 2 °C, which was greater than 20 gC·m−2·a−1. Not all grassland regions of the Tibetan Plateau were positively influenced by the temperature in terms of NPP variation, and we found that the mean NPP variation was the opposite of the temperature variation in the region of 0~4 °C.
The Qinghai–Tibet Plateau is a complex terrain and has an alpine snow and ice environment, so the precipitation varies greatly in different regions. The response of NPP to precipitation in arid and semi-arid regions was positive but did not change significantly (within 10 gC·m−2·a−1), and the positive response of NPP to precipitation gradually weakened when the increase in precipitation was greater than 100 mm, and the response to precipitation became negative in some regions.
In the humid and semi-humid regions, precipitation and NPP showed a significantly positive relationship. Especially when the precipitation increased more than 200 mm, the average NPP value increased more than 20 gC·m−2·a−1.
We used the same method to analyze the NPP of DBFs in the northeast region and EBFs in the southeast region, but could not reach similar conclusions, probably because that forest land NPP is mainly influenced by solar radiation, while the effects of temperature and precipitation on NPP is more complex.

4. Discussion

4.1. Applicability and Limitations of the CASA Model

Due to the complex climatic environment, diverse vegetation types, and uncertainties of model parameters [50], it is difficult for the CASA model to adapt to various scenarios. Based on the results of the estimation error of the CASA model combined with the measured data (mainly Figure 3 and Table 4), we analyzed the applicability of the CASA model in different regions and different vegetation, as well as the ideas for possible improvement.
The actual NPP of EBFs in the tropics is much higher than the results derived from the CASA model due to the high temperature and humid environment, while the closer to the north, the better the model estimation results will be. When the model is applied to the tropical region, it can be optimized from the perspective of improving the maximum LUE. In addition, the NDVI tends to saturate in tropical regions and cannot distinguish the density of forest further, using the Enhanced Vegetation Index (EVI) to replace the NDVI added to the model is also an improved perspective.
In contrast, to reduce the apparently high estimation error of the DBFs in the northern temperate zone, the enhancement of the CASA model in reducing the maximum LUE parameter of the DBFs in this region can be considered.
If we consider optimizing the CASA model, we also need to further control the water and heat stress factors in subtropical and tropical regions, and more measured values are needed to fit the temperature and moisture stress factors for tropical forest areas. The NPP estimation error of DNFs in temperate regions is relatively larger, which is caused by the fact that the temperature and precipitation in temperate regions are higher than those in the northern temperate regions, and the vegetation photosynthetic capacity estimated by the model through the temperature and moisture is higher than the actual photosynthetic capacity of DNF.
The existing difficulty is the lack of a large amount of measured data for different tree species in different regions, which if available would allow the fitting of parameters for different scenarios and thus optimize the use of CASA models in local areas. In addition, the effects of extreme natural conditions such as persistent high temperatures, droughts, and floods are ignored when scaled to monthly time scales, so obtaining higher temporal resolution environmental data for estimation is also a way to improve the accuracy of the estimates.

4.2. Limitations of Quantitative Statistical Method

In this paper, a statistical method was designed to analyze the changes in NPP when the regional NPP varied with different degrees of temperature/precipitation, and different responses of NPP to temperature/precipitation changes were obtained for the Inner Mongolia grassland and Qinghai–Tibet Plateau grassland. However, there are still some limitations of this method at present, mainly the selection of some thresholds.
When filtering the conventional temperature, we chose “10 years” as the number of years threshold, when at least 10 years of temperature are in the range of conventional temperature, this conventional temperature can represent the temperature level of this grid. If the number of years is set too small, the conventional NPP does not represent the average of most years in this raster and has no reference value; if the number of years is set too large, the number of years used to calculate the difference of NPP under unconventional temperature is very small and the research significance is lost. The range given to the conventional temperature was determined using a 20-year temperature average of ±0.5 °C, which was also a subjectively chosen value to ensure that the change in NPP could be analyzed for changes in temperature within 1 °C (greater than 0.5 °C and less than 1 °C). To further control the uncertainty factor of subjective thresholds, subsequent studies need to design methods that can automatically extract the conventional levels of temperature/precipitation/NPP in the region as a benchmark for quantitative analysis of NPP changes with environment. In addition, the impact of synergistic changes in temperature/precipitation on NPP changes also needs to be further analyzed.

4.3. Impacts of Land Use Change and Phenology on NPP

The change in land cover is one of the important reasons for the changes in NPP. The land cover of China has produced significant changes in the last 20 years, which include the reasons for natural environment changes, afforestation, and accelerated urbanization. From Figure 5d,e, some forest areas in the northeastern region had been reclaimed as cropland, and the overall NPP in these areas still showed an increasing trend, so the carbon sequestration capacity of deciduous broadleaf forests and crops in the northeast may be similar. Since crops will be harvested and part of them will be released into the atmosphere as a carbon source, the overall carbon sequestration capacity of the areas bordering the four provinces in the northeast region should be reduced due to the reduction in forest land.
In the areas bordering Gansu and Shaanxi, some areas had been implemented to return farmland to forest and grass, causing a rise of NPP in the last 20 years. The afforestation and grass planting activities in most areas of Xinjiang had an obvious effect on improving the carbon sequestration capacity. The southeastern regions were mainly lush evergreen broadleaved forests with relatively little land cover changes, so the NPP changes were mainly determined by the natural climate. In the Qinghai–Tibet Plateau, little vegetation had been turned into bare land due to the influence of the natural environment or grazing, which directly led to the reduction in NPP in these areas.
Even for the same vegetation type, the NPP can vary greatly due to its phenological factors. From north to south, the forest has more adequate hydrothermal conditions, which will result in higher NPP values due to its longer growing period, even for the similar growth rates. The increase in NPP from north to south forests indicates a higher productivity of vegetation adapted to higher temperature conditions. The increase in forest NPP from west to east indicates a higher productivity of vegetation with more humid conditions.

4.4. Impact of Temperature and Precipitation on the Trend of NPP

The relationship and intensity of the impact of temperature and precipitation on NPP changes in the different regions and vegetation types are different. In the woodland areas, the increase in temperature can bring forward the initial period of vegetation growth in the year and makes the growing season longer, thus increasing the NPP in the year. The increase in precipitation has a positive impact on the increase in the NPP in the forest in most cases, especially in the drier western region, where the increase in precipitation can alleviate the soil water stress and increase the soil moisture, which is conducive to the accumulation of vegetation dry matter.
The response of the grassland NPP and cropland NPP to the temperature varied significantly in different regions, where the cause of cropland may be due to human management factors. Our analytical experiments found that the impact of temperature and precipitation on grassland NPP was related to the level of temperature and the level of wetness at which the grassland was located.
As shown in Figure 7b,e,f, precipitation has a greater effect on the NPP changes in grasslands in humid and semi-humid regions, and the extent of NPP growth is greater with increasing precipitation, whereas in semi-arid regions, the promoting effect has been significantly reduced and even an inhibiting effect occurs if the annual precipitation increases by more than 200 mm.
Most of the grasslands in Inner Mongolia belong to arid and semi-arid areas, and the forage grass is negatively affected by the temperature [51]. In this region, the increasing summer temperature brings the temperature to the threshold for the meadow steppe vegetation growth, which affects physiological activities such as photosynthesis and respiration. In contrast, forage growth is positive feedback to precipitation [44,51], and increased precipitation improves the soil water supply conditions and enhances the photosynthetic rate. If the effect of temperature is greater than that of precipitation, the combined effect will decrease the productivity of grass in the Inner Mongolia region.
As water-limited grasslands are greatly sensitive to precipitation [52], the precipitation in Qinghai–Tibet Plateau is mostly positively correlated with NPP, and water replenishment of grasslands during the water-scarce season can be very effective in improving the carbon sequestration capacity.
In the above analysis, the coupling relationship of the two climatic factors has not been further discovered, which is the focus of subsequent studies, which requires the further refinement of the temporal resolution and analysis of the effects of temperature and precipitation factors on the NPP during the different growth periods, as well as the consideration of the problem of the intensity of the impact of extreme weather in certain days of the year or month.

5. Conclusions

Using the CASA model, we estimated the NPP distribution of terrestrial vegetation in China from 2001 to 2020. We collected MOD17 NPP and GLO-PEM NPP data and compared the consistency of the overall national trend of NPP with the CASA NPP. We collected several measured datasets to verify the applicability of the CASA model. We found that the NPP errors of EBFs and DNFs estimated by the CASA model gradually increased with the climate zone from north to south, while the NPP errors of DBFs and ENFs gradually decreased. We analyzed the reasons for the differences in the estimation results of the CASA model for various types of vegetation in different areas and analyzed the possible effective methods for effect enhancement. We initially designed a method to quantify the impact of temperature and precipitation on NPP in the Inner Mongolia and Qinghai–Tibet Plateau grasslands and found that the increase in temperature has an inhibitory effect on Inner Mongolia grassland and a positive effect on Qinghai–Tibet grassland, and the precipitation had a positive effect on the Inner Mongolia grassland and Qinghai–Tibet grassland.
Our conclusions from the validation of the CASA model can support researchers in choosing whether to use the CASA model or how to improve the model in different study areas. Our analysis of the distribution and changes of NPP in the past 20 years confirms the effect of the national emphasis on the natural environment in recent years. The quantitative assessment method of NPP response to temperature and precipitation in large regions can provide experience for the regional NPP change prediction and ecological management.

Author Contributions

Conceptualization, Z.C. and J.C.; methodology, Z.C., J.C., G.X. and Z.S.; software, Z.C.; validation, J.Y. and Z.L.; formal analysis, Z.C., J.C. and J.Y.; data curation, Z.C. and Z.L.; writing—original draft preparation, Z.C.; writing—review and editing, Z.C., J.C., G.X. and Z.S.; visualization, Z.C. and J.Y.; supervision, J.C. and G.X.; project administration, J.C. and Z.S.; funding acquisition, J.C. and Z.S. All authors have read and agreed to the published version of the manuscript.

Funding

This research was funded by Open Fund of Key Laboratory of Natural Resources Monitoring in Tropical and Subtropical Area of South China, Ministry of Natural Resources, grant number 2022NRM006.

Data Availability Statement

All datasets used in this paper are publicly available and the URLs are provided in the data section.

Conflicts of Interest

The authors declare no conflict of interest.

References

  1. Lu, M.; Zhou, X.; Yang, Q.; Li, H.; Luo, Y.; Fang, C.; Chen, J.; Yang, X.; Li, B. Responses of Ecosystem Carbon Cycle to Experimental Warming: A Meta-Analysis. Ecology 2013, 94, 726–738. [Google Scholar] [CrossRef] [PubMed] [Green Version]
  2. Fung, I.Y.; Doney, S.C.; Lindsay, K.; John, J. Evolution of Carbon Sinks in a Changing Climate. Proc. Natl. Acad. Sci. USA 2005, 102, 11201–11206. [Google Scholar] [CrossRef] [PubMed] [Green Version]
  3. Chapin, F.S.; Woodwell, G.M.; Randerson, J.T.; Rastetter, E.B.; Lovett, G.M.; Baldocchi, D.D.; Clark, D.A.; Harmon, M.E.; Schimel, D.S.; Valentini, R.; et al. Reconciling Carbon-Cycle Concepts, Terminology, and Methods. Ecosystems 2006, 9, 1041–1050. [Google Scholar] [CrossRef] [Green Version]
  4. Ji, Y.; Zhou, G.; Luo, T.; Dan, Y.; Zhou, L.; Lv, X. Variation of Net Primary Productivity and Its Drivers in China’s Forests during 2000–2018. For. Ecosyst. 2020, 7, 15. [Google Scholar] [CrossRef] [Green Version]
  5. Potter, C.; Klooster, S.; Myneni, R.; Genovese, V.; Tan, P.N.; Kumar, V. Continental-Scale Comparisons of Terrestrial Carbon Sinks Estimated from Satellite Data and Ecosystem Modeling 1982–1998. Glob. Planet. Chang. 2003, 39, 201–213. [Google Scholar] [CrossRef]
  6. Imhoff, M.L.; Bounoua, L.; DeFries, R.; Lawrence, W.T.; Stutzer, D.; Tucker, C.J.; Ricketts, T. The Consequences of Urban Land Transformation on Net Primary Productivity in the United States. Remote Sens. Environ. 2004, 89, 434–443. [Google Scholar] [CrossRef]
  7. Haberl, H.; Erb, K.H.; Krausmann, F.; Gaube, V.; Bondeau, A.; Plutzar, C.; Gingrich, S.; Lucht, W.; Fischer-Kowalski, M. Quantifying and Mapping the Human Appropriation of Net Primary Production in Earth’s Terrestrial Ecosystems. Proc. Natl. Acad. Sci. USA 2007, 104, 12942–12947. [Google Scholar] [CrossRef] [Green Version]
  8. Shiga, Y.P.; Michalak, A.M.; Fang, Y.; Schaefer, K.; Andrews, A.E.; Huntzinger, D.H.; Schwalm, C.R.; Thoning, K.; Wei, Y. Forests Dominate the Interannual Variability of the North American Carbon Sink. Environ. Res. Lett. 2018, 13, 084015. [Google Scholar] [CrossRef]
  9. Ni, J.; Zhang, X.S.; Scurlock, J.M.O. Synthesis and Analysis of Biomass and Net Primary Productivity in Chinese Forests. Ann. For. Sci. 2001, 58, 351–384. [Google Scholar] [CrossRef]
  10. Guan, X.; Shen, H.; Gan, W.; Yang, G.; Wang, L.; Li, X.; Zhang, L. A 33-Year NPP Monitoring Study in Southwest China by the Fusion of Multi-Source Remote Sensing and Station Data. Remote Sens. 2017, 9, 1082. [Google Scholar] [CrossRef] [Green Version]
  11. Monteith, J.L. Solar Radiation and Productivity in Tropical Ecosystems. Br. Ecol. Soc. 1972, 9, 747–766. [Google Scholar] [CrossRef] [Green Version]
  12. Potter, C.S.; Randerson, J.T.; Field, C.B.; Matson, P.A.; Vitousek, P.M.; Mooney, H.A.; Klooster, S.A. Terrestrial Ecosystem Production: A Process Model Based on Global Satellite and Surface Data. Glob. Biogeochem. Cycles 1993, 7, 811–841. [Google Scholar] [CrossRef]
  13. Prince, S.D.; Goward, S.N. Global Primary Production: A Remote Sensing Approach. J. Biogeogr. 1995, 22, 815. [Google Scholar] [CrossRef]
  14. Yuan, W.; Liu, S.; Zhou, G.; Zhou, G.; Tieszen, L.L.; Baldocchi, D.; Bernhofer, C.; Gholz, H.; Goldstein, A.H.; Goulden, M.L.; et al. Deriving a Light Use Efficiency Model from Eddy Covariance Flux Data for Predicting Daily Gross Primary Production across Biomes. Agric. For. Meteorol. 2007, 143, 189–207. [Google Scholar] [CrossRef] [Green Version]
  15. Zhang, M.; Lal, R.; Zhao, Y.; Jiang, W.; Chen, Q. Estimating Net Primary Production of Natural Grassland and Its Spatio-Temporal Distribution in China. Sci. Total Environ. 2016, 553, 184–195. [Google Scholar] [CrossRef]
  16. Guo, D.; Song, X.; Hu, R.; Cai, S.; Zhu, X.; Hao, Y. Grassland Type-Dependent Spatiotemporal Characteristics of Productivity in Inner Mongolia and Its Response to Climate Factors. Sci. Total Environ. 2021, 775, 145644. [Google Scholar] [CrossRef]
  17. Yan, Y.; Wu, C.; Wen, Y. Determining the Impacts of Climate Change and Urban Expansion on Net Primary Productivity Using the Spatio-Temporal Fusion of Remote Sensing Data. Ecol. Indic. 2021, 127, 107737. [Google Scholar] [CrossRef]
  18. Wang, Y.; Xu, X.; Huang, L.; Yang, G.; Fan, L.; Wei, P.; Chen, G. An Improved CASA Model for Estimating Winter Wheat Yield from Remote Sensing Images. Remote Sens. 2019, 11, 1088. [Google Scholar] [CrossRef] [Green Version]
  19. Zhang, Y.; Zhang, X. Estimation of Net Primary Productivity of Different Forest Types Based on Improved CASA Model in Jing-Jin-Ji Region, China. J. Sustain. For. 2017, 36, 568–582. [Google Scholar] [CrossRef]
  20. Zhang, Y.; Hu, Q.; Zou, F. Spatio-Temporal Changes of Vegetation Net Primary Productivity and Its Driving Factors on the Qinghai-Tibetan Plateau from 2001 to 2017. Remote Sens. 2021, 13, 1566. [Google Scholar] [CrossRef]
  21. Pei, Y.; Huang, J.; Wang, L.; Chi, H.; Zhao, Y. An Improved Phenology-Based CASA Model for Estimating Net Primary Production of Forest in Central China Based on Landsat Images. Int. J. Remote Sens. 2018, 39, 7664–7692. [Google Scholar] [CrossRef]
  22. Yang, H.; Hu, D.; Peng, F.; Wang, Y. Exploring the Response of Net Primary Productivity Variations to Land Use/Land Cover Change: A Case Study in Anhui, China. Polish J. Environ. Stud. 2019, 28, 3971–3984. [Google Scholar] [CrossRef]
  23. Zhang, M.; Liu, X.; Nazieh, S.; Wang, X.; Nkrumah, T.; Hong, S. Spatiotemporal Distribution of Grassland NPP in Gansu Province, China from 1982 to 2011 and Its Impact Factors. PLoS ONE 2020, 15, e0242609. [Google Scholar] [CrossRef]
  24. Jiang, Y.; Guo, J.; Peng, Q.; Guan, Y.; Zhang, Y.; Zhang, R. The Effects of Climate Factors and Human Activities on Net Primary Productivity in Xinjiang. Int. J. Biometeorol. 2020, 64, 765–777. [Google Scholar] [CrossRef]
  25. Feng, Y.; Zhu, J.; Zhao, X.; Tang, Z.; Zhu, J.; Fang, J. Changes in the Trends of Vegetation Net Primary Productivity in China between 1982 and 2015. Environ. Res. Lett. 2019, 14, 124009. [Google Scholar] [CrossRef]
  26. Li, H.; Wu, Y.; Liu, S.; Xiao, J. Regional Contributions to Interannual Variability of Net Primary Production and Climatic Attributions. Agric. For. Meteorol. 2021, 303, 108384. [Google Scholar] [CrossRef]
  27. Piao, S.L.; Fang, J.Y.; Guo, Q.H. Application of Casa Model To the Estimation of Chinese Terrestrial Net Primary Productivity. Acta Phytoecol. Sin. 2001, 25, 603–608. [Google Scholar]
  28. Field, C.B.; Randerson, J.T.; Malmström, C.M. Global Net Primary Production: Combining Ecology and Remote Sensing. Remote Sens. Environ. 1995, 51, 74–88. [Google Scholar] [CrossRef] [Green Version]
  29. Zhu, W.; Pan, Y.; He, H.; Yu, D.; Hu, H. Simulation of Maximum Light Use Efficiency for Some Typical Vegetation Types in China. Chin. Sci. Bull. 2006, 51, 457–463. [Google Scholar] [CrossRef]
  30. Yu, D.; Shi, P.; Shao, H.; Zhu, W.; Pan, Y. Modelling Net Primary Productivity of Terrestrial Ecosystems in East Asia Based on an Improved CASA Ecosystem Model. Int. J. Remote Sens. 2009, 30, 4851–4866. [Google Scholar] [CrossRef]
  31. Zhou, G.S.; Zhang, X.S. Feedback of Vegetation on Climate. Acta Bot. Sin. 1996, 38, 1–7. [Google Scholar]
  32. Saha, S.; Moorthi, S.; Wu, X.; Wang, J.; Nadiga, S.; Tripp, P.; Behringer, D.; Hou, Y.T.; Chuang, H.Y.; Iredell, M.; et al. The NCEP Climate Forecast System Version 2. J. Clim. 2014, 27, 2185–2208. [Google Scholar] [CrossRef]
  33. Sun, W.; Sun, Y.; Li, X.; Wang, T.; Wang, Y.; Qiu, Q.; Deng, Z. Evaluation and Correction of GPM IMERG Precipitation Products over the Capital Circle in Northeast China at Multiple Spatiotemporal Scales. Adv. Meteorol. 2018, 2018, 4714173. [Google Scholar] [CrossRef]
  34. Maghsood, F.F.; Hashemi, H.; Hosseini, S.H.; Berndtsson, R. Ground Validation of GPM IMERG Precipitation Products over Iran. Remote Sens. 2020, 12, 48. [Google Scholar] [CrossRef] [Green Version]
  35. Fensholt, R.; Rasmussen, K.; Nielsen, T.T.; Mbow, C. Evaluation of Earth Observation Based Long Term Vegetation Trends—Intercomparing NDVI Time Series Trend Analysis Consistency of Sahel from AVHRR GIMMS, Terra MODIS and SPOT VGT Data. Remote Sens. Environ. 2009, 113, 1886–1898. [Google Scholar] [CrossRef]
  36. Zhang, Y.; Zhang, C.; Wang, Z.; Chen, Y.; Gang, C.; An, R.; Li, J. Vegetation Dynamics and Its Driving Forces from Climate Change and Human Activities in the Three-River Source Region, China from 1982 to 2012. Sci. Total Environ. 2016, 563–564, 210–220. [Google Scholar] [CrossRef]
  37. Cao, M.; Prince, S.D.; Small, J.; Goetz, S.J. Remotely Sensed Interannual Variations and Trends in Terrestrial Net Primary Productivity 1981–2000. Ecosystems 2004, 7, 233–242. [Google Scholar] [CrossRef]
  38. Pastorello, G.; Trotta, C.; Canfora, E.; Chu, H.; Christianson, D.; Cheah, Y.W.; Poindexter, C.; Chen, J.; Elbashandy, A.; Humphrey, M.; et al. The FLUXNET2015 Dataset and the ONEFlux Processing Pipeline for Eddy Covariance Data. Sci. Data 2020, 7, 225. [Google Scholar] [CrossRef]
  39. Jian, J.R.; Vargas, K.J.; Anderson-Teixeira, E.S. A Global Database of Soil Respiration Data. Biogeosciences 2010, 7, 1915–1926. [Google Scholar] [CrossRef] [Green Version]
  40. Olson, R.J.; Scurlock, J.M.O.; Prince, S.D.; Zheng, D.L.; Johnson, K.R. NPP Multi-Biome: NPP and Driver Data for Ecosystem Model-Data Intercomparison, R2 Data Set. ORNL DAAC 2013, 1, 1–23. [Google Scholar] [CrossRef]
  41. He, H.; Ge, R.; Ren, X.; Zhang, L.; Chang, Q.; Xu, Q.; Zhou, G.; Xie, Z.; Wang, S.; Wang, H.; et al. Reference Carbon Cycle Dataset for Typical Chinese Forests via Colocated Observations and Data Assimilation. Sci. Data 2021, 8, 1–13. [Google Scholar] [CrossRef] [PubMed]
  42. Wang, Z.; Zhong, R.; Lai, C.; Chen, J. Evaluation of the GPM IMERG Satellite-Based Precipitation Products and the Hydrological Utility. Atmos. Res. 2017, 196, 151–163. [Google Scholar] [CrossRef]
  43. Wang, Z.; Zhang, Y.; Yang, Y.; Zhou, W.; Gang, C.; Zhang, Y.; Li, J.; An, R.; Wang, K.; Odeh, I.; et al. Quantitative Assess the Driving Forces on the Grassland Degradation in the Qinghai-Tibet Plateau, in China. Ecol. Inform. 2016, 33, 32–44. [Google Scholar] [CrossRef]
  44. Liu, Y.; Zhou, R.; Ren, H.; Zhang, W.; Zhang, Z.; Zhang, Z.; Wen, Z. Evaluating the Dynamics of Grassland Net Primary Productivity in Response to Climate Change in China. Glob. Ecol. Conserv. 2021, 28, e01574. [Google Scholar] [CrossRef]
  45. Li, X.; Luo, Y.; Wu, J. Decoupling Relationship between Urbanization and Carbon Sequestration in the Pearl River Delta from 2000 to 2020. Remote Sens. 2022, 14, 526. [Google Scholar] [CrossRef]
  46. Cao, S.; Sanchez-Azofeifa, G.A.; Duran, S.M.; Calvo-Rodriguez, S. Estimation of Aboveground Net Primary Productivity in Secondary Tropical Dry Forests Using the Carnegie-Ames-Stanford Approach (CASA) Model. Environ. Res. Lett. 2016, 11, 075004. [Google Scholar] [CrossRef]
  47. Zhang, Y.; Xiao, X.; Wolf, S.; Wu, J.; Wu, X.; Gioli, B.; Wohlfahrt, G.; Cescatti, A.; van der Tol, C.; Zhou, S.; et al. Spatio-Temporal Convergence of Maximum Daily Light-Use Efficiency Based on Radiation Absorption by Canopy Chlorophyll. Geophys. Res. Lett. 2018, 45, 3508–3519. [Google Scholar] [CrossRef]
  48. Zhao, M.; Heinsch, F.A.; Nemani, R.R.; Running, S.W. Improvements of the MODIS Terrestrial Gross and Net Primary Production Global Data Set. Remote Sens. Environ. 2005, 95, 164–176. [Google Scholar] [CrossRef]
  49. Mu, S.; Zhou, S.; Chen, Y.; Li, J.; Ju, W.; Odeh, I.O.A. Assessing the Impact of Restoration-Induced Land Conversion and Management Alternatives on Net Primary Productivity in Inner Mongolian Grassland, China. Glob. Planet. Chang. 2013, 108, 29–41. [Google Scholar] [CrossRef]
  50. Wang, M.; Hu, C.; Barnes, B.B.; Mitchum, G.; Lapointe, B.; Montoya, J.P. The Great Atlantic Sargassum Belt. Science 2019, 364, 83–87. [Google Scholar] [CrossRef]
  51. Ji, R.; Tan, K.; Wang, X.; Pan, C.; Xin, L. Spatiotemporal Monitoring of a Grassland Ecosystem and Its Net Primary Production Using Google Earth Engine: A Case Study of Inner Mongolia from 2000 to 2020. Remote Sens. 2021, 13, 4480. [Google Scholar] [CrossRef]
  52. Yu, H.; Ding, Q.; Meng, B.; Lv, Y.; Liu, C.; Zhang, X.; Sun, Y.; Li, M.; Yi, S. The Relative Contributions of Climate and Grazing on the Dynamics of Grassland Npp and Pue on the Qinghai-Tibet Plateau. Remote Sens. 2021, 13, 3424. [Google Scholar] [CrossRef]
Figure 1. Spatial distribution of (a) the ecosystem types and (b) the climatic regions of China and spatial distribution of sites of multi-source observation datasets.
Land 12 01223 g001
Figure 2. (a) The correlation (r) of MOD17 NPP and CASA NPP in 2001. (b) We calculated the correlation between CASA NPP and MOD17 NPP for 2001–2020 and (c) compared the consistency of the trend in total NPP for GLO-PEM NPP, MOD17 NPP, and CASA NPP.
Land 12 01223 g002
Figure 3. The MAE of CASA NPP and EMDI NPP in different climate zones (the climatic zones are abbreviated in the figure, as follows: “N Tem”: northern temperate zone, “Tem”: temperate zone, “S Tem”: southern temperate zone, “N Sub”: northern subtropical zone, “Sub”: subtropical zone, “S Sub”: southern subtropical zone, “Tro”: tropical zone, “High”: highland climatic zone).
Land 12 01223 g003
Figure 4. (a) Spatial distribution of the mean NPP from 2001 to 2020. (b) Total NPP of different terrestrial vegetation in 2020. (c) The distribution of NPP of different vegetation in 2020. The data were logged due to the excessive difference in the total NPP values of different types of vegetation. (d) The mean NPP in different elevation and temperature areas.
Land 12 01223 g004
Figure 5. The distribution of NPP in (a) 2001, (b) 2010, and (c) 2020, (d) the trend of NPP, (e) the typical landcover change, and (f) the trend of mean NPP for seven kinds of vegetation.
Land 12 01223 g005
Figure 6. The correlation analysis of vegetation NPP with (a) temperature, (b) precipitation, and (c) solar radiation. (d) Factors with the highest correlation with NPP changes (comparing temperature and precipitation).
Land 12 01223 g006
Figure 7. Quantitative analysis of the effects of (a) temperature and (b) precipitation changes on NPP changes in the Inner Mongolia grassland region, effects of (c,d) temperature and (e,f) precipitation changes on NPP changes in the Qinghai–Tibet Plateau grassland region. The points between the two scales in the horizontal coordinate indicate the change in NPP when the temperature or precipitation changes within this range.
Land 12 01223 g007
Table 1. Maximum LUE, NDVImax, NDVImin, SRmax, and SRmin of typical vegetation types (EBF is the abbreviation for the evergreen broadleaf forest, DBF is the abbreviation for the deciduous broadleaf forest, ENF is the abbreviation for the evergreen needleleaf forest, DNF is the abbreviation for the deciduous needleleaf forest).
Vegetation Typeεmax (gC·MJ−1)NDVImaxNDVIminSRmaxSRmin
EBF0.9850.6760.0235.171.05
DBF0.6920.7470.0236.911.05
ENF0.3890.6470.0234.671.05
DNF0.4850.7380.0236.631.05
Grassland0.5420.6340.0234.461.05
Cropland0.5420.6340.0234.461.05
Shrub0.4290.6360.0234.491.05
Table 2. Data sources needed for the model.
InputsSpatial
Resolution
Time
Resolution
Source
Temperature0.1°1 monthThe ERA5-Land dataset provided by (ECMWF)
Solar radiation0.2°6 hClimate Forecast System (CFS) dataset provided by (NCEP)
Precipitation0.1°1 monthGlobal Precipitation Measurement (GPM)
NDVI500 m16 daysThe MOD13A1 V6 product
Vegetation type500 m1 yearThe MCD12Q1 V6 product
Table 3. We compared the mean absolute error (MAE) between the CASA NPP and observed NPP, and the MAE between the MOD17 NPP and observed NPP on different datasets (Unit: gC·m−2·a−1).
CASA NPP and Observed NPPMOD17 NPP and Observed NPP
Vegetation TypeEMDICarbon Cycle DatasetFLUX
NET2015
SRDBCarbon Cycle DatasetFLUXNET2015SRDB
ENF92.677.3546.9 35.5122.6
EBF238.9336.2443.5470.2276.3508.9504.9
DNF70.1125.0 178.9
DBF138.4146.6229.3282.494.10132.3317.9
Shrub 42.2 74.9
Grassland 46.395.4 56.498.9
Table 4. Errors of the CASA model and EMDI dataset for various vegetation types and various climate zones (the unit of NPP and the unit of error are gC·m−2·a−1).
Forest TypeClimatic RegionNumber of SitesMean Observed NPPMean CASA NPPMAERMSE
EBFTropical31186.61351.00394.64430.88
Southern subtropical25848.401084.00405.36461.49
Subtropical180915.44900.93218.34274.10
Northern subtropical32674.53597.60186.48238.82
Southern temperate5636.00595.90132.10162.74
Highland9751.11423.23348.09412.26
DBFSouthern temperate12567.91569.64109.27147.93
Temperate29638.79553.03135.68175.15
Northern temperate5494.00526.50224.1229.71
ENFSouthern temperate4452.50471.2560.0083.76
Temperate6480.00503.0296.89120.15
Northern temperate5320.00427.00109.00127.89
DNFTemperate4422.50538.25124.68177.38
Northern temperate9452.77485.2749.8870.46
Disclaimer/Publisher’s Note: The statements, opinions and data contained in all publications are solely those of the individual author(s) and contributor(s) and not of MDPI and/or the editor(s). MDPI and/or the editor(s) disclaim responsibility for any injury to people or property resulting from any ideas, methods, instructions or products referred to in the content.