Article

Spatiotemporal Variation in Land Use and Ecosystem Services during the Urbanization of Xining City

School of Social Development and Public Policy, Beijing Normal University, Beijing 100875, China
*
Author to whom correspondence should be addressed.
Land 2023, 12(6), 1118; https://doi.org/10.3390/land12061118
Submission received: 7 April 2023 / Revised: 15 May 2023 / Accepted: 20 May 2023 / Published: 23 May 2023

Abstract

:
Based on the five phases of land use data from Xining corresponding to 1980, 1990, 2000, 2010, and 2020, we used the equivalent factor method to analyze the values of spatial-temporal variation characteristics of land use and ecosystem services in Xining. The results showed that (1) farmland and developed areas were the most active types of land, and the continuous occupation of farmland and developed areas led to the formation of a kind of “cross shape” in the spatial pattern of conversion of land use types along the Huangshui River, Beichuan River, and Nanchuan River from south to north and from northwest to southeast, respectively, with the central urban area serving as a core of the pattern; (2) the transformation between different land use types mainly occurred in the land-slope range between 0–15° and altitudes between 2000–2750 m; and (3) the ESV of Xining increased by RMB 2165.26 × 106 in the past 40 years. The period from 2000 to 2020 was the main growth period of the ecosystem service value of Xining. Urbanization had a great impact on the variation in land use types and the evolution of ecosystem service values. In the middle and late stages of urbanization, different types of land use changed significantly within each county and district. The ecosystem service values of the central districts were low, with those of the marginal districts and counties being higher, forming a “core-periphery” trend and a phenomenon of hollowing ESV. (4) The spatial agglomeration effect of the ESV per unit area was continuously enhanced in Xining. The high-high (slope-altitude) type of area was distributed in the north and west of Xining, whereas the low-low type of area was distributed in the urban area at the intersection of major rivers in the southeast of Xining.

1. Introduction

Land use and cover change (LUCC) plays an important role in global environmental change due to its effect on the water cycle, climate, and biodiversity. LUCC also changes the service supply capacity of ecosystems to some extent, profoundly affecting sustainable development and human welfare [1,2]. Therefore, LUCC has become a core component of global land use research. Since China’s reform and opening up, the structure of land use types has grown complex and diverse, and the rate and range of land use changes have been further enhanced with the rapid development of industrialization and urbanization. As a result, various urban or environmental issues have become a consideration with respect to variations in land use. Exploring the spatial and temporal variation in land use has become a key to revealing the ecological and environmental effects caused by land use changes due to human activities.
Ecosystem service values (ESVs) encompass all kinds of tangible and intangible benefits that humans derive from ecosystems directly or indirectly [3,4], including supply services, support services, regulating services, and cultural services. Variations in the purpose, mode, and condition of land use by humans in different periods and regions lead to changes in the types of land use [5], along with changes in ecosystem service capabilities [6,7,8]. The impacts of these land use processes include changes to the ecosystem services, which vary by different types, patterns, and intensities of land use [2]. Costanza evaluated the global natural assets covering 17 ecological factors of 16 kinds of ecosystems through the scale of ecosystem service values [9], which led to a boom in estimating the value of ecosystem services in research. In the process of using Costanza’s method of ecosystem service value estimation to evaluate China’s ecological assets, Xie Gaodi and others found that some problems existed, such as an undervaluation of farmland and an overvaluation of wetland [10]. Based on the situation of China’s land use and ecological environment, as well as the opinions of a large number of ecological experts, six types of ecosystems, including forests, grasslands, farmlands, wetlands, rivers, lakes, and deserts, were divided into nine types of ecological services, and the evaluation table of ecological service value per unit was revised.
Researchers have since carried out numerous studies on the value of ecosystem services at different geographical scales in China, considering urban agglomerations [11,12,13], specific provinces or cities [14,15,16,17,18,19], arid and semiarid areas [20,21,22], and watersheds [23,24,25]. Land use and ecological value changes in the process of urbanization are a hot research topic. The research has found that urbanization has triggered significant ecological and environmental aspects of land use changes [26], and there are significant spatial differences [27]. The changes in ecological service value caused by land use in different regions vary, even leading to neighborhood and land right changes [28,29].
The Qinghai-Tibet Plateau is the “third pole” on the earth. It has a significant impact on global climate change and global sustainable development [30] and is currently in the process of rapid urbanization. As the economic, cultural, and political center of Qinghai Province, Xining plays the function of a central city that drives all cities in Qinghai Province and even the whole Qinghai-Tibet Plateau. Moreover, as an important node city in the construction of the national plateau ecological barrier, Xining is also the city with the largest population in the Qinghai-Tibet Plateau. With the development of industrialization and urbanization, there has been an accelerated expansion of urban space, newly established economic and technological development zones, and other urban functional areas in Xining, which has resulted in the active transformation of land use types. In the context of increasing pressure among the population, resources, and the environment, a comprehensive assessment of the spatial and temporal variation in land use and ecosystem service value in Xining is beneficial to revealing the management of land use and eco-environmental effects on the Tibetan Plateau. However, current studies on the ecosystem service value of Xining are focused on specific ecosystems, such as wetlands [31,32], which are not the main land use types in Xining and differ greatly from farmlands, developed areas, forests, and grasslands in terms of natural attributes or ecosystem service functions. Xining is in the phase of medium and rapid urbanization, with a large population gathering and accelerated urban expansion, which is certain to affect the distribution of the land types.
Taking Xining City, the largest city on the Qinghai-Tibet Plateau, as a case study, studying the value of land use and ecological services can not only reveal the changing mechanism of the relationship between land use and ecological services during the process of plateau urbanization, but it may also provide policy inspiration for promoting sustainable development on the plateau. We aim to reveal the relationship between urbanization, land use, and ESV in a typical city on the Qinghai-Tibet Plateau and try to answer the questions of how urbanization has influenced the spatial and temporal characteristics of land use and ESV and what the commonalities and differences are between these characteristics and those of other regions in China and the world. Based on five periods of land use data from 1980 to 2020, this paper analyzes the spatial and temporal patterns of land use transformation and the evolutionary characteristics of ecosystem service value in Xining to provide a quantitative basis for land resource utilization and ecological environmental protection in Xining.

2. Data and Methodology
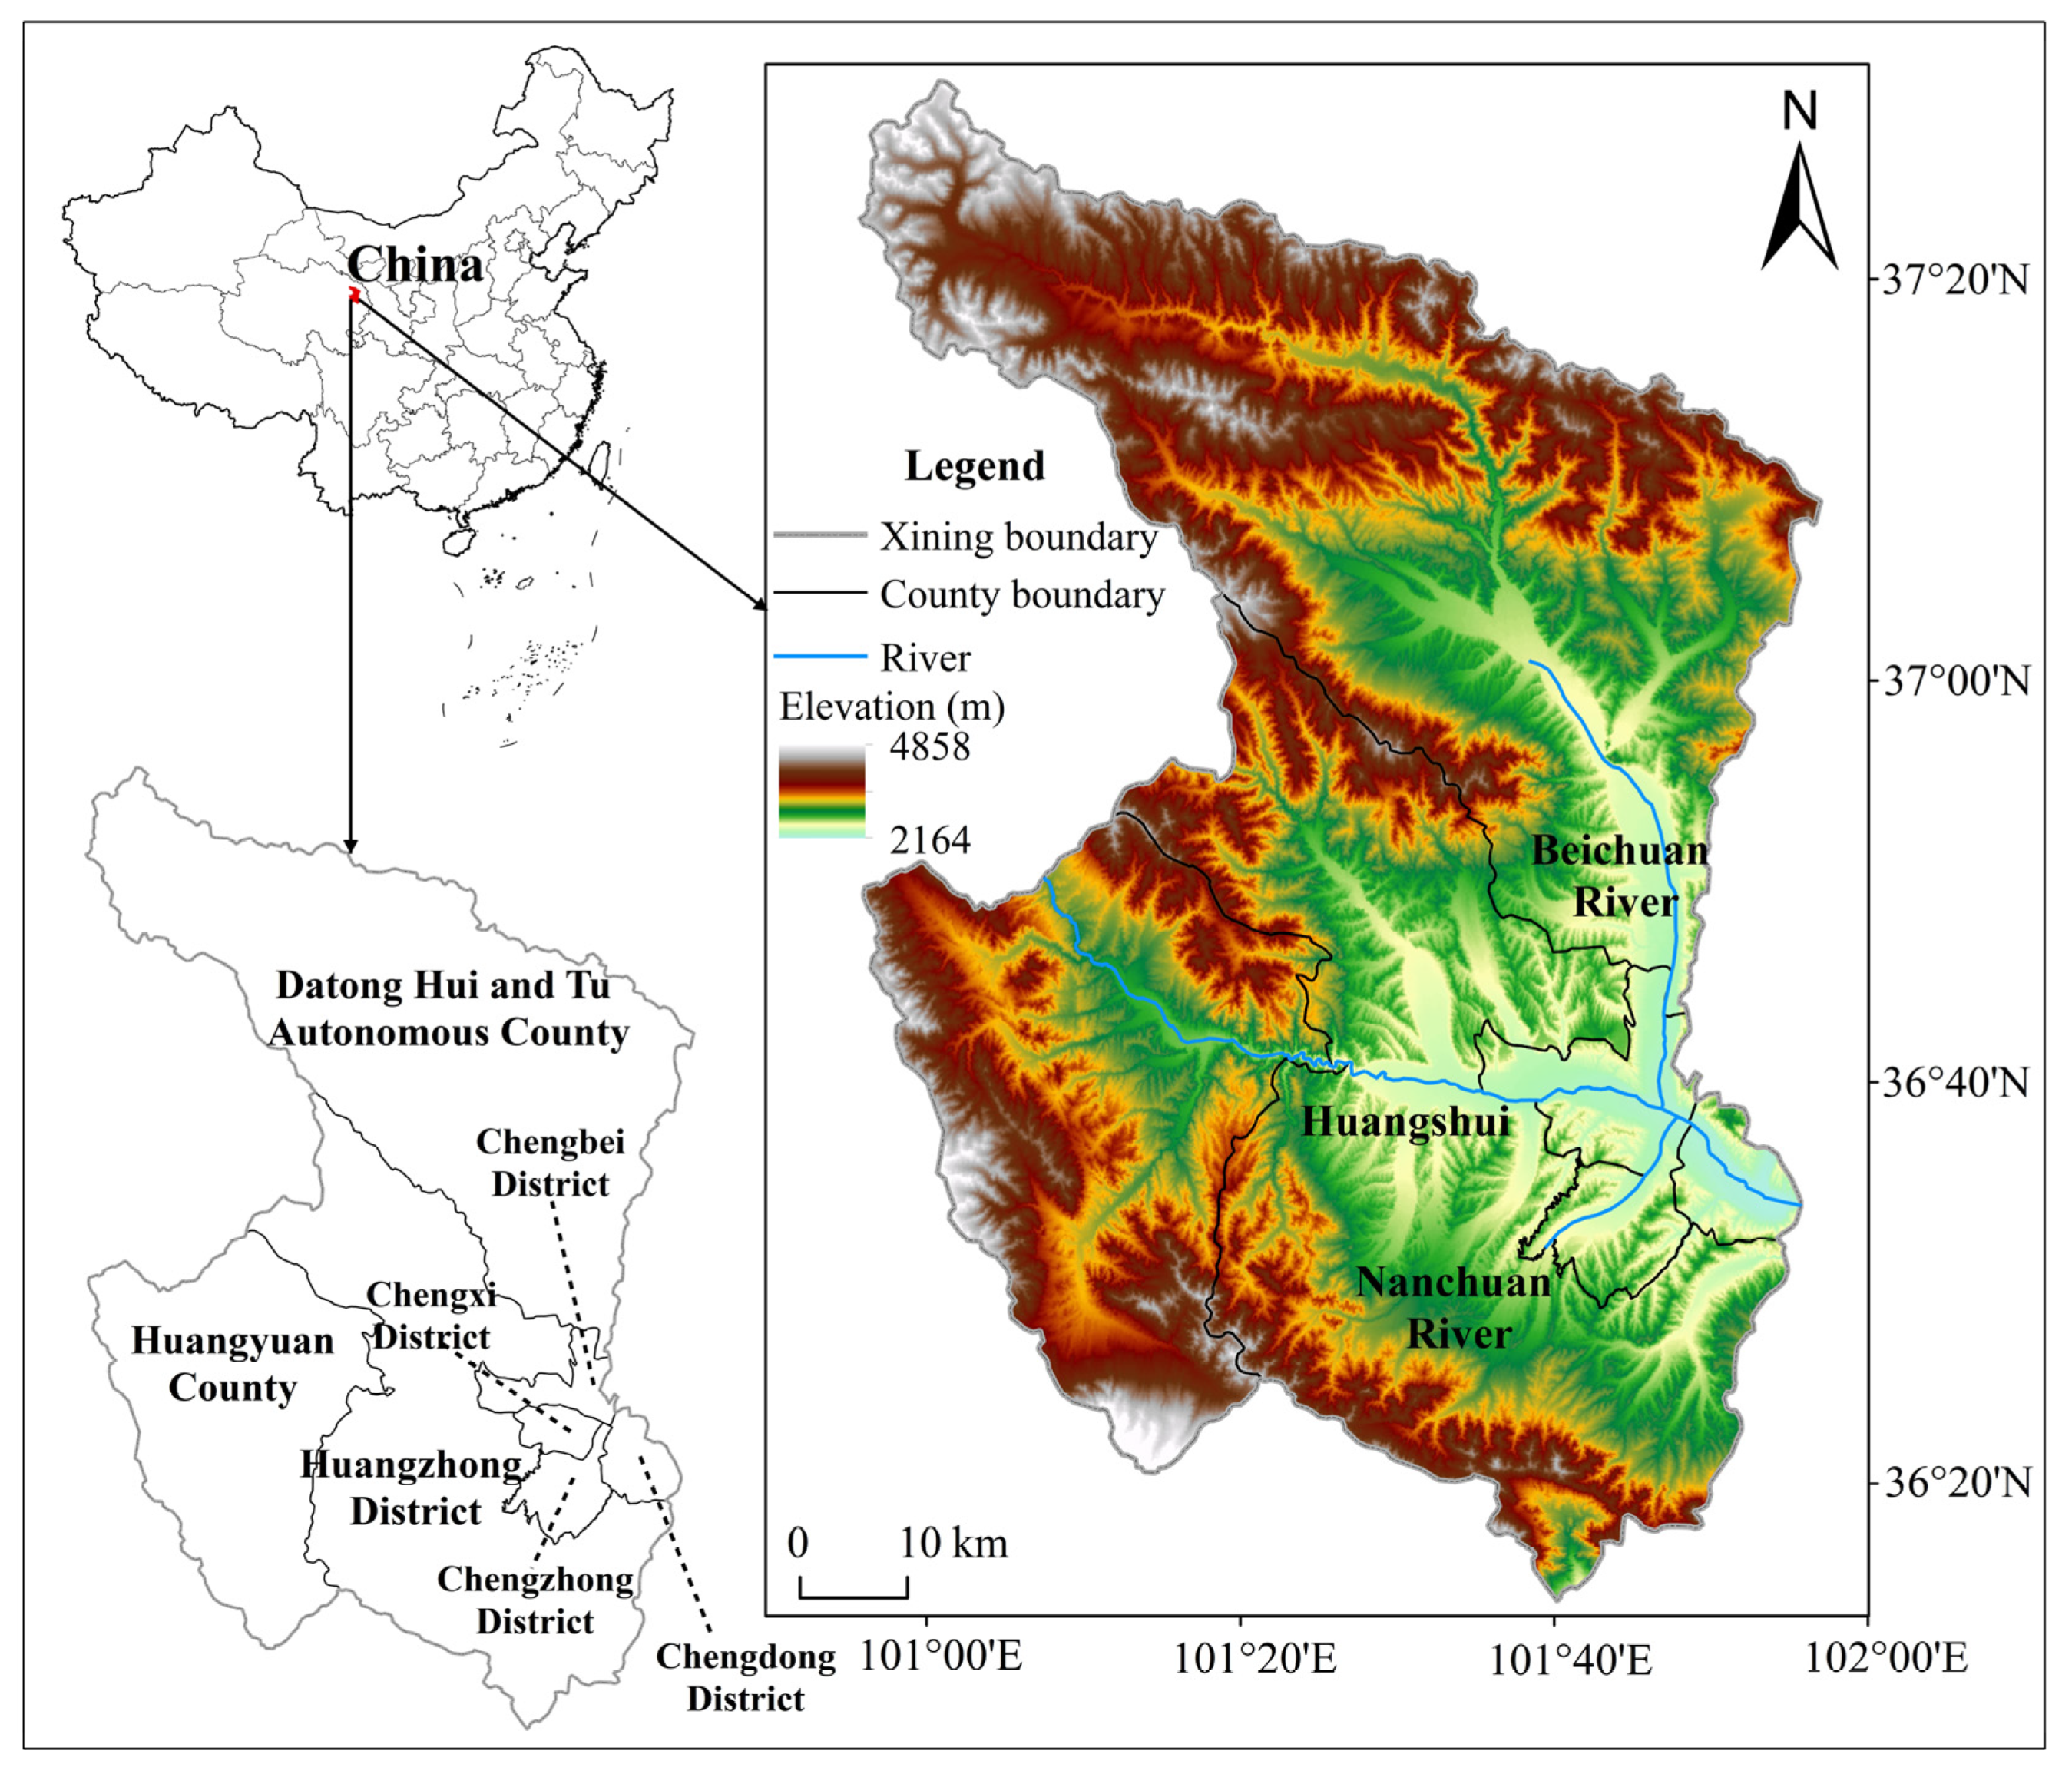
2.1. Research Area

Xining City is located in the northeastern Qinghai-Tibet Plateau, between 36°13′–37°28′ N and 100°52′–101°54′ E (Figure 1). The terrain is high in the southwest and low in the northeast, with alluvial plains, hills, and mountains as the main landform types. The Huangshui River and its tributaries, such as the Beichuan River and the Nanchuan River, run through Xining from the west, north, and east, respectively, which forms a valley zone of a “cross” in which the central urban area is distributed along the river, and agriculture and industry gather. Xining has a semiarid climate, with an average annual temperature of ~5.5 °C and an annual precipitation of ~500 mm. As the capital city of Qinghai Province, Xining borders Haidong City, Haibei Tibetan Autonomous Prefecture, and Hainan Tibetan Autonomous Prefecture, which govern five districts and two counties, including the Xining (National) Economic and Technological Development Zone, with a total of 2.468 million permanent residents and an urbanization rate of 78.63% in 2020. As the core city of Lanzhou-Xining, urban agglomerations and the pivotal logistic routes bear the growing burdens of trade and service, which has caused Xining to accelerate its urban expansion and construction. Human activities have caused significant pressure on the ecological environment, such that the structure of the land use has changed significantly.

2.2. Data Sources

The vector land use data of Xining in 1980, 1990, 2000, 2010, and 2020 were collected from the Resource and Environment Science and Data Center of the Institute of Geographic Sciences and Natural Resources Research [33]. The land use types in these series of data include six primary types: forests, grasslands, water areas, unused lands, farmlands, and developed areas, as well as several secondary types of land. The grain price data required calculating the ecosystem service value of Xining by the equivalent factor method between 1980 and 2020, as obtained for the corresponding years from the China Agricultural Production Costs and Returns Compilation. The Consumer Price Index (CPI) is obtained from the National Bureau of Statistics. The precise figures for grain yield and planting area are derived from the Xining Statistical Yearbook for each period.

2.3. Research Methods

2.3.1. Land Use Transfer Matrix

The land use transfer matrix is typically used to reveal the characteristics of the evolution of the land use structure between different periods, reveal the direction and specific area size of the transformation between different types of land use, and predict trends in land use variation. The calculation matrix is as follows:
S i j = S 11 S 21 S n 1 S 12 S 22 S n 2 S 1 n S 2 n S n n
where S and n are the area (km2) and the number of land use types, respectively, and i and j are the initial and final land use types, respectively, over time. Based on matrix (1), the land use transfer for the whole area of Xining from 1980 to 2020 and a matrix for each decade of the main land use types can be constructed.

2.3.2. The Revised Equivalent Factor Method

With Xie Gaodi’s equivalent factor method, we calculate the ecosystem service value for various types of land use in Xining between different periods based on the equivalent value scale per unit area. The equivalent factor method equates an equivalent factor of the standard ecosystem service value to 1/7 of the market economic value of grain crops produced per unit area (1 hm2) of farmland [10]. A large number of studies have used the average food price of years or a particular year as the basis for calculating the equivalent factor value. In fact, these studies assumed that if the local area of the same land use type in a region remains constant over many years, the interannual variation in its own ecosystem service value would be small or even zero, ignoring the natural disturbances caused by price increases and changes in the value of ecosystem services over time, which affect the accuracy of ecosystem service value calculations [18,34]. Therefore, drawing on the revised methodology of relevant studies on ecosystem service value, we use the CPI index to eliminate the impact of price increases on the ecosystem service value within the study time series [35,36]. A standard equivalent factor of ecosystem service value is calculated according to Formula (2) for Xining within the corresponding year:
F n = 1 7 p n q n
where n is a specific year, such as 1980, 1990, 2000, 2010, or 2020; F n is the standard ecosystem service value equivalent in the specific year (RMB/yuan); and p n and q n are the sale price of grain crops (RMB/kg) and grain crop yield per unit area (kg/hm2) in the specific year.
We analyzed the transformation of forests, grasslands, water areas, unused lands, farmlands, and developed areas in Xining, as well as the spatiotemporal characteristics of the ecosystem service value. The value equivalents of forests, grasslands, watersheds, unused lands, and farmlands correspond to those of forests, grasslands, water extent, deserts, and farmlands, respectively, in the table of ecological service equivalents per unit area of terrestrial ecosystem of Xie Gaodi’s [10]. Many studies have determined the value equivalent of a developed area and its urban developed area, rural developed area, and other developed areas to be zero, excluding it from the scope of accounting for the ecosystem service value [17,18,36]. However, since the concept of ecosystem service value was first presented, it has been richly embraced by the field, encompassing types of ecological services such as provisioning services, regulating services, supporting services, and cultural services. Compared to other types of land use, developed areas reduce the ecosystem service value from natural resource-based factors such as water regulation, waste disposal, and biodiversity, and thus have a negative impact on the overall ecosystem service value of the region. Therefore, based on the total amount and structure of developed area in Xining and previous research results [35], we assigned a value equivalent to developed area and incorporated it into the calculation framework of the ecosystem service value. The value equivalents of the above major land use types were revised according to the biomass factor of the agricultural ecosystem in Qinghai Province (0.40) to obtain the value equivalents of ecosystem services for various land use types in Xining (Table 1) [37].
Based on the standard equivalent factors of the ecosystem service value and data on land use types for each major year in Xining, the ecosystem service value is calculated for different periods according to Equation (3):
E S V = r = 1 m A r V C r
where E S V is the ecosystem service value; m is the number of land use types; A r is the area of the ‘ r ’-th land use type (km2); and V C r is the value of ecosystem service per unit area of the ‘ r ’-th land use type (Yuan/km2). Finally, the CPI index is used to revise the ESV per unit area to obtain the ecosystem service value in Xining each year.

2.3.3. Spatial Autocorrelation

Spatial autocorrelation is used to reveal the extent to which an element is spatially distributed, including global autocorrelation and local autocorrelation. Global spatial autocorrelation reflects the characteristics of the whole spatial pattern, but it cannot identify the location of specific clusters in the space. The concept of a local indicator of spatial association (LISA) was proposed by Anselin [38]. This index is used to prove whether local regional spatial autocorrelation exists and to identify the specific distribution location of different clusters in space. By evaluating the size of the observation value of each observation point relative to the average value and the significance of the observation value, they are comprehensively divided into different agglomeration types, such as high-high, low-low, high-low, low-high, and insignificant. High-high or low-low spatial clustering are the spatial clustering types of observation points whose observed values are relatively higher (or lower) than the average value, and the Z-value test is significant. High-low spatial outliers refer to the type of observation points that are significantly tested by the Z value, and the observed values are relatively higher than the average value and are surrounded by observation points that are significantly tested by the Z value, but the observed values are lower than the average value in space. Meanwhile, low-high spatial outliers imply just the opposite. The calculation formulas are as follows:
G l o b a l   M o r a n s   I = n i = 1 n j = 1 n w i j ( x i x ¯ ) ( x j x ¯ ) ( i = 1 n j = 1 n w i j ) i = 1 n ( x i x ¯ ) 2
L o c a l   M o r a n s   I = n ( x i x ¯ ) j = 1 n W i j x j x ¯ j = 1 n ( x i x ¯ ) 2
where n is the number of spatial units; x i and x j are the observed values of an element in the ‘ i ’-th and ‘ j ’-th spatial units, respectively; x ¯ is the mean of the elements within the spatial units; and w i j is the spatial weight matrix. The value range of global Moran’s I is [−1, 1]. Specifically, a value greater than zero indicates a positive correlation, which signifies that high- or low-value areas of ecosystem services are spatially clustered. A value less than zero indicates a negative correlation, i.e., high- and low-value areas of ecosystem services are spatially dispersed. Local Moran’s I is tested by p and Z values, with p < 0.05 indicating a significant correlation. When p < 0.05 and Z > 0, there is a significant positive correlation; when p < 0.05 and Z < 0, there is a significant negative correlation.

3. Results

3.1. Spatiotemporal Variation in Land Use in Xining

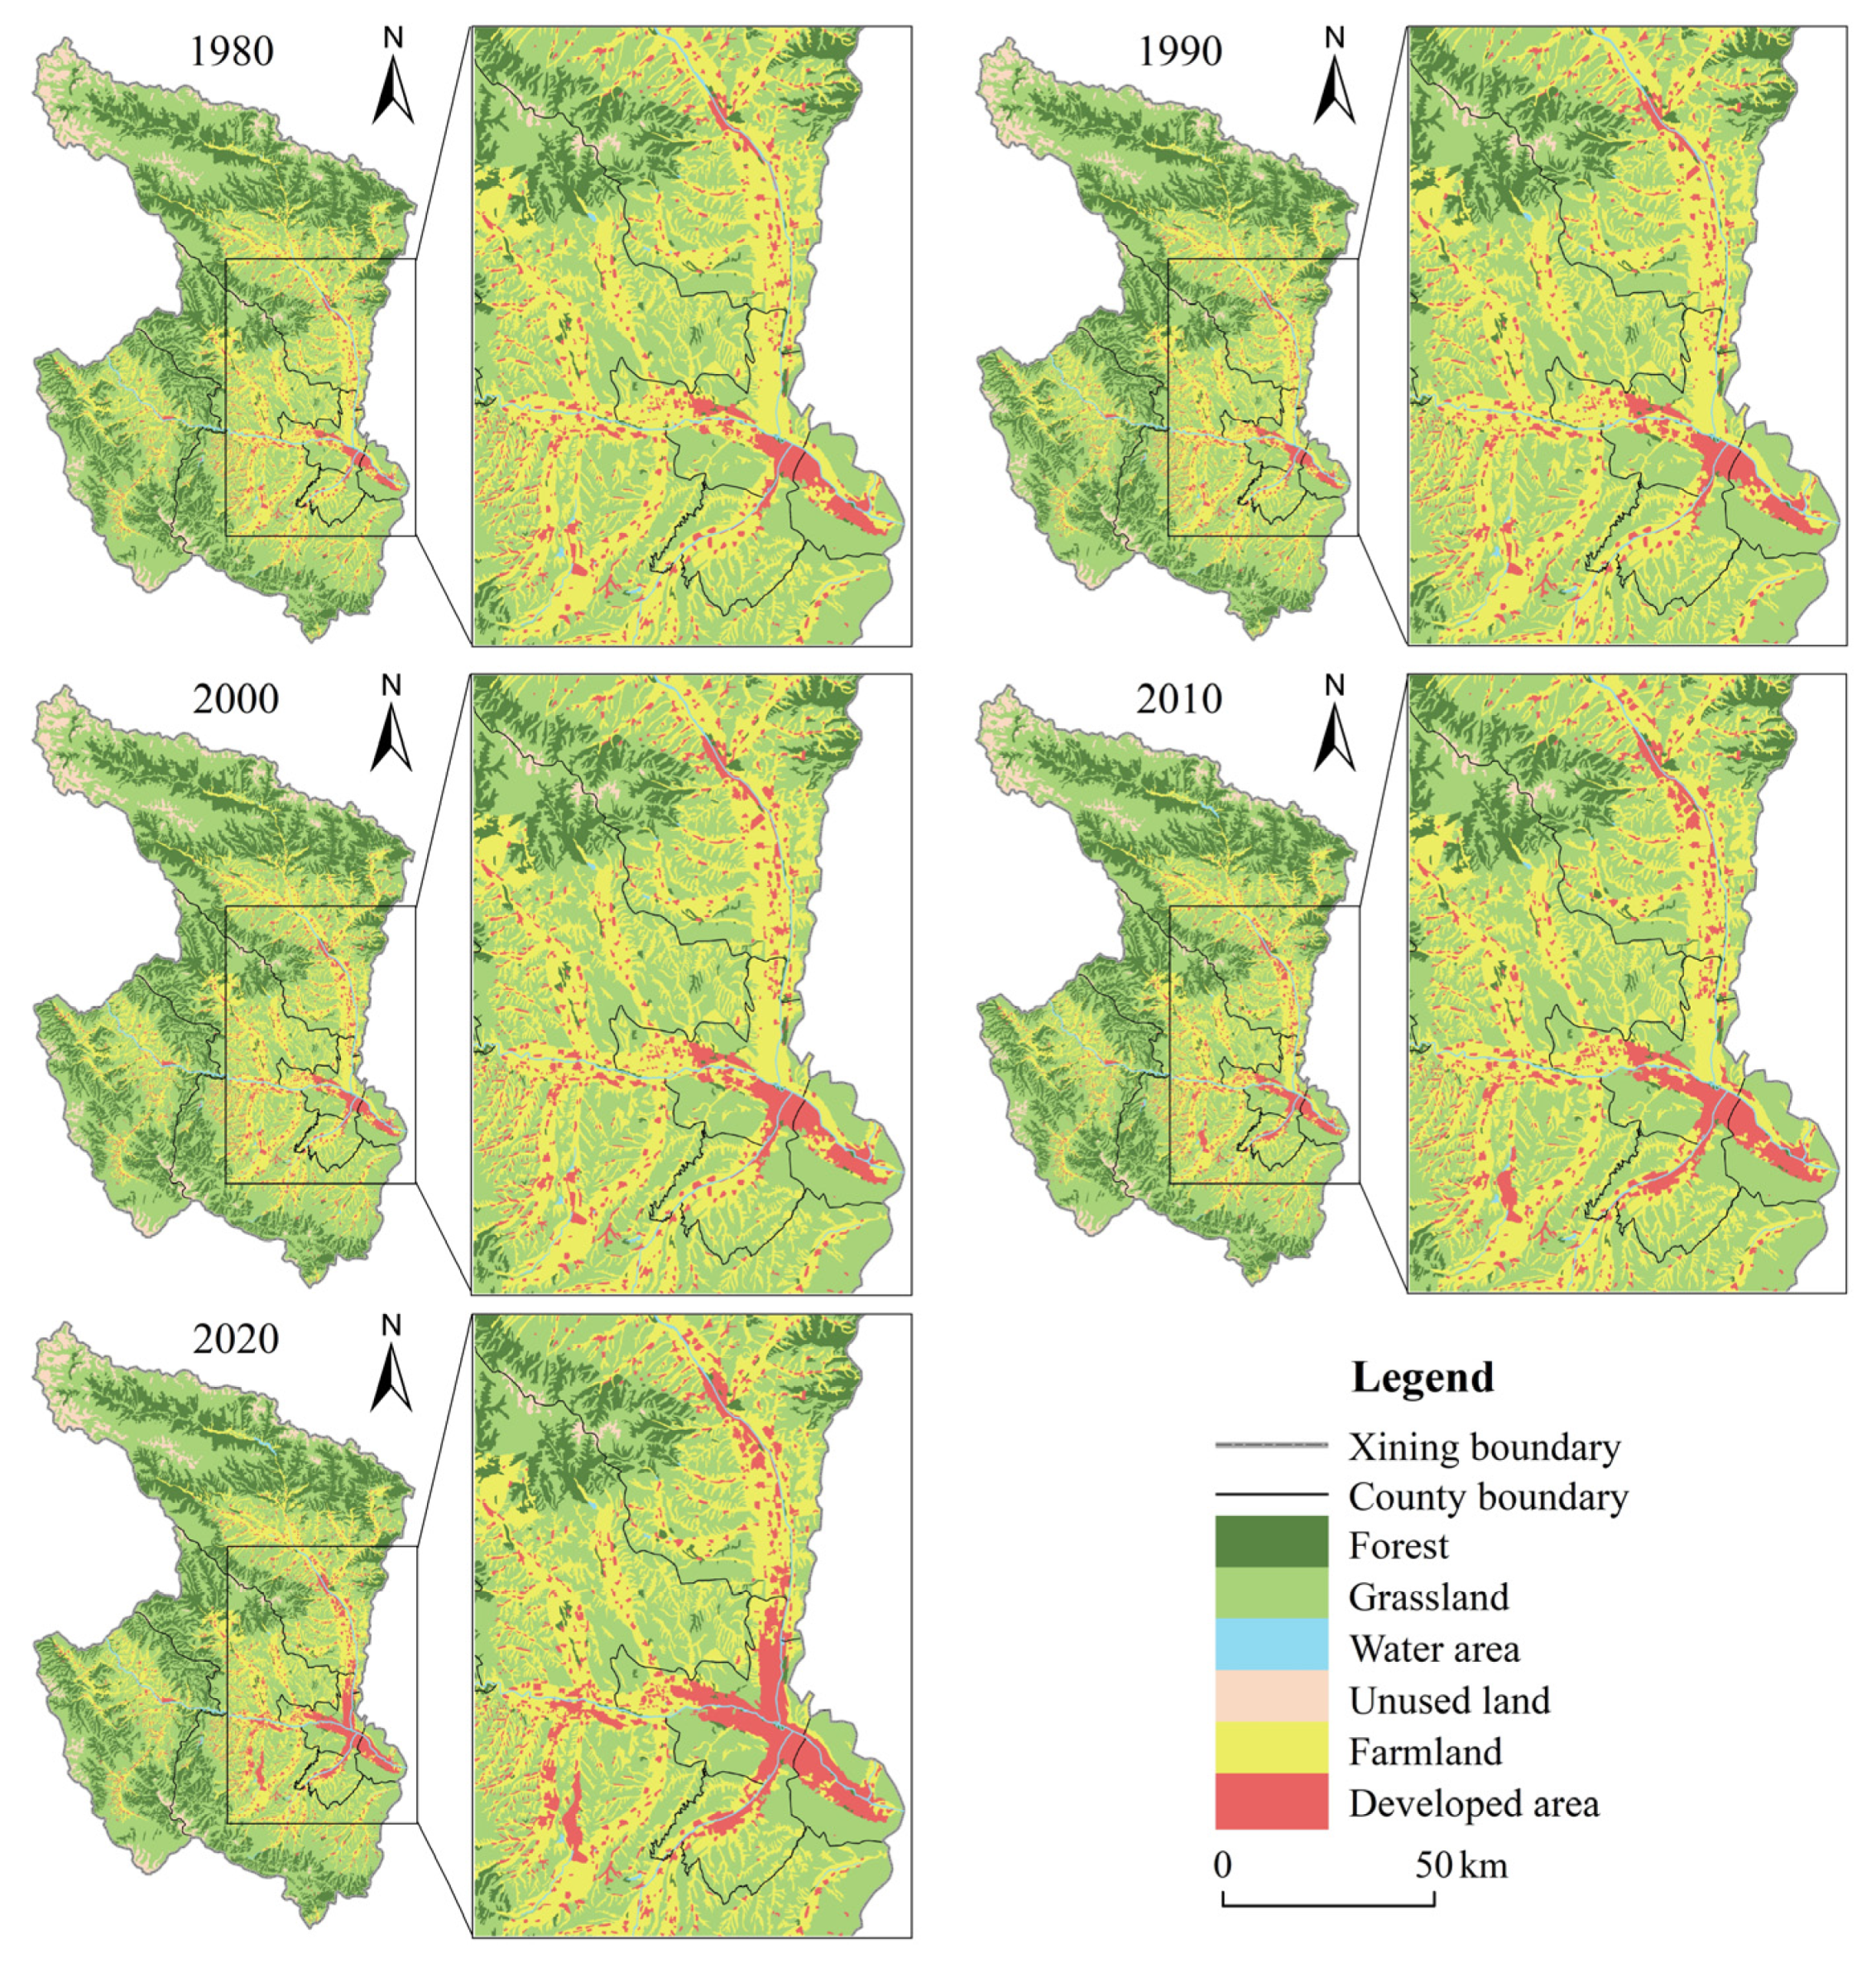
3.1.1. Spatial Variation in Land Use

The main types of land use in Xining are grasslands, forests, and farmlands, with the three types of land use accounting for more than 90% of the total area of Xining year-round. Grassland, as the main land use type in Xining, occupies more than 50% of the total area each year, followed by forest, whereas water area is the land use type with the smallest area and the lowest proportion of the total area among all types of land use in Xining. The interannual variation in different land types varied significantly over time, with forests, water areas, and unused land being the land use types with relatively stable annual variation over the past 40 years, with an increase or decrease in area of less than 2 km2 (Table 2). The annual variation in grassland, farmland, and developed area took the year 2000 as the nodal point. During the period from 1980–2000, the area of farmland and grassland decreased by 4.24 km2 and 11.89 km2, respectively, and the area of developed area increased by 17.27 km2. Between 2000 and 2020, the area of farmland further decreased by 93.17 km2, and the area of grassland changed from a decrease to an increase of 5.07 km2, with a significant increase in developed area of 86.61 km2.
During the period from 1980–2020, the farmland outflow and inflow areas of the total developed area were the largest, reaching 109.68 km2 and 104.43 km2, respectively (Table 3). The farmland outflow area accounted for 81.86% of the total area of all land use types transferred out in Xining, the inflow area of developed area accounted for 77.94% of the total land inflow area in Xining, and 90.17% of the farmland transferred out was converted into new developed area. Farmland and developed area became the land use types with the most drastic interannual changes among various land use types. Grassland, another land use type with unstable interannual changes in addition to farmland and developed area, was converted into 8.73 km2 of farmland, with a conversion rate of 56.19%. However, 7.15 km2 was converted from farmland to grassland, accounting for 82.02% of the total increased area of grassland. The transformation between grassland and farmland indicated that the return of farmland to grassland and the reclamation and use of grassland ran in parallel in Xining, but the total area converted between the two land use types was almost equal, and the effect on the change in land use types in Xining was far less than the change in land use types from farmland to developed area. The total inflow and outflow area of water and unused land was less than 5 km2, with the lowest degree of transformation with other types of land use.
The values of each column represent the specific area and proportion of a certain type of land to be supplemented by the other types of land. Taking the first column of values as an example, a total of 1650.62 km2 of forests in 1980 were still forests by 2020, whereas the area of grasslands, water areas, unused lands, farmlands, and developed areas transformed into forests was 3.25 km2, 0.03 km2, 0.00 km2, 0.85 km2, and 0.00 km2, respectively. The total area of land converted into forests was about 4.12 km2, accounting for 3.08% of the total area of the six types of land supplemented by other types of land in Xining City from 1980 to 2020. In 2020, the total area of forest in Xining City was 1654.74 km2. The index of inflow (%) indicates that the area of grasslands, water areas, unused lands, farmlands, and developed areas converted into forests accounted for the proportion of the total area of non-forest land converted into forests. The interpretation of data from other rows and columns is similar.

3.1.2. Temporal Variation in Land Use

At the county scale, there were significant differences in the annual variation in land use types between districts and counties in Xining. The main land use types in Chengbei District changed from farmland to developed area, forming a land use pattern that focused mainly on developed area and placed equal emphasis on farmland and grassland (Figure 2). In Chengdong District and Chengxi District, grassland had always been the main type of land, and the trend of land use was that the farmland gradually decreased, whereas the developed area continued to expand. Datong Hui and Tu Autonomous County and Huangzhong District, as the first and second largest counties in terms of administrative area within Xining, had larger areas of grasslands, forests, and farmlands than those of other districts and counties, and the trend of land use variation was due to a decrease in farmland and an increase in developed area. Huangyuan County, as a peripheral county far from the economic development center of Xining, showed less annual variation in various land use types and became the only county in Xining that demonstrated an increase in the total area of farmland (instead of decreasing) in the past 40 years. The transformation of land use types in Chengzhong District was concentrated between 2000 and 2010, and the change in land use types was almost stagnant during the period from 2010–2020. As the government station and the economic, political, and cultural center of Xining City, Chengzhong District has a long history of land use development, and there is a serious shortage of non-developed area that can be converted into developed area that would not conflict with the red line of ecology, farmland, and urban development boundary. In Xining, the city formed a “cross-shaped” pattern of land use changes along the Huangshui, Beichuan River, and Nanchuan River as the core of the Chengzhong District, with farmland occupied by developed area.
As the altitude rose, the overall area of different types of land transformation in Xining increased and then decreased, showing a distinct inflection point at 2750 m (Table 4). The area of 2000–3000 m was a region of active land use transformation for all types in Xining, whereas the diversity of land use types decreased in the area of 2750–4000 m, as dominated by grasslands and forests. The land use status, therefore, maintained a subtle change between the existing land types. The area of 4000–5000 m remained highly stable between different land use types. There are clear altitude differences in the transformation of different land use types, with the transformation of farmlands, grasslands, and forests to developed areas concentrated in the relatively lower-altitude areas of 2000–2750 m. The conversion of grasslands and forests to farmlands mainly occurred within regions of 2500–3000 m and 3000–4000 m, which was closely related to the natural properties of grasslands and forests being distributed in higher altitude areas, leading to the maximum area of the transformation of grassland to forest and forest to grassland being located above 3000 m.
As the slope increased, the transformation area of different land use types in Xining also tended to increase and then decrease, showing opposite characteristics versus the land use conversion above and below a slope of 15° (Table 5). The most active transformation of different land use types occurred at slopes from 0 to 15°, whereas the area and rate of transformation of different land use types at slopes above 15° decreased significantly. The conversion of grasslands, farmlands, forests, and water areas into developed areas mainly occurred in flat areas with a slope of less than 6°, and these areas were also the main ones where other land types were converted to farmland. The conversion between grassland and forest was more obvious in mountainous areas with a slope above 15°. From 1980 to 2020, the change in land use types in Xining at different altitudes and slopes showed that flat slopes and gentle slopes of 2000–2750 m and slopes of 0–15° were the main areas of transformation in land use type in Xining.

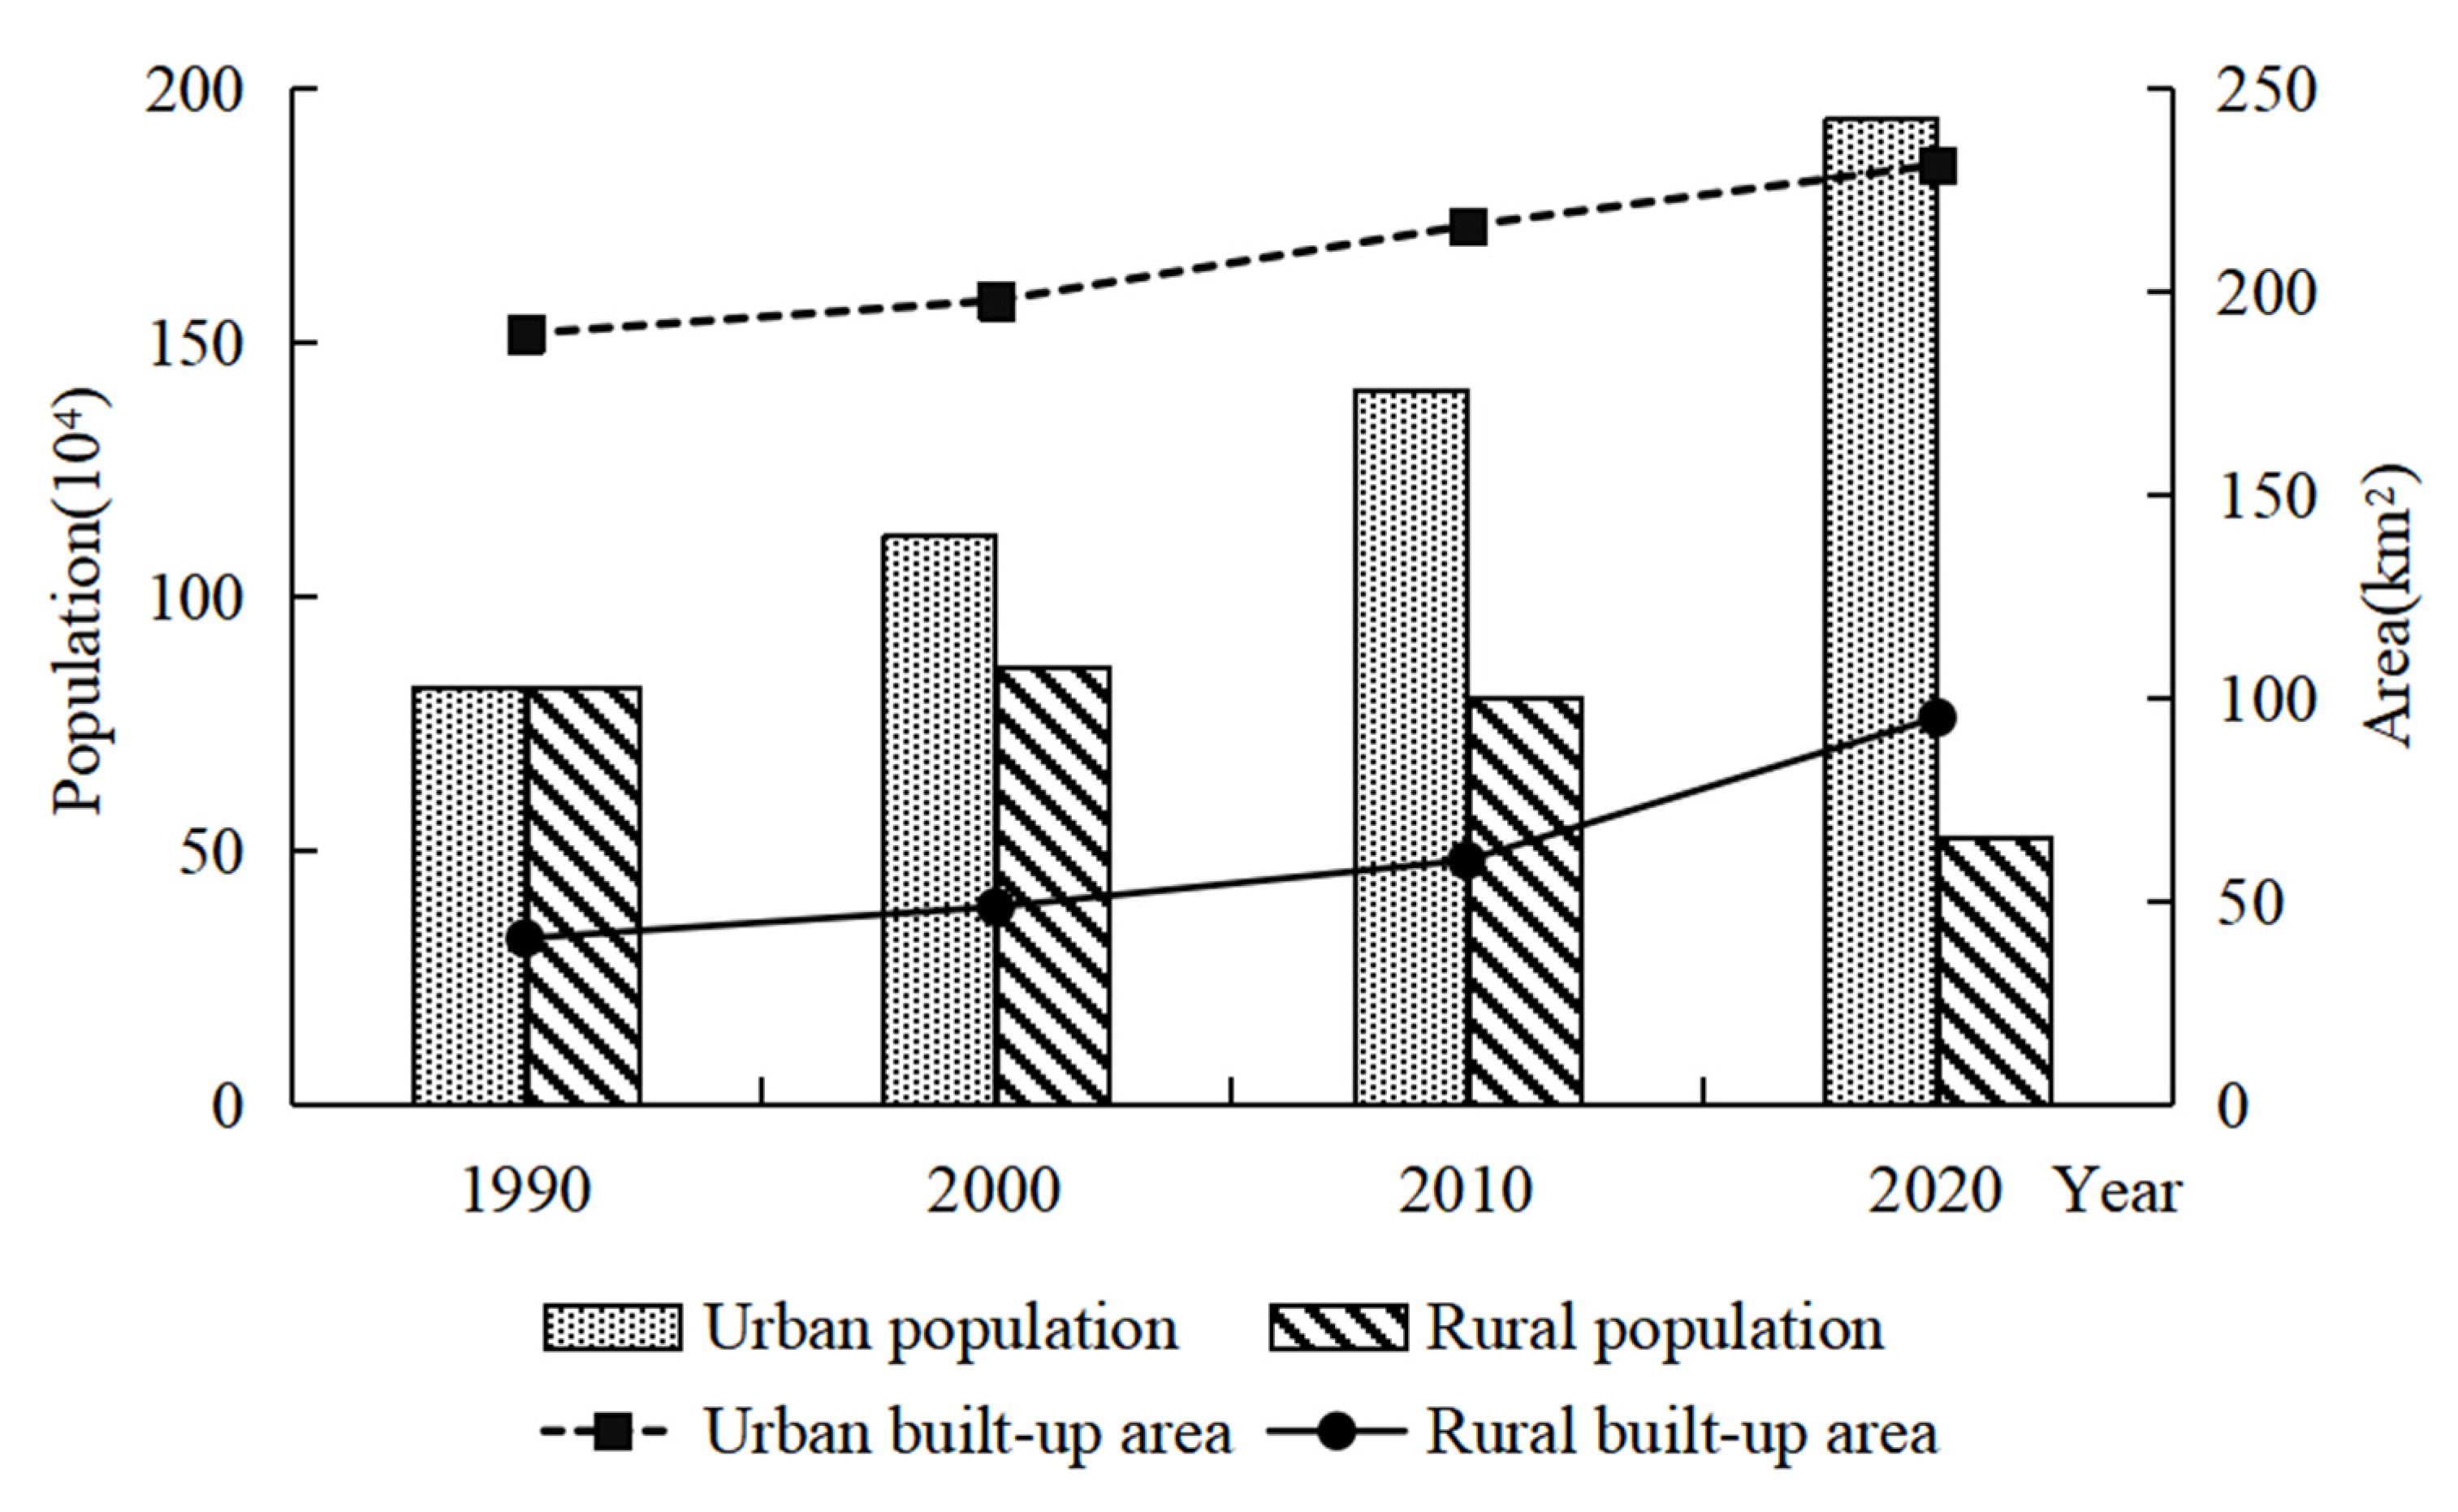
3.2. Spatiotemporal Variation in Developed Area and Farmland

During the period from 1980–2020, the most significant land use changes in Xining affected the developed area and farmland. Developed areas include urban land, rural residential land, and other developed areas. The annual variation in the area of other developed areas was less than 7 km2, with an increase of only 3.41 km2 between 1980 and 2020 (Table 6). The transformation in developed areas in Xining was mainly caused by the increase in urban developed area and rural developed area, and the annual trend of the two were divided into a period of small slow growth between 1980 and 2000 (only an increase of 5.83 km2 and 9.6 km2, respectively) and a period of large high growth during the period from 2000 to 2020 (an increase of 51.64 km2 and 33.41 km2, respectively). Although the overall growth trend of urban and rural developed areas was maintained, and rural developed areas were still the main part of developed areas in Xining, the growth and change in rural residential land has shown a declining trend. After reaching a peak of 18.43 km2 per decade (urban developed area increased by 16.48 km2 during the same period), the increase in rural developed area was only 14.98 km2 between 2010 and 2020, whereas urban developed area increased by 35.16 km2. The rapid growth of urban developed areas and the slowing growth of rural developed areas were closely related to the rising level of urbanization in Xining. According to national census data, the urbanization rate of Xining reached 78.63% in 2020, an increase of 14.93% compared with 2010. The process of urbanization included population urbanization and land urbanization. The high concentration of the population further expanded the demand for urban land in towns and cities, resulting in the increase in and growth of urban developed areas gradually overtaking rural developed areas during the period from 2010–2020.
There were significant differences in the transformation patterns of farmland into urban developed areas or rural developed areas between different years. During the period from 1980–1990, the area of farmland converted into developed area was less than 5 km2 (Table 7), with the increased area of urban developed area slightly higher than that of rural developed area. However, during the 1990–2000 period, the trend of converting farmland into developed area became more significant, with the area of farmland encroached upon by rural developed area being approximately three times larger than the area of farmland occupied by urban developed area. Between 2000 and 2010, farmland continued to be replenished in small amounts as compared to urban developed areas, as the area of farmland occupied by rural developed areas increased significantly. During the period from 2010–2020, the structure of the main land use type of transformation from farmland into urban or rural developed areas changed significantly, with the longstanding transformation of farmland in Xining into mainly rural developed areas followed by the increase in urban developed areas, resulting in the transformation of farmland into urban developed areas being dominant and the transformation of farmland into rural developed areas being a secondary trend. The area of newly added rural developed area from farmland decreased for the first time, whereas the urban developed area accounted for 34.25 km2 of farmland, even exceeding the total area of newly added urban developed area between 1980 and 2010.
The fluctuating land area of urban developed areas and rural developed areas was influenced by the interannual increase and decrease in urban and rural populations, and the urban and rural developed areas in Xining increased each year during 1990–2020. The urban population continued to increase during the same period, whereas the rural population decreased each year after reaching an extreme value in 2000 (Figure 3). The change in the urban and rural populations mainly occurred from 2010 to 2020, with the increase in urban developed area exceeding the other years during this period, whereas the increase in rural developed area decreased for the first time. A total of 0.1102 million urban civilians and 0.46 million rural civilians were added per 1 km2 of new urban and rural developed area, respectively, between 1900 and 2000, whereas during the period from 2010–2020, the urban population increased by 15,200, and the rural population decreased by 18,300 for each additional 1 km2 of urban and rural developed area. The density of the urban population distribution (10,000 people/km2) and rural population distribution (10,000 people/km2) in the developed area increased from 4.64 times in 1980 to 8.95 times in 2020, and the discrepancy between the urban and rural developed area distribution and urban and rural population distribution in Xining was very distinct.

3.3. Spatiotemporal Variation in Ecosystem Service Value

3.3.1. Temporal Variation in Ecosystem Service Value

The ecosystem service value of Xining has fluctuated over the last 40 years, with the ESV experiencing a small rise and fall between 1980 and 2000 before reaching the lowest value of RMB 1692.68 × 106 (Table 8), then reaching the highest value of RMB 4375.47 × 106 in 2010 before again decreasing in 2020. During the period from 1980–2020, Xining’s ESV increased by a total of RMB 2165.25 × 106, with 1980–2000 being a period of negative growth of Xining’s ESV and 2000–2020 being a period of net growth. Forest and grassland were the main components of land use types in Xining, and they were also the main contributors to the added ecosystem service value. Farmland was second only to grassland in its contribution to the total ESV, whereas water area and unused land had a weaker impact on the annual variation in ESV increase or decrease. Developed areas continued to reduce the total ESV in Xining, and due to varying degrees of reduction in the ESV of other land use types between 2010 and 2020, the reduction in the ESV of developed areas increased, because the population in Xining had been increasingly concentrated in urban areas over the past decade, with urbanization levels rising rapidly and occupying large amounts of farmland.
Changes in the value of ecosystem services within the region were mainly due to the transformation between high- and low-ESV land use types and the constant area of the same type of land, contributing to a net appreciation of ESV reaching 91.08% over the past 40 years, making it the main contributing land use type to the growth in ESV in Xining. However, the true contribution of forests and grasslands to increasing the total ESV in Xining was 85.45%, and there was a transformation from high ESV land use types to low ESV land use types, resulting in the total increase in ESV in Xining being less than the net increase. Developed areas were rarely converted to other types of land use, and developed areas came to occupy a large amount of farmland, resulting in a loss of RMB 135.95 × 10⁶ for ESV in Xining, with a total contribution rate of 95.27% to the reduction in ESV (Table 9). The area of mutual conversion from one to another land use type was relatively small, and the effect on increasing or decreasing the total ESV in Xining was not significant. Overall, the basic stabilities of forest and grassland areas were the main cause for the increase in ESV, and the occupation of farmland by developed areas had a negative effect on ESV in Xining. Maintaining the stable spatial distribution and area of the main land use types (forest and grassland) and reasonably controlling urban expansion are the keys to enhancing the value of ecosystem services in Xining. This situation also reflects the effectiveness and necessity of implementing ecological and environmental protection policies.

3.3.2. Spatial Variation in Ecosystem Service Value

The spatial distribution of the ecosystem service value in Xining was unbalanced, with spatial variation showing an incremental structure of “core-periphery” and a hollowing phenomenon of ecosystem service value. With the intersection of the Huangshui River, Beichuan River, and NancHuan River as the core, Chengbei District, Chengdong District, and Chengxi Districts adjacent to the core were low-value areas for ecosystem service within the typical value of Xining land, representing the main areas where ecosystem service values changed from positive to negative. The three districts of Chengbei, Chengdong, and Chengxi shared the characteristics of a narrow administrative area, a large proportion of low-altitude areas (below 2750 m), and flat areas (with a slope of 0–15°). In these districts, land use types with high ESV were not the majority of land use types, and they showed statuses as being in the middle and late stages of accelerated urbanization, with developed areas continuing to occupy farmland to the extent that the ESV was decreasing or even transitioning from positive to negative. The transformation rate of various land use types in Chengzhong District between 2010 and 2020 decreased, resulting in the variations in ESV in Chengzhong District tending to be stable in the last ten years. Huangzhong District, Datong Hui and Tu Autonomous County, and Huangyuan County, which are far from the core area where the Nanchuan River, Beichuan River, and Huangshui River intersect and are located in the peripheral area, became high-value areas for the ESV in Xining. Huangzhong District, Datong Hui and Tu Autonomous County, and Huangyuan County have a large area, with grasslands and forests as the main land use types, and most of the areas are above 2750 m in elevation and over 15° in slope, representing areas in which the degree of mutual conversion between various land use types was relatively low. Therefore, Huangzhong District, Datong Hui and Tu Autonomous County, and Huangyuan County maintained a high ESV year-round. As the main rivers in Xining, the Huangshui, Nanchuan River, and Beichuan River are located in the area of high population concentration and economic development, but by 2020, the ESV of Chengbei District, Chengdong District, and Chengxi District was already negative, a phenomenon of hollowing ESV in Xining, whereas the ESV of the remaining districts and counties in the periphery was higher than that of the core areas, forming a spatial structure of increasing ESV from the core area of the valley area where the main rivers intersect to the periphery (Table 10).

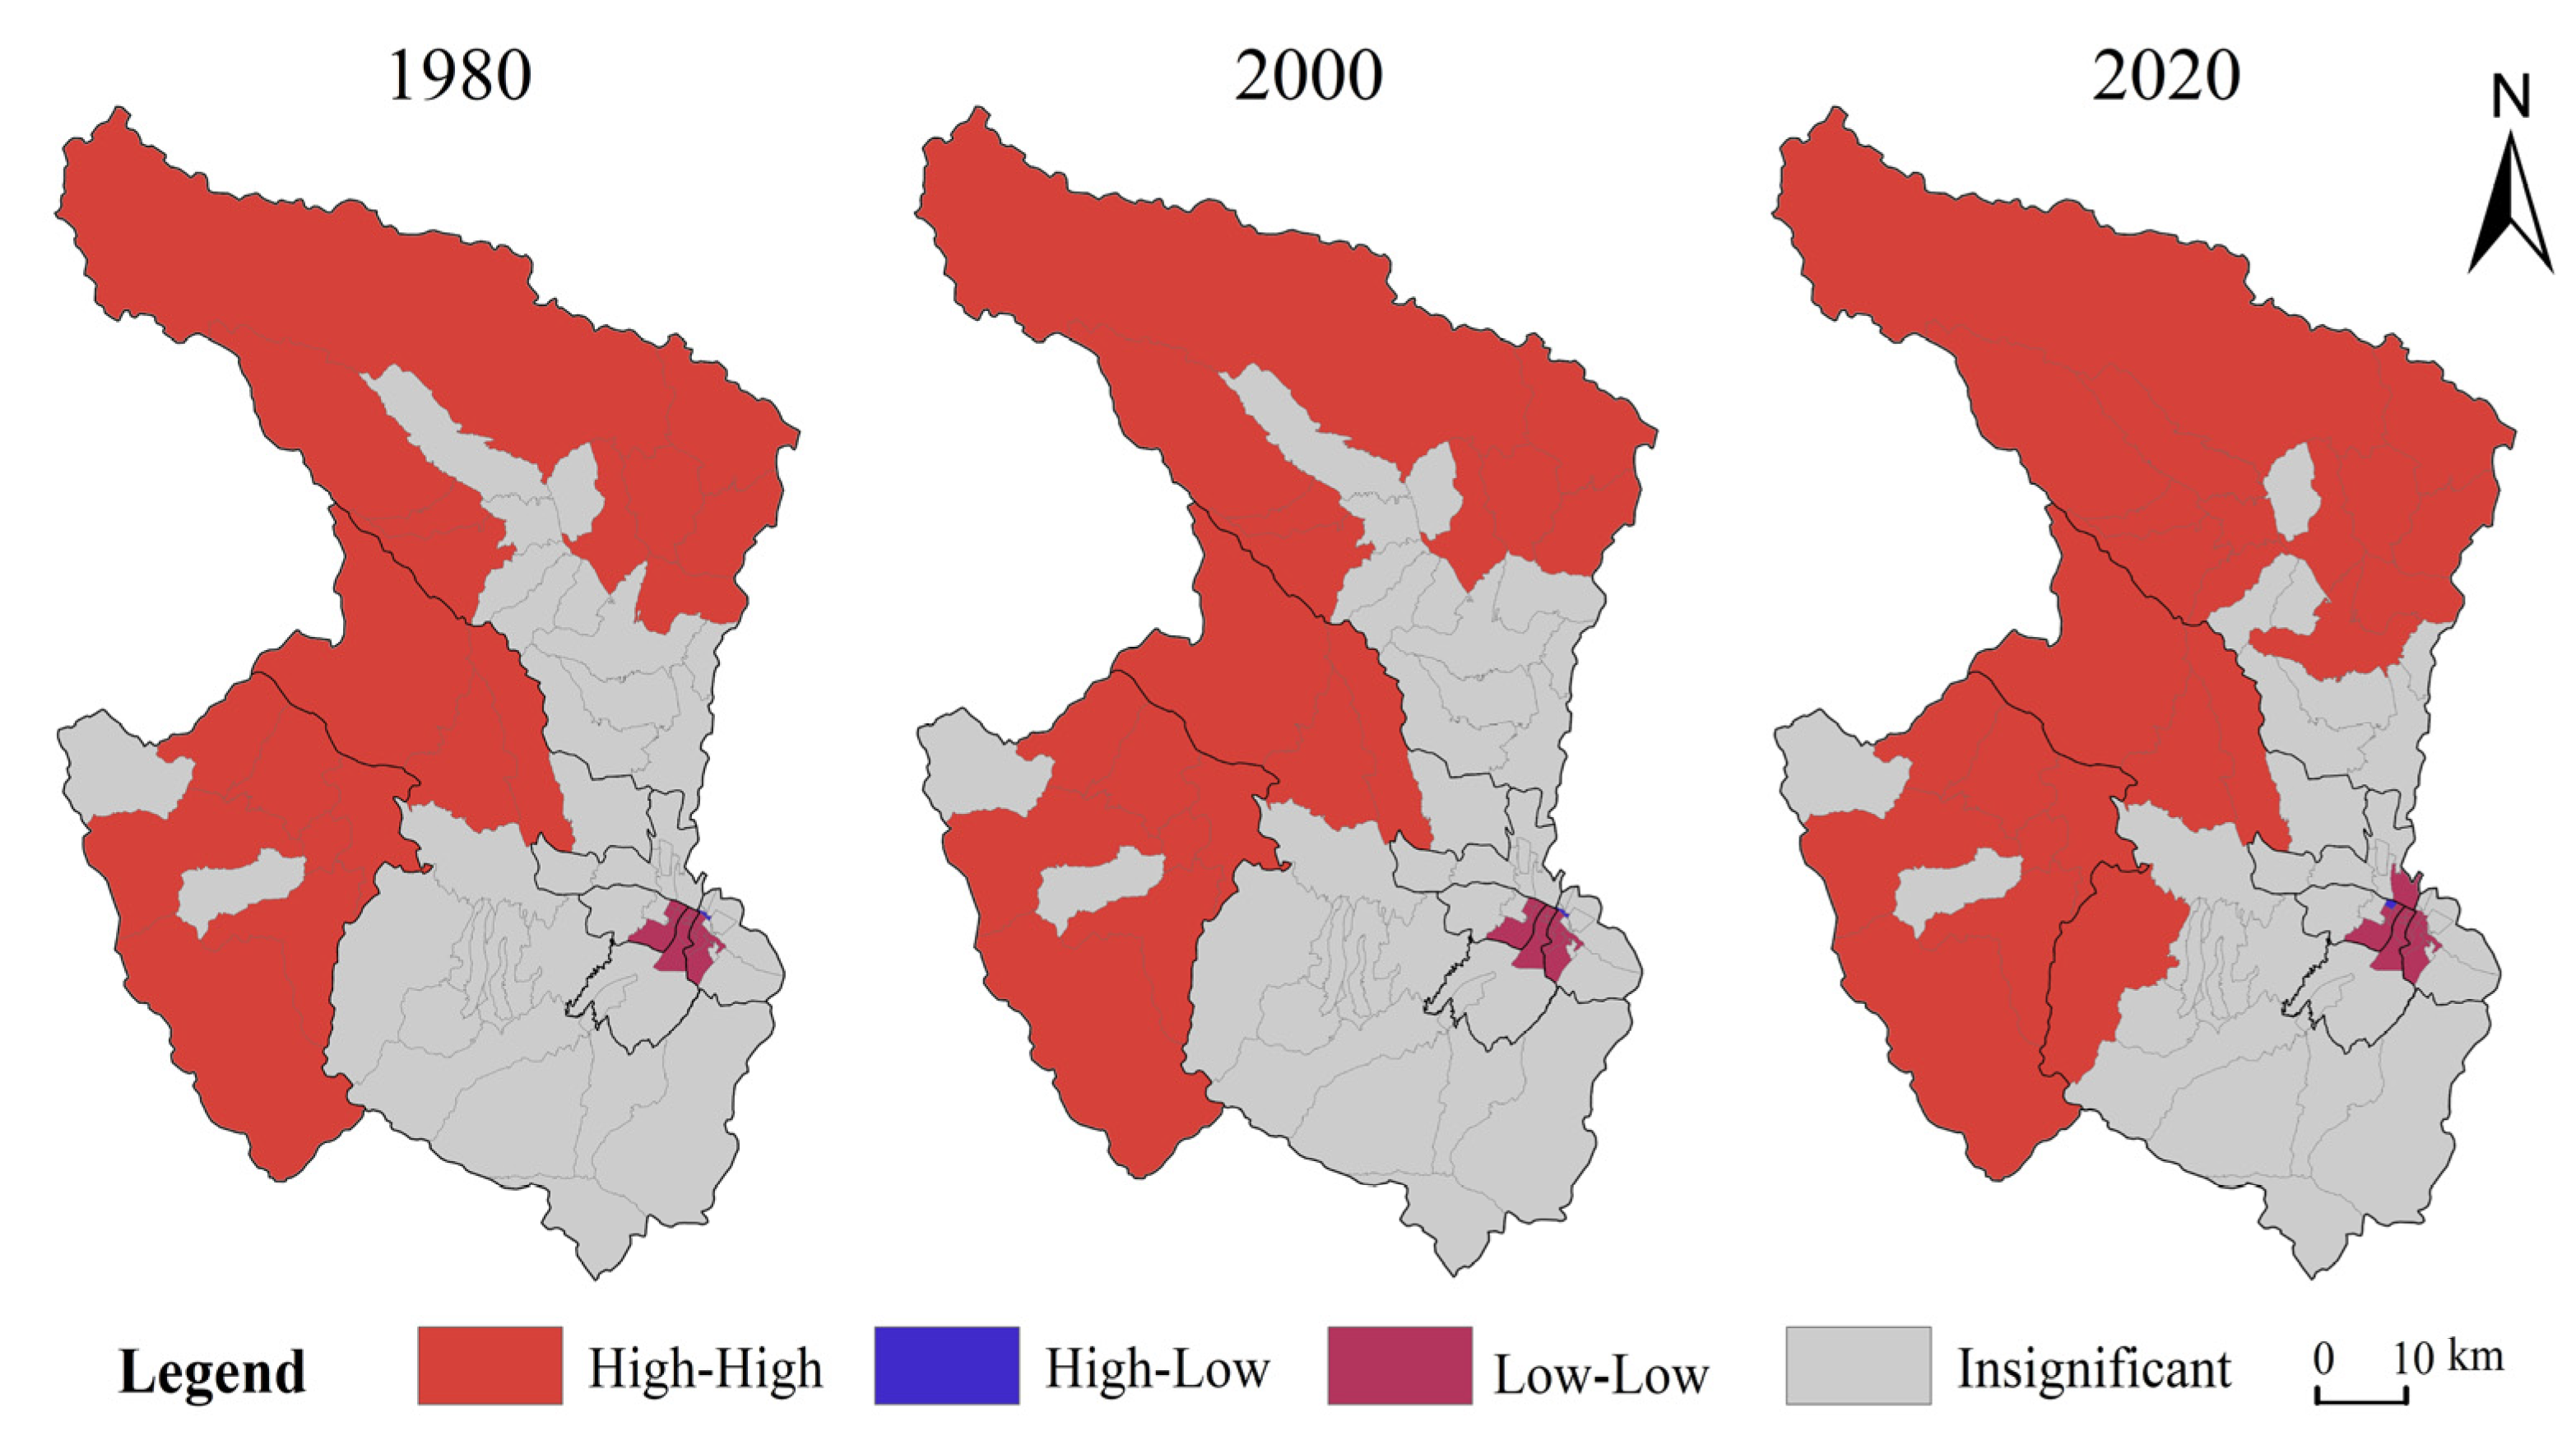
3.3.3. Spatial Autocorrelation Analysis of Ecosystem Service Value

The global Moran index of ESV per unit area within the administrative units of townships and streets in Xining between 1980 and 2020 was greater than 0.5 and showed an overall trend of increasing (Table 11). The Z values were all greater than 1.96, and the ESV per unit area passed the significance test in all years, indicating that there was a positive spatial correlation, which indicated that the spatial distribution of townships and streets with high and low values of ESV per unit area demonstrated significant spatial agglomeration with an increasing spatial clustering effect.
The LISA map of local autocorrelation revealed the specific location of the spatial distribution of agglomeration of ESV per unit area in Xining and the changing status of the clustering types during the period from 1980–2020. The spatial agglomeration categories of ESV per unit area in Xining were classified into four agglomeration types: high-high, high-low, low-low, and insignificant. The high-high categories of spatial agglomeration of ESV per unit area were mainly distributed in northern and western Xining (Figure 4), including the northern and western townships of Datong Hui and Tu Autonomous County and the northern townships of Huangzhong District and within Huangyuan County. These areas are all at high altitude, with extensive distribution of forests and grasslands, and they mostly show land use by pastoralism or ecotourism as the mainstay industries, slow development of urban construction, and a low negative impact of human production and living activities on the reduction in the area of forest and grassland. The low-low categories of spatial agglomeration of ESV per unit area were mainly located in the intersection of major rivers (the Huangshui, Nanchuan River, and Beichuan River) in the southeast of Xining, including a few township streets in the eastern part of Chengxi District, the western part of Chengdong District, the Chengzhong District, and the southern part of Chengbei District. These areas are highly densely populated, economically active, major expansion areas for urban construction in Xining City, with low ecosystem service value. The insignificant agglomeration types of ESV per unit area were widely distributed between high-high-agglomeration-type areas and low-low-agglomeration-type areas. The area of the high-high categories of spatial agglomeration of ESV per unit area had been expanding, increasing from 19 townships and streets to 24 in 2020, and the low-low categories of spatial agglomeration had increased by a total of 2 townships and streets in 40 years, which indicated that the spatial concentration of ESV per unit area in Xining has been increasing, and the ESV per unit area was increasingly showing a clear circle structure of the high-high type in the peripheral region, the insignificant type in the transitional region, and the low-low type in the inner core region.

4. Discussion

4.1. The Relationship among Urbanization, Land Use, and ESV

Urbanization has been proved to be the main driving force for land use change in developed countries or regions [39,40]. Meanwhile, with the development of economy and urbanization, the impact of population urbanization or land urbanization on land use change has been increasingly identified and emphasized in many developing countries [41]. Land urbanization has a negative impact on ecosystem service value, and even this negative impact is more direct than population urbanization [42]. We analyzed the relationship between urbanization and the spatiotemporal characteristics of land use and ESV in the context of rapid urbanization. The time from 2000–2020 was a period of rapid development of urbanization in Xining City, and it was also a critical period when the land use change of Xining was the most drastic and the key period when the ESV changed. The main type of land use change in Xining was the conversion of farmlands into developed areas. This mainly occurred in Chengbei District, Chengdong District, Chengdxi District, and Chengzhong District, which have entered the accelerated or late stage of urbanization. In the late stage of urbanization, the trend of farmland occupied by developed area was almost stagnant, but in the middle stage of urbanization, this trend was still quite active. This improves the possibility for government departments to predict the evolution trend of land use and ESV in advance according to the urbanization level of different districts and counties. With the rapid development of urbanization in Xining, the new urban construction land was mostly from farmland, which was the same as the research conclusion that some studies believed: that agricultural land was the first victim of urbanization expansion [43]. This showed that the cities in the valley of the Qinghai-Tibet Plateau and other cities in the world have common points in land use change under the background of urbanization development.

4.2. The Necessity of Considering Both Nature and Society in the Analysis of Urbanization, LUCC, and ESV

We analyzed the variations in land use and ESV under different natural attributes (different altitudes and slopes) and different social attributes (different administrative divisions and stages of urbanization) and found that the mutual transformation between different land use types mainly occurred in the range of 0–15° slopes and 2000–2750 m altitudes. The spatial pattern of land use changes in cultivated land was occupied by construction land in the form of a “cross shaped” pattern along the river in space, forming a “core-periphery” trend and the phenomenon of hollowing ESV at the township scale. This is different from the current research that specializes in independent analyses of LUCC and ESV in the same administrative district or in the same larger geographical type of area [13,26,39], which lacks integrated analyses between areas with different natural attributes and between different social attributes at the same time. By refining the scale of research, integrating natural and social attributes, and precisely identifying areas where changes in land use and ESV mainly occur, strong practical implications emerge, which can help urban management decision makers and urban planners to formulate more targeted land management and urbanization development plans for areas with different topographic zones in districts and counties at different stages of urbanization.

4.3. Application of the Revised Equivalent Factor Method

Different from the equivalent factor method, the CPI index was used to eliminate the impact of price increases on ESV [10,35,36]. More attention should be paid to natural disturbances caused by rising food crop prices and changes in ecosystem service values over time in the calculation process [18,34]. The calculation results of ESV show that in the unique geographical environment of the plateau, urbanization does not necessarily mean a loss of ecological service value. This conclusion is different from a large number of current conclusions that urbanization will lead to a reduction in ESV [42,44,45]. There is no doubt that with the development of urbanization, the conversion of farmland into urban land will lead to a decrease in ESV. However, in the past 40 years, the urban area in Xining only increased by 104.43 km2, and the area of grasslands and forests with a high ecosystem service value changed little. With the natural disturbance of ecosystem service factors, the total ESV in Xining City in 2020 has increased compared to 1980. This is similar to a study in the San Antonio area that found that urban expansion does not necessarily lead to a significant decrease in the net value of ecosystem services [39]. Therefore, it is very necessary to protect land use types with a high ecological value, such as grasslands, forest lands, and wetlands, in order to maintain the overall ESV in areas where urbanization is about to enter the accelerated development stage [17].

4.4. Limitations and Future Research Directions

This study reveals the characteristics of land use and ecological service value changes in Xining, the largest city on the Qinghai-Tibet Plateau, during the urbanization process, which has enlightening significance for promoting sustainable development on the plateau. Firstly, in the unique geographical environment of the plateau, urbanization does not necessarily mean a loss of ecological service value. This provides a reference for other cities on the plateau, as well as other cities in developing countries, on how to promote urbanization and better protect the environment. The built-up area only increased by 104.43 km2 between 1980 and 2020, and the assignment of the value-equivalent factor of built-up area does not have a remarkably significant impact on the ESV in Xining. If we study other cities with a large increase in developed area, the assignment of the value equivalent of developed area needs more careful consideration. The revised equivalent factor method based on Costanza’s method still needs to be further improved [9]. It is not accurate enough to obtain the ESV by calculating the area and value-equivalent factor coefficients of land use types, and there may be deviations [46]. In particular, although urban land has only increased by 104.43 km2 over the past 40 years, the non-urban land occupied by it has unparalleled ecosystem functions, such as food supply, raw material supply, and climate regulation. The occupation of non-urban land by urban land will hinder the effective functioning of ecosystem services [47], further affecting the quality of life in the city [48]. Therefore, a more detailed measurement of the changes in the specific functions of the ecosystem services brought about by land use types with little change in area will more effectively reflect the changes in ESV.
Secondly, due to the fragile ecological environment of the Qinghai-Tibet Plateau, achieving a “win-win” situation of ecological environment protection and improving residents’ living standards requires systematic policy design and a sustainable urbanization path. Other cities located in the plateau area, such as Lhasa, Shigatse, Shannan, Nyingchi, and other cities in the valley, may face similar land use changes and ESV spatial and temporal evolution laws of Xining City. However, in plain areas, especially cities in the early stage of urbanization, the development goal is to prioritize solving residents’ living problems while protecting the environment, so the change law of land use and ESV may be different from that of Xining.

5. Conclusions

This paper analyzed the spatial and temporal variation in land use and ecosystem service value in Xining during the period from 1980–2020 based on a revised equivalent factor method of food-based CPI data and geospatial analysis methods. First, the variation in Xining land use types mainly occurred in the range of land slopes between 0–15° and altitudes between 2000–2750 m, and the transformation of farmland into developed area was the main transformation process. With urbanization into the middle and late stages of development after 2010, the area and rate of encroachment of urban developed area on farmland were much higher than those of rural developed area, forming a land use change pattern similar to the “cross shaped” pattern of developed area occupying farmland along Huangshui, Beichuan River, and Nanchuan River.
Second, a large improvement in the value of ecosystem services occurred in Xining city during the period from 1980–2020, with a total increase of RMB 2165.26 × 106. Although the massive conversion of farmland into developed area led to a local decrease in ESV, land use types with high ecosystem service value per unit area, such as forests, grasslands, and water areas, which dominated the main part of the land area of Xining, generally remained stable. The annual perturbation of equivalent factors led to variable increases in ESV.
Third, at the spatial scale of the counties, Xining formed an increasing structure of “core-periphery” of ESV and a hollowing phenomenon of ESV. The Moran index was larger than 0.5 in different periods, indicating that the ESV had a strong spatial agglomeration effect and formed a continuous distribution of the high-high agglomeration type of ESV per unit area in the north and west of Xining, whereas the low-low agglomeration type of area was distributed in the valley area where the major rivers converge in the southeast of Xining.
Urbanization has an impact on LUCC and ESV, but urbanization does not necessarily lead to a serious reduction in the overall value of ecosystem services, which depends on the area of non-urban land occupied by urban land and the value of its own ecosystem services. In the Qinghai-Tibet Plateau, where the natural ecological environment is fragile, urban development is strictly restricted by topographic conditions and ecological environmental protection policies. The expansion of land urbanization is not chaotic. On the contrary, urbanization can be used as an indicator to monitor and respond to land use changes. By comprehensively analyzing the urbanization development stage and topographic and geomorphic conditions of counties or cities, the trend in LUCC and ESV can be predicted, which provides a decision-making basis for land management and urban sustainable development.

Author Contributions

M.T. designed research and served as principal investigator (PI); J.W. wrote the paper. M.T. revised the paper. J.W. calculated the data, designed and produced figures and tables; J.W. and X.W. contributed data collection and processing. All authors have read and agreed to the published version of the manuscript.

Funding

This study was supported by the Second Tibetan Plateau Scientific Expedition and Research Program (2019QZKK0406).

Institutional Review Board Statement

Not applicable.

Informed Consent Statement

All authors have read and agreed to the published version of the manuscript.

Data Availability Statement

The data presented in this study are available on request from the corresponding author.

Conflicts of Interest

All authors declare no conflict of interest.

References

  1. Liu, J.; Zhang, Z.; Zhang, S.; Yan, C.; Wu, S.; Li, R.; Kuang, W.; Shi, W.; Huang, L.; Ning, J.; et al. Innovation and development of remote sensing-based land use change studies based on Shupeng Chen’s academic thoughts. J. Geo-Inf. Sci. 2020, 22, 680–687. [Google Scholar]
  2. Fu, B.; Zhang, L. Land-use change and ecosystem services: Concepts, methods and progress. Prog. Geogr. 2014, 33, 441–446. [Google Scholar]
  3. Leemans, R.; Groot, R.S.d. Millennium Ecosystem Assessment: Ecosystems and Human Well-Being: A Framework for Assessment; Island Press: Washington, DC, USA, 2003; pp. 1–190. [Google Scholar]
  4. Ehrlich, P.; Ehrlich, A. Extinction: The Causes and Consequences of the Disappearance of Species; Random House: New York, NY, USA, 1981; pp. 1–305. [Google Scholar]
  5. Li, W.; Zhang, B.; Xie, G. Research on ecosystem services in China: Progress and perspectives. J. Nat. Resour. 2009, 24, 1–10. [Google Scholar]
  6. Biedemariam, M.; Birhane, E.; Demissie, B.; Tadesse, T.; Gebresamuel, G.; Habtu, S. Ecosystem Service Values as Related to Land Use and Land Cover Changes in Ethiopia: A Review. Land 2022, 11, 2212. [Google Scholar] [CrossRef]
  7. Gashaw, T.; Tulu, T.; Argaw, M.; Worqlul, A.W.; Tolessa, T.; Kindu, M. Estimating the impacts of land use/land cover changes on Ecosystem Service Values: The case of the Andassa watershed in the Upper Blue Nile basin of Ethiopia. Ecosyst. Serv. 2018, 31, 219–228. [Google Scholar] [CrossRef]
  8. Wang, W.; Guo, H.; Chuai, X.; Dai, C.; Lai, L.; Zhang, M. The impact of land use change on the temporospatial variations of ecosystems services value in China and an optimized land use solution. Environ. Sci. Policy 2014, 44, 62–72. [Google Scholar] [CrossRef]
  9. Costanza, R.; d’Arge, R.; de Groot, R.; Farber, S.; Grasso, M.; Hannon, B.; Limburg, K.; Naeem, S.; O’Neill, R.V.; Paruelo, J.; et al. The value of the world’s ecosystem services and natural capital. Nature 1997, 387, 253–260. [Google Scholar] [CrossRef]
  10. Xie, G.; Lu, C.; Leng, Y.; Zheng, D.; Li, S. Ecological assets valuation of the Tibetan Plateau. J. Nat. Resour. 2003, 2, 189–196. [Google Scholar]
  11. Zhou, D.; Tian, Y.; Jiang, G. Spatio-temporal investigation of the interactive relationship between urbanization and ecosystem services: Case study of the Jingjinji urban agglomeration, China. Ecol. Indic. 2018, 95, 152–164. [Google Scholar] [CrossRef]
  12. Gao, J.; Yu, Z.; Wang, L.; Vejre, H. Suitability of regional development based on ecosystem service benefits and losses: A case study of the Yangtze River Delta urban agglomeration, China. Ecol. Indic. 2019, 107, 105579. [Google Scholar] [CrossRef]
  13. Zhang, G.; Zheng, D.; Xie, L.; Zhang, X.; Wu, H.; Li, S. Mapping changes in the value of ecosystem services in the Yangtze River Middle Reaches Megalopolis, China. Ecosyst. Serv. 2021, 48, 101252. [Google Scholar] [CrossRef]
  14. Geng, T.; Chen, H.; Zhang, H.; Shi, Q.; Liu, D. Spatiotemporal evolution of land ecosystem service value and its influencing factors in Shaanxi Province based on GWR. J. Nat. Resour. 2020, 35, 1714–1727. [Google Scholar]
  15. Su, K.; Wei, D.-z.; Lin, W.-x. Evaluation of ecosystem services value and its implications for policy making in China—A case study of Fujian province. Ecol. Indic. 2020, 108, 105752. [Google Scholar] [CrossRef]
  16. Ye, Y.; Zhang, J.; Wang, T.; Bai, H.; Wang, X.; Zhao, W. Changes in Land-Use and Ecosystem Service Value in Guangdong Province, Southern China, from 1990 to 2018. Land 2021, 10, 426. [Google Scholar] [CrossRef]
  17. Li, T.; Li, W.; Qian, Z. Variations in ecosystem service value in response to land use changes in Shenzhen. Ecol. Econ. 2010, 69, 1427–1435. [Google Scholar] [CrossRef]
  18. Zhang, X.; Zhang, X.; Li, D.; Lu, L.; Yu, H. Multi-scenario simulation of the impact of urban land use change on ecosystem service value in Shenzhen. Acta Ecol. Sin. 2022, 42, 2086–2097. [Google Scholar]
  19. Yang, W.; Chang, J.; Xu, B.; Peng, C.; Ge, Y. Ecosystem service value assessment for constructed wetlands: A case study in Hangzhou, China. Ecol. Econ. 2008, 68, 116–125. [Google Scholar] [CrossRef]
  20. Huang, X.; Chen, Y.; Ma, J. Analysis of the ecosystem services value of the typical river basin in desert areas of Northwest China. J. Nat. Resour. 2011, 26, 1364–1376. [Google Scholar]
  21. Jiang, W.; Lü, Y.; Liu, Y.; Gao, W. Ecosystem service value of the Qinghai-Tibet Plateau significantly increased during 25 years. Ecosyst. Serv. 2020, 44, 101146. [Google Scholar] [CrossRef]
  22. Lü, Y.; Fu, B.; Feng, X.; Zeng, Y.; Liu, Y.; Chang, R.; Sun, G.; Wu, B. A Policy-Driven Large Scale Ecological Restoration: Quantifying Ecosystem Services Changes in the Loess Plateau of China. PLoS ONE 2012, 7, e31782. [Google Scholar] [CrossRef]
  23. Huang, X.; Ma, J.X. Changes in the ecosystem service values of typical river basins in arid regions of Northwest China. Ecohydrology 2013, 6, 1048–1056. [Google Scholar] [CrossRef]
  24. Wang, Y.; Ding, J.; Li, X.; Zhang, J.; Ma, G. Impact of LUCC on ecosystem services values in the Yili River Basin based on an intensity analysis model. Acta Ecol. Sin. 2022, 42, 3106–3118. [Google Scholar]
  25. Sawut, M.; Eziz, M.; Tiyip, T. The effects of land-use change on ecosystem service value of desert oasis: A case study in Ugan-Kuqa River Delta Oasis, China. Can. J. Soil Sci. 2013, 93, 99–108. [Google Scholar] [CrossRef]
  26. Du, X.; Huang, Z. Ecological and environmental effects of land use change in rapid urbanization: The case of hangzhou, China. Ecol. Indic. 2017, 81, 243–251. [Google Scholar] [CrossRef]
  27. Ouyang, X.; Tang, L.; Wei, X.; Li, Y. Spatial interaction between urbanization and ecosystem services in Chinese urban agglomerations. Land Use Policy 2021, 109, 105587. [Google Scholar] [CrossRef]
  28. Agboola, O.P.; Rasidi, M.H.; Said, I.; Abogan, S.O.; Adejuwon, A.S. Morphological and GIS-Based Land Use Analysis: A Critical Exploration of a Rural Neighborhood. J. Contemp. Urban Aff. 2018, 2, 106–121. [Google Scholar] [CrossRef]
  29. Soliman, A.M. The Right to Land: To Whom Belongs After a Reconciliation Law in Egypt. J. Contemp. Urban Aff. 2022, 6, 96–111. [Google Scholar] [CrossRef]
  30. Fang, C. Special thinking and green development path of urbanization in Qinghai-Tibet Plateau. Acta Geogr. Sin. 2022, 77, 1907–1919. [Google Scholar]
  31. Tong, L.; Wei, X.; Song, X.; Mao, X.; Jin, X.; Jin, Y.; Ji, H.; Tang, W. A hedonic-price and structure-equation model based value assessment and factors of ecosystem services of urban wetlands in the Xining City. Acta Ecol. Sin. 2022, 42, 4630–4639. [Google Scholar]
  32. Feng, Y.; Wang, X. Evaluation of ecosystem service value of the Huangshui National Wetland Park in Xining. Qinghai Sci. Technol. 2021, 28, 27–32+38. [Google Scholar]
  33. Xu, X.; Liu, J.; Zhang, S.; Li, R.; Yan, C.; Wu, S. Multi-Period Remote Sensing Monitoring Dataset of Land Use in China (CNLUCC). Resource and Environment Science Data Registration and Publication System. 2018. Available online: https://www.resdc.cn/doi/doi.aspx?DOIid=54 (accessed on 6 April 2023).
  34. Luo, F.; Pan, A.; Chen, Z.; Zhang, H. Impact of land use change on the ecosystem service value in Sichuan Province. J. Yunnan Agric. Univ. (Nat. Sci.) 2021, 36, 734–744. [Google Scholar]
  35. Dai, W.; Jiang, F.; Huang, W.; Liao, L.; Jiang, K. Study on transition of land use function and ecosystem service value based on the conception of production, living and ecological space: A case study of the Fuzhou New Area. J. Nat. Resour. 2018, 33, 2098–2109. [Google Scholar]
  36. Wang, H.; Qin, F.; Zhu, J.; Zhang, C. The effects of land use structure and landscape pattern change on ecosystem service values. Acta Ecol. Sin. 2017, 37, 1286–1296. [Google Scholar]
  37. Xie, G.; Xiao, Y.; Zhen, L.; Lu, C. Study on ecosystem services value of food production in China. Chin. J. Eco-Agric. 2005, 3, 10–13. [Google Scholar]
  38. Anselin, L. Local Indicators of Spatial Association—LISA. Geogr. Anal. 1995, 27, 93–115. [Google Scholar] [CrossRef]
  39. Kreuter, U.P.; Harris, H.G.; Matlock, M.D.; Lacey, R.E. Change in ecosystem service values in the San Antonio area, Texas. Ecol. Econ. 2001, 39, 333–346. [Google Scholar] [CrossRef]
  40. Reginster, I.; Rounsevell, M. Scenarios of Future Urban Land Use in Europe. Environ. Plan. B Plan. Des. 2006, 33, 619–636. [Google Scholar] [CrossRef]
  41. Geymen, A.; Baz, I. Monitoring urban growth and detecting land-cover changes on the Istanbul metropolitan area. Environ. Monit. Assess. 2008, 136, 449–459. [Google Scholar] [CrossRef]
  42. Peng, J.; Tian, L.; Liu, Y.; Zhao, M.; Wu, J. Ecosystem services response to urbanization in metropolitan areas: Thresholds identification. Sci. Total Environ. 2017, 607, 706–714. [Google Scholar] [CrossRef]
  43. Su, S.; Zhang, Q.; Zhang, Z.; Zhi, J.; Wu, J. Rural settlement expansion and paddy soil loss across an ex-urbanizing watershed in eastern coastal China during market transition. Reg. Environ. Change 2011, 11, 651–662. [Google Scholar] [CrossRef]
  44. Su, S.; Xiao, R.; Jiang, Z.; Zhang, Y. Characterizing landscape pattern and ecosystem service value changes for urbanization impacts at an eco-regional scale. Appl. Geogr. 2012, 34, 295–305. [Google Scholar] [CrossRef]
  45. Peng, J.; Wang, X.; Liu, Y.; Zhao, Y.; Xu, Z.; Zhao, M.; Qiu, S.; Wu, J. Urbanization impact on the supply-demand budget of ecosystem services: Decoupling analysis. Ecosyst. Serv. 2020, 44, 101139. [Google Scholar] [CrossRef]
  46. Limburg, K.E.; O’Neill, R.V.; Costanza, R.; Farber, S. Complex systems and valuation. Ecol. Econ. 2002, 41, 409–420. [Google Scholar] [CrossRef]
  47. Eigenbrod, F.; Bell, V.A.; Davies, H.N.; Heinemeyer, A.; Armsworth, P.R.; Gaston, K.J. The impact of projected increases in urbanization on ecosystem services. Proc. R. Soc. B 2011, 278, 3201–3208. [Google Scholar] [CrossRef] [PubMed]
  48. Bolund, P.; Hunhammar, S. Ecosystem services in urban areas. Ecol. Econ. 1999, 29, 293–301. [Google Scholar] [CrossRef]
Figure 1. The location and terrain of Xining.
Land 12 01118 g001
Figure 2. Changes in land use types in different counties or districts of Xining from 1980 to 2020.
Land 12 01118 g002
Figure 3. The annual evolution of land area and population in urban and rural areas.
Land 12 01118 g003
Figure 4. LISA diagram of ecosystem service value per unit area of Xining in 1980, 2000, and 2020.
Land 12 01118 g004
Table 1. Equivalent factors of ecological service value in Xining.
ForestGrasslandWater AreaUnused LandFarmlandDeveloped Area
Original equivalent value21.857.2445.970.426.91−9.52
Revised equivalent value8.742.9018.390.172.76−3.81
Table 2. Changes in different land use types in Xining from 1980 to 2020.
YearForest
(km2)
Grassland
(km2)
Water Area
(km2)
Unused Land
(km2)
Farmland
(km2)
Developed Area
(km2)
19801656.133866.1119.571469.42235.45317.39
19901656.783865.0119.671463.68241.55317.39
20001656.853854.2217.751465.18252.72317.34
20101656.423860.4520.951425.41283.50317.34
20201654.743859.2921.361372.01339.33317.34
1980–2020−1.39−6.821.79−97.41103.88−0.05
Table 3. Conversion of different land use types in Xining from 1980 to 2020.
19802020
ForestGrasslandWater AreaUnused LandFarmlandDeveloped AreaTotal Outflow Area (km2)Outflow
(%)
Total Area in 1980 (km2)
Forest (km2)1650.621.490.990.001.002.035.514.11%1656.13
Inflow (%)——17.12%22.15%0.00%8.14%1.95%
Outflow (%)——27.07%17.91%0.00%18.14%36.88%
Grassland (km2)3.253850.580.590.008.732.9715.5311.59%3866.11
Inflow (%)78.73%——13.23%0.00%71.09%2.84%
Outflow (%)20.90%——3.79%0.00%56.19%19.12%
Water area (km2)0.030.0216.900.002.090.532.671.99%19.57
Inflow (%)0.72%0.24%——0.00%17.01%0.51%
Outflow (%)1.11%0.77%——0.00%78.33%19.78%
Unused land (km2)0.000.050.00317.340.000.000.050.04%317.39
Inflow (%)0.00%0.62%0.00%——0.00%0.00%
Outflow (%)0.00%100.00%0.00%——0.00%0.00%
Farmland (km2)0.857.152.780.001359.7498.90109.6881.86%1469.42
Inflow (%)20.55%82.02%62.51%0.00%——94.71%
Outflow (%)0.77%6.51%2.54%0.00%——90.17%
Developed area (km2)0.000.000.090.000.46234.900.550.41%235.45
Inflow (%)0.00%0.00%2.11%0.00%3.75%——
Outflow (%)0.00%0.00%16.96%0.00%83.00%——
Total inflow area (km2)4.128.714.450.0012.28104.43134.00
Inflow (%)3.08%6.50%3.3250.00%9.16%77.94%
Total area in 2020 (km2)1654.743859.2921.36317.341372.01339.33 7564.07
Notes: The values of each row represent the specific area and proportion of a certain type of land transformed into the other five types of land. Taking the first row as an example, the total area of forest in 1980 was 1656.13 km2, and the area of forest that did not change in 2020 was about 1650.62 km2. The area of forest transformed into grasslands, water areas, unused lands, farmlands, and developed areas was 1.49 km2, 0.99 km2, 0.00 km2, 1.00 km2, and 2.03 km2, respectively, with a total of 5.51 km2. This value accounted for 4.11% of the total area transferred from the six types of land to other types of land in Xining from 1980 to 2020. The index of outflow (%) respectively indicates the proportion of forest transformed into grasslands, water areas, unused lands, farmlands, and developed areas in the total outflow area of forest.
Table 4. Changes in land use at different elevations in Xining between 1980 and 2020.
Conversion of Different Land Use TypesThe Area of Altitude in Different Elevations (km2)
2000–2250 m2250–2500 m2500–2750 m2750–3000 m3000–3500 m3500–5000 mTotal
Grassland to farmland0.0050.7963.1804.1340.610——8.725
Grassland to developed area1.0691.2870.2110.2650.135——2.967
Grassland to forest——0.6490.1050.1370.6691.6853.245
Grassland to water area——————0.589————0.589
Farmland to grassland0.6225.5620.962——————7.146
Farmland to developed area31.50358.0538.6370.5960.116——98.905
Farmland to forest0.0000.2280.619——————0.847
Farmland to water area0.0170.1090.3622.297————2.785
Developed area to farmland0.4340.027————————0.461
Developed area to water area0.094——————————0.094
Forest to grassland——0.0100.030——1.1730.2791.492
Forest to farmland——0.2210.6710.108————1.000
Forest to developed area0.7441.289————————2.033
Forest to water area0.244————0.743————0.987
Water area to grassland————0.020——————0.020
Water area to farmland0.0721.1780.7340.104————2.088
Water area to developed area0.0340.2050.288——————0.527
Water area to forest——0.030————————0.030
Note: The table shows only those conversion types in which the change in area is more pronounced for different land use types.
Table 5. Changes in land use on different slopes of Xining between 1980 and 2020.
Conversion of Different Land Use TypesThe Area of Conversion in Different Slope (km2)
0–2°2–6°6–15°15–25°>25°Total
Grassland to farmland0.2481.6913.7502.3880.6488.725
Grassland to developed area0.2941.1441.1330.3380.0582.967
Grassland to forest0.0130.0690.4331.0811.6493.245
Grassland to water area0.0930.3220.1240.0380.0120.589
Farmland to grassland0.5972.0612.1411.3820.9657.146
Farmland to developed area23.52158.82614.3151.7020.54198.905
Farmland to forest0.2470.4870.0800.0320.0010.847
Farmland to water area0.4721.2780.7010.2230.1112.785
Developed area to farmland0.0320.1750.1740.0560.0240.461
Developed area to water area0.0000.0070.1230.6400.7221.492
Forest to grassland0.2870.5880.0610.0310.0331.000
Forest to farmland0.4761.2730.2810.003——2.033
Forest to developed area0.1170.3770.2670.1080.1180.987
Forest to water area0.0010.0060.0060.0070.0000.020
Water area to grassland0.7621.0950.1620.0550.0142.088
Water area to farmland0.1250.3250.0730.0040.0000.527
Water area to developed area0.0040.0210.005————0.030
Note: The table shows only those conversion types in which the change in area is more pronounced for different land use types.
Table 6. Changes in developed area in Xining from 1980 to 2020.
YearDeveloped Area
(km2)
Urban Developed Area (km2)Rural Developed Area
(km2)
Other Developed Area (km2)
1980235.4537.63188.189.64
1990241.5540.74189.6211.18
2000252.7243.46197.7811.48
2010283.5059.94216.217.35
2020339.3395.10231.1913.05
1980–2020103.8857.4743.013.41
2010–202055.8335.1614.985.70
Table 7. Conversion of developed area and farmland in Xining between 1980 and 2000.
Conversion of Land Use Types1980–19901990–20002000–20102010–2020
Farmland to urban developed area (km2)3.112.515.0634.25
Farmland to rural developed area (km2)1.447.5921.0616.43
Urban developed area to farmland (km2)0002.05
Urban developed area to rural built-up area (km2)0000
Rural developed area to farmland (km2)0000
Rural developed area to urban developed area (km2)002.632.76
Table 8. Changes in ESV of land use types in Xining between 1980 and 2000.
Ecosystem Service Value for the RMB (106 yuan)
Land Use TypesYears
198019902000201020201980–20201980–20002000–2020
Forest844.891163.84842.032187.611959.281114.39−2.861117.25
Grassland653.54899.63649.041689.371514.13860.59−4.50865.09
Water area21.0029.0718.9858.2253.2132.20−2.0234.23
Unused land3.114.293.108.067.224.11−0.014.12
Farmland237.07325.16235.49595.34513.75276.68−1.59278.27
Developed area−52.34−73.93−55.96−163.13−175.05−122.72−3.62−119.10
Total1707.272348.061692.684375.473872.542165.25−14.62179.86
Table 9. Profit and loss matrix of ESV in Xining from 1980 to 2000.
Ecosystem Service Value for the RMB (106 yuan)
Types of Land Use
ForestGrasslandWater AreaUnused LandFarmlandDeveloped Area1980 Total
Forest1112.32−0.181.950.00−0.14−2.091111.88
+(48.20%)−(0.13%)+(0.08%)(0.00%)−(0.10%)−(1.46%)
Grassland3.29859.801.370.001.79−2.03864.22
+(0.14%)+(37.25%)+(0.06%)(0.00%)+(0.08%)−(1.42%)
Water area0.00−0.0123.970.00−1.46−0.8421.66
(0.00%)−(0.01%)+(1.04%)(0.00%)−(1.02%)−(0.59%)
Unused land0.000.020.004.110.000.004.13
(0.00%)(0.00%)(0.00%)+(0.18%)(0.00%)(0.00%)
Farmland0.881.656.480.00289.78−66.98231.80
+(0.04%)+(0.07%)+(0.28%)(0.00%)+(12.56%)−(46.94%)
Developed area0.000.000.260.000.28−68.97−68.43
(0.00%)(0.00%)+(0.01%)(0.00%)+(0.01%)−(48.33%)
2020 Total1116.49861.2834.034.11290.25−140.902165.26
Note: “+” indicates that transformation between different land use types increases the value of ecosystem services. “−” shows that transformation between different land use types decreases the value of ecosystem services. () is the contribution rate (%) of transformation between specific land use types to the total increase or decrease in ESV.
Table 10. Changes in ESV in different counties or districts of Xining from 1980 to 2020.
Ecosystem Service Value for the RMB (106 yuan)
Counties/DistrictsYears
198019902000201020201980–2020
Chengbei District15.4320.9314.5430.75−20.07−35.50
Chengdong District6.418.525.536.35−1.32−7.73
Chengdxi District4.324.002.09−1.96−7.64−11.96
Chengzhong District14.2019.1713.5323.9320.956.75
Huanggzhong District512.14705.81508.11350.851205.82693.68
Huangyuan County378.93521.43376.48968.99875.28496.35
Datong Hui and Tu Autonomous County775.841068.2772.411996.561799.521023.68
Table 11. Global spatial autocorrelation of ecosystem service value per unit area of Xining from 1980 to 2020.
Index19801990200020102020
Moran’ I0.6570.6580.6610.6540.707
Z9.7459.7619.7889.578910.052
P0.0010.0010.0010.0010.001
Disclaimer/Publisher’s Note: The statements, opinions and data contained in all publications are solely those of the individual author(s) and contributor(s) and not of MDPI and/or the editor(s). MDPI and/or the editor(s) disclaim responsibility for any injury to people or property resulting from any ideas, methods, instructions or products referred to in the content.

