
Mixed Land Use as an Intrinsic Feature of Sprawl: A Short-Term Analysis of Settlement Growth and Population Distribution Using European Urban Atlas

 , ,
, ,  ,
, 
Abstract
1. Introduction
2. Methodology
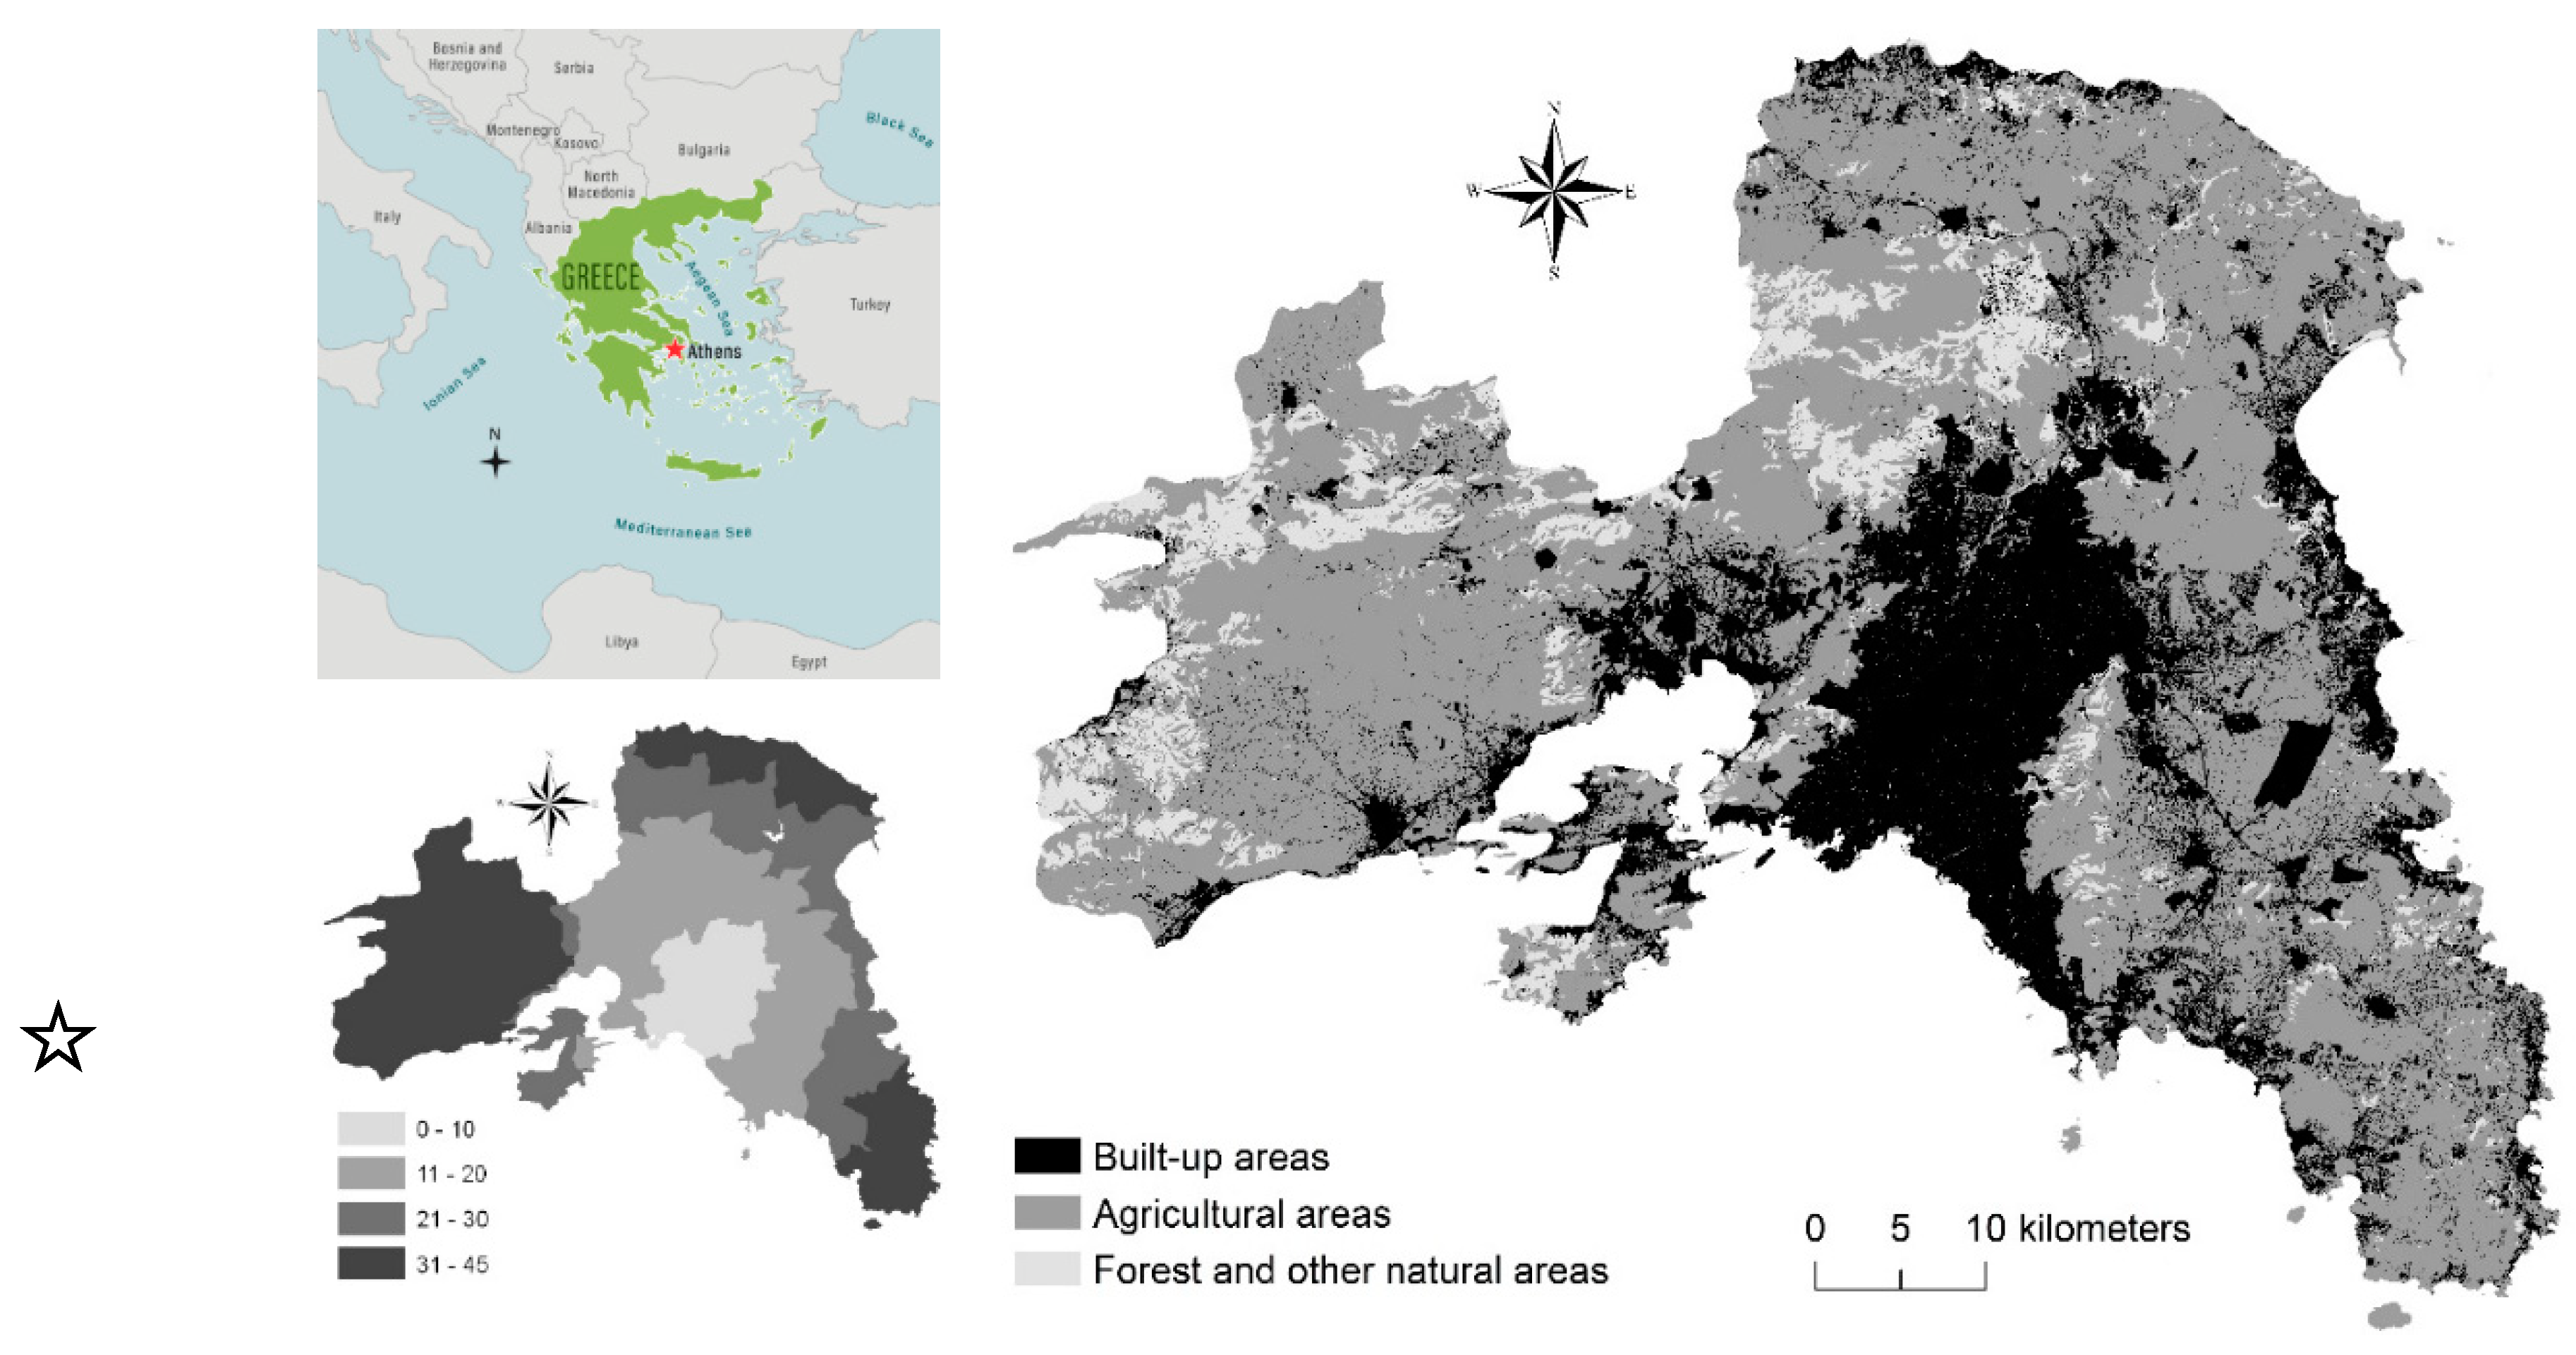
2.1. Study Area
2.2. Data and Variables
2.3. Statistical Analysis
2.3.1. Modeling Density/Land-Use Gradients through Smoothing Splines
2.3.2. Delineating Landscape-Population Characteristics under Compact Growth and Sprawl
2.3.3. Exploring the Evolution of Land-Use and Population Distribution over Metropolitan Athens, 2012–2018
3. Results
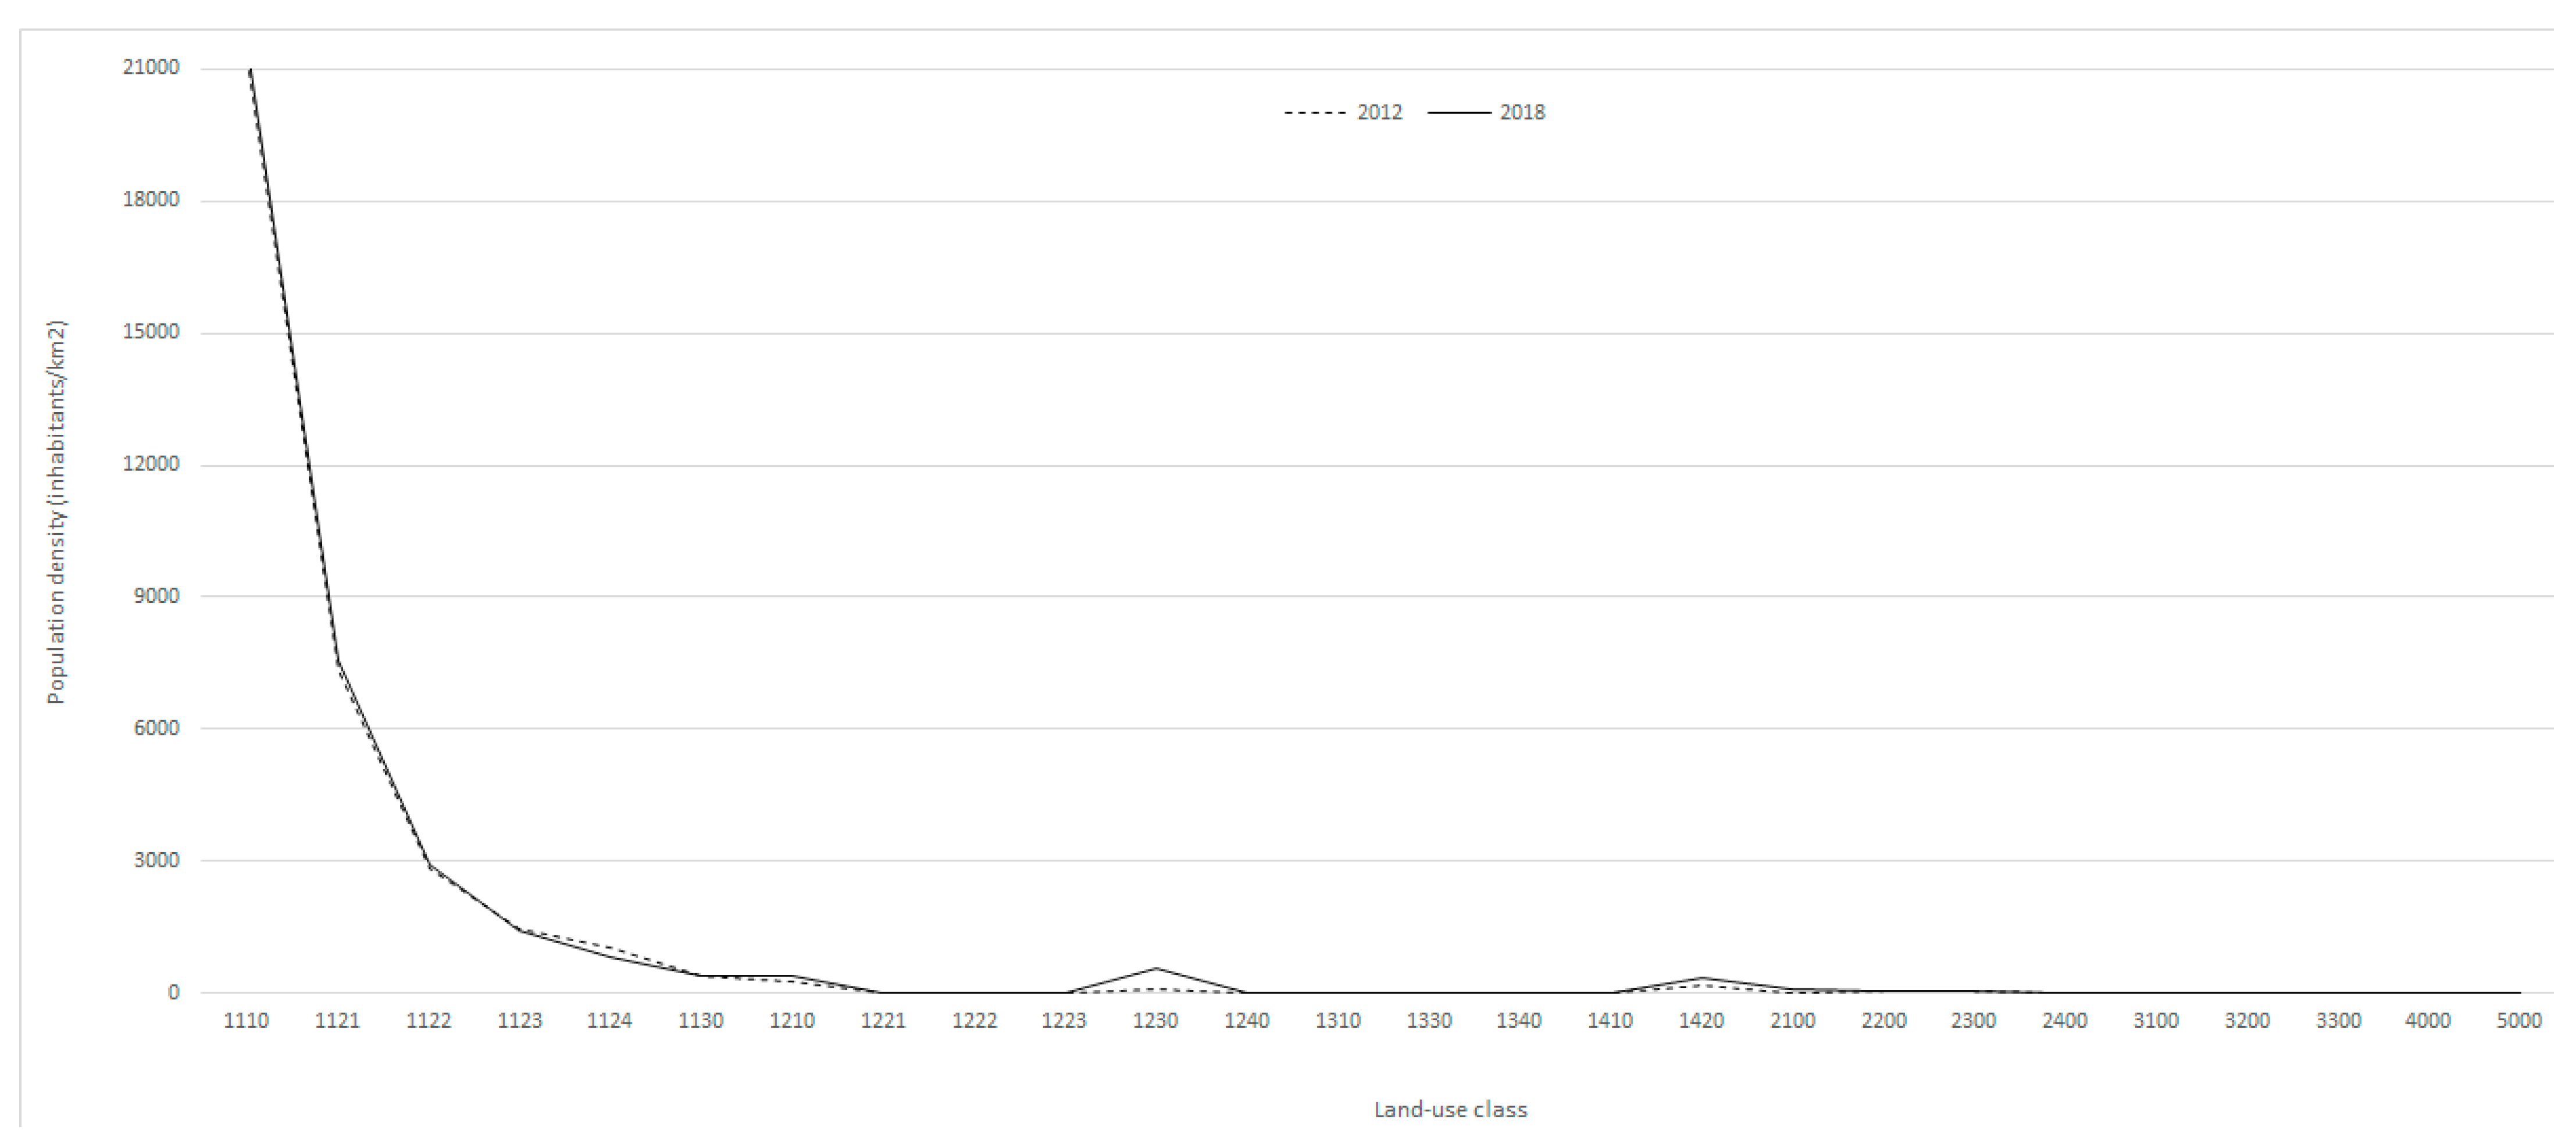
3.1. A Descriptive Analysis of Land-Use and Population Dynamics
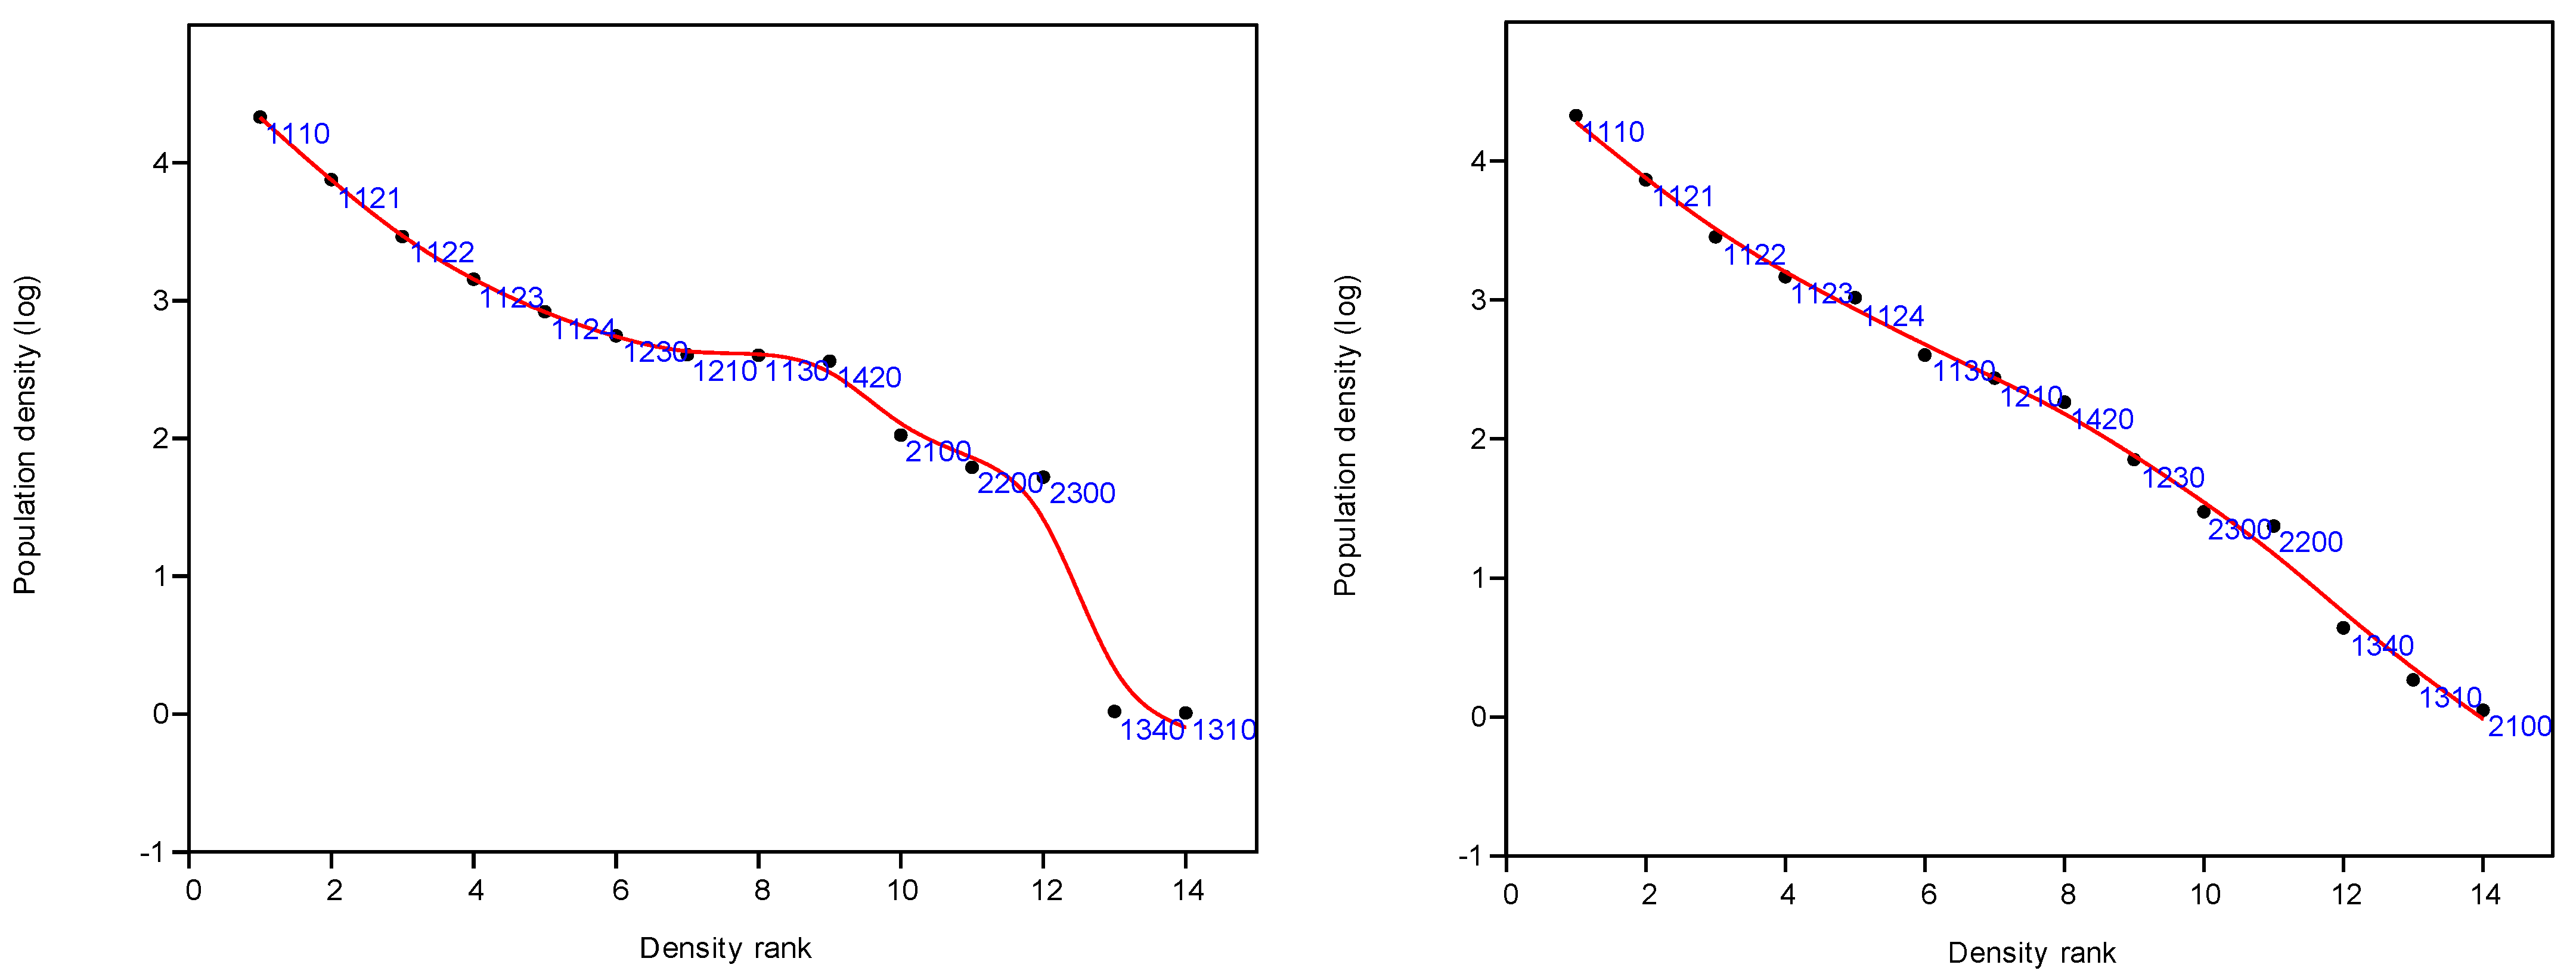
3.2. Depicting the Metropolitan Gradient with Joint Land-Use and Population Dynamics
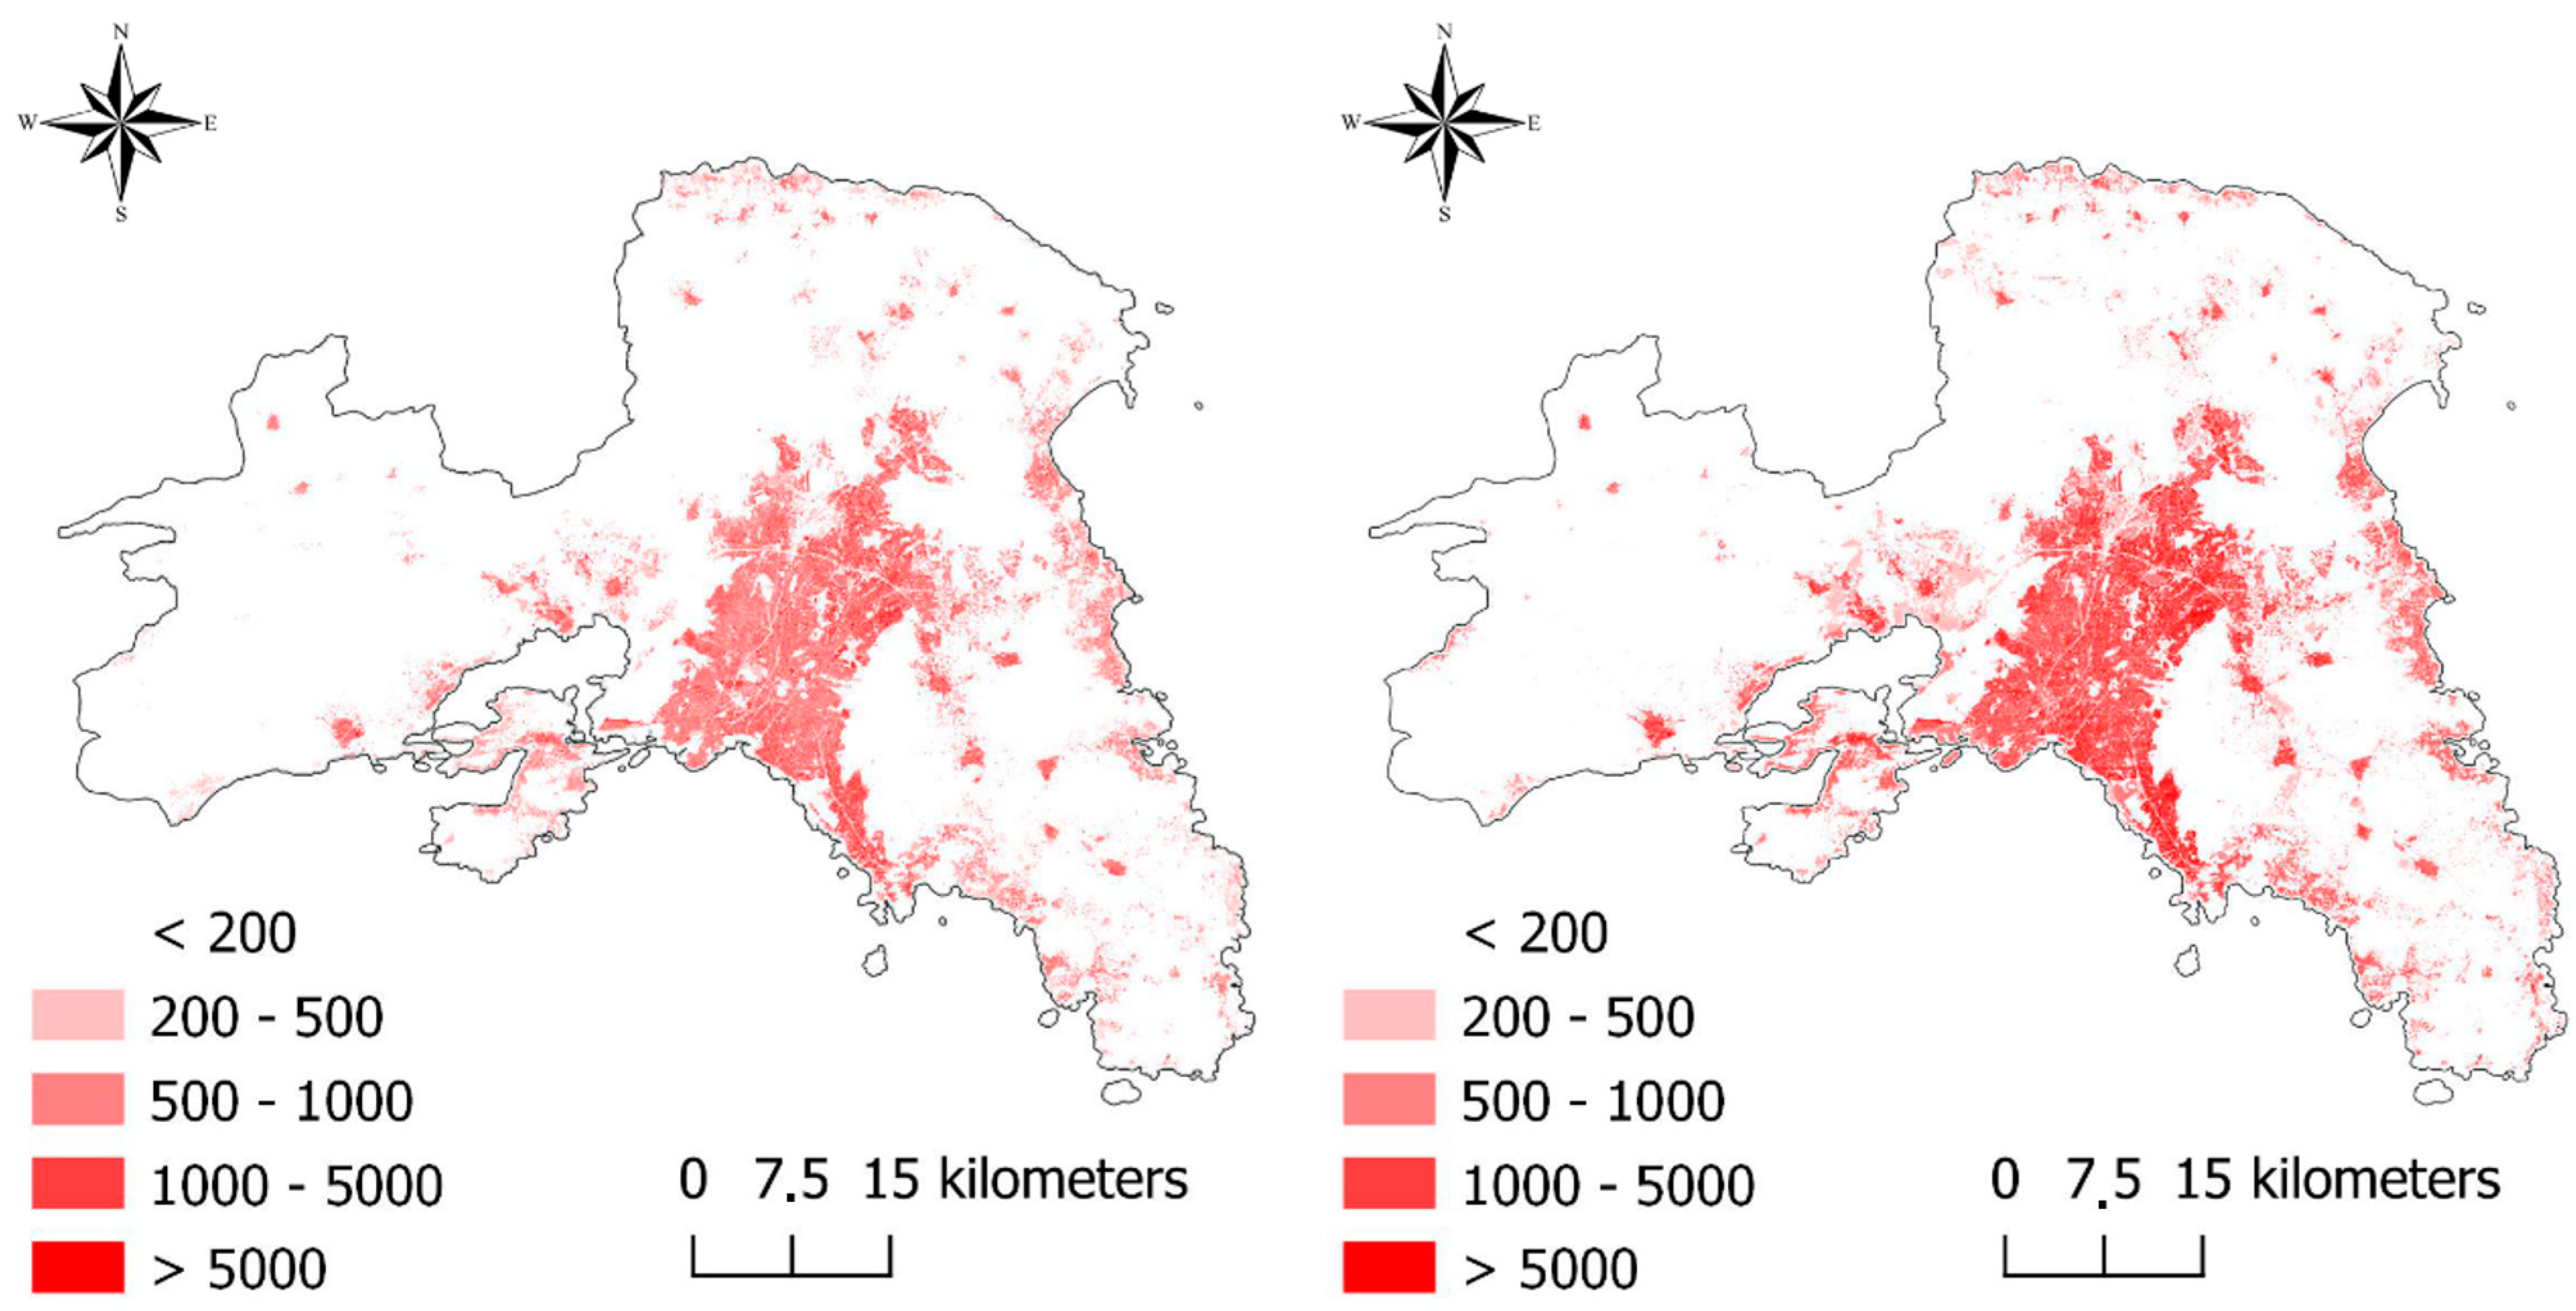
3.3. Similarity in the Spatial Distribution of Population and Land-Use
3.4. The Spatio-Temporal Correlation in the Distribution of Population Density and Land-Use
4. Discussion
5. Conclusions
Author Contributions
Funding
Data Availability Statement
Conflicts of Interest
References
- Barbero-Sierra, C.; Marques, M.J.; Ruíz-Pérez, M. The case of urban sprawl in Spain as an active and irreversible driving force for desertification. J. Arid Environ. 2013, 90, 95–102. [Google Scholar] [CrossRef]
- Elmqvist, T.; Fragkias, M.; Goodness, J.; Güneralp, B.; Marcotullio, P.J.; McDonald, R.I.; Parnell, S.; Schewenius, M.; Sendstad, M.; Seto, K.C.; et al. Urbanization, Biodiversity and Ecosystem Services: Challenges and Opportunities; Springer: Utrecht, The Netherlands, 2013. [Google Scholar]
- Gkartzios, M.; Scott, M. Countering counter-urbanisation: Spatial planning challenges in a dispersed city-region, the greater Dublin area. Town Plan. Rev. 2017, 81, 23–52. [Google Scholar] [CrossRef]
- Munafò, M.; Salvati, L.; Zitti, M. Estimating soil sealing rate at national level—Italy as a case study. Ecol. Indic. 2013, 26, 137–140. [Google Scholar] [CrossRef]
- Dura-Guimera, A. Population deconcentration and social restructuring in Barcelona, a European Mediterranean city. Cities 2003, 20, 387–394. [Google Scholar] [CrossRef]
- Lutz, W.; Testa, M.R.; Penn, D.J. Population density is a key factor in declining human fertility. Popul. Environ. 2006, 28, 69–81. [Google Scholar] [CrossRef]
- Assennato, F.; Smiraglia, D.; Cavalli, A.; Congedo, L.; Giuliani, C.; Riitano, N.; Strollo, A.; Munafò, M. The Impact of Urbanization on Land: A Biophysical-Based Assessment of Ecosystem Services Loss Supported by Remote Sensed Indicators. Land 2022, 11, 236. [Google Scholar] [CrossRef]
- García-Coll, A.; López-Villanueva, C. The Impact of Economic Crisis in Areas of Sprawl in Spanish Cities. Urban Sci. 2018, 2, 113. [Google Scholar] [CrossRef]
- Pili, S.; Grigoriadis, E.; Carlucci, M.; Clemente, M.; Salvati, L. Towards sustainable growth? A multi-criteria assessment of (changing) urban forms. Ecol. Indic. 2017, 76, 71–80. [Google Scholar] [CrossRef]
- McDonnell, M.J.; Hahs, A.K. The use of gradient analysis studies in advancing our understanding of the ecology of urbanizing landscapes: Current status and future directions. Landsc. Ecol. 2008, 23, 1143–1155. [Google Scholar] [CrossRef]
- Galster, G.; Hanson, R.; Ratcliffe, M.R.; Wolman, H.; Coleman, S.; Freihage, J. Wrestling sprawl to the ground: Defining and measuring an elusive concept. Hous. Policy Debate 2001, 12, 681–717. [Google Scholar] [CrossRef]
- Krueger, R.; Gibbs, D.; Carr, C. Examining regional competitiveness and the pressures of rapid growth: An interpretive institutionalist account of policy responses in three city regions. Environ. Plan. C Politics Space 2018, 36, 965–986. [Google Scholar] [CrossRef]
- Sevilla-Buitrago, A. Debating contemporary urban conflicts: A survey of selected scholars. Cities 2013, 31, 454–468. [Google Scholar] [CrossRef]
- Alphan, H. Land use change and urbanisation of Adana, Turkey. Land Degrad. Dev. 2003, 14, 575–586. [Google Scholar] [CrossRef]
- Salvati, L.; Perini, L.; Sabbi, A.; Bajocco, S. Climate Aridity and Land Use Changes: A Regional-Scale Analysis. Geogr. Res. 2012, 50, 193–203. [Google Scholar] [CrossRef]
- Zasada, I.; Loibl, W.; Köstl, M.; Piorr, A. Agriculture under human influence: A spatial analysis of farming systems and land use in European rural-urban-regions. Eur. Countrys. 2013, 5, 71–88. [Google Scholar] [CrossRef]
- Zitti, M.; Ferrara, C.; Perini, L.; Carlucci, M.; Salvati, L. Long-term urban growth and land use efficiency in Southern Europe: Implications for sustainable land management. Sustainability 2015, 7, 3359–3385. [Google Scholar] [CrossRef]
- Camagni, R.; Capello, R.; Nijkamp, P. Toward Sustainable City Policy: An Economy-Environment-Technology Nexus. Ecol. Econ. 1998, 24, 103–118. [Google Scholar] [CrossRef]
- Longhi, C.; Musolesi, A. European cities in the process of economic integration: Towards structural convergence. Ann. Reg. Sci. 2007, 41, 333–351. [Google Scholar] [CrossRef]
- Turok, I.; Mykhnenko, V. The trajectories of European cities, 1960–2005. Cities 2007, 24, 165–182. [Google Scholar] [CrossRef]
- Haase, D.; Nuissl, H. The urban-to-rural gradient of land use change and impervious cover: A long-term trajectory for the city of Leipzig. Land Use Sci. 2010, 5, 123–142. [Google Scholar] [CrossRef]
- Kasanko, M.; Barredo, J.I.; Lavalle, C.; McCormick, N.; Demicheli, L.; Sagris, V.; Brezger, A. Are European Cities Becoming Dispersed? A Comparative Analysis of Fifteen European Urban Areas. Landsc. Urban Plan. 2006, 77, 111–130. [Google Scholar] [CrossRef]
- Carlucci, M.; Grigoriadis, E.; Rontos, K.; Salvati, L. Revisiting a hegemonic concept: Long-term ‘Mediterranean urbanization’in between city re-polarization and metropolitan decline. Appl. Spat. Anal. Policy 2017, 10, 347–362. [Google Scholar] [CrossRef]
- Salvati, L.; Zambon, I.; Chelli, F.M.; Serra, P. Do spatial patterns of urbanization and land consumption reflect different socioeconomic contexts in Europe? Sci. Total Environ. 2018, 625, 722–730. [Google Scholar] [CrossRef]
- Cecchini, M.; Zambon, I.; Pontrandolfi, A.; Turco, R.; Colantoni, A.; Mavrakis, A.; Salvati, L. Urban sprawl and the ‘olive’ landscape: Sustainable land management for ‘crisis’ cities. GeoJournal 2019, 84, 237–255. [Google Scholar] [CrossRef]
- Garcia-López, M.À. Population suburbanization in Barcelona, 1991–2005: Is its spatial structure changing? J. Hous. Econ. 2010, 19, 119–132. [Google Scholar] [CrossRef]
- Leontidou, L. The Mediterranean City in Transition; Cambridge University Press: Cambridge, UK, 1990. [Google Scholar]
- Zambon, I.; Benedetti, A.; Ferrara, C.; Salvati, L. Soil matters? A multivariate analysis of socioeconomic constraints to urban expansion in Mediterranean Europe. Ecol. Econ. 2018, 146, 173–183. [Google Scholar] [CrossRef]
- Delladetsima, P.M. The emerging property development pattern in Greece and its impact on spatial development. Eur. Urban Reg. Stud. 2006, 13, 245–278. [Google Scholar] [CrossRef]
- Salvati, L.; Carlucci, M. A composite index of sustainable development at the local scale: Italy as a case study. Ecol. Indic. 2014, 43, 162–171. [Google Scholar] [CrossRef]
- Aguilar, A.G. Peri-urbanization, illegal settlements and environmental impact in Mexico City. Cities 2008, 25, 133–145. [Google Scholar] [CrossRef]
- De Rosa, S.; Salvati, L. Beyond a ‘side street story’? Naples from spontaneous centrality to entropic polycentricism, towards a ‘crisis city’. Cities 2016, 51, 74–83. [Google Scholar] [CrossRef]
- Gosnell, H.; Abrams, J. Amenity migration: Diverse conceptualizations of drivers, socioeconomic dimensions, and emerging challenges. GeoJournal 2011, 76, 303–322. [Google Scholar] [CrossRef]
- Bajocco, S.; Ceccarelli, T.; Smiraglia, D.; Salvati, L.; Ricotta, C. Modeling the ecological niche of long-term land use changes: The role of biophysical factors. Ecol. Indic. 2016, 60, 231–236. [Google Scholar] [CrossRef]
- Bajocco, S.; De Angelis, A.; Salvati, L. A satellite-based green index as a proxy for vegetation cover quality in a Mediterranean region. Ecol. Indic. 2012, 23, 578–587. [Google Scholar] [CrossRef]
- Istituto Superiore Protezione e Ricerca Ambientale. Qualità Dell’ambiente Urbano; Report ISPRA 2014; ISPRA: Rome, Italy, 2014. [Google Scholar]
- Istituto Superiore Protezione e Ricerca Ambientale. Consumo Di Suolo, Dinamiche Territoriali e Servizi Ecosistemici; Report ISPRA 2022; ISPRA: Rome, Italy, 2022. [Google Scholar]
- Garcia, X.; Ribas, A.; Llausàs, A.; Saurí, D. Socio-demographic profiles in suburban developments: Implications for water-related attitudes and behaviors along the Mediterranean coast. Appl. Geogr. 2013, 41, 46–54. [Google Scholar] [CrossRef]
- Cuadrado-Ciuraneta, S.; Durà-Guimerà, A.; Salvati, L. Not only tourism: Unravelling suburbanization, second-home expansion and “rural” sprawl in Catalonia, Spain. Urban Geogr. 2017, 38, 66–89. [Google Scholar] [CrossRef]
- Buzar, S.; Ogden, P.E.; Hall, R.; Haase, A.; Kabisch, S.; Steinführer, A. Splintering urban populations: Emergent landscapes of reurbanisation in four European cities. Urban Stud. 2007, 44, 651–677. [Google Scholar] [CrossRef]
- Phelps, N.A.; Parsons, N.; Ballas, D.; Dowling, A. Post-Suburban Europe: Planning and Politics at the Margins of Europe’s Capital Cities; Palgrave Macmillan: Basingstoke, UK, 2006. [Google Scholar]
- Colantoni, A.; Grigoriadis, E.; Sateriano, A.; Venanzoni, G.; Salvati, L. Cities as selective land predators? A lesson on urban growth, deregulated planning and sprawl containment. Sci. Total Environ. 2016, 545, 329–339. [Google Scholar] [CrossRef]
- Muñoz, F. Lock living: Urban sprawl in Mediterranean cities. Cities 2003, 20, 381–385. [Google Scholar] [CrossRef]
- Bruegmann, R. Sprawl: A Compact History; University of Chicago Press: Chicago, IL, USA, 2005. [Google Scholar]
- Nijkamp, P.; Kourtit, K. The “new urban Europe”: Global challenges and local responses in the urban century. Eur. Plan. Stud. 2013, 21, 291–315. [Google Scholar] [CrossRef]
- Duvernoy, I.; Zambon, I.; Sateriano, A.; Salvati, L. Pictures from the other side of the fringe: Urban growth and peri-urban agriculture in a post-industrial city (Toulouse, France). J. Rural Stud. 2018, 57, 25–35. [Google Scholar] [CrossRef]
- Serra, P.; Vera, A.; Tulla, A.F.; Salvati, L. Beyond urban–rural dichotomy: Exploring socioeconomic and land-use processes of change in Spain (1991–2011). Appl. Geogr. 2014, 55, 71–81. [Google Scholar] [CrossRef]
- Nüssli, R.; Schmid, C. Beyond the urban–suburban divide: Urbanization and the production of the urban in Zurich North. Int. J. Urban Reg. Res. 2016, 40, 679–701. [Google Scholar] [CrossRef]
- Couch, C.; Petschel-Held, G.; Leontidou, L. Urban Sprawl in Europe: Landscapes, Land-Use Change and Policy; Blackwell: Oxford, UK, 2007. [Google Scholar]
- European Environment Agency. Urban Sprawl in Europe—The Ignored Challenge; EEA Report no. 10; EEA: Copenhagen, Denmark, 2006. [Google Scholar]
- Terzi, F.; Bolen, F. Urban sprawl measurement of Istanbul. Eur. Plan. Stud. 2009, 17, 1559–1570. [Google Scholar] [CrossRef]
- Montgomery, M.R. The urban transformation of the developing world. Science 2008, 319, 761–764. [Google Scholar] [CrossRef] [PubMed]
- Colantoni, A.; Mavrakis, A.; Sorgi, T.; Salvati, L. Towards a ‘polycentric’ landscape? Reconnecting fragments into an integrated network of coastal forests in Rome. Rend. Lincei 2015, 26, 615–624. [Google Scholar] [CrossRef]
- Salvati, L.; Munafo, M.; Morelli, V.G.; Sabbi, A. Low-Density Settlements and Land Use Changes in a Mediterranean Urban Region. Landsc. Urban Plan. 2012, 105, 43–52. [Google Scholar] [CrossRef]
- Ewing, R. Is Los Angeles-style sprawl desirable? J. Am. Plan. Assoc. 1997, 63, 107–126. [Google Scholar] [CrossRef]
- Vaz, E.; Nijkamp, P. Gravitational forces in the spatial impacts of urban sprawl: An investigation of the region of Veneto, Italy. Habitat Int. 2015, 45, 99–105. [Google Scholar] [CrossRef]
- Phelps, N.A. Suburbs for nations? Some interdisciplinary connections on the suburban economy. Cities 2010, 27, 68–76. [Google Scholar] [CrossRef]
- Arribas-Bel, D.; Nijkamp, P.; Scholten, H. Multidimensional urban sprawl in Europe: A self-organizing map approach. Comput. Environ. Urban Syst. 2011, 35, 263–275. [Google Scholar] [CrossRef]
- Salvati, L.; Serra, P. Estimating Rapidity of Change in Complex Urban Systems: A Multidimensional, Local-Scale Approach: Estimating Rapidity of Change in an Urban System. Geogr. Anal. 2016, 48, 132–156. [Google Scholar] [CrossRef]
- Prishchepov, A.V.; Müller, D.; Dubinin, M.; Baumann, M.; Radeloff, V.C. Determinants of agricultural land abandonment in post-Soviet European Russia. Land Use Policy 2013, 30, 873–884. [Google Scholar] [CrossRef]
- Salvia, R.; Serra, P.; Zambon, I.; Cecchini, M.; Salvati, L. In-Between Sprawl and Neo-Rurality: Sparse Settlements and the Evolution of Socio-Demographic Local Context in a Mediterranean Region. Sustainability 2018, 10, 3670. [Google Scholar] [CrossRef]
- European Environment Agency. Landscape Fragmentation in Europe; EEA: Copenhagen, Denmark, 2011. [Google Scholar]
- Cimini, A.; De Fioravante, P.; Riitano, N.; Dichicco, P.; Calò, A.; Scarascia Mugnozza, G.; Marchetti, M.; Munafò, M. Land Consumption Dynamics and Urban–Rural Continuum Mapping in Italy for SDG 11.3.1 Indicator Assessment. Land 2023, 12, 155. [Google Scholar] [CrossRef]
- Munafò, M. Crescita urbana, Città e uso del territorio. Riv. Giuridica Del Mezzog. 2018, 32, 1195–1202. [Google Scholar]
- Wehrwein, G.S. The rural-urban fringe. Econ. Geogr. 1942, 18, 217–228. [Google Scholar] [CrossRef]
- Biasi, R.; Colantoni, A.; Ferrara, C.; Ranalli, F.; Salvati, L. In-between sprawl and fires: Long-term forest expansion and settlement dynamics at the wildland–urban interface in Rome, Italy. Int. J. Sustain. Dev. World Ecol. 2015, 22, 467–475. [Google Scholar] [CrossRef]
- Ferrara, A.; Salvati, L.; Sabbi, A.; Colantoni, A. Soil resources, land cover changes and rural areas: Towards a spatial mismatch? Sci. Total Environ. 2014, 478, 116–122. [Google Scholar] [CrossRef]
- Parés, M.; March, H.; Saurí, D. Atlantic gardens in Mediterranean climates: Understanding the production of suburban natures in Barcelona. Int. J. Urban Reg. Res. 2013, 37, 328–347. [Google Scholar] [CrossRef]
- Chorianopoulos, I.; Pagonis, T.; Koukoulas, S.; Drymoniti, S. Planning, Competitiveness and Sprawl in the Mediterranean City: The Case of Athens. Cities 2010, 27, 249–259. [Google Scholar] [CrossRef]
- Costa, F. Urban planning in Rome from 1870 to the First World War. Geojournal 1991, 24, 269–276. [Google Scholar] [CrossRef]
- Salvati, L.; Sateriano, A.; Grigoriadis, E. Crisis and the city: Profiling urban growth under economic expansion and stagnation. Lett. Spat. Resour. Sci. 2016, 9, 329–342. [Google Scholar] [CrossRef]
- Salvati, L. The dark side of the crisis: Disparities in per-capita income (2000–2012) and the urban-rural gradient in Greece. Tijdschr. Voor Econ. Soc. Geogr. 2016, 107, 628–641. [Google Scholar] [CrossRef]
- Di Feliciantonio, C.; Salvati, L. ‘Southern’ Alternatives of Urban Diffusion: Investigating Settlement Characteristics and Socio-Economic Patterns in Three Mediterranean Regions. Tijdschr. Voor Econ. Soc. Geogr. 2015, 106, 453–470. [Google Scholar] [CrossRef]
- Morelli, G.V.; Rontos, K.; Salvati, L. Between suburbanisation and re-urbanisation? Revisiting the Urban Life Cycle in a Mediterranean Compact City. Urban Res. Pract. 2014, 7, 74–88. [Google Scholar] [CrossRef]
- Rontos, K.; Grigoriadis, E.; Sateriano, A.; Syrmali, M.; Vavouras, I.; Salvati, L. Lost in protest, found in segregation: Divided cities in the light of the 2015 “Oχι” referendum in Greece. City Cult. Soc. 2016, 7, 139–148. [Google Scholar] [CrossRef]
- Lekakis, J.N.; Kousis, M. Economic Crisis, Troika and the Environment in Greece. South Eur. Soc. Politics 2013, 18, 305–331. [Google Scholar] [CrossRef]
- Salvati, L.; Ranalli, F. ‘Land of Fires’: Urban Growth, Economic Crisis, and Forest Fires in Attica, Greece: Mediterranean Fires and Urban Growth. Geogr. Res. 2015, 53, 68–80. [Google Scholar] [CrossRef]
- Zambon, I.; Serra, P.; Sauri, D.; Carlucci, M.; Salvati, L. Beyond the ‘Mediterranean city’: Socioeconomic disparities and urban sprawl in three Southern European cities. Geogr. Ann. Ser. B Hum. Geogr. 2017, 99, 319–337. [Google Scholar] [CrossRef]
- Jat, M.K.; Garg, P.K.; Khare, D. Monitoring and Modelling of Urban Sprawl Using Remote Sensing and GIS Techniques. Int. J. Appl. Earth Obs. Geoinf. 2008, 10, 26–43. [Google Scholar] [CrossRef]
- De Fioravante, P.; Strollo, A.; Assennato, F.; Marinosci, I.; Congedo, L.; Munafò, M. High Resolution Land Cover Integrating Copernicus Products: A 2012–2020 Map of Italy. Land 2021, 11, 35. [Google Scholar] [CrossRef]
- De Fioravante, P.; Strollo, A.; Cavalli, A.; Cimini, A.; Smiraglia, D.; Assennato, F.; Munafò, M. Ecosystem Mapping and Accounting in Italy Based on Copernicus and National Data through Integration of EAGLE and SEEA-EA Frameworks. Land 2023, 12, 286. [Google Scholar] [CrossRef]
- European Environment Agency. Mapping Guide for a European Urban Atlas; EEA: Copenhagen, Denmark; Luxembourg, 2011. [Google Scholar]
- European Commission; Joint Research Centre. Mapping Population Density in Functional Urban Areas: A Method to Downscale Population Statistics to Urban Atlas Polygons; European Commission: Luxembourg, 2016.
- De Boor, C. A Practical Guide to Splines; Springer: Berlin, Germany, 2001. [Google Scholar]
- Ciommi, M.; Chelli, F.; Carlucci, M.; Salvati, L. Urban Growth and Demographic Dynamics in Southern Europe: Toward a New Statistical Approach to Regional Science. Sustainability 2018, 10, 2765. [Google Scholar] [CrossRef]
- Ciommi, M.; Chelli, F.M.; Salvati, L. Integrating Parametric and Non-Parametric Multivariate Analysis of Urban Growth and Commuting Patterns in a European Metropolitan Area. Qual Quant 2019, 53, 957–979. [Google Scholar] [CrossRef]
- Salvati, L.; Zitti, M. Land degradation in the Mediterranean basin: Linking bio-physical and economic factors into an ecological perspective. Biota 2005, 5, 67–77. [Google Scholar]
- Frenkel, A.; Ashkenazi, M. The integrated sprawl index: Measuring the urban landscape in Israel. Ann. Reg. Sci. 2007, 42, 99–121. [Google Scholar] [CrossRef]
- Frenkel, A.; Ashkenazi, M. Measuring Urban Sprawl: How can We Deal with It? Environ. Plan. B 2008, 35, 56–79. [Google Scholar] [CrossRef]
- Scott, A.J.; Storper, M. The nature of cities: The scope and limits of urban theory. Int. J. Urban Reg. Res. 2015, 39, 1–15. [Google Scholar] [CrossRef]
- Schneider, A.; Woodcock, C.E. Compact, dispersed, fragmented, extensive? A comparison of urban growth in twenty-five global cities using remotely sensed data, pattern metrics and census information. Urban Stud. 2008, 45, 659–692. [Google Scholar] [CrossRef]
- Strollo, A.; Smiraglia, D.; Bruno, R.; Assennato, F.; Congedo, L.; De Fioravante, P.; Giuliani, C.; Marinosci, I.; Riitano, N.; Munafò, M. Land Consumption in Italy. J. Maps 2020, 16, 113–123. [Google Scholar] [CrossRef]
- Tombolini, I.; Munafò, M.; Salvati, L. Soil Sealing Footprint as an Indicator of Dispersed Urban Growth: A Multivariate Statistics Approach. Urban Res. Pract. 2016, 9, 1–15. [Google Scholar] [CrossRef]
- Wu, Q.; Li, H.; Wang, R.; Paulussen, J.; He, Y.; Wang, M.; Wang, B.; Wang, Z. Monitoring and Predicting Land Use Change in Beijing Using Remote Sensing and GIS. Landsc. Urban Plan. 2006, 78, 322–333. [Google Scholar] [CrossRef]
- Yılmaz, M.; Terzi, F. Measuring the Patterns of Urban Spatial Growth of Coastal Cities in Developing Countries by Geospatial Metrics. Land Use Policy 2021, 107, 105487. [Google Scholar] [CrossRef]
- Martinez-Fernandez, C.; Audirac, I.; Fol, S. Cunningham-Sabot, E. Shrinking cities: Urban challenges of globalization. Int. J. Urban Reg. Res. 2012, 36, 213–225. [Google Scholar] [CrossRef] [PubMed]
- Robinson, J. Cities in a world of cities: The comparative gesture. Int. J. Urban Reg. Res. 2017, 35, 1–23. [Google Scholar] [CrossRef]
- Seto, K.C.; Sánchez-Rodríguez, R.; Fragkias, M. The new geography of contemporary urbanization and the environment. Annu. Rev. Environ. Resour. 2010, 35, 167–194. [Google Scholar] [CrossRef]
- Moroni, S.; Minola, L. Unnatural sprawl: Reconsidering public responsibility for suburban development in Italy, and the desirability and possibility of changing the rules of the game. Land Use Policy 2019, 86, 104–112. [Google Scholar] [CrossRef]
- Morote, Á.F.; Hernández, M. Urban sprawl and its effects on water demand: A case study of Alicante, Spain. Land Use Policy 2016, 50, 352–362. [Google Scholar] [CrossRef]
- Shaw, B.J.; van Vliet, J.; Verburg, P.H. The Peri-Urbanization of Europe: A Systematic Review of a Multifaceted Process. Landsc. Urban Plan. 2020, 196, 103733. [Google Scholar] [CrossRef]
- Veneri, P.; Burgalassi, D. Questioning polycentric development and its effects. Issues of definition and measurement for the Italian NUTS-2 regions. Eur. Plan. Stud. 2012, 20, 1017–1037. [Google Scholar] [CrossRef]
- Kabisch, N.; Haase, D. Diversifying European agglomerations: Evidence of urban population trends for the 21st century. Popul. Space Place 2011, 17, 236–253. [Google Scholar] [CrossRef]
- Modica, G.; Vizzari, M.; Pollino, M.; Fichera, C.R.; Zoccali, P.; Di Fazio, S. Spatio-temporal analysis of the urban–rural gradient structure: An application in a Mediterranean mountainous landscape. Earth Syst. Dyn. 2012, 3, 263–279. [Google Scholar] [CrossRef]
- Dierwechter, Y. Metropolitan geographies of US climate action: Cities, suburbs, and the local divide in global responsibilities. J. Environ. Policy Plan. 2010, 12, 59–82. [Google Scholar] [CrossRef]
- Salvati, L.; Smiraglia, D.; Bajocco, S.; Munafò, M. Land Use Changes in Two Mediterranean Coastal Regions: Do Urban Areas Matter? World Acad. Sci. Eng. Technol. Int. J. Environ. Ecol. Eng. 2014, 8, 9. [Google Scholar]
- Lambin, E.F.; Meyfroidt, P. Land Use Transitions: Socio-Ecological Feedback versus Socio-Economic Change. Land Use Policy 2010, 27, 108–118. [Google Scholar] [CrossRef]
- Rauhut, D. Polycentricity–one concept or many? Eur. Plan. Stud. 2017, 25, 332–348. [Google Scholar] [CrossRef]
- Schmitt, P. Planning for polycentricity in European metropolitan areas—Challenges, expectations and practices. Plan. Pract. Res. 2013, 28, 400–419. [Google Scholar] [CrossRef]
- López-Gay, A.; Salvati, L. Polycentric Development and Local Fertility in Metropolitan Regions: An Empirical Analysis for Barcelona, Spain. Popul. Space Place 2021, 27, e2402. [Google Scholar] [CrossRef]
- Lanfredi, M.; Egidi, G.; Bianchini, L.; Salvati, L. One size does not fit all: A tale of polycentric development and land degradation in Italy. Ecol. Econ. 2022, 192, 107256. [Google Scholar] [CrossRef]
- Zambon, I.; Colantoni, A.; Salvati, L. Horizontal vs. vertical growth: Understanding latent patterns of urban expansion in large metropolitan regions. Sci. Total Environ. 2019, 654, 778–785. [Google Scholar] [CrossRef] [PubMed]
- Zambon, I.; Salvati, L. Metropolitan growth, urban cycles and housing in a Mediterranean country, 1910s–2010s. Cities 2019, 95, 102412. [Google Scholar] [CrossRef]
- Vinci, S.; Vardopoulos, I.; Salvati, L. A Tale of a Shrinking City? Exploring the Complex Interplay of Socio-Demographic Dynamics in the Recent Development of Attica, Greece. Cities 2023, 132, 104089. [Google Scholar] [CrossRef]
- Egidi, G.; Salvati, L.; Vinci, S. The long way to tipperary: City size and worldwide urban population trends, 1950–2030. Sustain. Cities Soc. 2020, 60, 102148. [Google Scholar] [CrossRef]
- Recanatesi, F.; Clemente, M.; Grigoriadis, E.; Ranalli, F.; Zitti, M.; Salvati, L. A fifty-year sustainability assessment of Italian agro-forest districts. Sustainability 2016, 8, 32. [Google Scholar] [CrossRef]
- Delfanti, L.; Colantoni, A.; Recanatesi, F.; Bencardino, M.; Sateriano, A.; Zambon, I.; Salvati, L. Solar plants, environmental degradation and local socioeconomic contexts: A case study in a Mediterranean country. Environ. Impact Assess. Rev. 2016, 61, 88–93. [Google Scholar] [CrossRef]
- Salvia, R.; Halbac-Cotoara-Zamfir, R.; Cividino, S.; Salvati, L.; Quaranta, G. From Rural Spaces to Peri-Urban Districts: Metropolitan Growth, Sparse Settlements and Demographic Dynamics in a Mediterranean Region. Land 2020, 9, 200. [Google Scholar] [CrossRef]


| Class | Mean Area (ha) | Coeff. Variation | Edge Density | Total Area (km2) | Area Share (%) | Popul. Density | Popul. Share (%) |
|---|---|---|---|---|---|---|---|
| 110 | 0.38 | 0.69 | 0.013 | 109 | 3.51 | 21,258 | 62.8 |
| 1121 | 0.64 | 0.88 | 0.016 | 125 | 4.05 | 7327 | 24.9 |
| 1122 | 0.85 | 0.97 | 0.017 | 96 | 3.10 | 2845 | 7.4 |
| 1123 | 1.01 | 1.00 | 0.018 | 76 | 2.44 | 1474 | 3.0 |
| 1124 | 0.80 | 1.04 | 0.017 | 13 | 0.43 | 1040 | 0.4 |
| 1130 | 0.47 | 0.54 | 0.015 | 22 | 0.70 | 402 | 0.2 |
| 1210 | 1.68 | 2.46 | 0.022 | 128 | 4.14 | 274 | 1.0 |
| 1221 | 8.41 | 2.04 | 0.019 | 7 | 0.22 | 0 | 0.0 |
| 1222 | 158.7 | 8.84 | 0.004 | 141 | 4.56 | 0 | 0.0 |
| 1223 | 9.93 | 1.50 | 0.013 | 4 | 0.13 | 0 | 0.0 |
| 1230 | 13.15 | 2.55 | 0.034 | 12 | 0.40 | 71 | 0.0 |
| 1240 | 199.4 | 1.61 | 0.145 | 20 | 0.64 | 0 | 0.0 |
| 1310 | 4.98 | 3.00 | 0.031 | 18 | 0.58 | 2 | 0.0 |
| 1330 | 1.07 | 1.50 | 0.017 | 2 | 0.05 | 0 | 0.0 |
| 1340 | 0.71 | 3.18 | 0.015 | 10 | 0.32 | 4 | 0.0 |
| 1410 | 1.74 | 2.94 | 0.020 | 30 | 0.97 | 0 | 0.0 |
| 1420 | 2.80 | 3.35 | 0.026 | 20 | 0.64 | 184 | 0.1 |
| 2100 | 9.13 | 2.46 | 0.038 | 37 | 1.18 | 1 | 0.0 |
| 2200 | 5.16 | 1.95 | 0.031 | 62 | 2.02 | 24 | 0.0 |
| 2300 | 4.50 | 1.75 | 0.031 | 152 | 4.91 | 30 | 0.1 |
| 2400 | 5.95 | 2.22 | 0.032 | 281 | 9.08 | 0 | 0.0 |
| 3100 | 16.34 | 3.38 | 0.043 | 295 | 9.51 | 0 | 0.0 |
| 3200 | 18.04 | 7.38 | 0.031 | 1303 | 42.1 | 0 | 0.0 |
| 3300 | 5.49 | 4.15 | 0.028 | 58 | 1.88 | 0 | 0.0 |
| 4000 | 25.80 | 1.39 | 0.066 | 5 | 0.17 | 0 | 0.0 |
| 5000 | 127.1 | 4.69 | 0.038 | 71 | 2.30 | 0 | 0.0 |
| Class | Mean Area (ha) | Coeff. Variation | Edge Density | Total Area (km2) | Area Share (%) | Popul. Density | Popul. Share (%) |
|---|---|---|---|---|---|---|---|
| 1110 | 0.38 | 0.69 | 0.013 | 109 | 3.51 | 21,572 | 61.9 |
| 1121 | 0.64 | 0.88 | 0.016 | 125 | 4.05 | 7573 | 25.1 |
| 1122 | 0.85 | 0.97 | 0.017 | 96 | 3.10 | 2926 | 7.4 |
| 1123 | 1.02 | 1.00 | 0.018 | 76 | 2.45 | 1438 | 2.9 |
| 1124 | 0.81 | 1.13 | 0.017 | 13 | 0.43 | 834 | 0.3 |
| 1130 | 0.47 | 0.54 | 0.015 | 22 | 0.70 | 403 | 0.2 |
| 1210 | 1.67 | 2.44 | 0.022 | 132 | 4.26 | 407 | 1.4 |
| 1221 | 8.41 | 2.04 | 0.019 | 7 | 0.22 | 0 | 0.0 |
| 1222 | 155.5 | 8.95 | 0.004 | 142 | 4.57 | 0 | 0.0 |
| 1223 | 9.44 | 1.57 | 0.012 | 4 | 0.14 | 0 | 0.0 |
| 1230 | 13.44 | 2.63 | 0.034 | 13 | 0.41 | 558 | 0.2 |
| 1240 | 181.3 | 1.72 | 0.134 | 20 | 0.64 | 0 | 0.0 |
| 1310 | 5.21 | 3.00 | 0.031 | 18 | 0.57 | 0 | 0.0 |
| 1330 | 1.36 | 1.25 | 0.023 | 0 | 0.01 | 0 | 0.0 |
| 1340 | 0.68 | 3.17 | 0.015 | 10 | 0.31 | 0 | 0.0 |
| 1410 | 1.74 | 2.94 | 0.020 | 30 | 0.97 | 0 | 0.0 |
| 1420 | 2.83 | 3.34 | 0.026 | 20 | 0.65 | 365 | 0.2 |
| 2100 | 8.62 | 2.52 | 0.036 | 36 | 1.15 | 106 | 0.1 |
| 2200 | 5.15 | 1.95 | 0.031 | 62 | 2.01 | 62 | 0.1 |
| 2300 | 4.47 | 1.75 | 0.030 | 151 | 4.87 | 53 | 0.2 |
| 2400 | 5.93 | 2.23 | 0.031 | 281 | 9.05 | 0 | 0.0 |
| 3100 | 16.34 | 3.38 | 0.043 | 295 | 9.51 | 0 | 0.0 |
| 3200 | 18.01 | 7.39 | 0.031 | 1303 | 42.0 | 0 | 0.0 |
| 3300 | 5.49 | 4.15 | 0.028 | 58 | 1.89 | 0 | 0.0 |
| 4000 | 25.80 | 1.39 | 0.066 | 5 | 0.17 | 0 | 0.0 |
| 5000 | 126.7 | 4.68 | 0.038 | 71 | 2.29 | 0 | 0.0 |
| Class | Mean Area (ha) | Coeff. Variation | Edge Density | Total Area (km2) | Area Share (%) | Popul. Density | Popul. Share (%) |
|---|---|---|---|---|---|---|---|
| 1110 | 0.0 | 0.0 | 0.0 | 0.0 | 0.0 | 314.4 | −0.9 |
| 1121 | 0.0 | 0.0 | 0.0 | 0.0 | 0.0 | 245.8 | 0.1 |
| 1122 | 0.0 | 0.0 | 0.0 | 0.2 | 0.0 | 81.6 | 0.0 |
| 1123 | 0.0 | 0.0 | 0.0 | 0.4 | 0.0 | −35.9 | −0.1 |
| 1124 | 0.0 | 0.1 | 0.0 | 0.1 | 0.0 | −205.7 | −0.1 |
| 1130 | 0.0 | 0.0 | 0.0 | 0.1 | 0.0 | 0.5 | 0.0 |
| 1210 | 0.0 | 0.0 | 0.0 | 3.8 | 0.1 | 132.4 | 0.5 |
| 1221 | 0.0 | 0.0 | 0.0 | 0.0 | 0.0 | 0.0 | 0.0 |
| 1222 | −3.2 | 0.1 | 0.0 | 0.3 | 0.0 | 0.0 | 0.0 |
| 1223 | −0.5 | 0.1 | 0.0 | 0.3 | 0.0 | 0.0 | 0.0 |
| 1230 | 0.3 | 0.1 | 0.0 | 0.3 | 0.0 | 487.1 | 0.2 |
| 1240 | −18.0 | 0.1 | 0.0 | 0.0 | 0.0 | 0.0 | 0.0 |
| 1310 | 0.2 | 0.0 | 0.0 | −0.3 | 0.0 | −1.8 | 0.0 |
| 1330 | 0.3 | −0.2 | 0.0 | −1.3 | 0.0 | 0.0 | 0.0 |
| 1340 | 0.0 | 0.0 | 0.0 | −0.4 | 0.0 | −4.4 | 0.0 |
| 1410 | 0.0 | 0.0 | 0.0 | 0.0 | 0.0 | 0.0 | 0.0 |
| 1420 | 0.0 | 0.0 | 0.0 | 0.3 | 0.0 | 181.2 | 0.1 |
| 2100 | −0.5 | 0.1 | 0.0 | −0.9 | 0.0 | 104.9 | 0.1 |
| 2200 | 0.0 | 0.0 | 0.0 | −0.2 | 0.0 | 38.2 | 0.1 |
| 2300 | 0.0 | 0.0 | 0.0 | −1.0 | 0.0 | 22.7 | 0.1 |
| 2400 | 0.0 | 0.0 | 0.0 | −0.9 | 0.0 | 0.0 | 0.0 |
| 3100 | 0.0 | 0.0 | 0.0 | 0.0 | 0.0 | 0.0 | 0.0 |
| 3200 | 0.0 | 0.0 | 0.0 | −0.5 | 0.0 | 0.0 | 0.0 |
| 3300 | 0.0 | 0.0 | 0.0 | 0.1 | 0.0 | 0.0 | 0.0 |
| 4000 | 0.0 | 0.0 | 0.0 | 0.0 | 0.0 | 0.0 | 0.0 |
| 5000 | −0.4 | 0.0 | 0.0 | −0.2 | 0.0 | 0.0 | 0.0 |
| Variable | Axis 1 | Axis 2 | Overall |
|---|---|---|---|
| Area | −0.16 | −3.43 | 0.03 |
| Area(SD) | 0.36 | −0.30 | 0.02 |
| ED | −0.17 | 3.44 | 0.08 |
| %Area | 0.93 | −0.17 | 0.01 |
| %Pop | −0.09 | −1.36 | 0.03 |
| Density | −0.59 | −5.52 | 0.05 |
| Land use class (nomenclature code explained in Section 2.2) | |||
| 1110 | −0.3 | −1.4 | 0.17 |
| 1121 | −0.3 | −1.1 | 0.07 |
| 1122 | −0.6 | −1.7 | 0.06 |
| 1123 | −0.8 | −0.8 | 0.07 |
| 1124 | −1.1 | −0.6 | 0.09 |
| 1130 | −0.5 | −2.2 | 0.07 |
| 1210 | 0.2 | −5.9 | 0.04 |
| 1221 | 0.1 | −2.6 | 0.07 |
| 1222 | 0.3 | 0.2 | 0.06 |
| 1223 | −1.5 | −4.8 | 0.12 |
| 1230 | −30.9 | −0.3 | 0.23 |
| 1240 | −0.2 | 4.1 | 0.33 |
| 1310 | 6.7 | −0.3 | 0.12 |
| 1330 | −8.5 | −0.6 | 0.16 |
| 1340 | −4.9 | −2.0 | 0.21 |
| 1410 | 0.1 | −2.8 | 0.09 |
| 1420 | 1.1 | −0.7 | 0.04 |
| 2100 | −16.3 | −3.7 | 0.69 |
| 2200 | 28.9 | −0.5 | 0.10 |
| 2300 | 8.6 | −1.4 | 0.05 |
| 2400 | 0.3 | −279 | 0.04 |
| 3100 | 0.6 | −20.5 | 0.06 |
| 3200 | 0.7 | −0.1 | 0.07 |
| 3300 | 0.5 | −1.5 | 0.04 |
| 4000 | 0.7 | 2.3 | 0.15 |
| 5000 | 0.4 | −1.5 | 0.09 |
Disclaimer/Publisher’s Note: The statements, opinions and data contained in all publications are solely those of the individual author(s) and contributor(s) and not of MDPI and/or the editor(s). MDPI and/or the editor(s) disclaim responsibility for any injury to people or property resulting from any ideas, methods, instructions or products referred to in the content. |
© 2023 by the authors. Licensee MDPI, Basel, Switzerland. This article is an open access article distributed under the terms and conditions of the Creative Commons Attribution (CC BY) license (https://creativecommons.org/licenses/by/4.0/).
Share and Cite
D’Agata, A.; Quaranta, G.; Salvia, R.; Carlucci, M.; Salvati, L. Mixed Land Use as an Intrinsic Feature of Sprawl: A Short-Term Analysis of Settlement Growth and Population Distribution Using European Urban Atlas. Land 2023, 12, 972. https://doi.org/10.3390/land12050972
D’Agata A, Quaranta G, Salvia R, Carlucci M, Salvati L. Mixed Land Use as an Intrinsic Feature of Sprawl: A Short-Term Analysis of Settlement Growth and Population Distribution Using European Urban Atlas. Land. 2023; 12(5):972. https://doi.org/10.3390/land12050972
Chicago/Turabian StyleD’Agata, Alessia, Giovanni Quaranta, Rosanna Salvia, Margherita Carlucci, and Luca Salvati. 2023. "Mixed Land Use as an Intrinsic Feature of Sprawl: A Short-Term Analysis of Settlement Growth and Population Distribution Using European Urban Atlas" Land 12, no. 5: 972. https://doi.org/10.3390/land12050972
APA StyleD’Agata, A., Quaranta, G., Salvia, R., Carlucci, M., & Salvati, L. (2023). Mixed Land Use as an Intrinsic Feature of Sprawl: A Short-Term Analysis of Settlement Growth and Population Distribution Using European Urban Atlas. Land, 12(5), 972. https://doi.org/10.3390/land12050972